
Abstract
Wind power ramp events (WPREs) are small probability events with serious wind power fluctuations, and it is one of the important factors leading to security accidents in the power grid. Firstly, given the small-sample nature of WPREs, this paper introduces an Interval-SMOTE oversampling method to increase the data points for ramp events; the generated points are confined within a dynamically adjusted interval that evolves with each iteration, thereby ensuring the maximum preservation of the original data trends. Then, in order to improve the detection efficiency of WPREs, an integration of Swinging Door Trending (SDT) algorithm is proposed to accurately identify the existing ramp events and non-ramp events in the original wind power sequence. Moreover, considering different types of WPREs, two different modeling methods of Stochastic Configuration Networks (SCNs) and Bidirectional Long Short-term Memory (BiLSTM) are employed to handle this problem. Due to the stochastic configuration and supervised mechanism of key parameters, SCNs can provide significant advantages in handling large samples, so it is applied to build the model of non-ramp events; as the unique structures of bidirectional processing of information, the BiLSTM has better ability in mining small sample information, so BiLSTM is applied to build the model of ramp events. The prediction results from the two models are then weighted to obtain the final results. Experimental results demonstrate that the proposed sampling method enhances accuracy metrics by 0.43% and 3.72% in different wind farms; specifically, regarding prediction accuracy as measured by RMSE, the proposed SCNs-BiLSTM model outperforms comparative models by 3.88% and 15.49% across various wind farms.
Keywords
Introduction
With the development of the global wind power industry, the development of wind energy has been highly valued around the world. However, during the process of wind power output in wind farms, the strong inherent volatility of wind energy can lead to dramatic fluctuations within short time intervals. These events are referred to as wind power ramp events (WPREs) (Bossavy et al. (2013)). These events are one of the important factors leading to grid security accidents, and also a major factor affecting the accuracy of wind power prediction (Gao and Liu (2021)). Therefore, accurately identifying ramp events is of great significances. Currently, there are mainly two prediction methods for WPREs: indirect prediction method and direct prediction method (Zhang et al. (2017)).
The indirect prediction method is based on wind power prediction, where potential ramp events are detected and identified from the forecasted power data (Gallego-Castillo et al. (2015)). The direct prediction method is based on a large amount of historical ramp data, the correlation between ramp event features from historical data is found, and a mapping relationship between them is established. Different from the indirect prediction method, it does not need wind power data and can avoid the error of ramp identification due to the inaccuracy of prediction results. Qiao et al. (Qiao et al. (2022)) proposed a method for ramp feature classification based on an improved SDT algorithm and an interval evaluation method for wind power prediction errors using a cloud model; this method improved the poor adaptability of traditional interval evaluation methods when low-probability WPREs occurred. Zhang et al. (Zhang et al. (2020)) proposed a WPREs detection method combining SDT and trend labeling; this method reduced the impact of wind power fluctuations and improved prediction accuracy by introducing a trend labeling-based ramp detection approach. Lyners et al. (Lyners et al. (2021)) proposed a novel multi-parameter segmentation algorithm for detecting WPREs in wind farms; this algorithm accurately detected ramp events in large amounts of origin data, and determined the start and end points of these ramp events. Therefore, this paper uses direct prediction method to identify WPREs in the historical data, avoiding interference from other irrelevant factors to the accuracy of ramp events identification.
Due to WPREs being low-probability occurrences, this can reduce the predictive performance of models for small samples. It can be considered as rare and abnormal events, and the data-based anomaly detection methods could be useful in this context, for example, Harrou et al. ((Harrou et al. (2023))) introduced an anomaly detection method utilizing SCADA data to enhance the precision of fault detection. However, a more efficient way is to process sample data by sampling. Therefore, researchers proposed many data sampling methods to balance the distribution of sample quantities across different categories, aiming to improve model performance and increase prediction accuracy (Fernández et al. (2011)). Generally, these methods can be divided into undersampling and oversampling. The common undersampling methods aimed to enhance the classification accuracy of small samples by randomly reducing large samples (Leevy et al. (2023)). However, blindly removed non-ramp samples may adversely affect subsequent predictions in the context of this study. Therefore, this study primarily focuses on oversampling methods. Two common oversampling methods included Random Over Sampling (ROS) (Zhang and Chen (2019)) and Synthetic Minority Oversampling Technique (SMOTE) (Fujimoto et al. (2018)). The ROS method increased the quantity of small samples by duplicating them, but its accuracy was insufficient to meet requirements. Although the SMOTE method outperformed ROS in performance, selecting a large value for k might lead to generated samples overlapping with samples from other classes, thus reducing the classification performance. To address this issue, many experts proposed improvements to the SMOTE method. SMOTEFUNA (Tarawneh et al. (2020)) generated new synthetic samples using the farthest neighbor principle, with the advantage of avoiding overfitting issues without the need to adjust parameters (such as k in the SMOTE method). Random-SMOTE (Khaled et al. (2023)) achieved the functionality of randomly generating new samples by composing triangles around small samples and interpolating within their range. Centroid-SMOTE (Qin et al. (2022)) elected “seed samples” to form triangles after determining the number of clusters of small samples, and randomly generated new samples between vertex samples and their centroids, thereby limiting the area of sample generation through centroid method. LOS-EBOS (Ren et al. (2023)) stratified the data and balanced the data using both undersampling and oversampling methods, based on the quantity of samples in each layer to improve sampling efficiency. But in our work, the above method cannot keep the original data change trend in the generated sample, resulting in the generated data cannot help us make a better prediction. So in this paper, an Interval-SMOTE method is designed to solve this problem. After finding suitable methods to address the small sample, the next step is to predict different categories of samples using models. Some researchers have proposed prediction methods based on neural network models such as Auto-encoders (Harrou et al. (2024)), Convolutional Neural Networks (CNNs) (Han et al. (2020), Xiong et al. (2022)), Gate Recurrent Unit (GRU) (Sheng et al. (2023)), Stochastic Configuration Networks (SCNs) (Huang et al. (2021)), Long Short-term Memory (LSTM) (Cui et al. (2023)), Bidirectional Gated Recurrent Unit (BiGRU) (Yu et al. (2023)), Bidirectional Long Short-term Memory (BiLSTM) (Wang et al. (2024)), Attention-Long Short-term Memory (Attention-LSTM) (Chen et al. (2023)), Random Forest (RF) (Natarajan and Kumari (2020)), eXtreme Gradient Boosting (XGBoost) (Guan et al. (2023)), and Light Gradient Boosting Machine (LightGBM) (Cao and Gui (2018)), etc.; and some others improved loss functions, incorporated data fusion algorithms, or introduced new prediction models to enhance prediction accuracy (Hu et al. (2021), Guo et al. (2022)).
As the number of ramp events of wind power are much smaller than the number of non-ramp events, this paper puts forward using Interval-SMOTE oversampling to expand the sample of WPREs. In the subsequent prediction, since the SCNs model has stochastic configuration and supervised mechanism of key model parameters, which enables the model to better capture the complex relationship of input data when processing a large number of data, so this paper uses it to predict large samples. In the case of a small sample size, BiLSTM model can use its ability to process bidirectional information to alleviate the overfitting problem that may exist in ordinary LSTM, so it can focus on small-sample events, and it is used to predict small samples. Through the running in parallel of SCNs and BiLSTM models, the advantages of them can be combined to make the prediction results more accurate.
Current research on WPREs predominantly centers on identifying these events in historical wind power data or treating them as outliers for removal. However, limited studies integrate ramp event detection with wind power prediction, and even fewer investigate methods for handling small-sample ramp events within wind power prediction models to develop novel predictive approaches. This paper conducts an in-depth investigation into this issue. Main contributions of this paper are as follows: (i) A WPREs recognition method based on the SDT algorithm combining with ramp events definition is proposed. After acquiring the original wind power data, the SDT algorithm is employed to compress the extensive dataset while preserving its inherent characteristics and eliminating redundant information. A novel composite method is developed by integrating existing definitions of ramps from current research, enabling the identification of ramp events and determination of ramp directions within the compressed data. The integration of the SDT algorithm with the ramp definition approach not only removes extraneous information but also accurately detects WPREs in historical wind power data. (ii) A method based on Interval-SMOTE oversampling is proposed to augment the ramp event points identified by the SDT algorithm in conjunction with the aforementioned ramp definition approach. The generation of new points is constrained within an interval that matches the original data at each iteration. This method expands the number of ramp event samples while preserving the original data’s change trend. (iii) The BiLSTM model and SCNs model are employed to predict the oversampled ramp data and non-ramp data, respectively. The prediction results from both models are integrated to obtain the final prediction outcomes. This approach enhances the adaptability to small-sample events and improves the model’s generalization ability while ensuring prediction accuracy, thereby providing a more refined solution for wind power prediction.
The rest of this study is as follows: Section 2 provides a brief introduction to the definition of WPREs, the principles of the SDT algorithm, as well as the SCNs model and BiLSTM model; Section 3 proposes an Interval-SMOTE oversampling method for the problem of small sample size of ramp events and introduces the principle of this method; Section 4 outlines the overall research approach of the paper; Section 5 designs comparative experiments to validate the superiority of the proposed method; Section 6 concludes the work of this paper.
Preliminaries
Improved definition of WPREs
WPREs often refer to significant changes in power over a short period, which may lead to power imbalances. Based on existing research, for a predetermined threshold P ɛ , when the magnitude change of it exceeds approximately 15% to 20% of the total installed capacity, it is identified as WPREs (Kuang et al. (2020)).
The existing methods for identifying WPREs possess both merits and demerits. Although some methods are simple, convenient and easy to use, they do not take into account changes in wind power during the time period, which may lead to under-reporting. Others consider the change process of wind power amplitude in the selected time period, reducing the false report rate of WPREs recognition, but cannot distinguish the specific direction of the ramp events. In order to overcome this limitation, based on the existing methods, this paper proposes a new method for determining WPREs. By comprehensively utilizing the advantages of different definitions, it is redefined as:
It is assumed that the width of the ramp time window is Δt, the ramp event threshold is P
ɛ
, and the starting and ending values of the wind-electric power in the extraction period are
Swinging Door Trending algorithm
SDT is a trend-based data compression algorithm proposed by Bristol in 1990 (Bristol (1990)). In essence, the SDT algorithm compresses large amounts of data into fewer data points while preserving the original characteristics. The schematic diagram is illustrated in Figure 1. Swing Door Trending.
In Figure 1, we assume the original data consists of ten points labeled from a to j. In the figure, point “a” represents the first compressed data point. There are “doors” of width ΔE above and below point “a”. ΔE is the only adjustable parameter in the SDT algorithm. When there is only one data point “a,” the swinging door closes. When the next data point “b” is read, the door opens, giving two doors “
Let
Initializes the slopes of the upper and lower swinging doors, that is,
Next, in the time series T, the slopes of the upper and lower swinging doors are calculated as follows:

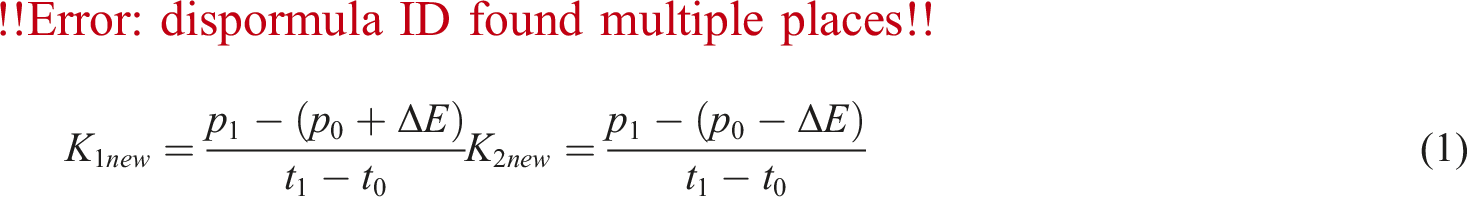
Calculate and update the slopes of the upper and lower swinging doors to get:

Finally, compare the slope of the upper swinging door K 1new and the slope of the lower swinging door K 2new to determine the data to be stored. If K 1new ≥ K 2new is satisfied, the point at time ti−1 is stored, otherwise the data will continue to be compressed.
Stochastic Configuration Networks
Wang et al. (Wang and Li (2017)) proposed Stochastic Configuration Networks (SCNs) in 2017, which have been widely used in various engineering problems. The structure of SCNs is shown in Figure 2. Structure diagram of SCNs.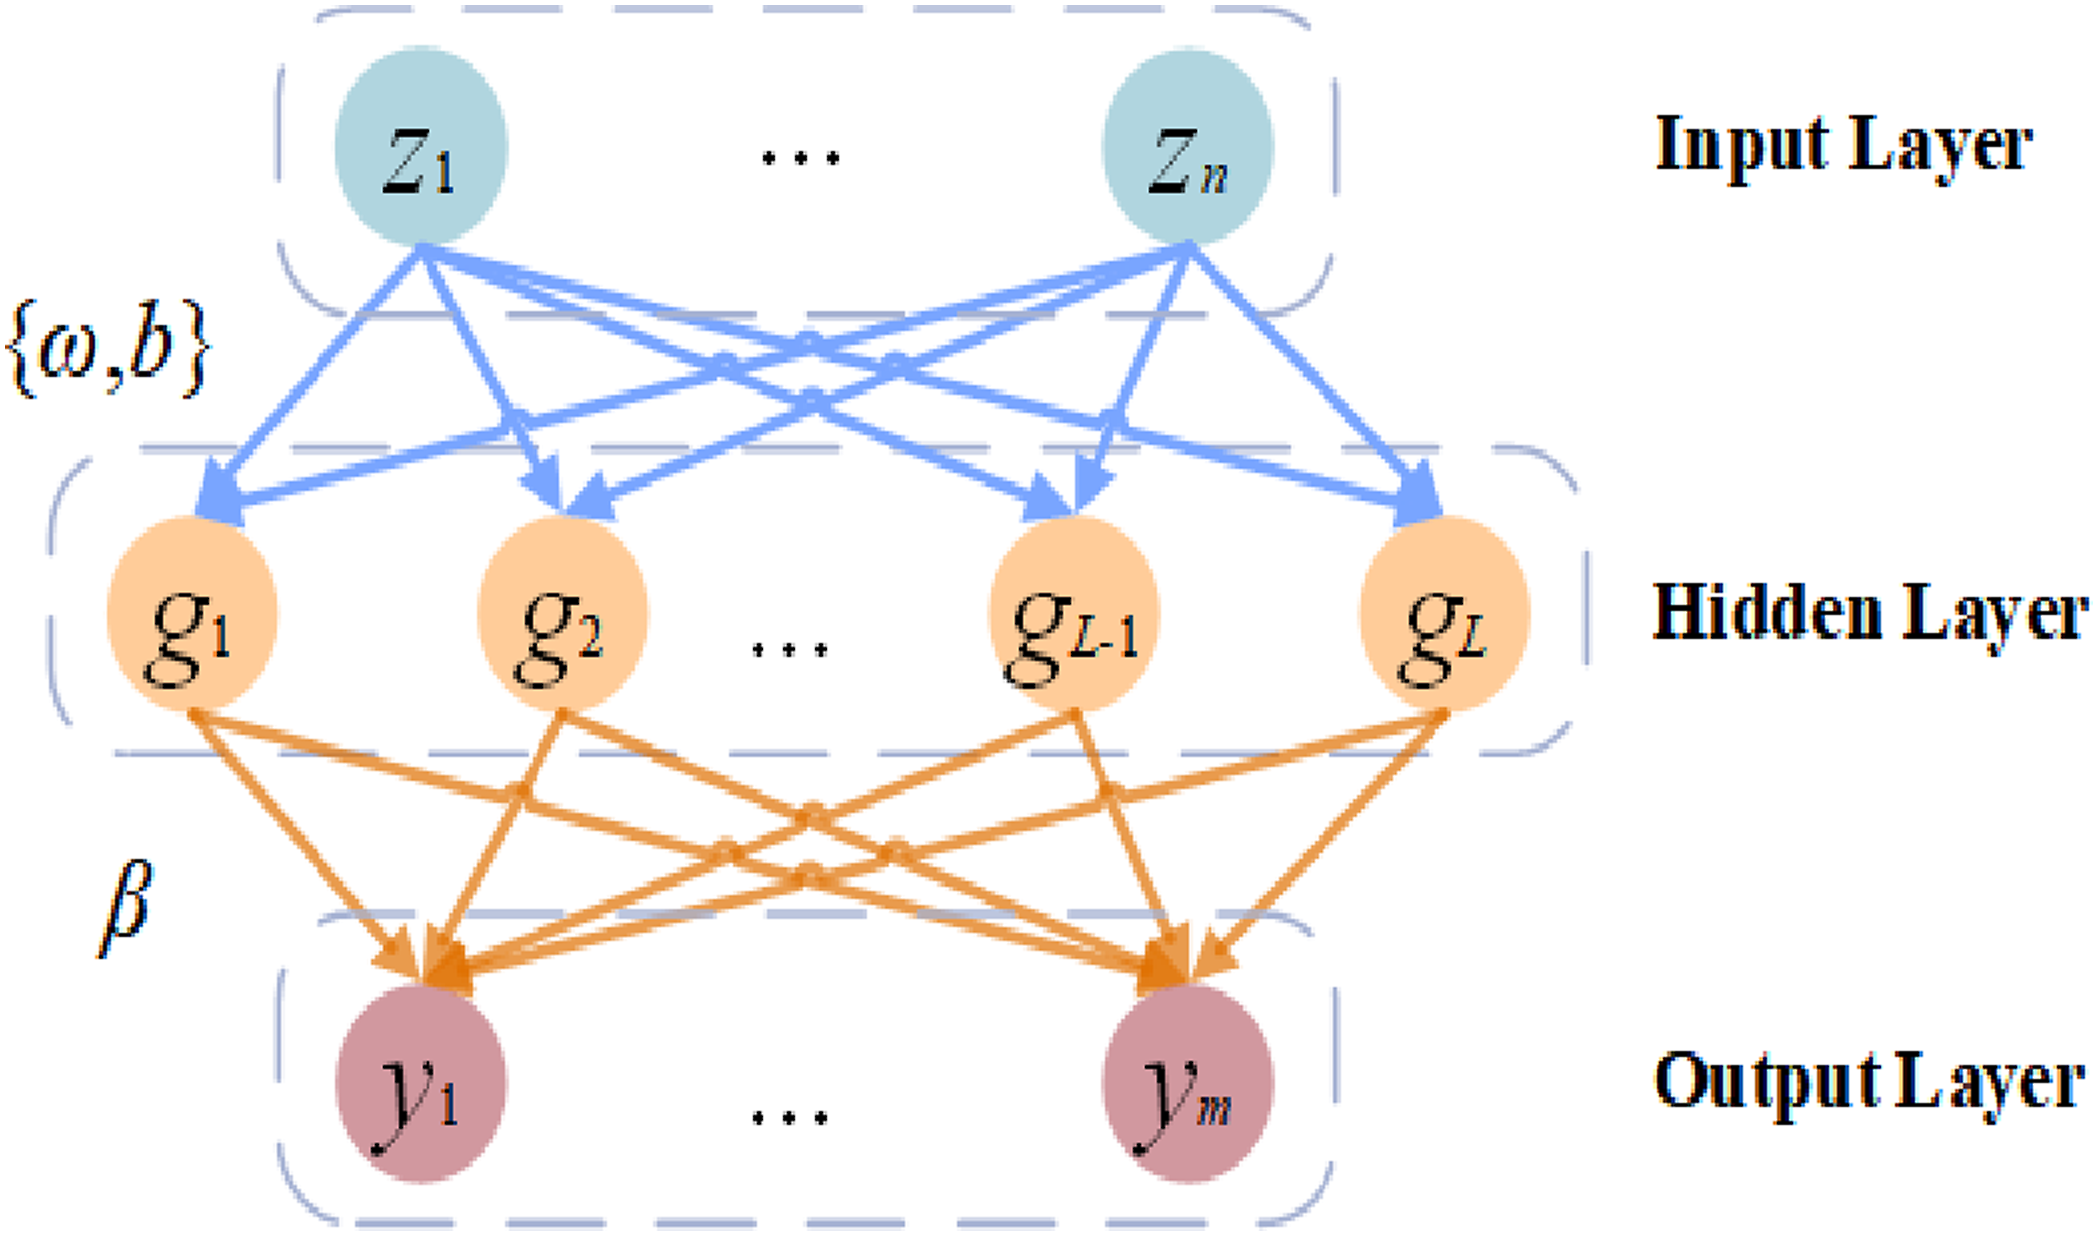
Given the objective function f : R
d
→ R
m
, assuming that SCNs model with L − 1 hidden layer neuron nodes has been constructed, that is,

Calculate the residual for the current L hidden nodes as:

If eL−1 does not meet the set value or does not reach the maximum node count Lmax, then the following supervised mechanism will be used to add a new hidden layer node, as:
After adding the hidden node, utilize the least squares method to calculate the output weight of the new node and update the model by
Different from classical neural networks, there is a supervised mechanism in SCNs. By updating the input weight w and bias b, and calculating the output weight β using the least square method, the network has excellent approximation ability on the basis of fast learning (Zhang et al. (2021)).
Bidirectional Long Short-term Memory
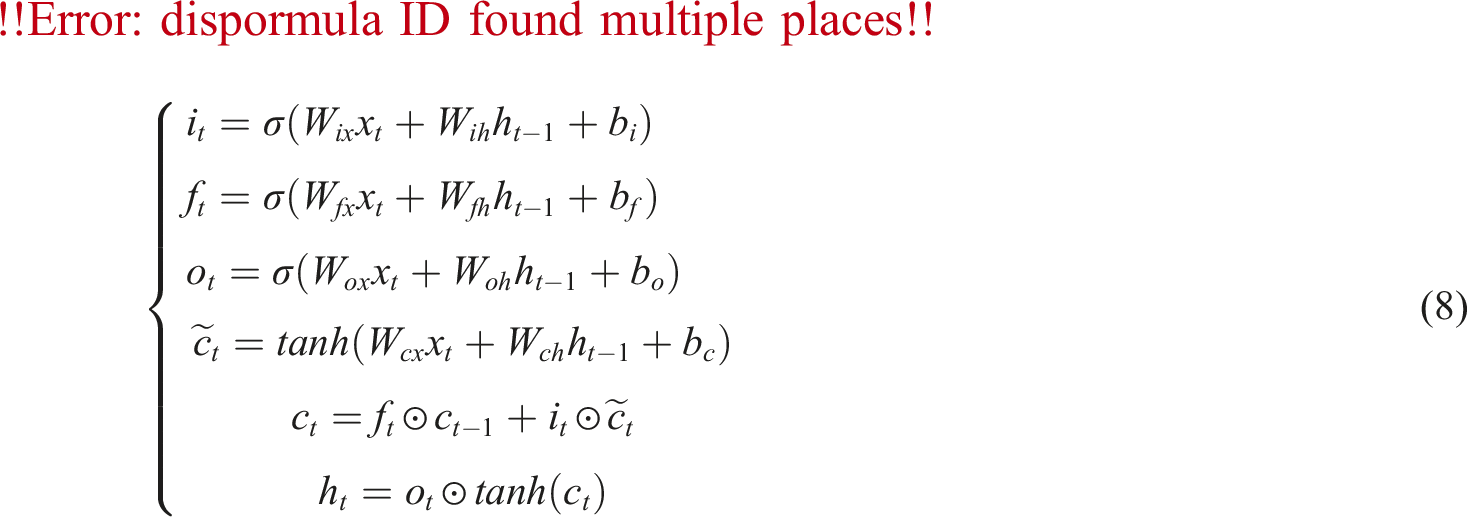
Schuster and Paliwal (Schuster and Paliwal (1997)) proposed a Bidirectional Long Short-term Memory (BiLSTM) network, in which two LSTM layers with opposite directions were used to handle the sequence and then concatenated the output. The schematic diagram is shown in Figure 3. Structure of BiLSTM.
Specifically, in the forward LSTM, the input sequence is processed from left to right at each time step. The hidden state h
t
and cell state c
t
at each time step are calculated using the following formulas:
Similarly, the backward LSTM processes the input sequence from right to left at each time step. The hidden state

Proposed sampling methods
Due to the small number of WPREs, the undersampling method not only fails to solve this problem, but also reduces the number of samples of non-ramp events, which affects the prediction accuracy of the model and fails to meet the requirements of this paper; and the oversampling method cannot ensure the rationality of the data and the accuracy of the model prediction. Hence, in view of the above problems, this paper proposes an oversampling method based on Interval-SMOTE. The proposed method enables the confinement of the generated point within a dynamic interval that adjusts symmetrically, ensuring the preservation of the original data trend and overcoming the limitations associated with conventional approaches. The comparison between this method and other common methods is shown in Figure 4. Comparison between the proposed oversampling method and some other methods.
Figure 4(a)–(c) shows the schematics of ROS, SMOTE, and Interval-SMOTE in order. In short, ROS (Figure 4(a)) randomly adds some samples in a few classes to balance the number of majority and minority classes; SMOTE (Figure 4(b)) expands the number of minority classes by selecting a certain point as a base point and interpolating it with its neighbors to form a new sample. However, these two methods cannot well control the quality of the generated samples, which may affect the accuracy of the model prediction. Unlike the traditional oversampling method, the proposed Interval-SMOTE method in this paper (Figure 4(c)) will not only expand the number of ramp event samples, but also limit the generated points to an equal interval above and below the original data, ensuring that the generated sample will maintain the original data change trend. It will provide a more reliable data base and operable data support for the next operation.
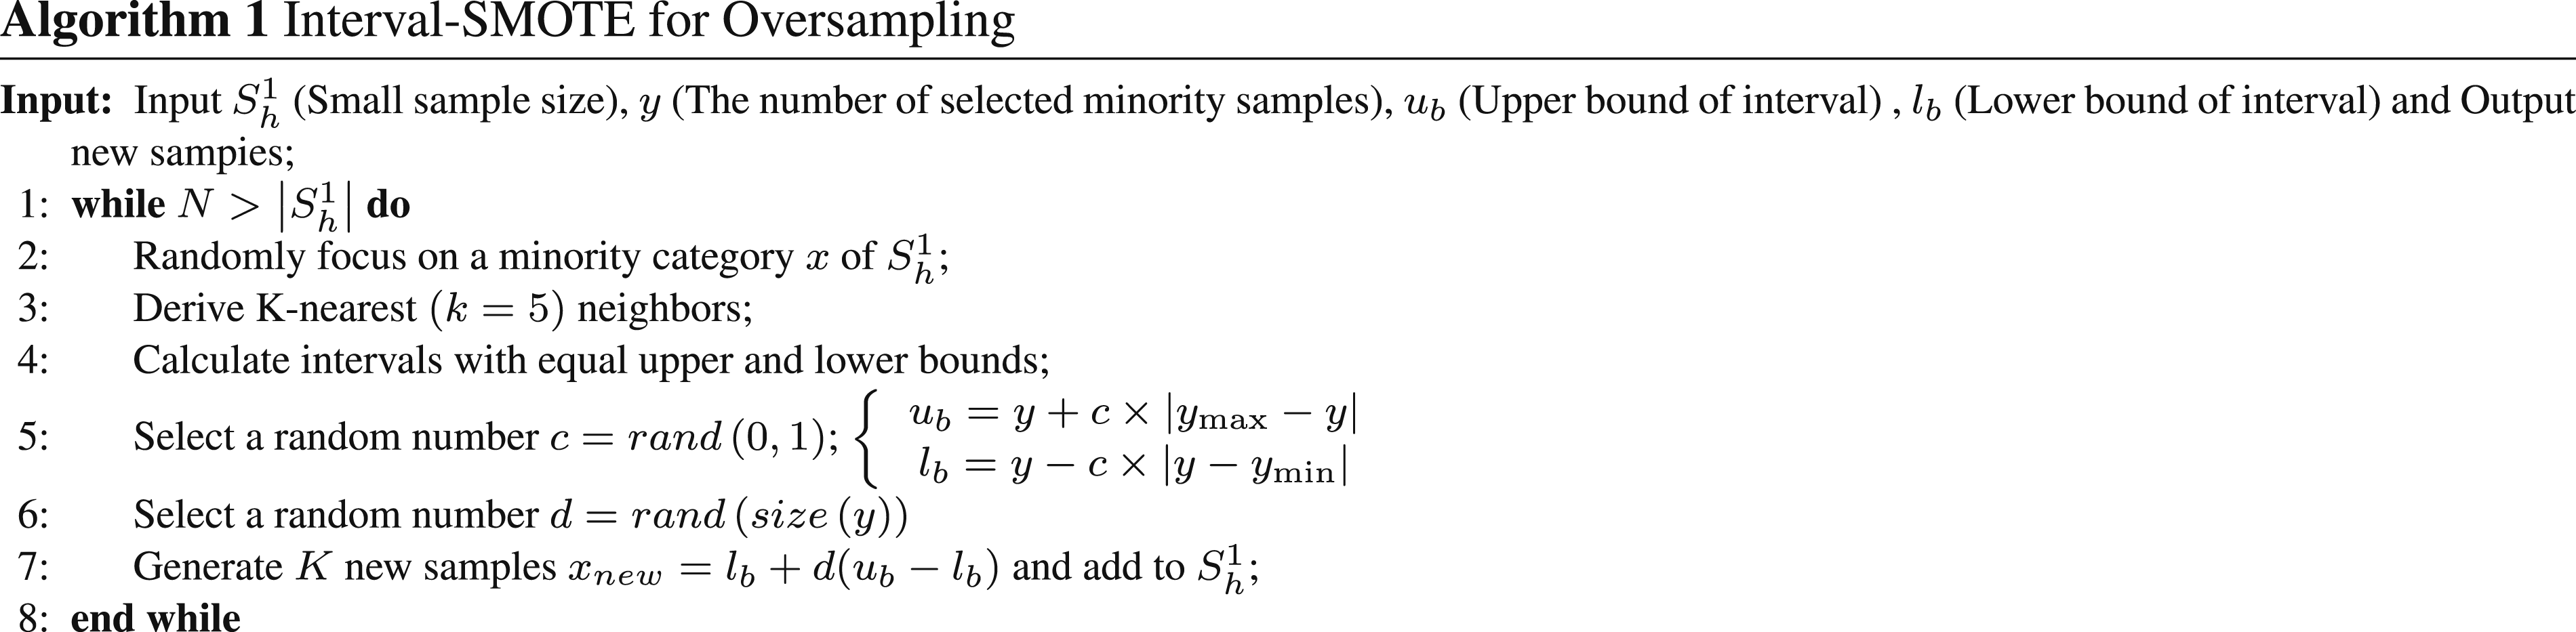
The steps of the Interval-SMOTE are as follows: Step 1: Get the minority class index and find the minority class sample x; Step 2: The distance between each two samples is calculated according to the Euclidean distance. The KNN algorithm is used to search k (k = 5 is used in this paper) nearest samples for each sample x in a minority classes of samples. Step 3: Sample y is randomly selected from k nearest neighbors of x, and the maximum ymax and minimum ymin are found to construct the upper and lower bound interval; Step 4: According to formulas (10) and (11), the upper and lower bound interval range is formed, and new sample points are generated in this interval; Step 5: Add all new samples to the original data to reduce the imbalance of the original data set.


The pseudocode of the proposed Interval-SMOTE algorithm is as follows:
Overall framework of wind power ramp events prediction
Building upon the aforementioned approaches, this paper proposes a research methodology that addresses the challenge posed by the limited number of ramp event samples in WPREs. The overall structure of the proposed prediction method is shown in Figure 5. The overall structure of the proposed prediction method.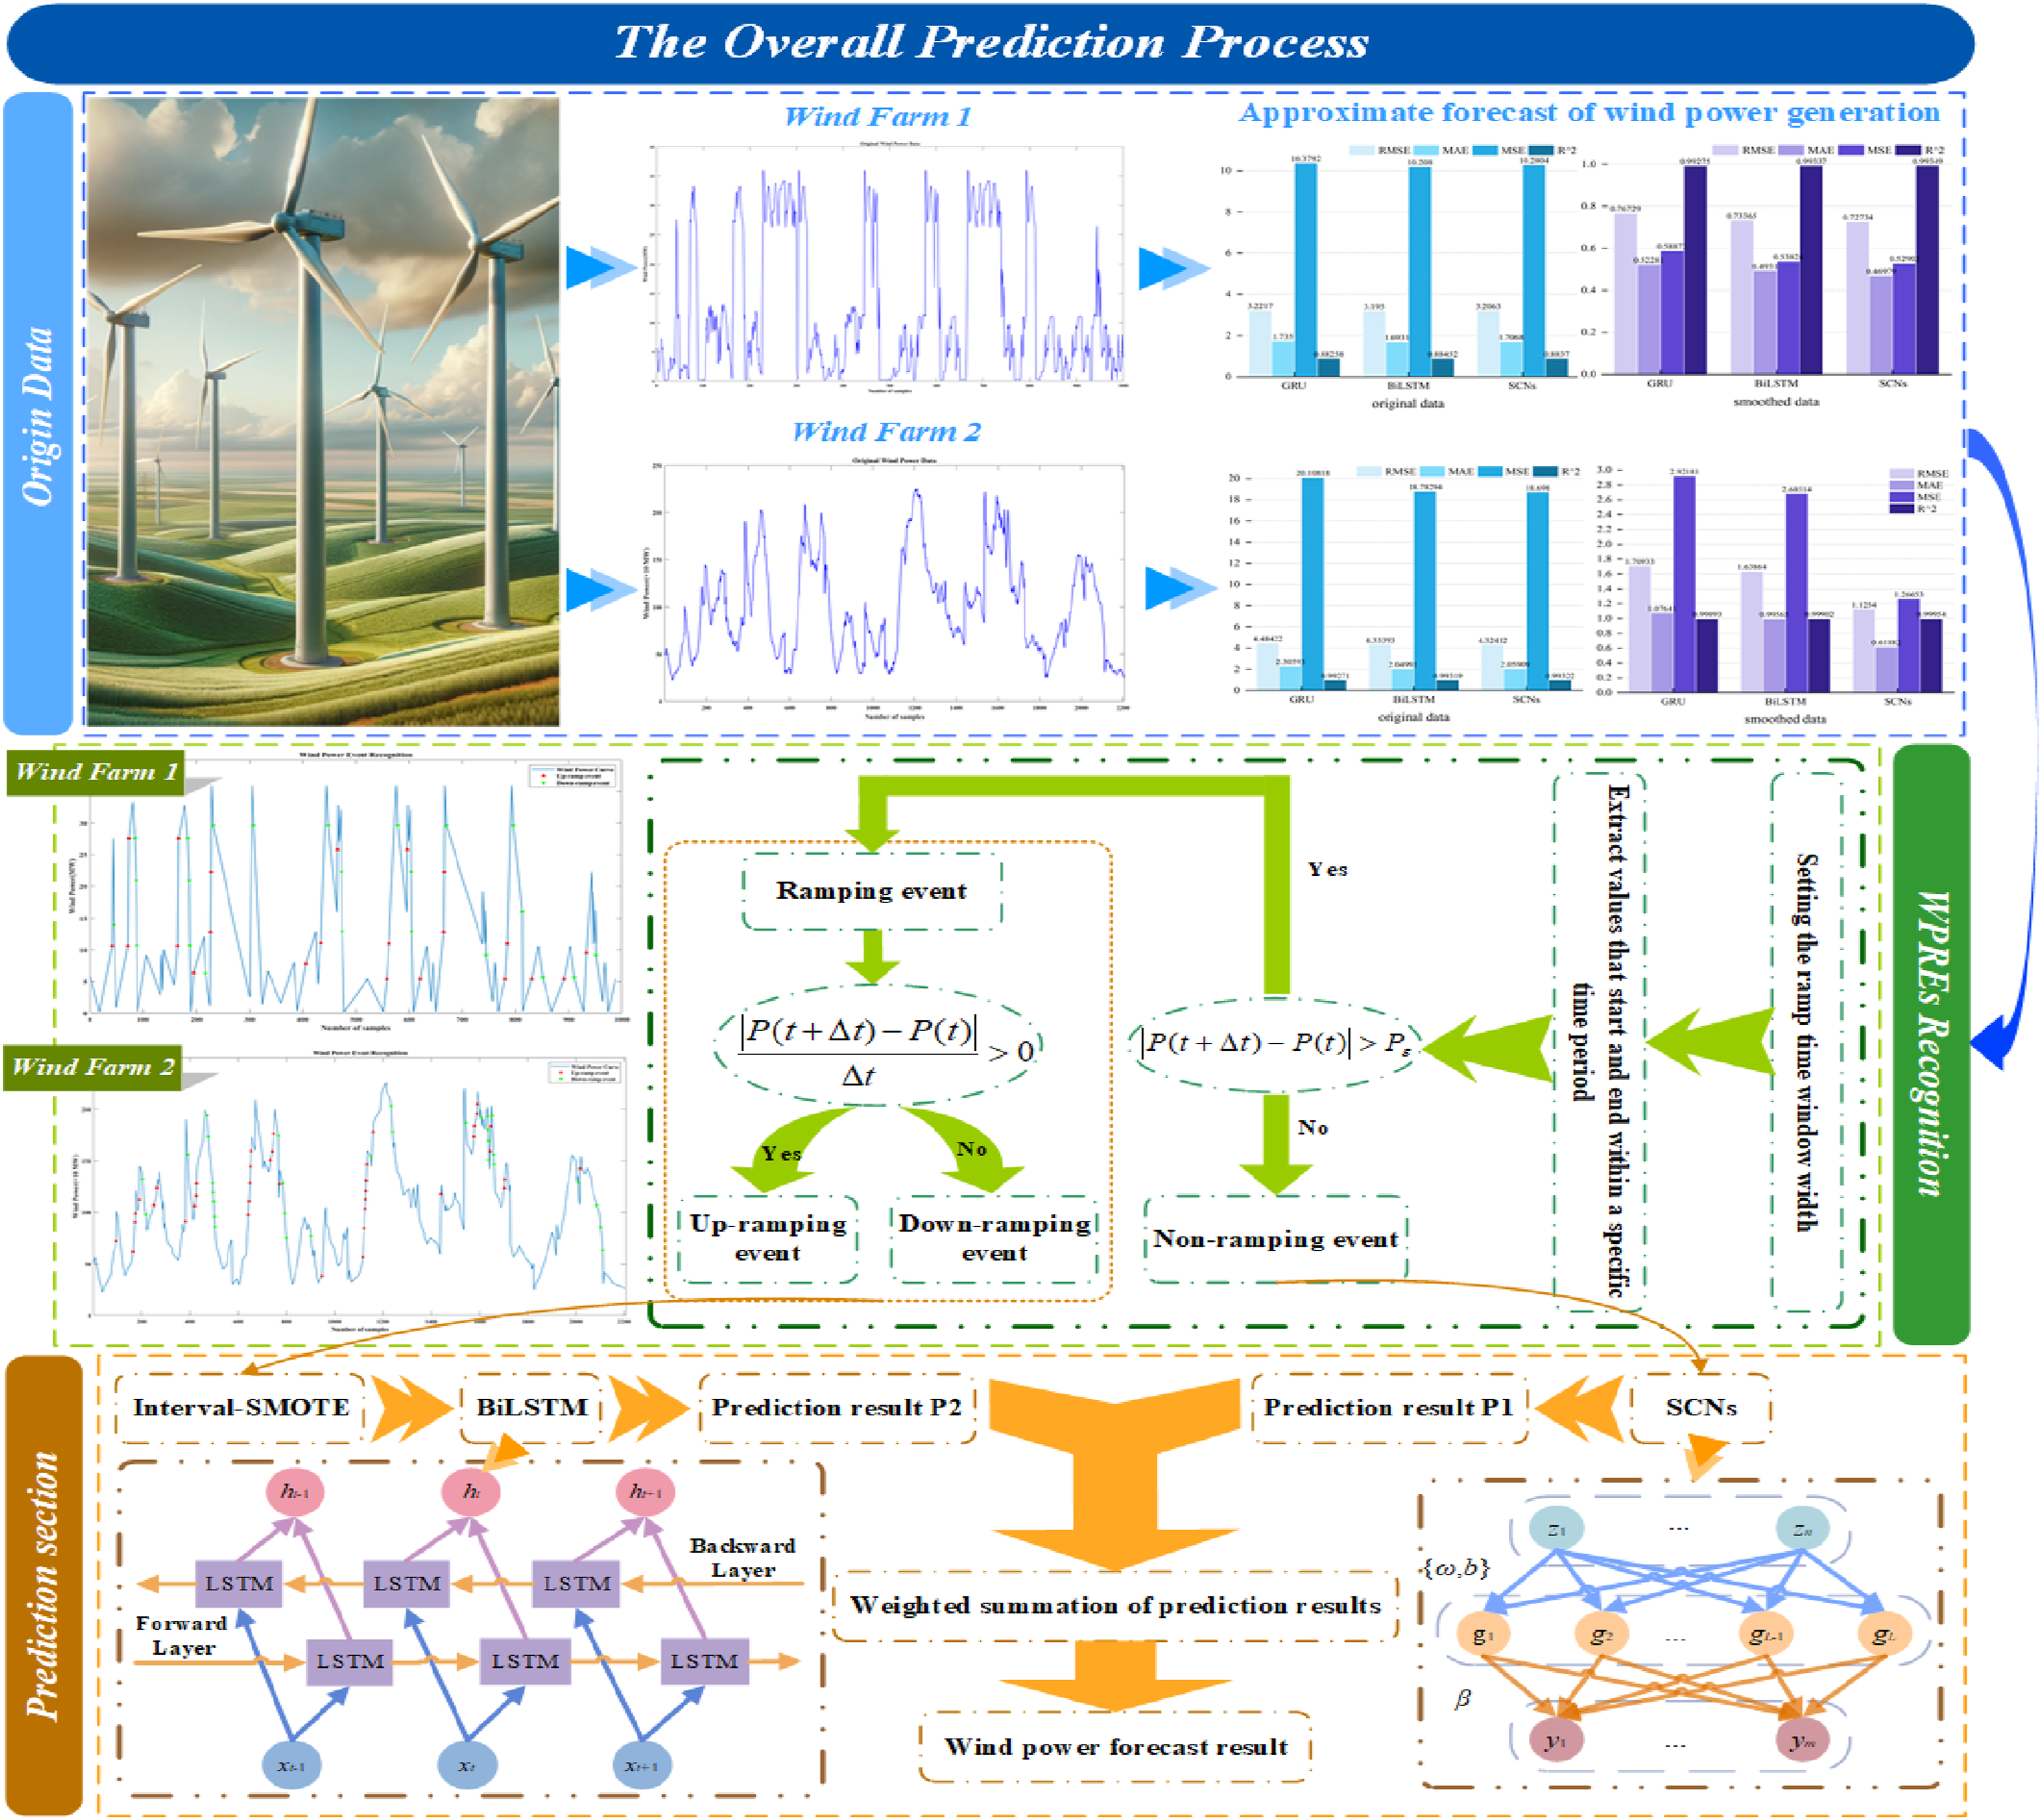
According to Figure 5, the overall research framework of this paper is divided into three parts.
Preliminary predictions and significance verification
In the first part, preliminary predictions are made based on historical data to establish the significance of the research. Specifically, historical wind power data from two wind farms in different regions are initially predicted using a single prediction model. The same model is then applied to predict the two datasets after smoothing processing. By comparing various evaluation indicators, the impact of ramp events on wind power prediction is verified, thereby highlighting the importance of this study.
Identification of ramp events using the SDT algorithm
In the second part, an SDT algorithm based on the definition of fused ramp events is proposed to identify wind power ramp events (WPREs). After acquiring the historical wind power data, the SDT algorithm combined with the ramp event definition is employed to detect existing ramp phenomena in the data. The recognition results are categorized into two types: ramp events and non-ramp events, with the direction of ramp events also determined.
Post-processing and final prediction
In the third part, the identified ramp events are oversampled using the Interval-SMOTE oversampling method. This process expands the number of ramp event samples by generating points within intervals above and below the original data, effectively increasing the few-class sample points while preserving the original data trend as much as possible. Subsequently, the SCNs model is used to predict the non-ramp event data obtained after the ramp event identification process, yielding prediction result P1. Meanwhile, the BiLSTM model predicts the oversampled ramp event data, resulting in prediction result P2. Finally, the paper weights the forecast results P1 and P2 to obtain the final wind power forecast results.
Experiments and discussion
Evaluation metrics
The simulation experiments are conducted in the MATLAB 2021b environment. The hardware configuration of the computer is: I9-13900HX CPU running at 2.20 GHz and 16 GB of memory.


Forecast result of wind power ramp events.
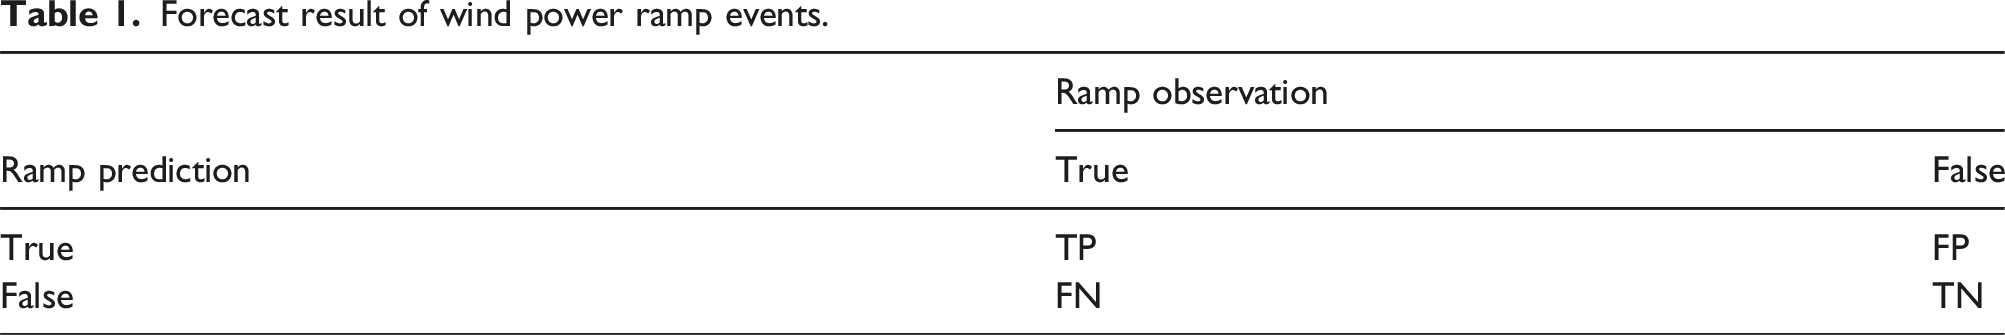
Moreover, in order to better compare the performance of various prediction models, this paper employs Root Mean Square Error (RMSE), Mean Square Error (MSE), Mean Absolute Error (MAE), and R-Square (R2) as evaluation metrics to analyze the errors in the prediction results of each model. Among them, smaller values of RMSE, MSE, and MAE indicate higher prediction accuracy. The range of variation of the determination coefficient (R2) is between 0 and 1, with values closer to 1 indicating better fitting of the model to the actual data.
Through the comprehensive application of these evaluation metrics, this paper can more comprehensively evaluate and explain the performance of the prediction models. This helps to ensure the credibility of the prediction results of this paper and provides strong evidence for our work.
Data description
The wind power data information is shown in Figure 6. Raw wind power data information.
To validate the effectiveness and generalization of the proposed method, two datasets from different wind farms are used for experiments in this study. The first dataset is collected from the SOTAVENTO wind farm in Spain (https://www.sotaventogalicia.com/), consisting of 1000 data points, 70% of the data is selected for training and the remaining 30% is used for testing. The second dataset is obtained from a wind farm in Belgium, collected from the Elia website (https://www.elia.be/en/grid-data), comprising 2208 data points, and similarly, 70% of the data is allocated for training and 30% of the data is reserved for testing.
Initial model prediction under WPREs
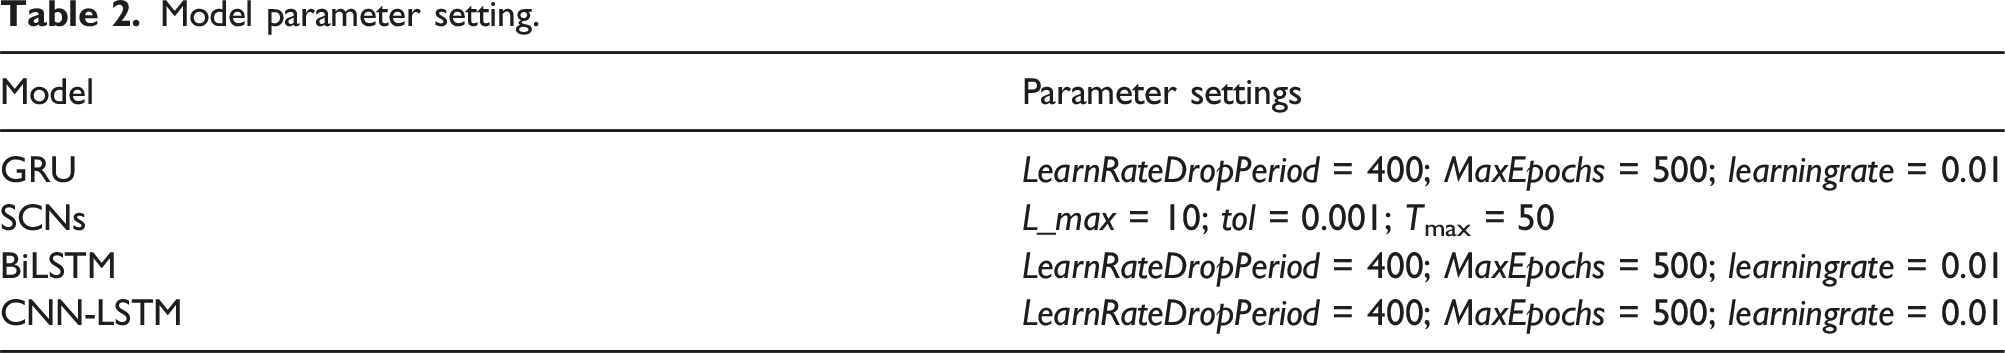
Model parameter setting.
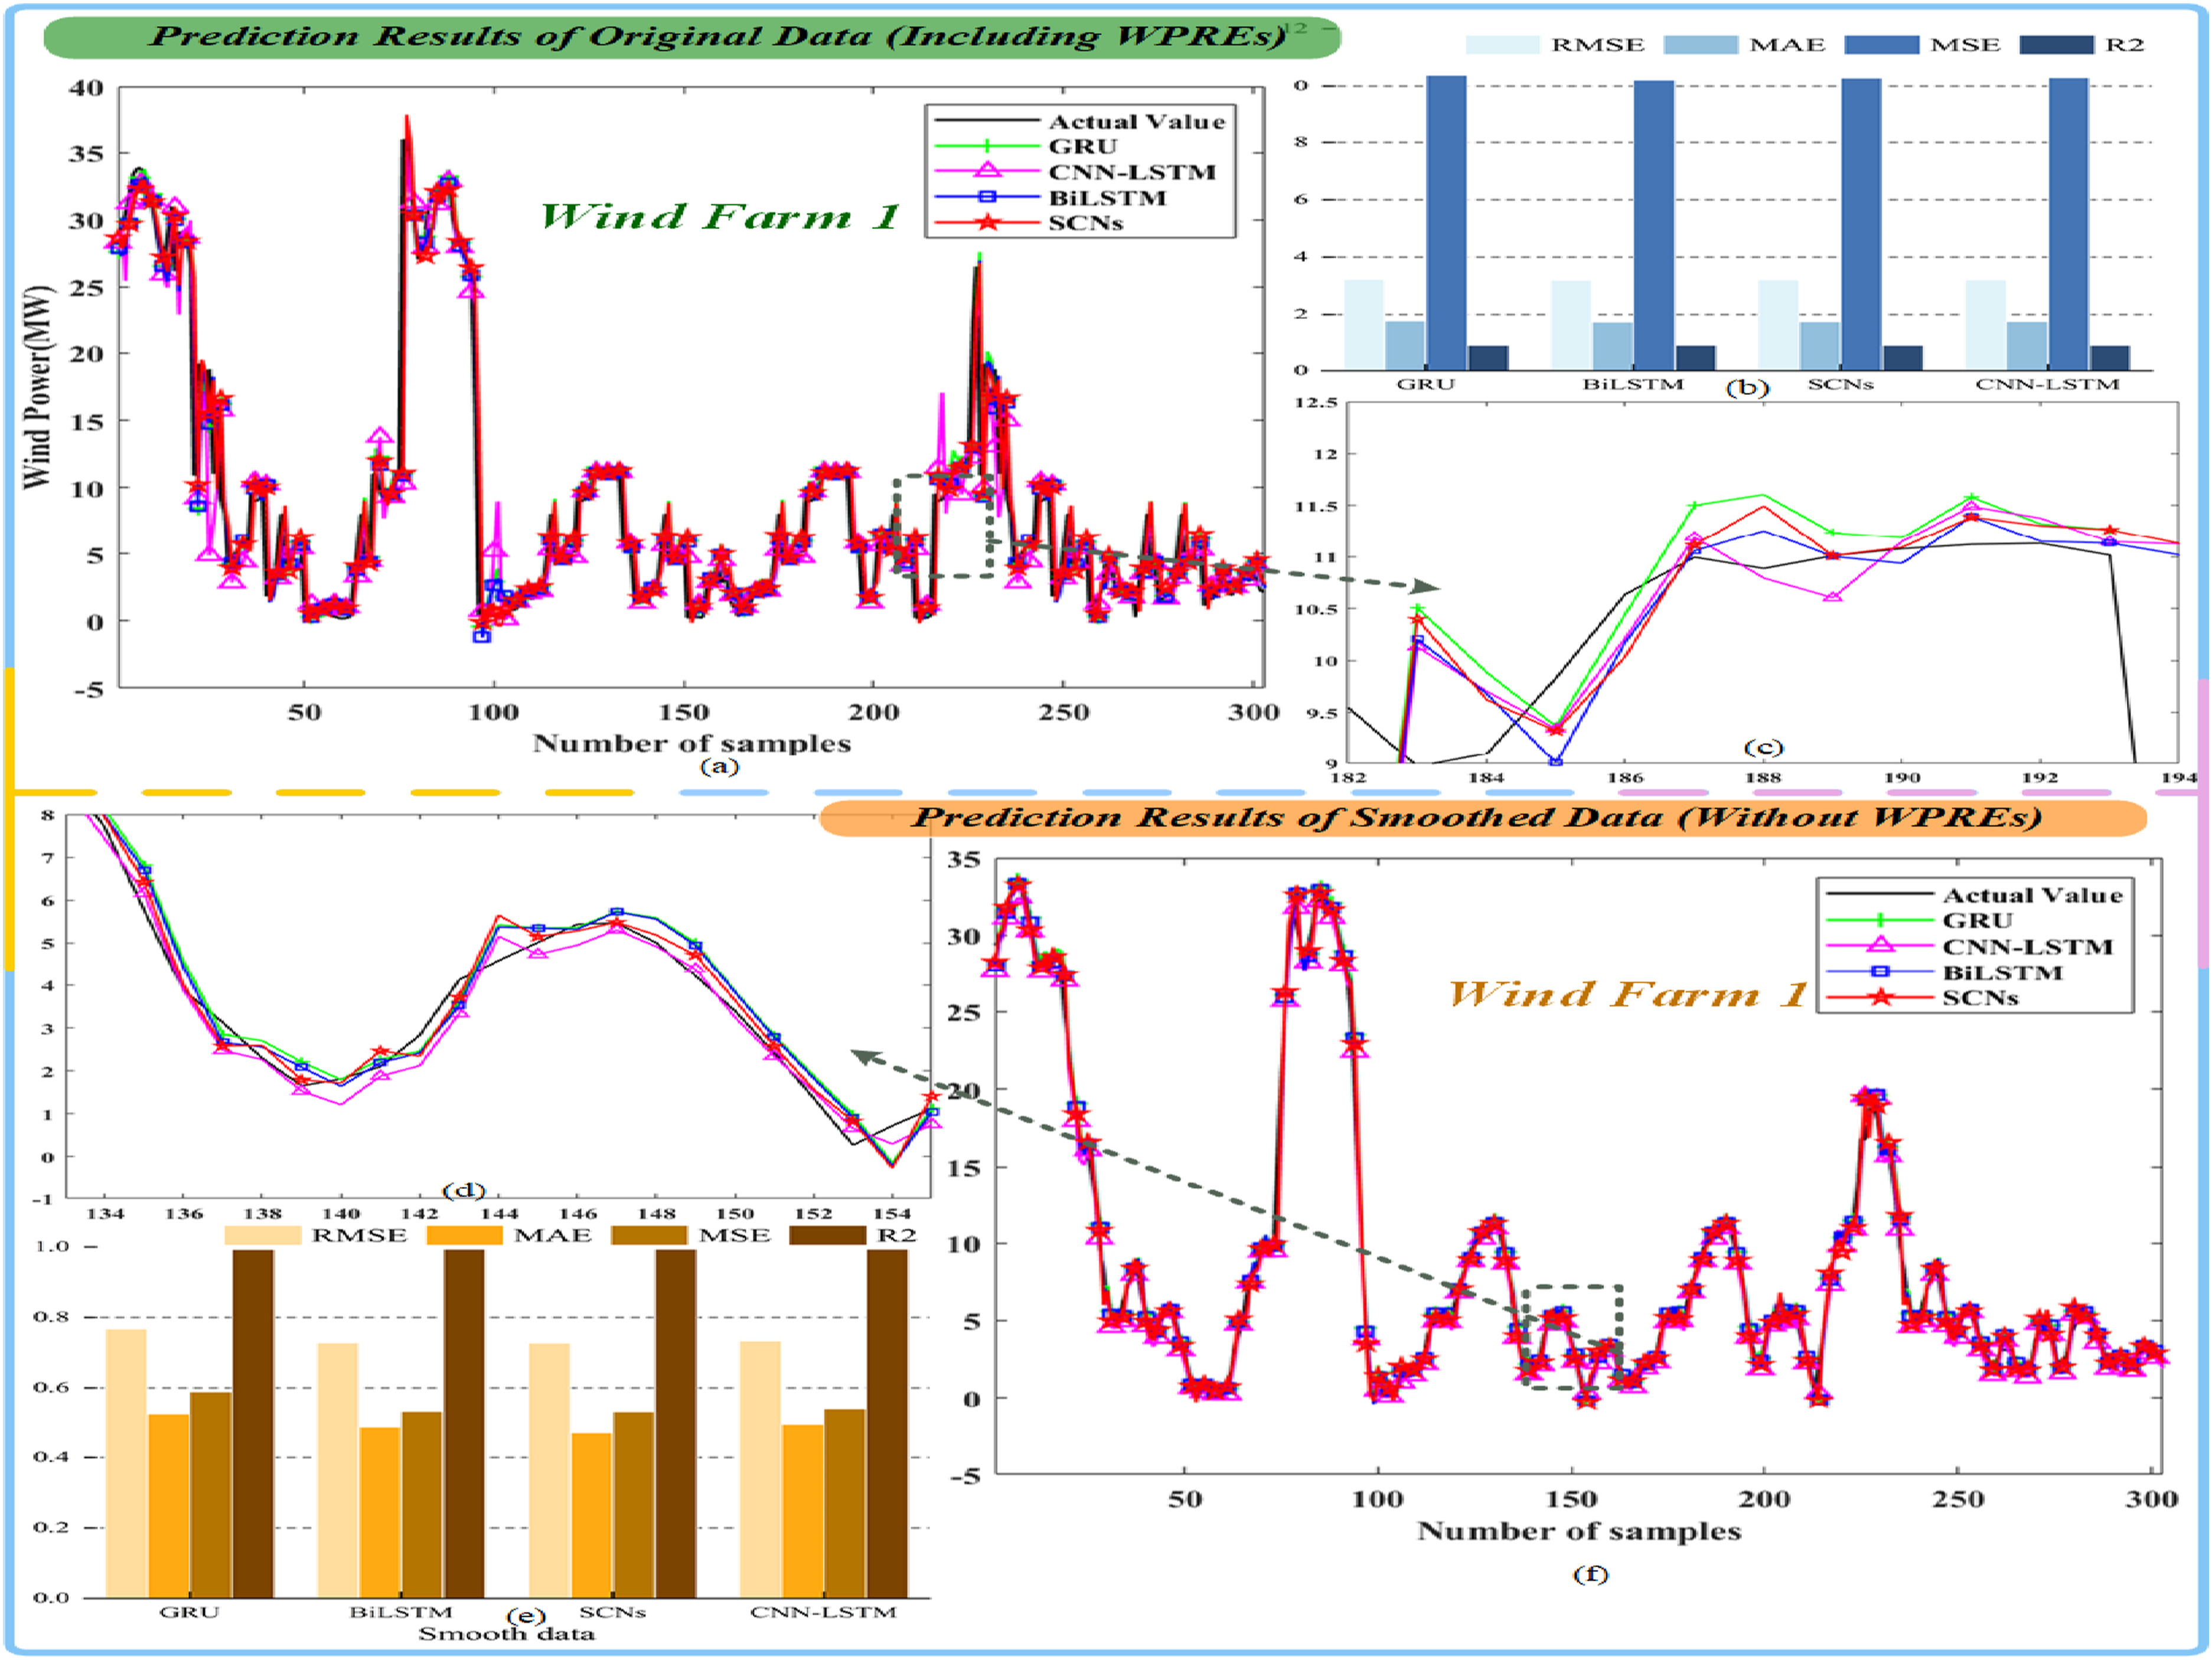
Initial prediction: WPREs impact on Wind Farm 1.
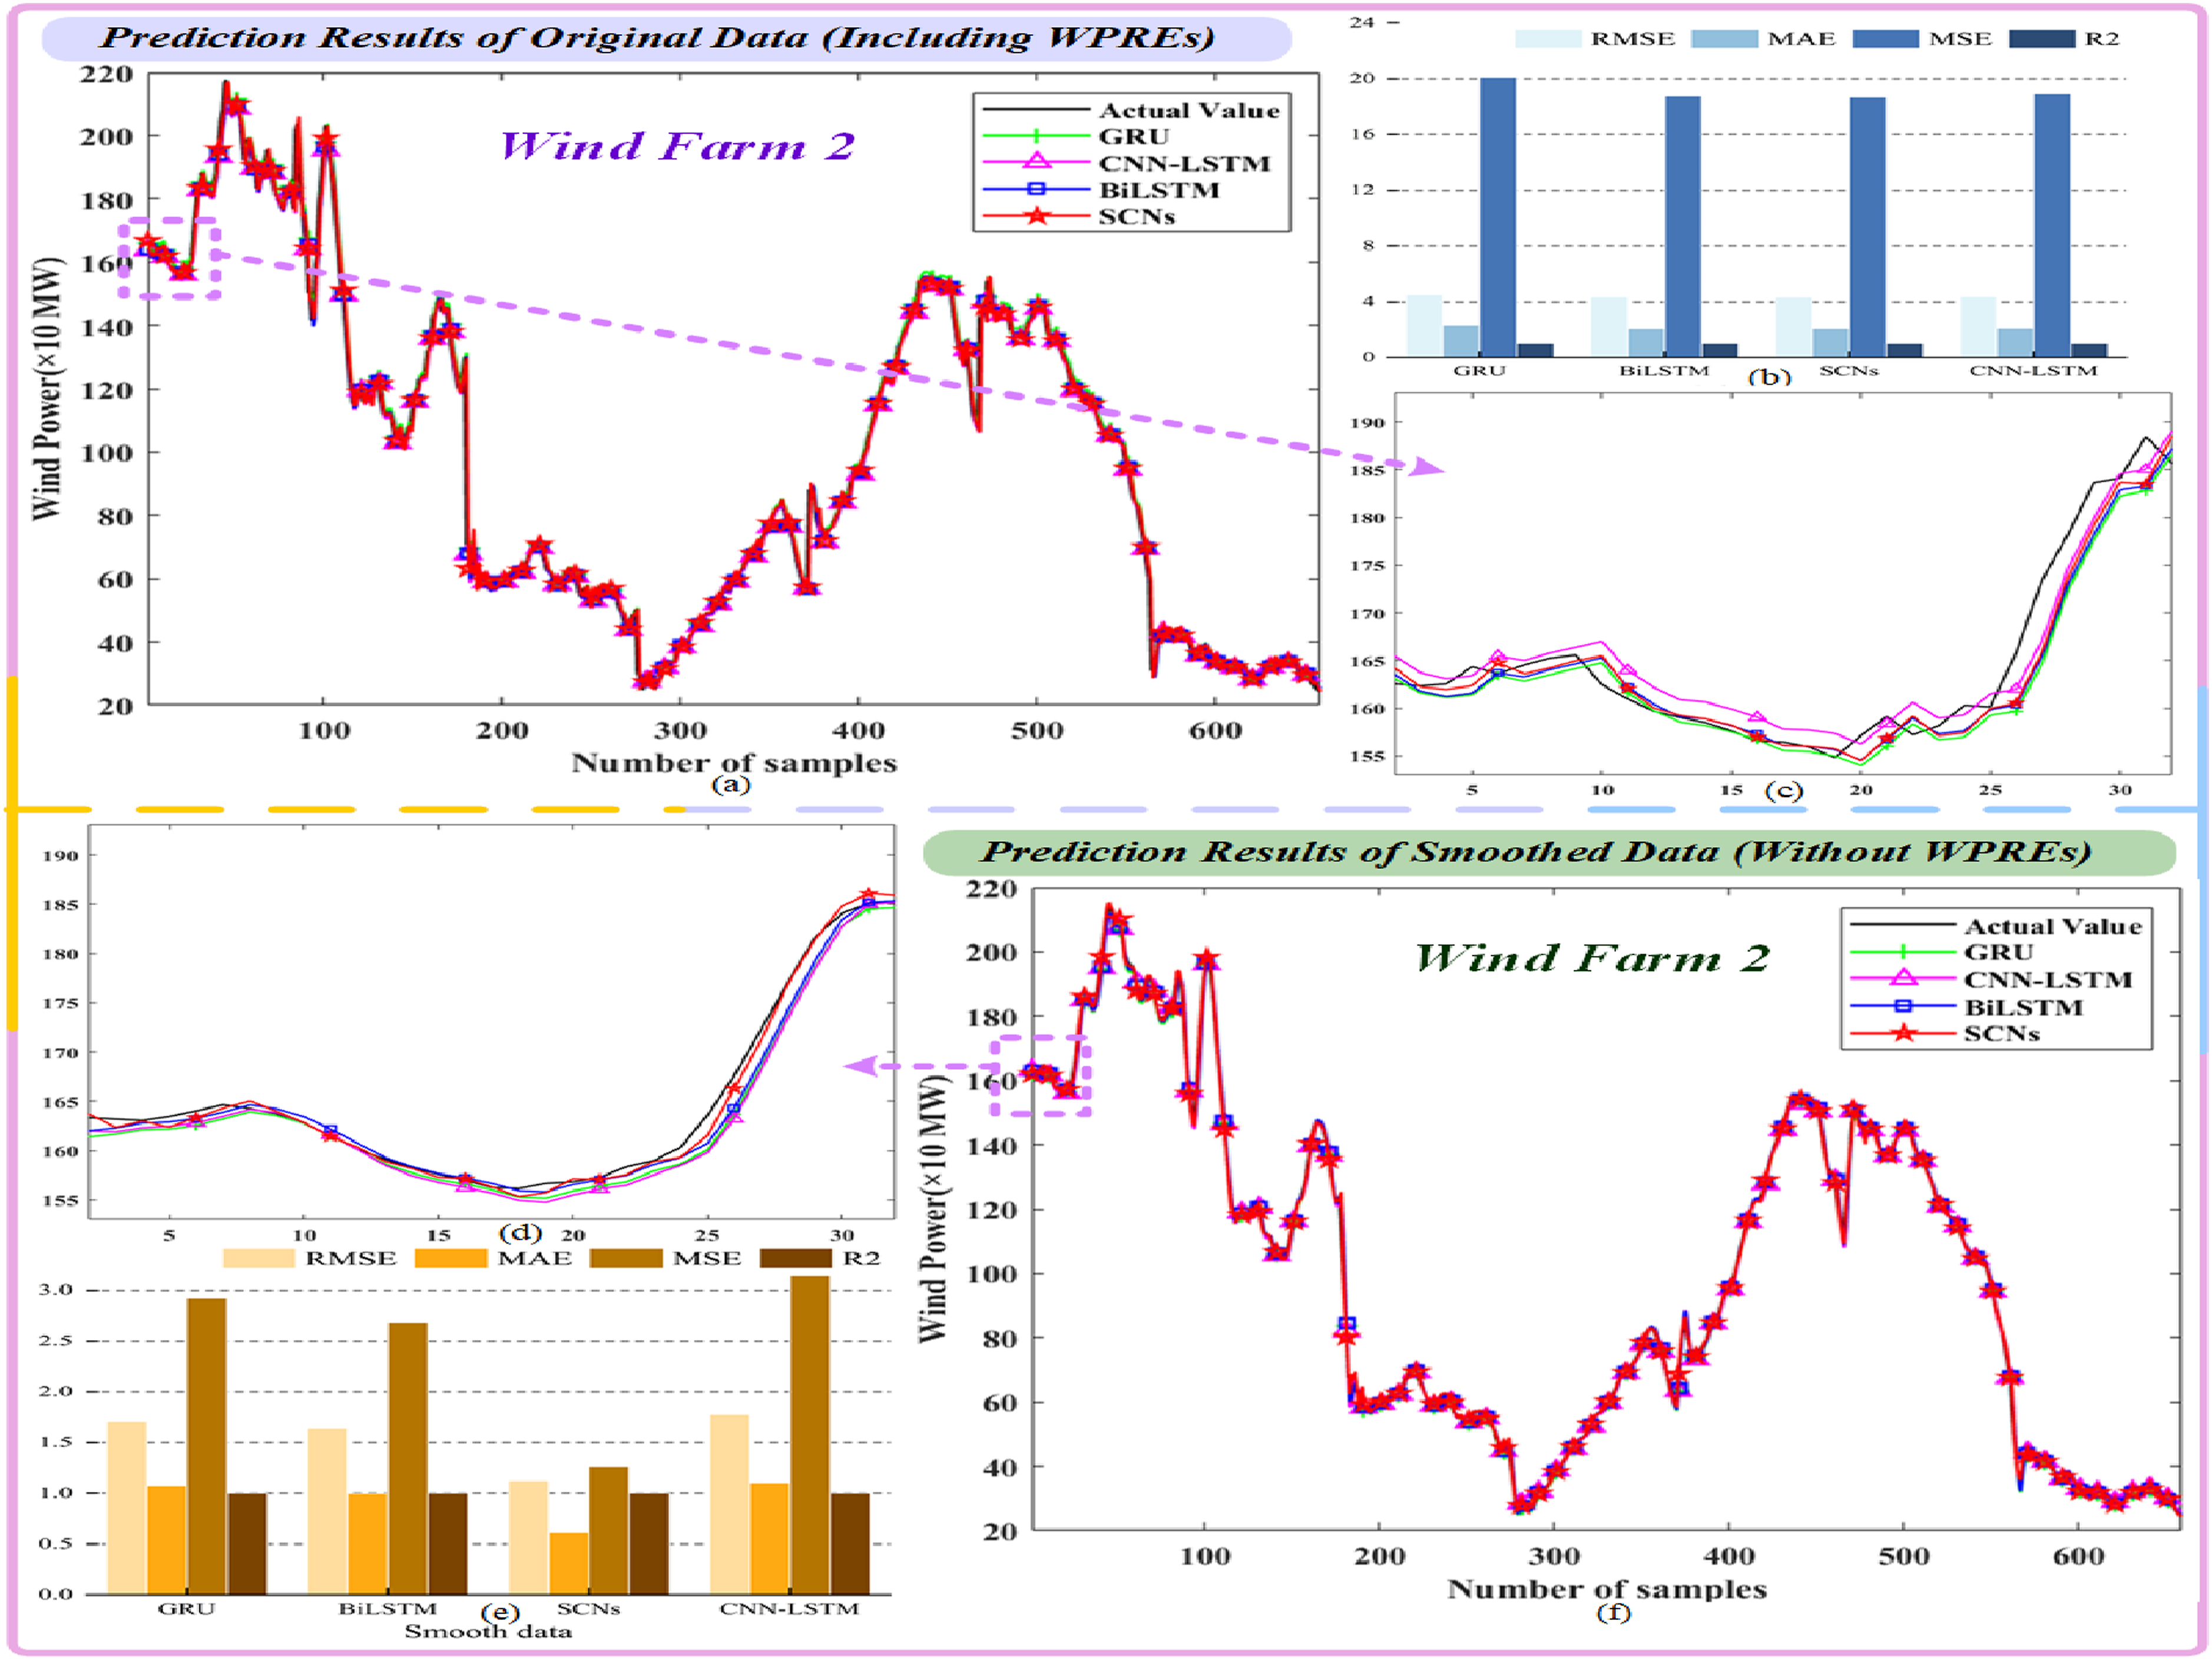
Initial prediction: WPREs impact on Wind Farm 2.
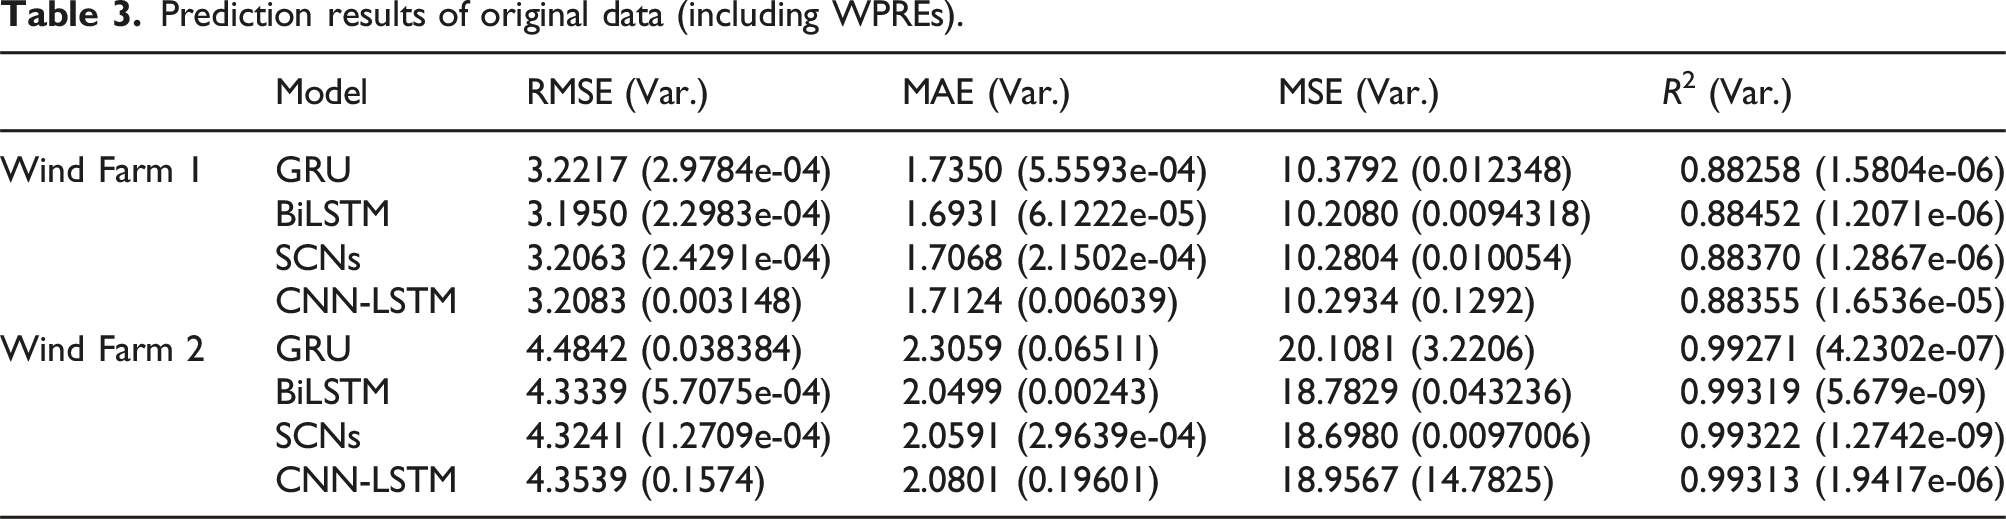
Prediction results of original data (including WPREs).
Prediction results of smoothed data (without WPREs).
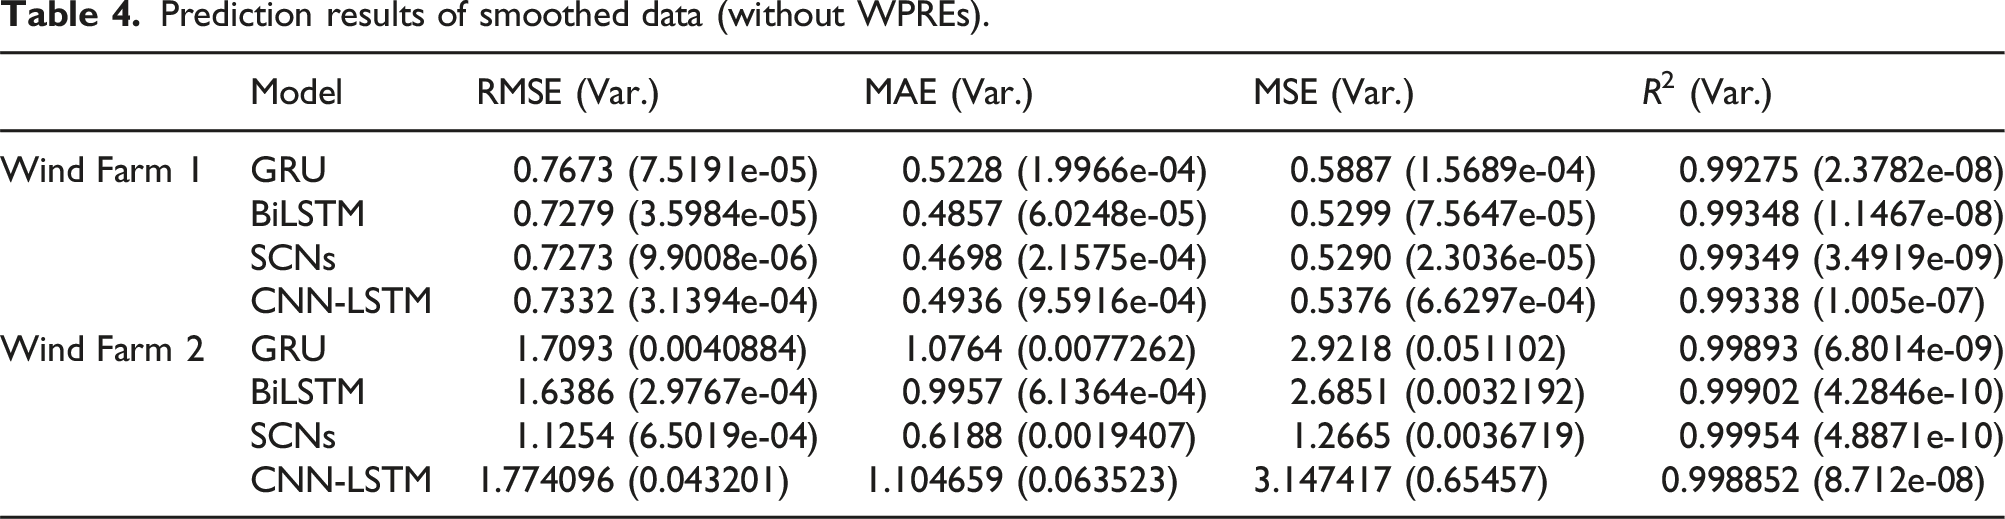
It can be seen from Tables 3 and 4 that when using smooth data that does not contain WPREs for model prediction, take the RMSE index result in Wind Farm 1 as an example, RMSE Origin−data = [3.2217, 3.195, 3.2063, 3.2083] and RMSE Smooth−data = [0.76729, 0.71931, 0.72734, 0.7332]; it can be seen that the RMSE result without WPREs is much lower than that of the data with WPREs. Therefore, when establishing the prediction model, it is necessary to handle the data of WPREs to ensure the prediction accuracy of the model. In addition, as shown in Tables 3 and 4, it can be observed that, compared to other models, the SCNs and BiLSTM models used in this paper outperform others, whether for smoothed data or data containing ramp events. Moreover, compared to the hybrid CNN-LSTM model, the models used in this paper have lower complexity, which further validates the advantages of the models employed in this study.
At the same time, this paper also presents a boxplot of the prediction error based on the prediction results, as shown in Figure 9. From Figure 9(a), it is evident that the SCNs model and the BiLSTM model exhibit fewer outliers (marked by red plus signs), indicating their superior prediction accuracy. In Figure 9(b), while there is little difference in the number of outliers among the four models, the median values for the SCNs and BiLSTM models (indicated by red horizontal lines) are closer to zero, further demonstrating the advantages of these two models. Boxplots of two wind farm prediction results.
Comparison with other WPREs identification methods
Comparison results of four WPREs identification methods.
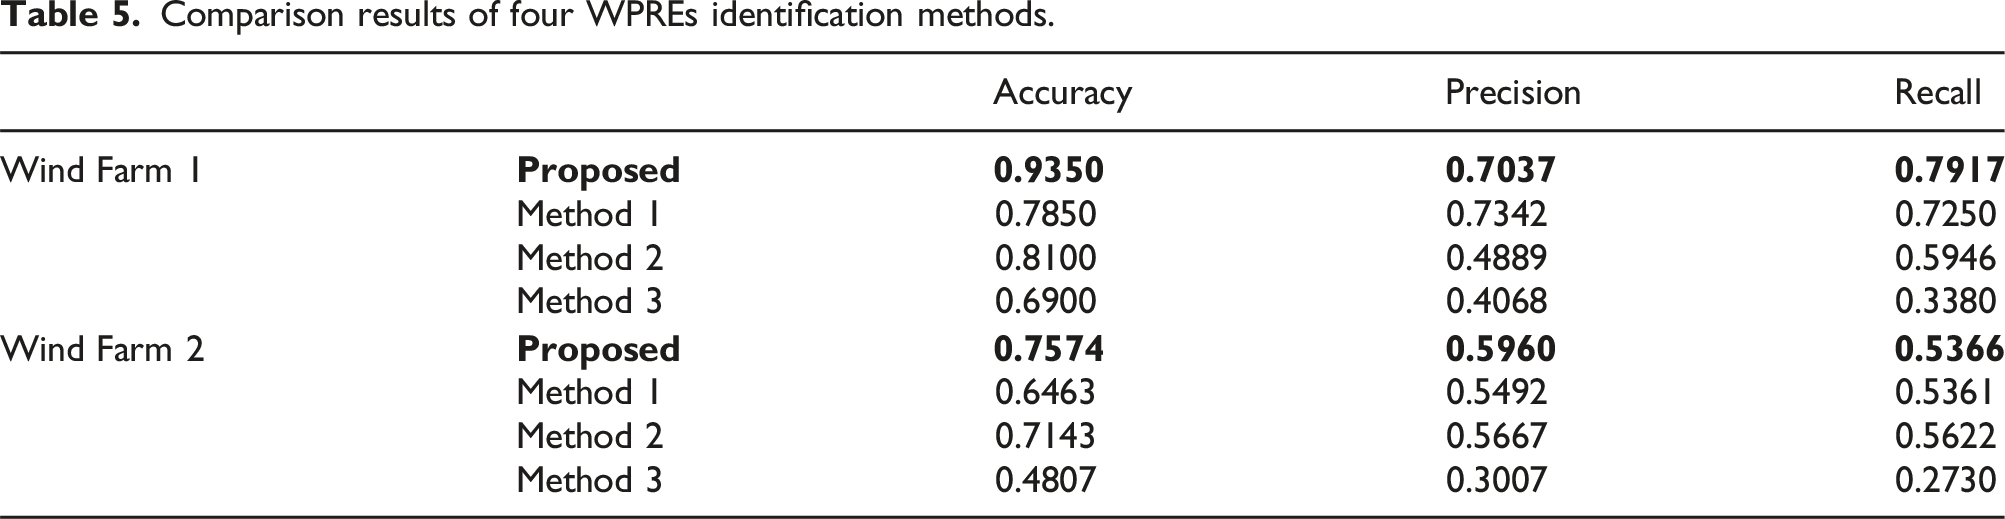
This study focuses on several definitions of WPREs that are widely used at present. Through the comparative experimental results shown in Table 5 and Figure 10, it can be observed that for the data of Wind Farm 1, the results of WPREs identification using the proposed method are only slightly lower than that of method 1 by 3.05% in the precision rate metrics, but the accuracy as well as the recall rate is better than that of the other compared methods. For the data of Wind Farm 2, the accuracy, precision, and recall rate of the proposed method are higher than other comparison methods. By comparing the experimental results, it can be found that the proposed method has excellent performance in ramp events recognition. These results highlight the superiority of the proposed method in dealing with WPREs, which not only significantly improves the accuracy, but also performs well on other key indicators. Accuracy of different ramp events recognition methods.
Comparison with other oversampling methods
Processing results based on different oversampling methods.

It can be seen from Table 6 that the accuracy, precision and recall rate of ramp events recognition by the proposed oversampling method is higher than that of other models. In order to express the superiority of the proposed method more directly, the processing results of the unbalanced sample problem in this paper using different sampling methods are drawn according to Table 6, as shown in Figure 11. Plot of processing results based on different sampling methods.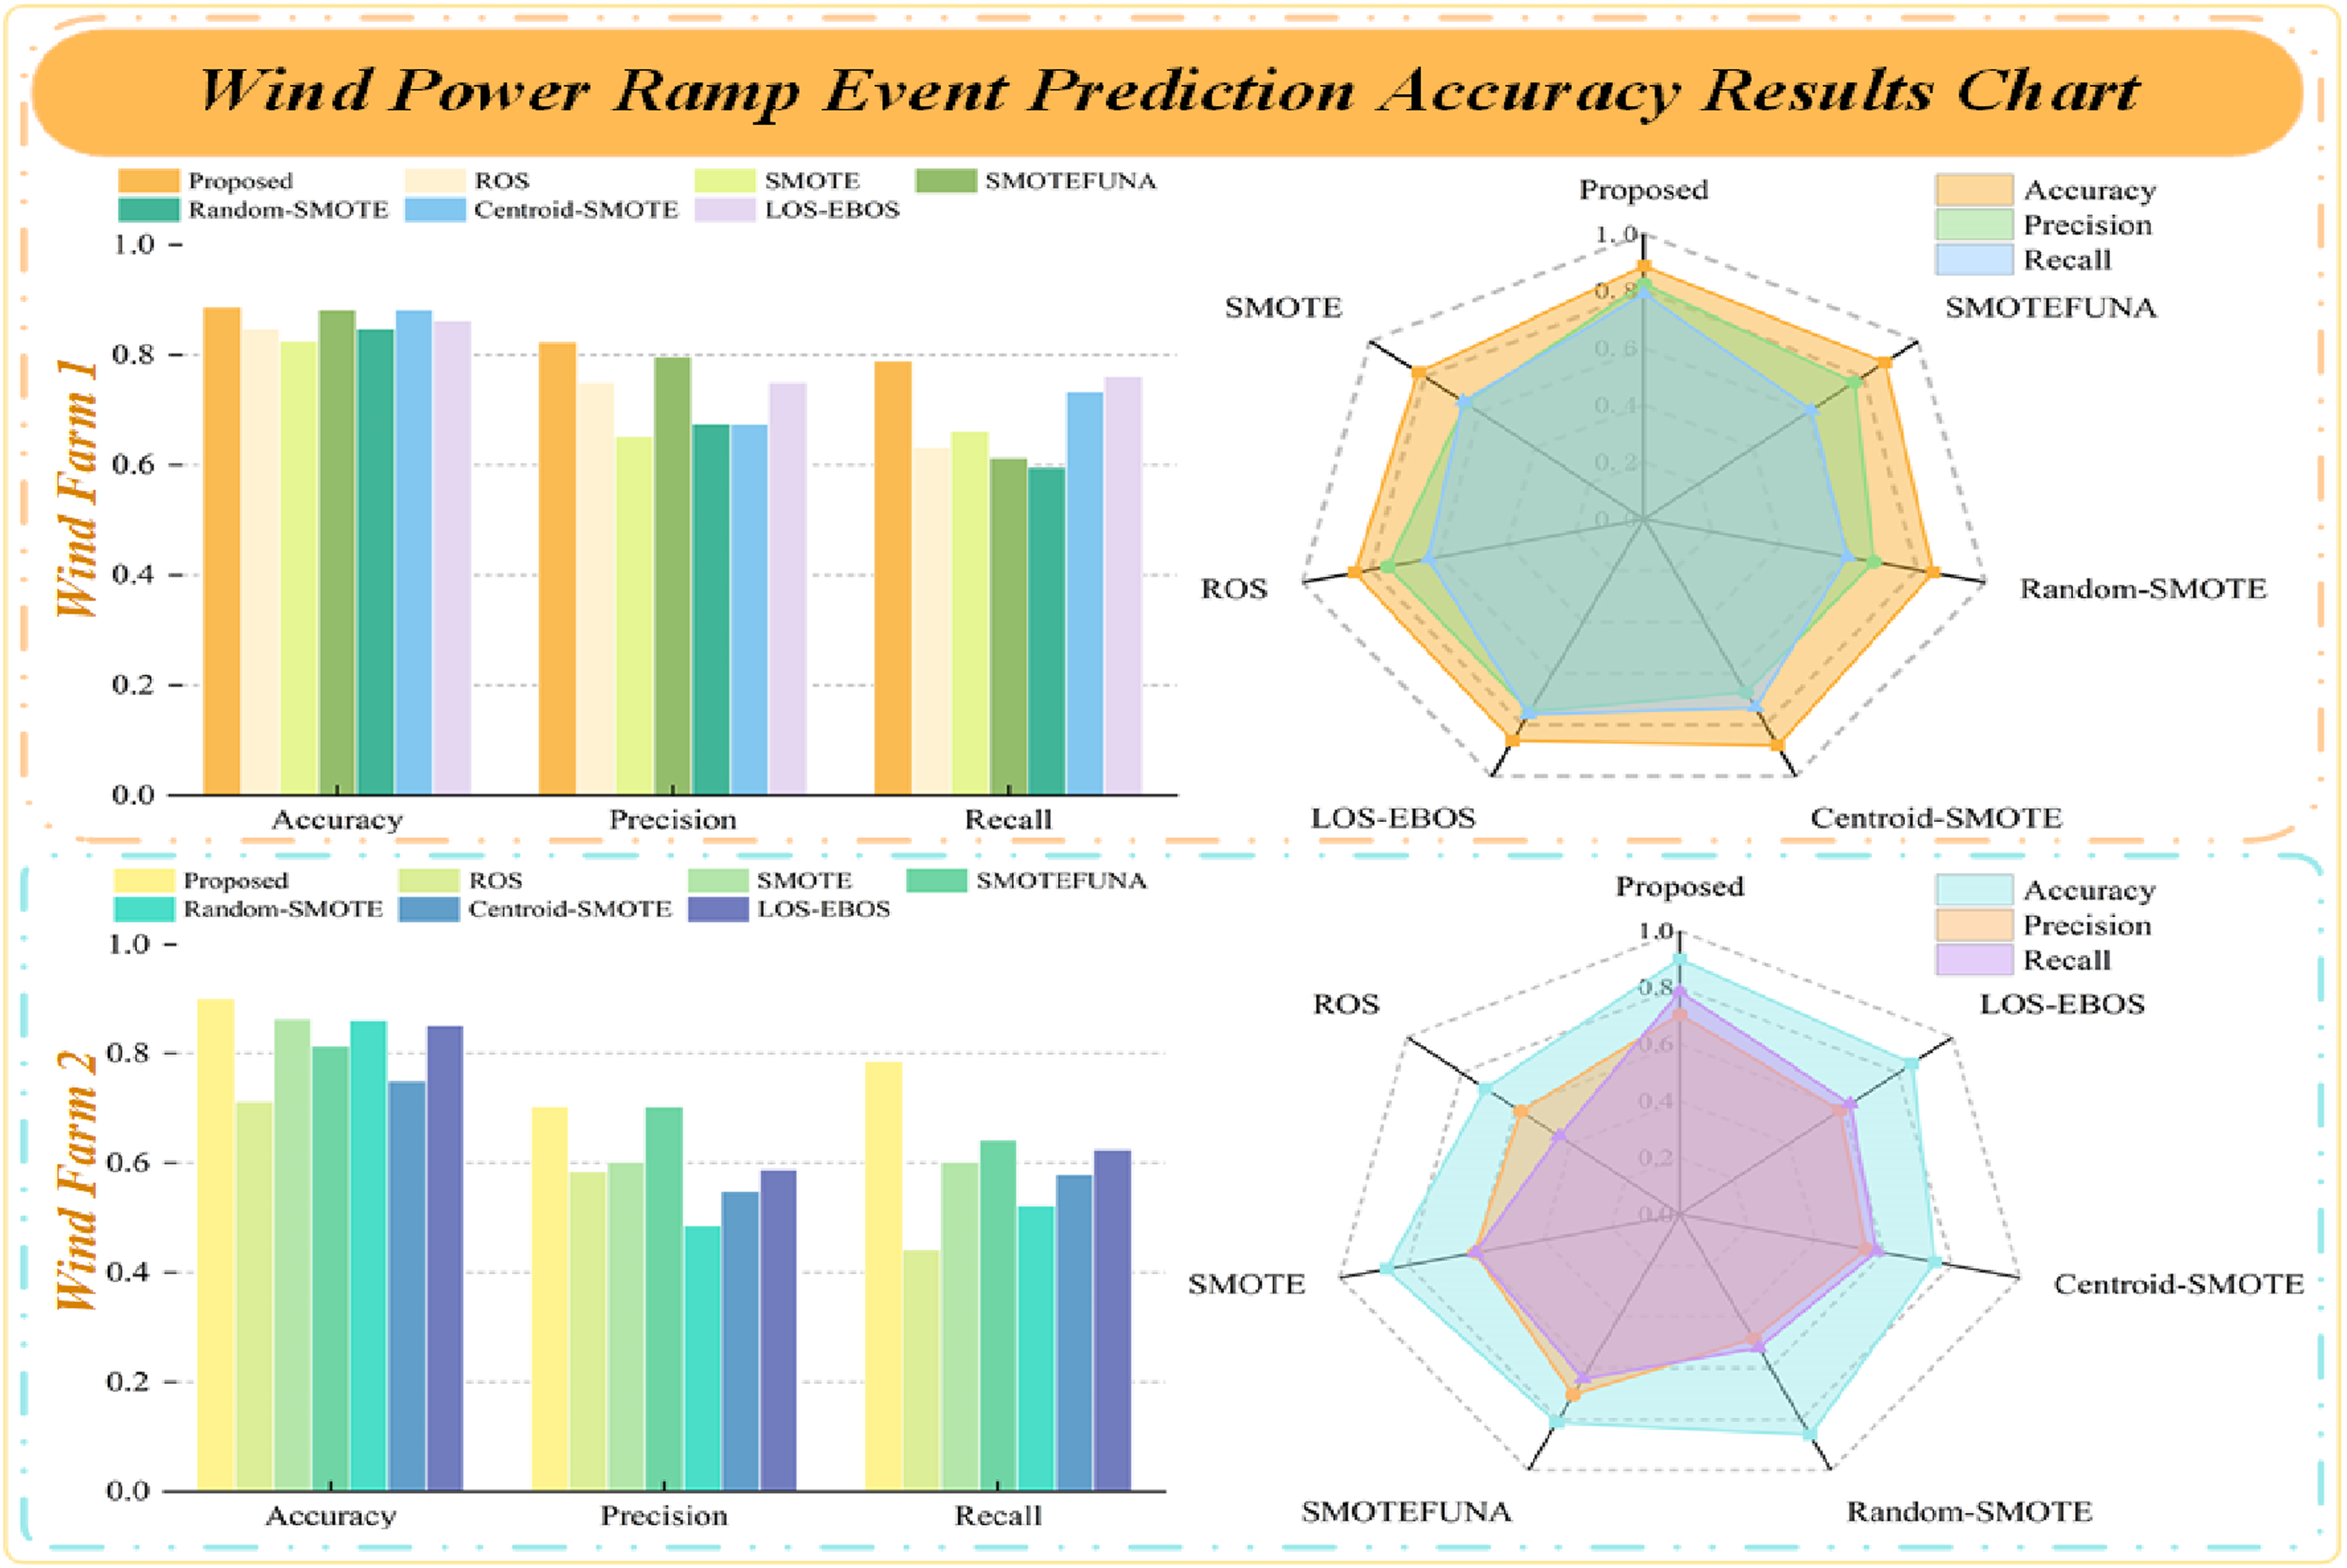
For the three evaluation indexes of accuracy, precision and recall rate, the closer their values are to 1, the more the superiority of sampling method can be reflected. According to the results in Figure 11, it can be seen that for both Wind Farm 1 data and Wind Farm 2 data, the data processed by the proposed oversampling method show higher accuracy and precision in the WPREs recognition.
Comparison with other prediction models
In order to verify the model prediction of ramp event samples and non-ramp event samples after oversampling, the SCNs model is used to predict the large samples (non-ramp events), and the results are shown in Figure 12 and Table 7; the BiLSTM model is used to predict the small samples (ramp events), and the results are shown in Figure 13 and Table 8. Predicted results of majority class samples. Prediction results of non-ramp events. Predicted results after oversampling of minority class samples. Prediction results for a sample of ramp events.

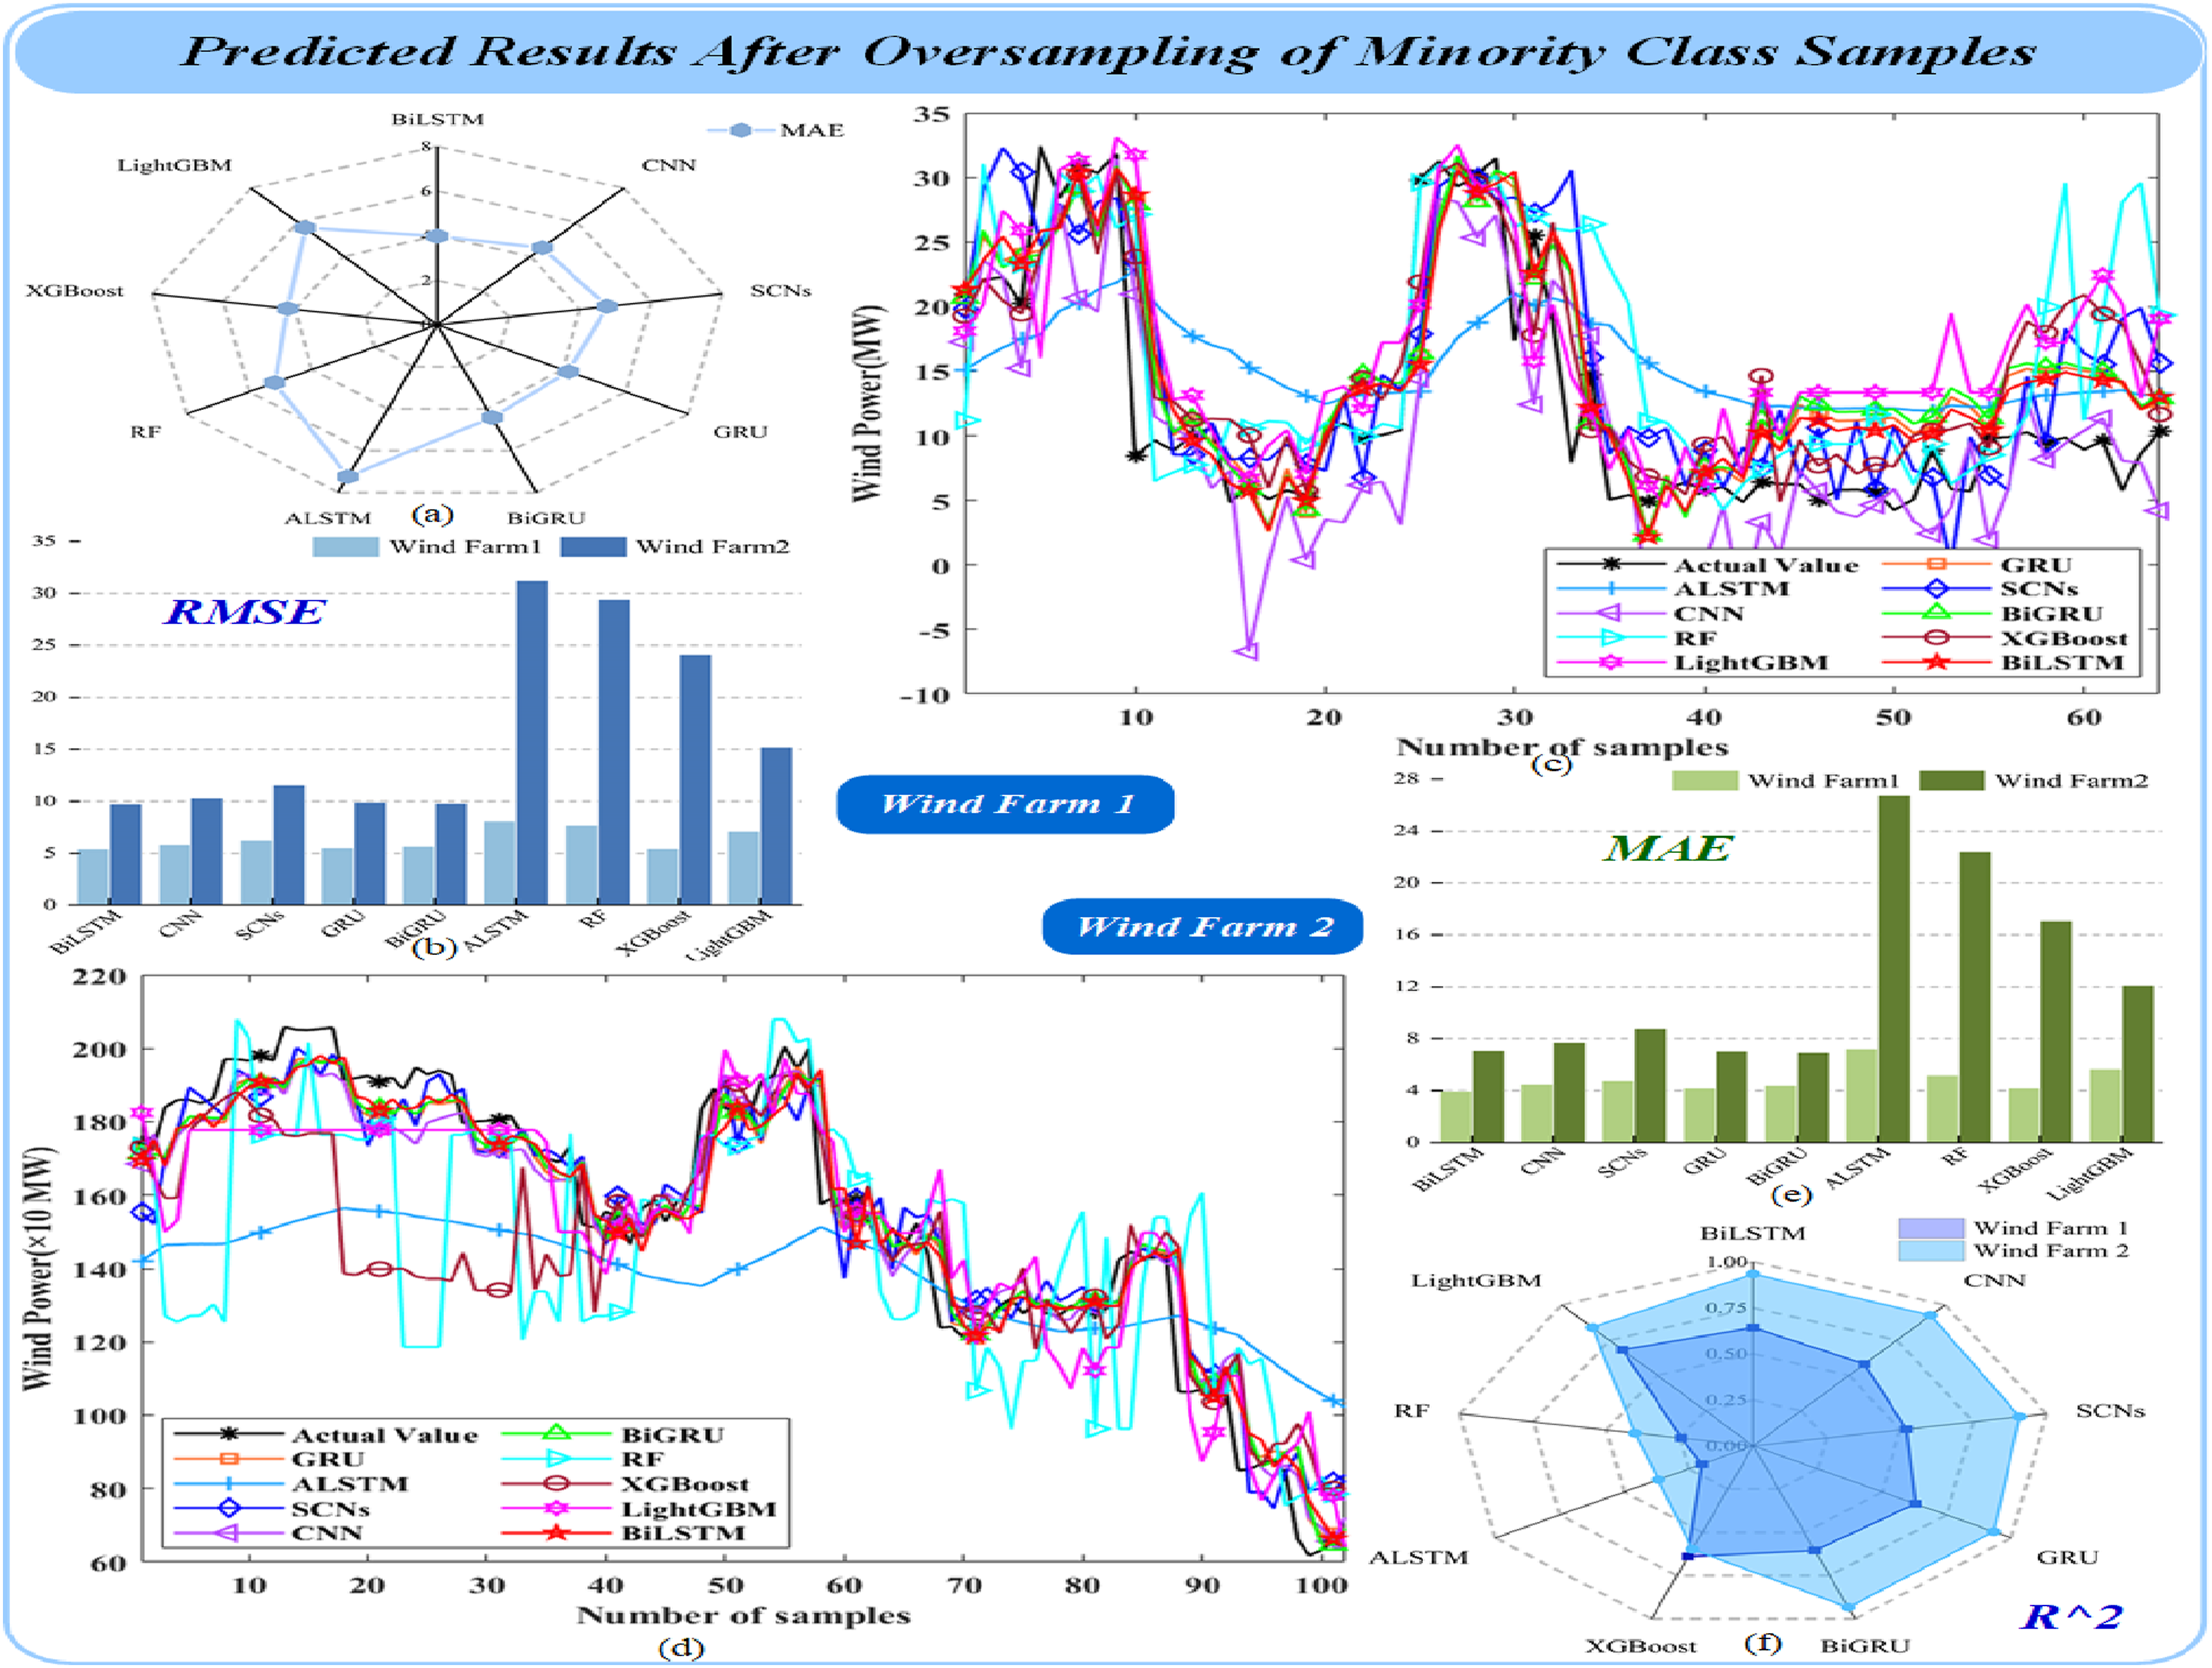
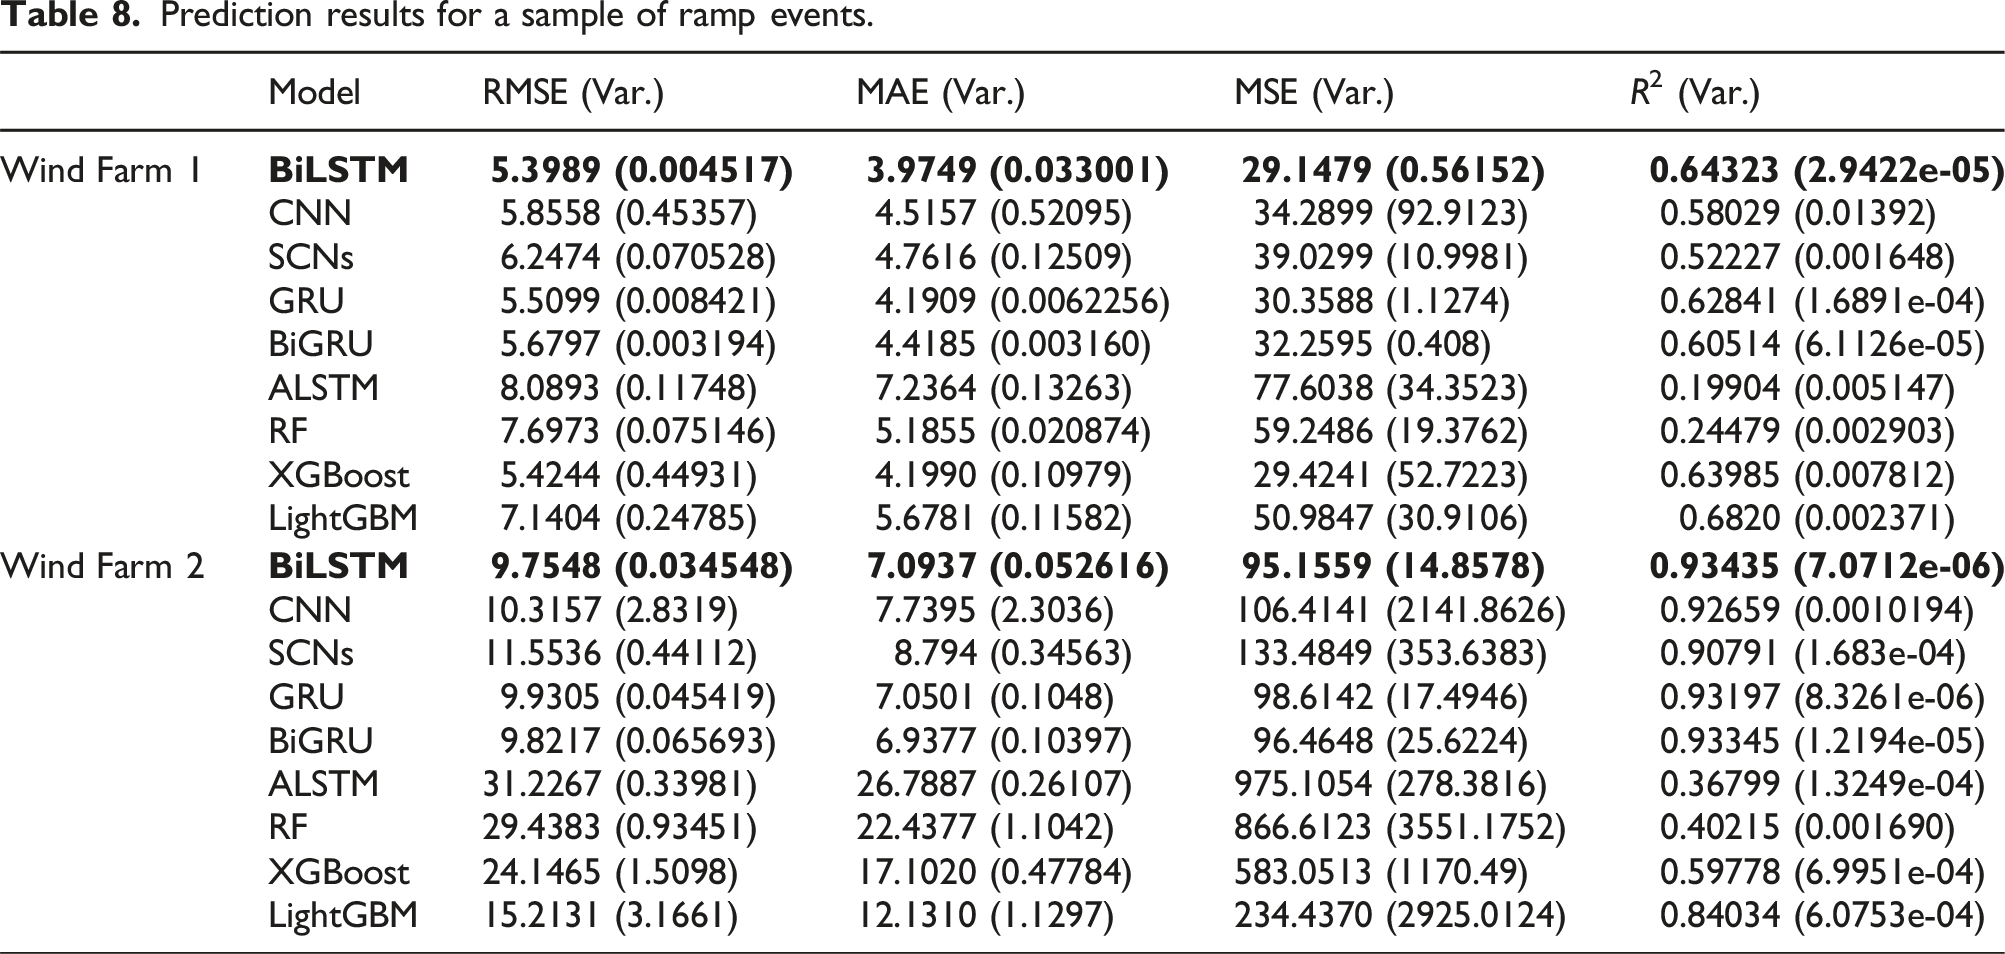
Figure 12(c) and (d) shows the prediction results of large samples (non-ramp events) in Wind Farms 1 and 2 by using different models. It is not difficult to see from the amplified Figure 12(a) and (e) that the SCNs model has a higher degree of fitting than other models, and the specific indicators are shown in Table 7. It can be observed from Table 7 that, using Wind Farm 1 as an example, the SCNs model proposed in this paper achieved prediction results with RMSE = 3.5235, MAE = 1.8644, MSE = 12.4153, and R2 = 0.88754. While the MAE is marginally higher than that of the RF and XGBoost models, the other metrics significantly outperform the comparison models. In addition, it can be seen from Figure 12(f) that the R2 result by the SCNs model in two wind farm data is closest to 1, which verifies the superiority of SCNs model in processing large samples (non-ramp events).
Figure 13(c) and (d) shows the prediction results of small samples (ramp events) in Wind Farms 1 and 2 by using different models. It is not difficult to see from the prediction results that the BiLSTM model has a higher degree of fitting than other comparison models, and the specific indicators are shown in Table 8. It can be observed from Table 8 that, taking RMSE index as an example, the results are as follows: RMSE BiLSTM = [5.3989, 9.7548], RMSE CNN = [5.8558, 10.3157], RMSE SCNs = [6.2474, 11.5536], RMSE GRU = [5.5099, 9.9305], RMSE BiGRU = [5.6797, 9.8217], RMSE ALSTM = [8.0893, 31.2267], RMSE RF = [7.6973, 29.4383], RMSE XGBoost = [5.4244, 24.1465], and RMSE LightGBM = [7.1404, 15.2131]. From these results, it can be seen that the MAE index of the BiLSTM model is lower than that of the other comparison models. Moreover, by observing the evaluation index charts of each model in Figure 13(a), (b), (e), and (f), it can also be intuitively seen that the BiLSTM model used in this paper is superior to other comparison models, respectively. The BiLSTM model is proved to be superior when dealing with small samples (ramp events).
Finally, in order to obtain the overall prediction result, the prediction results of SCNs model and BiLSTM model are weighted to get the final prediction result. The purpose of this step is to balance the performance of two models on different classes of samples, as shown in Figure 14 and Table 9. This method can evaluate the performance of the model on different types of samples more comprehensively, and help to improve the robustness and generalization ability of the model. Overall prediction results. Overall prediction results.
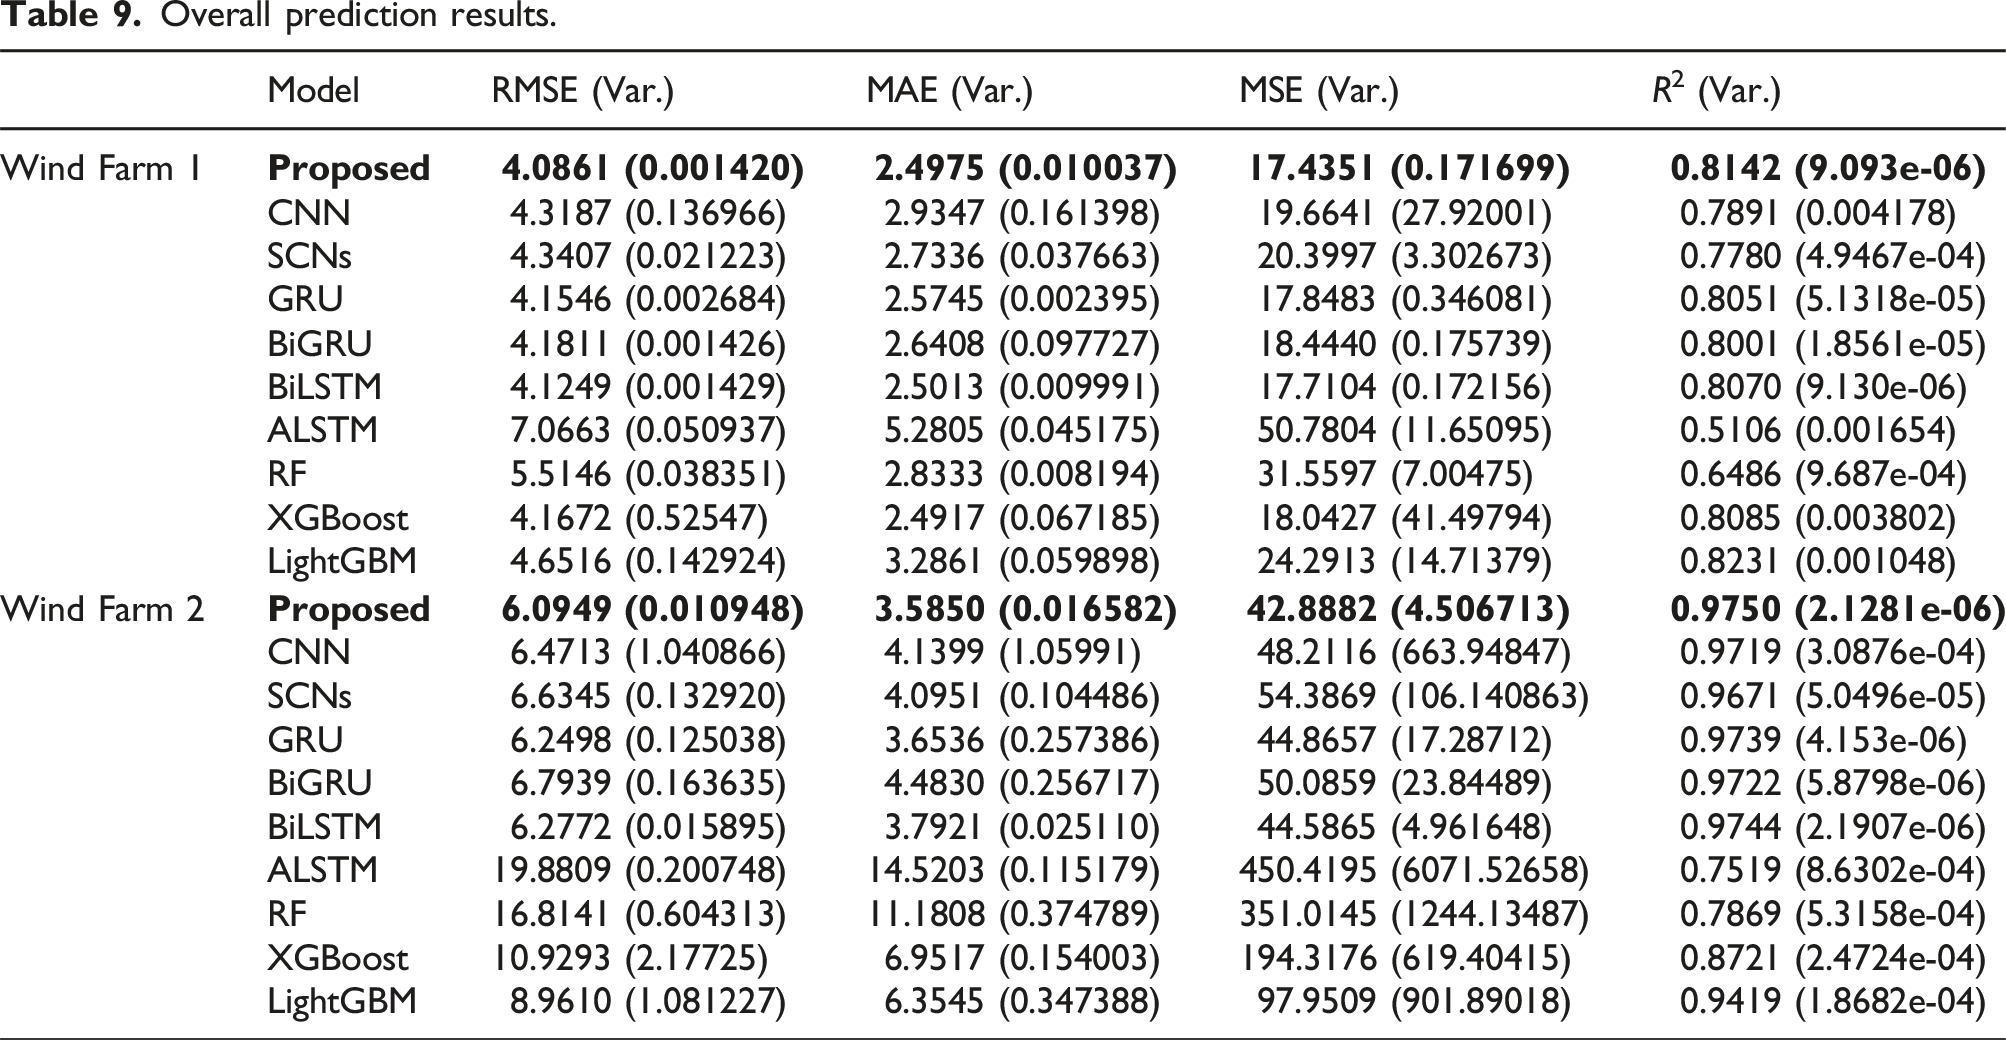
Figure 14 and Table 9 show the prediction results obtained by weighted combination of SCNs for non-ramp events and BiLSTM for ramp events. As can be seen from Figure 14, using RMSE as an example, the evaluation index of the SCNs-BiLSTM combination model proposed in this paper is RMSE Proposed = [4.0861, 6.0949], which demonstrates superior performance compared to the other comparison models by 3.88% to 15.49%.
From the prediction experiments conducted on both large and small samples, it is evident that despite the hybrid model proposed in this paper having slightly higher complexity and computational cost compared to other methods, the results from various evaluation indexes demonstrate superior prediction performance. All prediction indexes exceed those of other models, underscoring the feasibility and effectiveness of the proposed approach. Moreover, although the two datasets used in this study differ in length, the proposed method achieves optimal prediction performance on both short and long datasets, thereby validating its robustness across datasets of varying lengths.
Conclusions
In view of the influence of ramp events on wind power prediction, this paper proposes a method of WPREs recognition based on the SDT algorithm and a new definition, which divides the original data into two categories: ramp events and non-ramp events. For the problem that the ramp events are small sample events with low probability of occurrence, the Interval-SMOTE oversampling method is put forward to expand the ramp event samples. Through simulation and comparative analysis, the following conclusions are drawn: (i) In this paper, the SDT algorithm is integrated with the ramp events definition, and the original data is divided into ramp events and non-ramp events. And this method can not only accurately identify the ramp events of wind power, but also judge the direction of the wind power ramp events. (ii) After finding that the number of ramp events are much smaller than the number of non-ramp events may affect the subsequent prediction, this paper adopts the Interval-SMOTE oversampling method to expand the ramp event samples, which not only solves the problems of sample number, but also make the generation points retain the original data trend to the greatest extent. (iii) Since SCNs model and BiLSTM model have the best effect in processing large samples and small samples, respectively, this paper adopts the parallel model of SCNs-BiLSTM in the final prediction part to obtain the final prediction result, and the superiority of the model is verified by the experimental results.
Finally, this method exhibits certain limitations. Regarding complexity, while the multi-model parallel approach significantly enhances accuracy, it also prolongs the corresponding simulation runtime. Additionally, the width of the “door” value ΔE in the SDT algorithm influences the precision of ramp identification, making this an area for future research to address.
Footnotes
Declaration of conflicting interests
The author(s) declared no potential conflicts of interest with respect to the research, authorship, and/or publication of this article.
Funding
The author(s) disclosed receipt of the following financial support for the research, authorship, and/or publication of this article: This work was supported in part by the National Natural Science Foundation of China (62203197), Basic Scientific Research Project of Education Department of Liaoning Province (Key Research) (JYTZD2023074), and Liaoning Revitalization Talents Program (XLYC2007091).