
Abstract
Increasingly, researchers are using perceptual or subjective measures of organisational performance, but our review of the literature reveals that these measures are rarely validated. We introduce Rasch model analysis to the management field and apply it to a psychometric analysis of an organisational performance scale developed in 1996 by Delaney and Huselid. Although this scale has been widely used, the present work is the first substantial investigation of its psychometric properties. The results of Rasch model analysis reveal that the original hypothesised two-factor structure was not supported but a revised three-factor structure with good psychometric properties that reflect internal, external and market performance was supported. Evidence for construct validity was found for internal and market performance subscales but not for external performance. This paper presents an important methodological advance for management research by demonstrating the evaluation of the psychometric properties of this scale through Rasch model analysis. The findings expand our understanding of the underlying structure of organisational performance and have implications for a wider application of Rasch model analysis in the management field.
1. Introduction
Management researchers often use multi-item perceptual or subjective measures of organisational performance that ask respondents (key informants) to report about organisational performance (Richard et al., 2009). However, while perceptual measures are becoming more common, the validation of those scales is far less common. This under-reporting of psychometric evidence to justify the use of these measures is a significant deficit in this field of research. A recent review of organisational performance measures concluded that there is an urgent need for reliable and valid measures of organisational performance (Richard et al., 2009). Venkatraman and colleagues have also called for a more sophisticated approach to scale development and validation (e.g. Bartunek et al., 1993; Venkatraman, 2008; Venkatraman and Grant, 1986). To address such calls, we introduce Rasch model analysis to the management field and apply it to a psychometric analysis of a multi-item perceptual measure of organisational performance. This approach to validation allows us to investigate the properties of the organisational performance scale at several levels by providing a detailed analysis on how respondents are responding to the items as well as an understanding of the relationship between items and respondents.
Organisational performance has recently been described as the ultimate phenomenon of interest in management and business research (Richard et al., 2009). Heightened awareness of corporate governance matters and recent events such as the collapse of the US banking system in September 2008 and the ensuing global financial crisis have also led to increasing pressure for effective monitoring and measurement of organisational performance (Cascio and Boudreau, 2008; Kanter, 2009; Yeoh, 2010). The importance of organisational performance as an outcome variable in management research is reflected in the wide range of studies in this field, both in Australia and overseas (see, for example, Lee et al., 2009; Welch, 2003).
Substantial efforts have been made to measure organisational performance and the resulting range of measures is a reflection of the fact that organisational performance is not a well-defined construct (Richard et al., 2009). According to Richard et al., organisational performance includes three specific areas: financial performance (e.g. profits); product market performance (e.g. sales); and shareholder or capital market return. Objective measures (e.g. publicly available indicators) are often used to measure organisational performance. However, organisational performance is a complex construct and single indicators of performance cannot encompass this complexity, so multi-item perceptual measures of organisational performance are increasingly used in academic studies in addition to the single-item objective measures. Furthermore, it is important to note that the areas of financial performance discussed by Richard et al. are appropriate for private sector (or for-profit) organisations but less so for public sector or non-governmental organisations.
These perceptual measures are useful substitutes for objective measures in circumstances where organisations are reluctant to provide specific objective data (e.g. unlisted organisations). They are also used by researchers because they offer a means to measure performance across organisations in different industries and sectors in a way that is not possible with objective measures. In contrast to specific objective measures, perceptual measures tend to measure a broader concept of performance (Wall et al., 2004) by including both financial and non-financial aspects of performance. In using perceptual measures, organisations can also be asked to compare their organisation’s performance to that of other organisations in their industry, which incorporates an intrinsic benchmarking process (Kalleberg and Moody, 1994). This process contrasts with objective measures which are not benchmarked against other organisations but are absolute measures of performance (Wall et al., 2004).
Despite their widespread use, perceptual measures of organisational performance are often viewed as psychometrically unsound due to their purported subjective biases and increased measurement error compared with objective indicators (Richard et al., 2009). While there is some evidence of convergent validity between perceptual and objective measures of organisational performance (Wall et al, 2004), no study has comprehensively applied sophisticated psychometric techniques to determine the validity of their measures. Consequently, the purpose of this study is to fill this measurement gap by introducing Rasch modelling to the management field through an evaluation of a perceptual measure of organisational performance. An examination of the literature through the Proquest database for ‘Rasch’ in the document text and ‘management’ as subject revealed that Rasch analysis is a largely overlooked technique in the management field. In this field, only six dissertations and five academic papers referred to or used Rasch analysis in some form in their studies. With the exception of one dissertation (Martin, 2010), there have been no substantial attempts to demonstrate the use and benefits of the Rasch model in the management field. We have chosen this technique as it allows for a detailed analysis of both scale items and respondents. The researcher is then able to trace model misfit to items and respondents providing useful information for decision making in scale evaluation.
To highlight the problem of a lack of validation for measures of organisational performance, we conducted a review of scales currently in use in the management field. Our purpose was to examine the use of perceptual measures of organisational performance and determine what psychometric analysis was conducted and reported for these scales. In order to manage the magnitude of the task we adopted an approach from Boselie et al. (2005) which restricted the time frame of the review and focused on several prominent journals rather than conducting a general search. The journals were Academy of Management Journal, Journal of Management, Strategic Management Journal, Administrative Science Quarterly, Human Resource Management, Human Resource Management Journal and the International Journal of HRM. These journals were chosen because they are relevant to researchers in the management field. Our time frame was limited to 30 years, dating from 1980 to 2010. For a measure to be included in the review it had to contain two or more items that summed to a single score. We collected data on item development, latent structure, reliability and construct validation. A summary of findings is presented in Table 1 below.
Summary of perceived organisational performance measures.

N = 68
We found 68 articles used a perceptual measure of organisational performance that met our criteria. Of these studies, 19% used an existing scale and 81% developed their own scale. Authors that chose to use an existing scale tended to choose the Delaney and Huselid (1996) scale (69%). Where a new scale was developed they were often adapted from existing scales (45%, with 28% using items from the Delaney and Huselid scale in some form). Nearly half of the studies examined did not report the origin of their items or why they were chosen (47%). The most common psychometric analysis reported was reliability analysis which was reported by 63% of studies. An examination of the latent structure (e.g. exploratory factor analysis [EFA]/ confirmatory factor analysis [CFA]) was reported in 34% of studies and only 15% of studies examined the construct validity of the scales they used. Importantly, 29% of studies in our sample did not contain any psychometric details at all for the scale used, which is a substantial omission. This level of analysis and reporting is not an optimal approach to measurement in research; greater attention should be paid to the validity and reliability of perceptual measures that are being used in this field.
1.1 Rasch analysis
The dominant measurement paradigm over the past century has been classical test theory (CTT) but more recently item response theory (IRT) has grown in importance (Embretson and Reise, 2000). Rasch modelling, the focus of this paper, is one of many models that make up the IRT ‘family’ of models and along with techniques from CTT it is often used to develop new or evaluate existing scales. Rasch modelling has been used extensively in education, psychology, medicine and to a much lesser degree marketing. While both approaches have strengths and weaknesses, there are several important differences between these two approaches to measurement. In other fields of research such as psychology and education the debate over the merits of both CTT and IRT of measurement is ongoing (for example see Streiner, 2010). However, we do not seek to argue for the supremacy of either theory; our aim is simply to present one process by which researchers may validate their scales or evaluate other scales they intend to use in their studies.
The advantage of using Rasch modelling is that it allows for a greater understanding of how participants respond to items and how well individual items work within the scale, which is achieved by estimating model fit at both person and item levels. This means that model misfit can be traced back to either persons or items more readily and directly than other techniques from classical test theory. As items and persons are calibrated to the same interval scale it is also possible to investigate how well targeted the items are to the sample and identify measurement gaps within the scale.
In terms of item analysis Rasch modelling allows for the assessment of individual item fit and the adequacy of the chosen response format. Individual participant analysis is also possible as Rasch provides tools to investigate participant responses in detail. For example, the software builds a model of actual expected responses for each participant on each item on the basis of their responses to other items. The advantage of this is that inconsistent responding or potential guessing can be identified for each participant across all items. Other useful features include differential item functioning used to investigate items that may perform differently across respondent groups and the conversion of raw scores to a linear score for parametric analysis, which is more appropriate for parametric testing than summated ordinal scales.
2. Method
2.1 Sample and procedure
Participating organisations were recruited via a mail survey conducted in October–November 2009. The survey was sent to one informant per organisation. The respondents to our survey were chief executive officers, chairpersons, board members and company secretaries (the latter three are referred to as ‘board members’) and senior executives (e.g., chief financial officer) of the organisations. We chose the CEO and other senior management as respondents as they have been recognised for their substantial knowledge of the organisation (Cycyota and Harrison, 2006; Hambrick and Mason, 1984; Sharfman, 1998). We obtained our sample from the IBIS World Company Wizard database which is a listing of the largest companies in Australia/New Zealand as measured by revenue (IBIS World, 2009).
Responses were received from senior members of 195 organisations; most respondents were either board members (42%), CEOs (43%) or senior executives (13%); most were male (83%). The sample consisted largely of Australian-owned organisations (79%) and for organisations where employee data was available most were large organisations (≥200 employees: 59%) while few were medium (20–199 employees: 11%). All ANZSIC industries were represented in the sample but the greatest number of responses was received from the manufacturing (12%), public administration and safety (12%), health care and social assistance (9%) as well as wholesale trade (12%). The questionnaires were identifiable by a code which allowed for the collection of relevant financial data from the IBIS World ‘Company Wizard’ database. No incentives were offered for the completion of the survey and respondents were assured of confidentiality.
2.2 Measures
Two categories of performance measures were used in this study: a perceptual measure of performance and two objective measures. The perceptual data were collected from the survey respondents and the objective measures were collected from the IBIS World Company Wizard database.
2.2.1 Perceived organisational performance
We have chosen to use the 11-item scale specified by Delaney and Huselid (1996) as an illustrative example in this study. This scale was chosen because it has the benefits of being short, versatile and allows for a comparison across both sector (e.g. both public and private) and industry (e.g. manufacturing). This is a widely used scale that has undergone some psychometric analysis since its initial development. As shown above, it is also the most widely used perceptual measure of organisational performance in the management field.
This multi-item measure is comprised of two subscales that Delaney and Huselid called perceived organisational performance (seven items) and perceived market performance (four items). The measure has been used in many studies in its original (e.g. Newbert, 2008; Perry-Smith and Blum, 2000; Rodwell and Teo, 2008) and adapted forms (e.g., Takeuchi et al., 2007). The items in the scale were originally derived from the 1991 National Organisations Study (NOS). The 11 items selected from the NOS database represented five broad dimensions: products and services (quality, development), employees (ability to attract, ability to retain), customer satisfaction (satisfaction), employee relations (employees in general, management and employees) and market performance (marketing, growth in sales, profitability, market share). In the Delaney and Huselid scale, informants are asked “How would you compare your organisation’s performance over the past three years to that of other organisations in your industry sector?” on a 4-point scale (1 = worse; 2 = about the same; 3 = somewhat better; and 4 = much better).
The two subscales were specified theoretically rather than tested with either exploratory or confirmatory factor analysis. However, this structure has been largely supported in two later studies using exploratory factor analysis (Chan et al., 2004) and confirmatory factor analysis (Tzafrir, 2005) that has provided limited preliminary information on the validity of the scale. While the Tzafrir study reported good model fit for the Delaney and Huselid structure, Chan and colleagues did not provide details of their analysis except to say it was consistent with the Delaney and Huselid model. An alternative, three-factor structure has been proposed by St-Onge et al. (2004) where they maintained the perceived market performance scale as specified by Delaney and Huselid (1996) but split the perceived organisational performance subscale into two smaller subscales. This split was based on whether the items were associated with employees or products and customers and was justified conceptually but no statistical analysis was reported to validate their use of the scale in this form.
Reliability statistics have been regularly reported for the Delaney and Huselid scale and Delaney and Huselid (1996) reported good reliability for both the perceived organisational performance (α = 0.85) and the perceived market performance (α = 0.85) subscales. This result has been replicated to varying degrees with later studies reporting similar levels of reliability (e.g. Chan et al.; 2004; Newbert, 2008; Perry-Smith and Blum, 2000). However, slightly lower levels of reliability for this scale have been reported in some studies (e.g. Harel and Tzafrir, 1999; Tzafrir, 2005).
2.2.2 Objective organisational performance
We have selected two standard objective measures of organisational performance: return on assets and Tobin’s Q. Return on assets is a widely used accounting measure of organisational performance, while Tobin’s Q is a popular mixed accounting/financial market measure of organisational performance (Richard et al., 2009). The data were collected from the IBIS World Company Wizard, a listing of organisations and accompanying financial information. Organisational performance data were collected for return on assets (n = 165), total assets (n = 151) and market capitalisation (n = 27). These data were not available for all organisations in the sample. The absence of data for some organisations is partly due to the inclusion of government and not-for-profit organisations but also because private companies do not always disclose financial data. Tobin’s Q was also calculated (market capitalisation/total assets). Due to skewness, return on assets and Tobin’s Q were log transformed.
2.3 Statistical analysis
2.3.1 Rasch model analysis
Rasch model analysis was conducted using RUMM2020 software (Andrich et al., 2003). In Rasch model analysis there are three measures of overall model fit: the item–trait interaction statistic, item fit residual values and person fit residual values. In good model fit the item–trait interaction statistic is associated with a non-significant chi-square value (Bonferroni corrected), while a significant chi-square value indicates misfit between the model and the data. The fit residual values for respondents and items are expected to have a mean of zero and a standard deviation of one, so a mean greater than one or a standard deviation greater than 1.5 suggests the presence of respondents or items that do not fit the Rasch model (Pallant and Tennant, 2007). The internal consistency of the scale can be established from the person separation index (PSI) and the values of the PSI are evaluated in a similar manner to that of Cronbach’s alpha (Pallant and Tennant, 2007). Prior to conducting Rasch model analysis in scales with three or more response options, a choice must be made between using the Andrich Partial Credit Model or using the Masters Rating Scale Model (Tennant and Conaghan, 2007). RUMM2020 provides a likelihood ratio test which will indicate which model is more appropriate for the analysis. If the likelihood ratio test is significant then the Partial Credit Model is more appropriate; if not, the Rating Scale Model may be used.
Investigating model misfit requires (1) an inspection of individual item and/or respondent fit residuals and their corresponding chi-square probability values, and (2) the assessment of whether the respondents are using the response options in a consistent and logical manner. If the overall fit residual statistics indicate that there are misfitting items or respondents it is necessary to investigate individual fit residual and chi-square probability values for each individual item or respondent. These individual fit residuals should not have an absolute value greater than 2.5. A fit residual value less than −2.5 indicates overfit and a fit residual value greater than +2.5 represents misfit that needs to be addressed. The individual chi-square probability values should be non-significant (Bonferroni corrected). Item misfit indicates that the item deviates from its expected relationship with the other items and does not adequately represent the latent trait in question (Bharkta et al., 2005). Respondent misfit is an equally important issue to address where an individual respondent’s fit residual is greater than +2.5, which means that the respondent’s answers deviate from model expectations and that the individual may be responding in an inconsistent manner.
Proper use of response options will result in ordered thresholds. A threshold is the point where the probability of a respondent scoring zero or one on that item is 50/50 and in polytomous scales there is a threshold between each response point. Disordered thresholds can result from inconsistent responding or from response terms that are semantically similar (e.g. often, frequently) and therefore lead to confusion (Pallant and Tennant, 2007). In Rasch model analysis, determining whether respondents are using response options correctly can be established by inspecting a threshold map which is a visual display of the response thresholds for each item. If the map indicates that a disordered threshold is present, then category probability curves are consulted to determine how response options are being used inconsistently.
To conform to the Rasch model a scale must demonstrate invariance with respect to both the individuals responding to the scale and the items in the scale (Rasch, 1961). The lack of invariance within the sample can be assessed by investigating differential item functioning (DIF). DIF occurs when respondents from different subgroups within the sample exhibit the same level of the measured trait but respond differently across some items. In Rasch model analysis DIF can be viewed by inspecting the item characteristic curves for the target items and analysis of variance can be used to determine whether or not the groups respond in a significantly different way.
In addition to invariance across respondent groups, conformance to the Rasch model requires that the scale be unidimensional and that the items are locally independent; that is, the correlation between items must reflect only the latent trait under examination. To determine whether multidimensionality or local dependence exists, a principal component analysis is conducted on the residuals. Where local dependence is present a correlation above 0.30 between residuals for the relevant items will be observed; this may occur in the event of multidimensionality or response dependence (Tennant and Conaghan, 2007). Response dependence occurs where the response to one item is dependent on the response to another. A principal component analysis of the residuals is also used to investigate multidimensionality. The items will load either positively or negatively on the first residual factor forming two subsets of items. Independent t-tests are conducted for each respondent in the sample between their scores on these two subsets. Multidimensionality is indicated when the number of cases with significantly different scores exceed 5%. A 95% confidence interval for a binomial test of proportions is then calculated: if the confidence interval contains the value 0.05 then the scale is considered unidimensional; if not, then this is confirmatory evidence of the scale’s multidimensionality.
Finally, to investigate whether the scale is well targeted RUMM2020 provides a person–item threshold map, a visual display of the respondents and items calibrated to the Rasch continuum. The ideal would be a good spread of items across the range of scores, which indicates that a scale is well targeted. Gaps along the continuum would indicate levels of the latent trait that are not targeted by the scale.
2.3.2 Construct validity. Researchers currently use perceptual scales on the understanding that they measure organisational performance. However, in order to be considered valid measures of organisational performance we must understand how perceptual scales are associated with other more objective measures of performance. Thus, we sought also to establish preliminary construct validity for this scale by examining the correlation between the Delaney and Huselid (1996) scale and two objective measures of organisational performance. We selected two objective measures of organisational performance: an accounting (return on assets) and a mixed accounting/financial measure (Tobin’s Q). Rasch location scores (ordinal level scores that have been converted to interval scores) were calculated for each subscale of the Delaney and Huselid scale. Pearson product–moment correlations were calculated to determine the relationship between the subscales and the objective measures of organisational performance.
3. Results
3.1 Rasch model analysis
The items of the perceived organisational performance and the perceived market performance subscales were individually subjected to Rasch model analysis. To justify the use of a partial credit model as opposed to the rating scale model a likelihood ratio test was conducted for these subscales. The tests were significant so it was considered appropriate to use the partial credit model for analysis. Overall fit statistics for these analyses can be found below in Table 2.
Model fit statistics for original and revised scales.
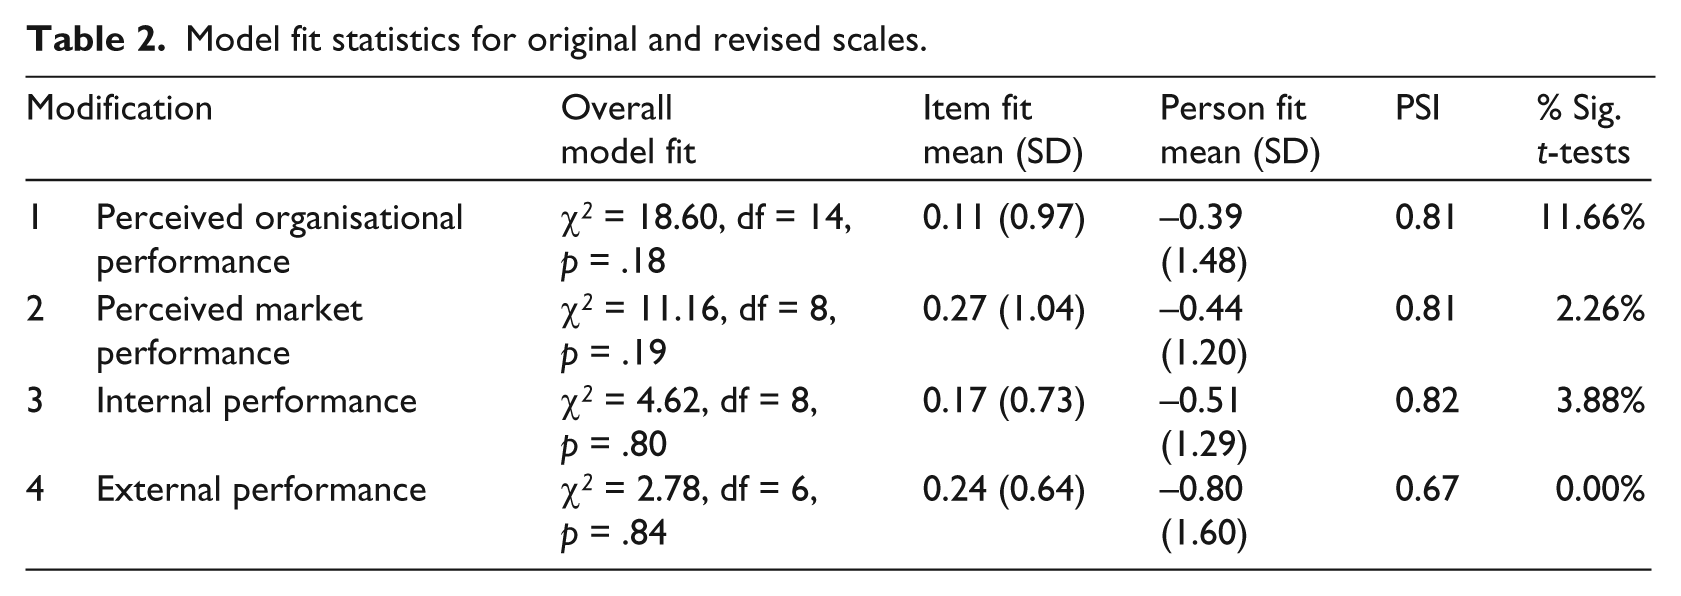
3.1.1 Delaney and Huselid model
Results revealed that the item–trait interaction statistics were non-significant for both subscales, which demonstrates good model fit. Respondent fit statistics revealed that the means were close to zero and standard deviations less than 1.5, indicating that there were no misfitting respondents in the sample. Item fit statistics were also within range indicating that there was no misfit between the items and the respondents. The person separation index, similar to Cronbach’s alpha, was good for both subscales. The perceived organisational performance subscale and the perceived market performance subscale both obtained a PSI of 0.81, indicating good reliability. We also report the Cronbach’s alpha for comparative purposes: perceived organisational performance (α = 0.82), perceived market performance (α = 0.81).
In addition to the person–item analyses, tests of local independence and dimensionality were conducted by running a principal component analysis (PCA) on the residuals. The PCA revealed residual correlations above 0.30 for items ability to attract essential employees and ability to retain essential employees (0.38), and relations between management and employees and relations among employees in general (0.34). As these correlations were only slightly above 0.3 all items were retained. The PCA also established the two most divergent groups on items within this subscale. Results revealed that the items development of new products, service, or programs, quality of products, service, or programs and satisfaction of customers or clients loaded strongly on the positive factor while the items ability to attract essential employees, ability to retain essential employees, relations between management and employees and relations among employees in general loaded on the negative factor. Independent t-tests revealed that 11.7% of the sample had significantly different scores on these two subsets of items indicating that the scale was multidimensional. A 95% confidence interval calculated for these t-tests ranged from 0.06 to 0.12. As this range does not contain the value 0.05 we can conclude that this subscale is multidimensional.
Principal component analysis of the perceived market performance subscale revealed no correlations between residuals above 0.30 indicating that the local independence assumption was not violated. The PCA of the residuals determined that the marketing and profitability items loaded strongly on the positive factor while growth in sales and market share loaded on the negative factor. Results revealed that only 2.3% of the sample had significantly different scores on these subsets of items, providing evidence for the unidimensionality of this construct.
3.1.2 Revised model. Initial analysis of the Delaney and Huselid scale indicated multidimensionality for the perceived organisational performance subscale, suggesting that it represents two components relating to either employees or customers. These two new components were individually subjected to Rasch model analysis to determine their psychometric properties as separate subscales. The two components, which we have termed internal and external organisational performance, displayed a good fit between the data and the model as shown by the non-significant item–trait interactions and item fit statistics for both subscales were within range. Respondent fit statistics were within range for the internal performance subscale but not for the external performance subscale. Individual respondent analysis revealed no respondent with fit residuals larger than +2.5, but there was a large cluster of respondents with negative fit residuals lower than −2.5 indicating overfit; however, as the overall model fit was good, these respondents were not removed from the analysis.
The internal performance subscale displayed good PSI (α = 0.84) while the external performance subscale displayed average PSI (α = 0.67). No disordered thresholds were observed, indicating that the respondents were using the response format appropriately. Principal component analysis of the residuals indicated that both new subscales were unidimensional and that the local independence assumption was not violated in either subscale. Table 3 below displays the individual item statistics for the final model.
Individual item fit statistics for final Rasch model.
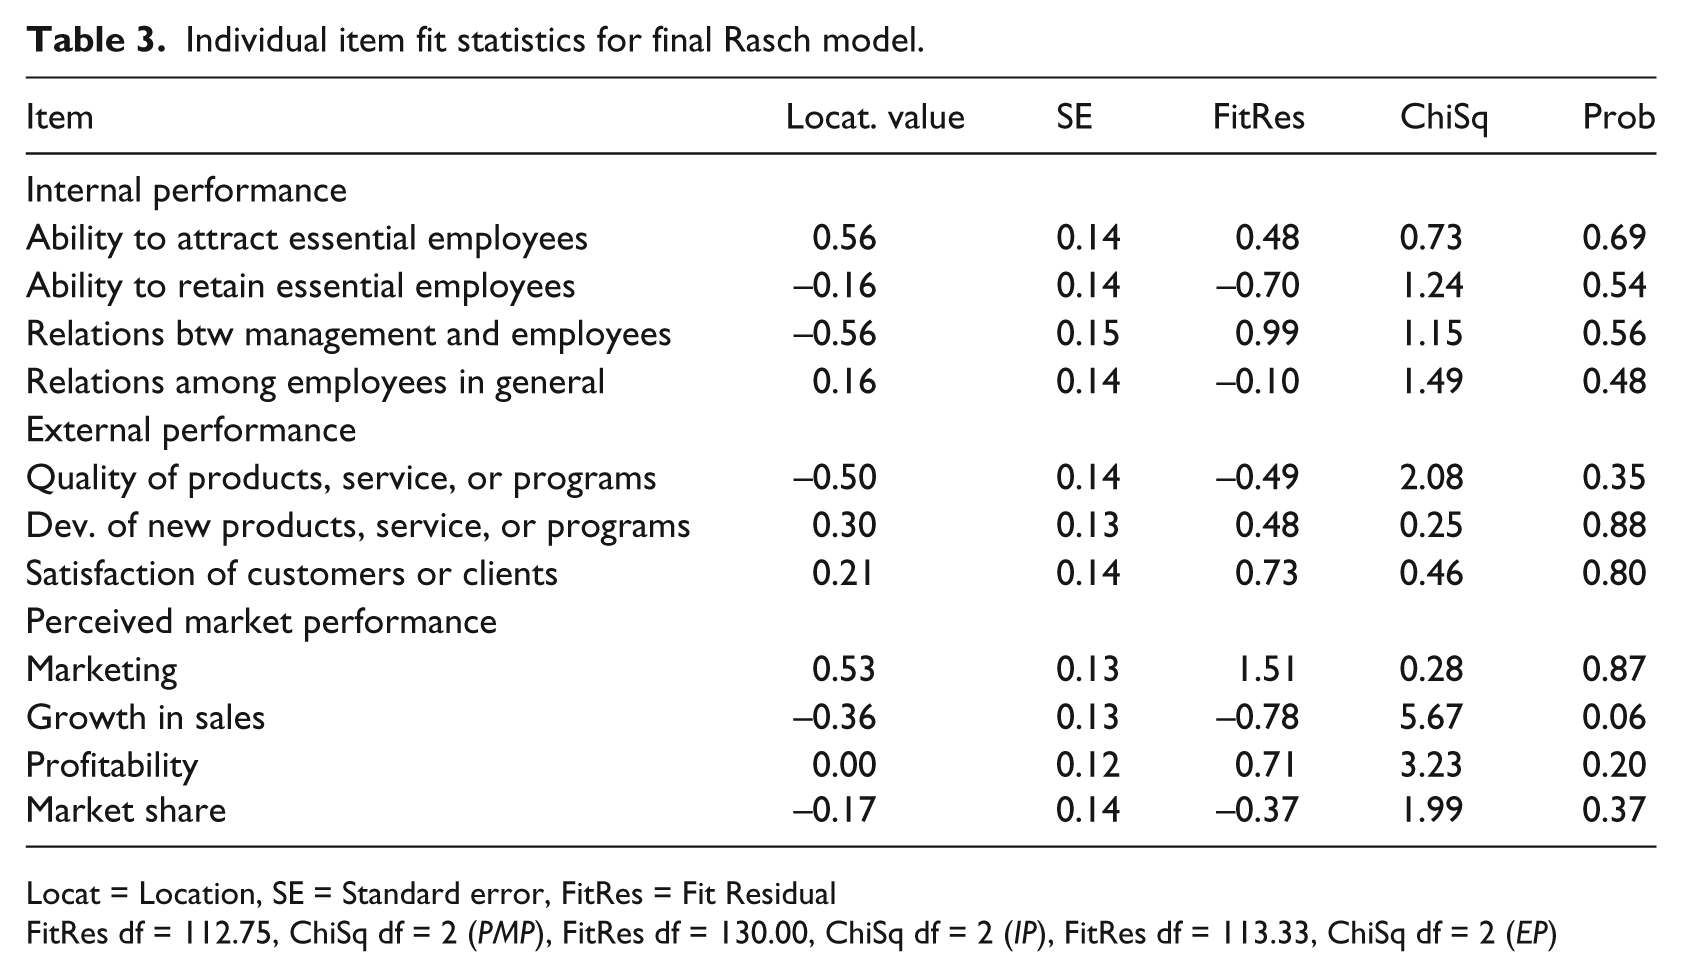
Locat = Location, SE = Standard error, FitRes = Fit Residual
FitRes df = 112.75, ChiSq df = 2 (PMP), FitRes df = 130.00, ChiSq df = 2 (IP), FitRes df = 113.33, ChiSq df = 2 (EP)
Figure 1 displays the person–item threshold maps for the subscales of the revised model. Each map shows the organisations and items calibrated to the same scale where organisational scores are shown in the upper panel and items are represented in the lower portion. Organisations with lower levels of performance cluster to the left of the graph and organisations with higher levels of performance cluster to the right. Inspection of these maps reveals a spread of items across responding organisations which cover a range of difficulty, but there were gaps along the Rasch continuum where some levels of organisational performance were not adequately targeted. This is particularly evident at the highest levels of organisational performance indicating less sensitivity at this level.

Person–item threshold maps: internal (top), external and market performance.
Differential item functioning (DIF) was investigated for several variables: ownership (local, foreign), organisation size (medium, large) and respondent group (CEO, board member, senior manager). Companies were also ranked into four groups on the basis of their revenue ranking on the IBIS World database; for example, the top 500 companies by revenue were ranked into group 1 to 500 (1 to 500, 501 to 1000, 1001 to 1500, 1501 to 2000) and DIF investigated for these four groups. DIF was not detected for any of the 11 items on these variables.
3.2 Construct validity
We expected that a positive relationship should exist between the objective measure return on assets and perceived market performance as well as the new internal and external performance subscales. A statistically significant positive correlation was observed between perceived market performance and return on assets (r = 0.35, n = 98, p < .001); organisations that have higher levels of return on assets also tend to have higher scores on the perceived market performance scale. The 95% confidence interval (ρ = 0.2, ρ = 0.5) indicates that the strength of the relationship in the population may range from weak to moderately strong. Weaker but not significantly different from zero values were observed between return on assets and the revised perceived organisational performance subscales: internal performance (r = 0.09, n = 116, p = .328; 95% confidence interval (CI): ρ = −0.1, ρ = 0.3) and external performance (r = 0.15, n = 114, p = .101; 95% CI: ρ = −0.0, ρ = 0.3).
We also expected that a positive relationship should exist between the objective measure Tobin’s Q and perceived market performance, as well as the new internal and external performance subscales. A statistically significant positive correlation was observed between Tobin’s Q and the perceived market performance (r = 0.50, n = 26, p < .01); organisations that have a higher Tobin’s Q score also have a higher score on the market performance scale. The 95% confidence interval was very broad (ρ = 0.1, ρ = 0.7); while this indicates that there is a positive relationship, it may be very weak or potentially very strong in the population. A statistically significant positive correlation was observed between Tobin’s Q and the internal performance scale (r = 0.43, n = 27, p < .05); higher scores on Tobin’s Q were also associated with higher scores on internal performance. As with the market performance scale, the 95% confidence interval was very broad (ρ = 0.1, ρ = 0.7) indicating that there is a positive relationship but this relationship may be very weak or potentially very strong. No statistically significant relationship was observed between Tobin’s Q and the external performance subscale (r = 0.25, n = 27, p = .21; 95% CI: ρ = −0.1, ρ = 0.6).
4. Discussion
The main objective of this study was to provide an illustrative example of Rasch model analysis by investigating the psychometric properties of the Delaney and Huselid (1996) organisational performance scale. We have also provided preliminary evidence of convergent validity for this scale. Very little analysis has been conducted on this scale to date and this paper provides the first in-depth study of Delaney and Huselid’s hypothesised factor structure. The perceived organisational performance subscale was found to be multidimensional with the items splitting on the basis of whether they tapped an external dimension of performance (e.g. customer satisfaction) or an internal dimension of performance (e.g. employee relationships). These two dimensions related closely to what Richard et al. (2009) label as measures of ‘organisational effectiveness’, a wider term that captures non-financial aspects of internal and external performance. The Rasch model analysis revealed good model fit for all three subscales, internal, external and market performance. The PSI, which is considered to be the equivalent of Cronbach’s alpha, was good for internal and market performance but only average for external performance which might have been due to the limited number of items in this subscale.
The three-factor structure is at odds with earlier studies that have specified two-factor structures (Chan et al., 2004; Tzafrir, 2005) but was consistent with the theoretically specified model by St-Onge et al. (2004). Given that the perceived organisational performance subscale split on the basis of employee and customer service items, it appears to be substantively sound but requires further testing in future studies that use this scale.
Items and respondents are both calibrated to the Rasch continuum which is a unique feature and an important advantage of Rasch model analysis because it gives specific information regarding the targeting of the scale. In this study the process has revealed gaps in the ability of the individual organisational performance subscales to measure certain levels of performance. For example, there are no items on the internal performance scale to target organisations with logit values between one and three. This indicates that this level of organisational performance is not adequately sampled by the items. This issue may arise from the small number of items in each subscale but also from the limited number of response options. The original scale by Delaney and Huselid uses four points. The use of four response options is the minimum acceptable standard (Lozano et al., 2008), but it is possible that targeting might be improved by the use of a greater number of response options, as this would enable the respondents to express their views more accurately (Muniz et al., 2005). The use of a greater range of response options might also more accurately match the distribution of the underlying latent trait in the sample (O’Connor et al., 2004) and may improve the targeting of the scales.
Another important feature of Rasch analysis is that the properties of a scale developed using this method are considered to be independent of the sample on which the scale is developed. That is, scale scores are independent of the items in the scale, which is in contrast to classical test theory where scale characteristics are dependent on the sample in which they were developed (Hambleton and Jones, 1993). This sample dependency can reduce the usefulness of a scale, particularly given that it is necessary to re-validate a scale when using it with a different population.
Additional analysis was conducted to provide evidence of validity for this scale. Two objective measures of organisational performance were used in this study: return on assets and Tobin’s Q. The specific patterns of correlations reported in this study indicate that the perceived market performance and internal performance subscales are tapping slightly different aspects of organisational performance as measured by objective data, which is important for the validity and future use of these subscales.
The non-significant correlations between the external performance scale and the selected objective measures are interesting and require further investigation in future research with a larger sample. While we are hesitant to speculate on null findings, the non-significant pattern of correlations may have arisen from our choice of objective measures. It would be necessary for future studies to reconsider what criterion measures are likely to correlate with the external performance subscale and under what conditions. For example, does improving customer service have a direct impact on specific measures within the organisational balance sheet and if so how would this relationship manifest and when would we expect to see this to occur?
An interesting issue for future research would be to explore the wider nomological network by examining convergent and discriminant validity with other constructs. These constructs could be either antecedents or correlates of organisational performance both at the organisational level (e.g. management practices) and employee level (e.g. job satisfaction). From a methodological perspective, in using Rasch model analysis we have provided a unique insight to the properties of the Delaney and Huselid scale. This study has demonstrated the utility of using Rasch model analysis to evaluate an existing scale in the management field. It has facilitated a greater understanding of the psychometric properties of the Delaney and Huselid scale and the dimensionality of the organisational performance construct. We report that the revised Delaney and Huselid scale has good psychometric properties so it is appropriate to use this scale in future studies as an outcome variable or to measure construct or criterion validity in the development of new scales. However, scale evaluation and validation are an ongoing procedure, with incremental evidence for a scale’s validity being provided by successive empirical studies, so this factor structure will need to be confirmed in future studies that wish to use this scale.
In addition to gathering incremental evidence for the use of this measure, future research could investigate perceived organisational performance in a more in-depth way. While this scale is a good short measure of organisational performance, which is an advantage in survey research, our review of the literature indicates that it is possible to expand this construct. New research could look at incorporating more indicators to tap a broader range of issues within the current scale or add domains such as social or environmental performance. If this is done in the field of IRT, future studies may also wish to consider the use of multidimensional IRT in order to determine the relationship between the underlying domains.
A limitation of the present study was that recruitment was based on a selected list of companies for which we could establish an alternative means of collecting financial data. However, this means that we have used only the larger companies in Australia and New Zealand based on revenue, which biases the sample to higher revenue and potentially larger organisations. Additionally, there was a limited availability of financial information on some organisations due to the inclusion of government and not-for-profits.
To advance our understanding of both theory and the relationships between constructs we must take a rigorous approach to measurement (Venkatraman, 2008) as this provides a strong foundation for interpreting results of empirical studies and substantive research queries (Venkatraman and Grant, 1986). Commenting on the theoretical contribution of empirical research in the management field, Colquitt and Zapata-Phelan (2007) have similarly argued that theory building cannot move beyond its early stages until there is accurate validity testing of a theory’s core propositions. Attention to how to measure and validate the constructs we use in empirical studies is critical, as it allows us to more fully realise the applied and theoretical implications of our research. To this end we have provided an illustrative example of Rasch model analysis in an area of importance to the management field. Given the ongoing use of the perceived organisational performance construct in the management field, this paper provides an important step towards psychometric analysis of a perceptual measure of organisational performance currently in use. In subjecting this measure to Rasch model analysis we have increased our understanding of this scale and the latent structure of organisational performance. As has been noted by several scholars (e.g. Janssens and Steyaert, 2009; Paauwe, 2009; Venkatraman, 2008), such analysis is crucial in order for research in this field to advance.
5. Conclusion
The present study investigated the psychometric properties of the Delaney and Huselid scale (1996). It is the first study to investigate the psychometric properties of this scale using Rasch model analysis. While the evidence from this study would suggest that the revised scale is psychometrically sound, further development and evaluation are required as psychometric evaluation is an ongoing process. Our findings support Richard and colleagues’ (2009: 737) conclusion that perceptual measures of organisational performance are not inherently a ‘second best’ alternative to more objective measures. Finally, this study has implications for the use of other measures used in the management field. Our study provides an example of rigorous psychometric testing that could (and should) be widely applied to other measures. Rasch model analysis is emerging as an important analytical tool in several fields of research; the management field should not lag behind in utilising this tool.
Footnotes
Funding
The research in this study was supported by the Faculty of Business and Economics and the Australian Centre for Research on Employment and Work at Monash University.