




Abstract
This paper examines the retirement savings investment choices of Australian workers over a three-year period, including the global financial crisis (GFC), based on a large sample of members drawn from five superannuation funds. The overwhelming majority of members did not change their investment strategy in response to the GFC. Between October 2006 and March 2009 less than seven per cent of members did so. The likelihood of making a change increased with member balance and contributions levels. During the GFC period women with large balances were more likely to make a change, a result which contrasts with the bulk of prior evidence suggesting males as the more active. The level of change activity did increase during the GFC peaking in October 2008, the month with the largest market downturn, and March 2009, when the market reached its low point. The implications for both members and funds of the observed investment choice behaviour are discussed.
1. Introduction
The global financial crisis (GFC) presented a test of confidence in the ability of the mandatory savings pillar of the Australian retirement income savings system to deliver desired outcomes. Even including the mandatory and voluntary contributions flowing into superannuation funds, collectively superannuation assets reduced by AUD$160 billion from their peak in June 2007 to March 2009 when the market bottomed (Australian Prudential Regulation Authority, 2008, 2009). Australia was not alone, of course, with an estimated US$5.4 trillion decline in the value of pension assets globally (Antolin and Stewart, 2009).
The narrative that has emerged reviewing the causes of the GFC is consistent in identifying increased availability and use of credit, particularly ‘sub-prime’ housing lending in the US, as fundamental factors. By late 2006 the use of such credit had reached alarming levels, with a US financial market impact emerging in early 2007 (Edey, 2009). Credit availability fed, and fed off, lending practices that expanded the use of ‘sub-prime’ loans, which were subsequently securitised and sold off internationally, thus spreading the eventual impact. Davis (2010) notes that while credit expansion, lending, remuneration and governance practices played crucial roles, the ‘liquidity creation techniques’ made the problem more pervasive and led to the crisis spreading to global markets. The other major factor, or serious economic policy mistake (Eslake, 2009), which helped ferment the conditions of the asset price bubble in the US, was the maintenance of low interest rates by the US Federal Reserve coupled with low exchange rates in emerging economies, which combined to add liquidity.
Eslake (2009) highlighted the parallels between the events leading to the GFC and those preceding the Great Depression, but noted an important chronological difference. In the case of the GFC events transferred from credit markets to the banking system before entering the stock market, whereas in the Great Depression the stock market crash spread to the banking system. Chronology notwithstanding, the GFC’s impact for most Australians was largely through the stock market’s impact on their superannuation.
Exposure to equity markets impacts the majority of Australian superannuation fund members, because their savings are invested in defined contribution accounts (81 per cent, Australian Prudential Regulation Authority, 2010) which have an average 50 per cent allocation to equity. Therefore, the investment risks made clear in the GFC were borne directly by members, rather than pooled within the fund, as through a defined benefit fund. The ability of members to make appropriate investment decisions during the GFC generated much discussion in Australia. Concern prompted the Superannuation Stakeholder Group, representing nine Australian superannuation industry bodies, to release an almost ecumenical call to members to ‘keep the faith with their super’. A joint communiqué was released to ‘provide context to the issue for media and commentators at this time’ and urged members ‘to think carefully before they make changes to their current investment strategy’ (Superannuation Stakeholder Group, 2009: 3).
Superannuation fund members have two levels of interrelated choices possible. The first is the investment strategy within a particular fund that is available to 63 per cent of Defined Contribution (DC) members (Australian Prudential Regulation Authority, 2009). The second level of choice is the choice of fund, where available, to receive contributions. 1 This paper is restricted to the former investment choice using a sample of five funds. Four of the funds draw members from a single industry (Industry), and the remaining fund covers government public sector employees (Public sector). Industry and Public Sector funds collectively account for 32.5 per cent of superannuation assets. The balance is held in Retail (27.7 per cent), Corporate (4.6 per cent) and Self-managed (31.9 per cent) funds (Australian Prudential Regulation Authority, 2011). The sample of funds provides a varied cross-section of Australian workers drawn from thousands of employers. The members have investment choices that are comparable in type but vary by number and range. The extent to which other category funds are not in the sample and the extent to which these members are different provide a caveat to the conclusions drawn. However, the size of the sample enables a valuable insight into member behaviour and raises questions about the role of choice in these funds and the system more broadly.
The paper addresses three key questions. Firstly, what level of investment change activity was evident during the GFC relative to that prior to the GFC? Secondly, were the characteristics of those members making changes during the GFC different to those prior to the GFC? Thirdly, what lessons can be drawn for funds and regulators wanting to counsel members during future significant market movements?
The answers to these questions indicate both consistency with prior literature and novel results. The most profound result is of member inertia. Over a 30-month period the vast majority of members did not make a change to their investment strategy, even during the GFC. The relative level of activity did increase, however, during the most volatile month of October 2008 and the market low of March 2009. Older, wealthier members were more likely to make an investment change during the GFC, with a gender effect also evident during the GFC. However, the latter was positive for female members during the GFC, a result not expected given previous literature.
The next section provides an overview of the impact of the GFC on retirement savings and the individual and institutional response within the superannuation industry. The third section provides a review of the literature relating to investment strategy change within retirement savings. The fourth section summarises the sample and methodology employed in the analysis. The fifth section presents results from univariate and multivariate analysis and the final section concludes with a discussion of results, as well as recommendations for future work.
2. The global financial crisis: retirement savings impact and response
By mid-2007, increased volatility characterised Australian stock market returns and by January 2008 rolling annual returns turned negative for the first time since 2002. At the end of 2008, the All Ordinaries Index was down 50 per cent over the year before bottoming in March 2009. Figure 1 provides a comparison of the Australian stock market experience with regional and other major markets and highlights the shared experience of significant declines, which saw total superannuation assets decline 18 per cent between December 2007 and March 2009.
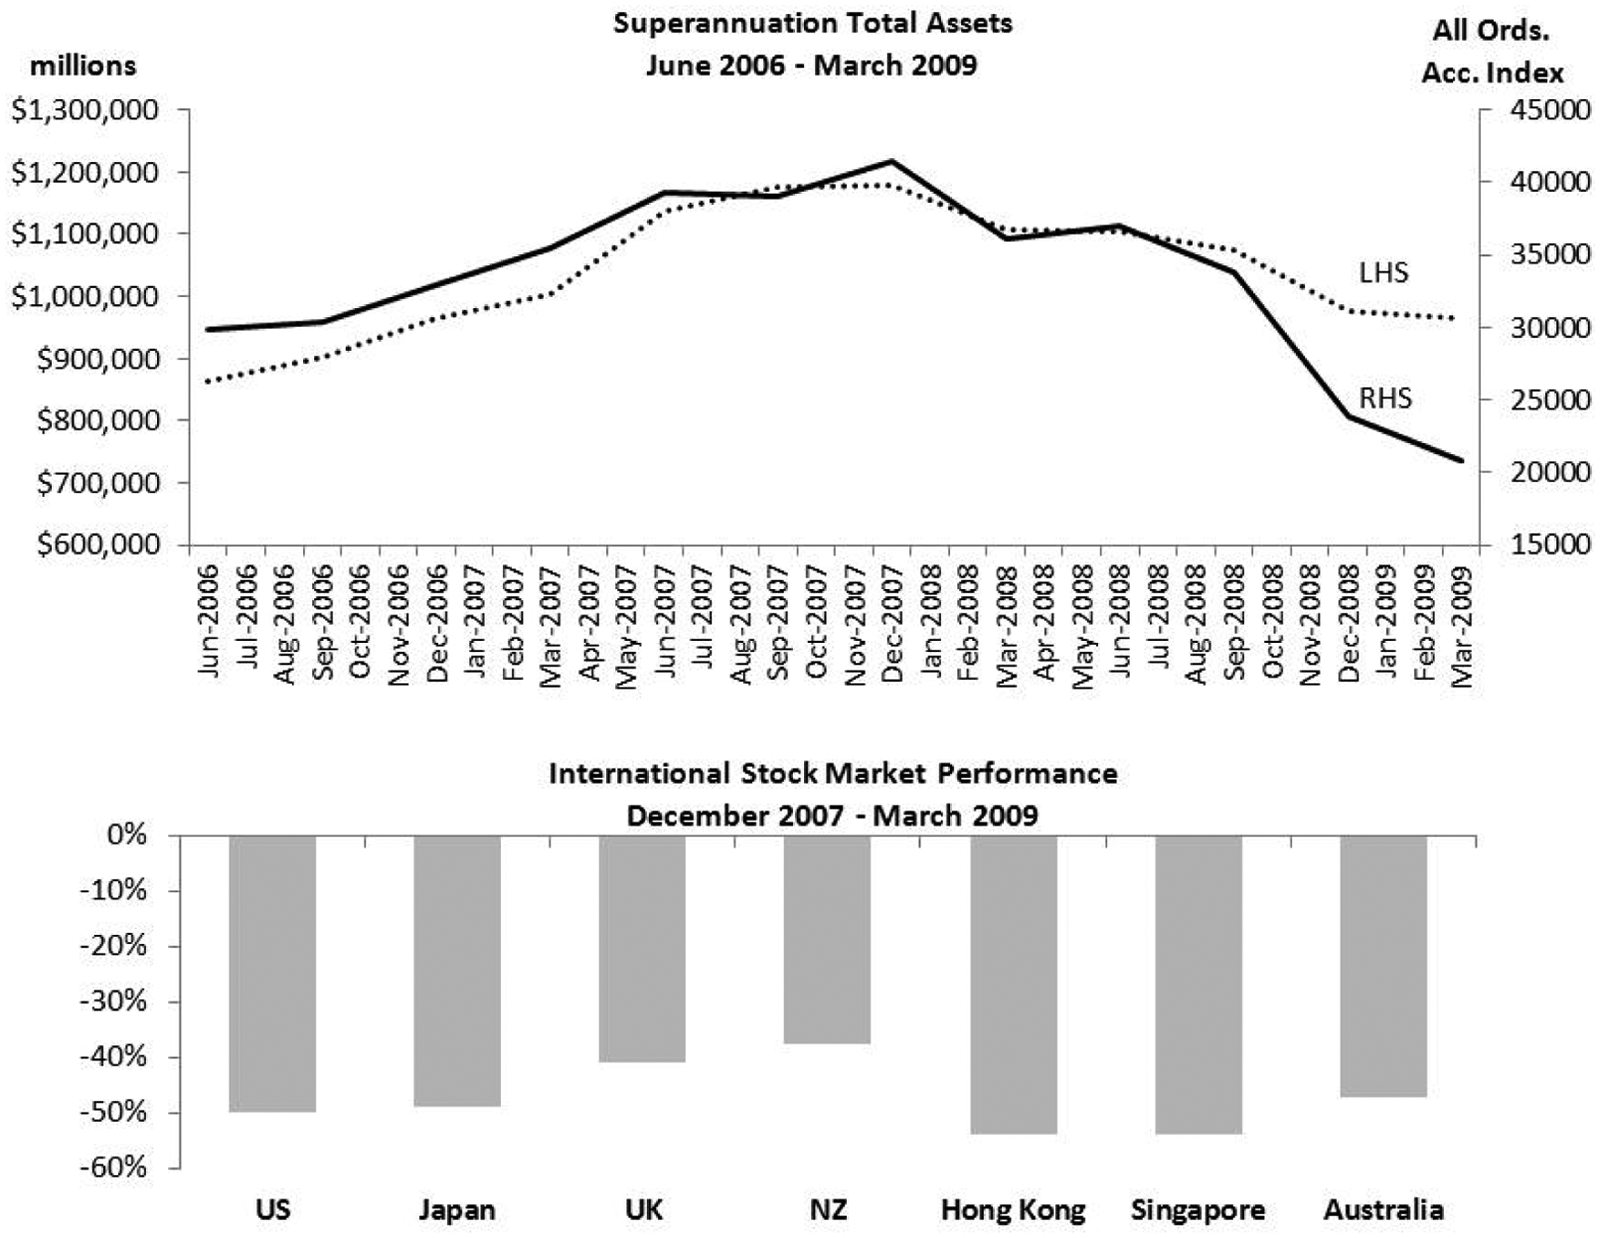
Superannuation assets and international global financial crisis stock market performance.
The Australian experience of the GFC has been described as less severe than in ‘comparable markets, such as the United States and the United Kingdom’ (D’Aloisio, 2010). Although the unemployment rate increased to 5.8 per cent with an additional 200,000 unemployed, the labour market impact of the downturn was also less severe than in the downturns of the early 1980s and 1990s in Australia (Australian Bureau of Statistics, 2010). This is not to downplay the financial events of 2008 and early 2009 as ‘there was nevertheless an impact’ (D’Aloisio, 2010), not least of which was felt most acutely by those close to retirement. For example, age pension applications in December 2008 were 50 per cent higher than two months earlier, reflecting real and large declines in savings. 2 Those making retirement decisions at this point in time bore the brunt of the GFC.
The GFC represented a challenge to the modern Australian superannuation system. History reveals that comparable drops in the market were not unprecedented, with 1987 and 1974 notable in this regard. However, for many superannuation fund members, the GFC did present unprecedented drops in the value of their member balances, given that widespread superannuation coverage only took hold in the 1990s. For example, in 1974 when equity markets experienced similar drops, superannuation coverage was only 32 per cent of the workforce (Neilson and Harris, 2008), whereas it is now 94 per cent (Australian Bureau of Statistics, 2009). Further, the average member balance has increased substantially.
Indicative of the importance of superannuation, individually and collectively, were the responses by funds, regulators and government. A persistent message communicated by superannuation funds to their members in 2008, as the GFC was reaching its peak, was to stick with their investment strategy and to seek advice. In particular, members were generally counselled against moving out of equity. Most commonly, funds highlighted the difficulty in timing the market, where members risked missing out on what was suggested as an inevitable market rebound:
When markets turnaround from a low point, they often do so with amazing speed. We can never know what the year ahead will bring, but we do know that if you are out of the market you risk missing out on the best returns. (Asset Super, 2008).
Funds also emphasised the long-term nature of superannuation. Gerrans et al. (2009) identified a marked increase in the description of superannuation as a long-term investment, in 2008 Chairperson statements, relative to 2007. Further, the actual performance periods quoted in 2008 statements were typically much longer than in 2007.
A peak industry body described prevailing media coverage of equity market declines as ‘unprecedented’, but warned that reassuring messages of an inevitable turnaround and long-term emphasis could create the ‘impression that trustees are out-of-touch, self serving, or not competent to manage’ (Australian Institute of Superannuation Trustees, 2008). Aside from funds, industry groups, and international agencies, government was also willing to offer advice:
Before individuals, in their response to current movements in the super fund balance, consider switching to cash or other conservative investment options they should seek the advice of their fund or an advisor. (Sherry, 2008a).
2.1. Individual investment behaviour during the GFC
Limited data is available describing investor investment intentions and behaviour during the GFC. SuperRatings (2009) highlighted the general inaction of superannuation fund members and suggested that ‘over 88% of Australians’ pre-retirement super monies continue to be held in mid to higher risk investment options’ (SuperRatings, 2009). Self-managed superannuation fund assets (Australian Taxation Office, 2009) indicated a reduced exposure to equities between June 2007 and June 2009, from 34 to 29 per cent, with an increased cash allocation from 25 per cent to 31 per cent. 3 Anecdotal evidence suggested more members were making choices during the GFC, relative to the downturn in 2001, and more into cash (Rivers, 2009), with further anecdotal evidence suggesting that contributions had ‘dried up’ (Egan, 2009). Member contributions declined from AUD$4.35 billion in the 2008 March quarter to AUD$2.84 billion in the corresponding 2009 quarter (Australian Prudential Regulation Authority, 2009). 4 In the US, employer contributions also reportedly fell, with 20 per cent of employers indicating elimination of employer contribution matches (Anonymous, 2009).
Vanderhei (2009) identified that the impact of the GFC on US 401(k) plan accounts depended on member balance, age and tenure. Hastings (2010) reported an increase in fund manager switches by investors in Mexico’s privatised pension system, with a spike in October 2008 against a general downward trend in the level of such switches.
2.2. Asset allocations and policy response
Legorano (2009) reported international evidence of fund-level portfolio rebalancing for the second half of 2008 and into 2009, with a reduction in equity exposure in favour of ‘new’ or ‘non- traditional’ asset classes. The message to Australian fund members to ‘stay the course’ in regards to investment strategy was echoed at the policy response level. Following a review of pensions in Organisation for Economic Co-operation and Development (OECD) and non-OECD countries, Antolin and Stewart (2009) recommended messages emphasising the long-term nature of retirement savings and education to help members understand risks and returns of investing. In terms of system architecture, Antolin and Stewart (2009) recommended improvements in the design of defaults with a role for life-cycle funds, which are currently largely absent in Australia, although it has been stressed that ‘life-cycle investment strategies are not a panacea’ (OECD, 2010).
3. Retirement savings investment choice: theory and evidence
3.1. Theory
Traditional investments finance theory, grounded in the mean variance framework of Markowitz (1952), suggests that the drivers of individual investment strategy changes, or rebalancing, are risk preference changes, changes to expected asset returns and changes to the expected asset return covariance matrix. There is no optimal number of investment changes predicted from theory, other than the first principles expectation that a choice will occur when the expected benefits of doing so exceed the cost.
The life-cycle hypothesis (LCH) of Modigliani and Brumberg provides a model of savings through life, focused on the level of savings and consumption rather than its composition. Bodie et al. (1992) demonstrated the importance of human capital in determining and explaining financial asset choices and highlighted the influence of the stock of human capital and labour flexibility on asset allocations and how this varies with age (see also Bodie, 2003; Samuelson, 1994). In the current analysis, this suggests sector-specific employment impacts may help explain investment switch activity.
Alternative behavioural models to those based on forward-looking, rational, expected-utility maximising individual choices have been suggested. Fry et al. (2007) used Prospect theory to explain superannuation fund choice, as distinct from investment choice, and suggested that, given loss aversion, the expected benefit/cost ratio needed to be substantial to encourage a change that is further magnified as ‘superannuation profits cannot be realised until retirement’ (Fry et al., 2007). Croy et al. (2010a, 2010b) used the Theory of Planned Behaviour (TPB), which focuses on attitudes, social norms and behavioural control to explain retirement savings decisions, including changing investment strategy. Croy et al. (2009) found a role for anticipated regret (Ritov and Baron, 1995) in retirement savings decisions using the TPB model. It is interesting that possible regret was used strongly by funds and government in messages to members during the GFC.
3.2. Empirical evidence
A common experience in retirement savings plans is of relatively low investment change or investment switching activity. Bowman (2003), suggested only 10 to 15 per cent of Australian superannuation fund members have exercised investment choice. Gerrans et al. (2006) report eight per cent of members in a single fund making an investment switch over a 40-month period. US evidence is comparable with Agnew et al. (2003), who suggested 87 per cent of members had zero annual trades over a four-year period with only seven per cent of 401(k) members having more than one trade. Even over a decade, 75 per cent of members in one plan made no change to asset allocation (Ameriks and Zeldes, 2004). Mitchell et al. (2006) characterised workers in US defined contribution plans as ‘inattentive portfolio managers’. An exception to the evidence of low activity is a UK study of a single and small sample (3629 members), where 69 per cent of members made a choice within a 12-month period (Byrne et al., 2009).
Trading frequency in 401(k) plans has been identified as positively related to males, age, income and wealth (Agnew et al., 2003; Mitchell et al., 2006). Byrne et al. (2009) did not find a gender difference, but found age, job tenure and income positively related to investment activity. Frino et al. (2005) and Clark-Murphy et al. (2009) documented performance chasing at product and individual member levels respectively. Gharghori et al. (2008) investigated the smart money effect in Australian superannuation funds flow and concluded that members ‘are not smart, as they tend not to invest in funds that subsequently perform’ (Gharghori et al., 2008: 541).
Croy et al. (2010a) identified a role for an individual’s perception of appropriate injunctive social norms in forming intentions to change superannuation investment strategy. The effect was largest for females and younger fund members. In view of the messages from funds and government advising against investment strategy during the GFC, these reinforce expectations that younger members and female members would be relatively less active during the GFC period.
Finally, changes in risk preference or risk tolerance accompanying significant events, such as the GFC, are also of relevance here. Mandal and Roe (2007) utilised US data to investigate how risk tolerance may be impacted by significant events, such as September 11, 2001, and changes in significant life events, such as unemployment. They find a rich mix of age, income and wealth factors impacting. Of note is the reported increased risk tolerance that accompanied unemployment for the youngest cohort. Limited evidence suggests that any risk tolerance change during the GFC was small, as distinct from risk perception (Roszkowski and Davey, 2010).
3.3. Literature summary and hypotheses
The available theory does not provide a basis for the expected number of investment changes within retirement savings accounts over a given period of time. The theoretical and empirical literatures are consistent in a suggested explanatory role of age with generally a propensity for activity to increase with age in the empirical literature. The empirical literature also shows a generally positive relationship between wealth, males and income with trading activity.
Confusing the expected influence of age is the expectation from life-cycle model extensions that other ‘background risks’ are of importance, chiefly here human capital and financial assets risk. Given that young males were disproportionately impacted by unemployment through the GFC (Australian Bureau of Statistics, 2009), they may as a result be over-represented in activity to alter investment strategy. Equally, due to lower levels of human capital and/or flexibility, it may also be expected that older members will be over-represented in making investment switches to try to compensate financial asset risk change during the GFC. Given that the highest wealth quintile in Australia accounts for 80 per cent of the holdings of equity (Reserve Bank of Australia, 2009), their portfolios will have been impacted more significantly during the GFC. Therefore, this reinforces the expectation of a positive relationship between wealth and activity during the GFC.
From more explicitly behavioural models, we have a general expectation that the level of changes in any period will be lower than a strict cost/benefit analysis may suggest. In terms of relative propensity to make a change, evidence suggests younger members and female members may have been more likely to have heeded the general advice of funds and government not to alter investment strategy in response to the GFC.
4. Sample description and methodology
4.1. Sample
Five superannuation funds, four encompassing a single industry each covering thousands of employers and one state government public sector fund covering a range of government agencies and businesses, are analysed in this paper. Collectively these funds have AUD$74 billion of assets with 3.6 million accounts, representing a substantial sample of fund members. A comparison of each fund with the average fund of the same classification type is presented in Table 1. The funds in the sample are larger than the average industry or public sector fund measured by total assets or number of members. The sample of members for each industry fund is generally older than the industry average, as suggested by Australian Prudential Regulation Authority (APRA) statistics, with the exception Fund One.
Sample overview and comparison

This table compares the sample funds with the average profile of similarly categorised Australian superannuation funds, which are presented in bold. Asset allocations reflect those in 2007, both for the sample and Australian Prudential Regulation Authority (APRA) averages. Average values for fund types are based on Tables One, Six and Nine of APRA (2009). Some allocations do not add up to 100% due to rounding. Note also that the sample fund age data presented is not of the total fund membership. It is instead based on the sample of members with complete records
Each fund’s default investment option is comparable to the fund-type average asset allocation. The largest difference is for Fund Three, with four percentage points less in shares. Fund One is notable in that it is the only fund with an age-based default, with the demarcation being those aged 56 years. With the exception of Fund Two, each fund offers more investment options than their fund-type average, although the number of options is much smaller than the average of 112 for Retail funds. A more detailed description of the investment options and timing is presented in Table 2. The timing of available investment changes varies across the funds, varying from daily to monthly.
Summary of fund investment strategy options
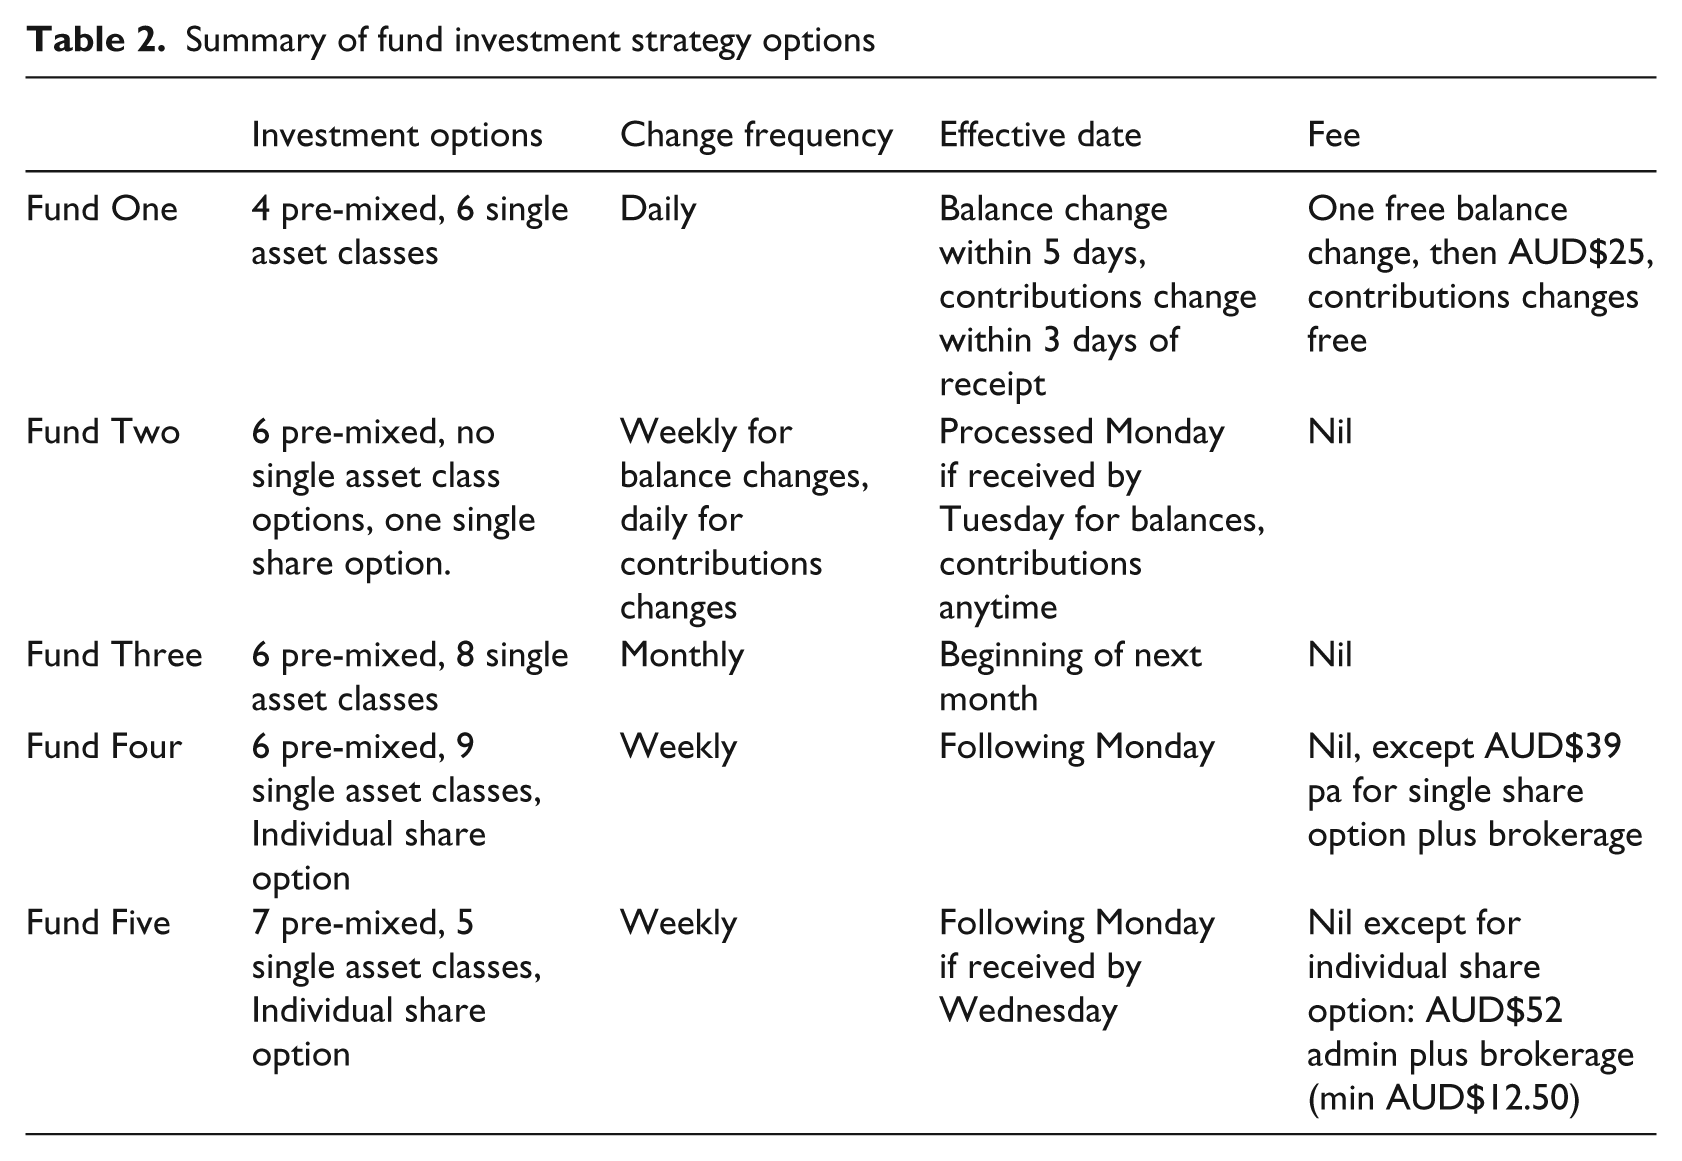
The data supplied by the five funds extends between April 2006 and June 2009, with four funds providing 36 months of data and one fund 33 months of data. An overview of member choice is provided for this full sample. A consistent period across funds is available between October 2006 and March 2009, and this sample is the subject of the more detailed regression analysis. This regression sample is broken into two 15-month periods classified as Pre-GFC (October 2006–December 2007) and during the GFC (January 2008-March 2009).The choice of demarcation between before and during the GFC is subjective and will be different across countries. Whereas financial institution distress was becoming more evident in the US and Europe during the second half of 2007, this was largely absent in Australia. The Federal Reserve Bank of New York started reducing interest rates in September 2007, followed in December 2007 by the Bank of England and Bank of Canada. In contrast, the Reserve Bank of Australia continued to increase interest rates until August 2008. The choice of demarcation also reflects both an external indicator (stock market performance as reflected by the All Ordinaries Index) and a measure of activity taken from the member sample (the mean proportion of equity in choices), as discussed in Section 5.
4.2. Methodology
The preliminary analysis of member investment choice activity examines overall choice levels for the period April 2006 to June 2009 and provides a univariate analysis by member age, gender, account balance, contributions and membership length. The preliminary analysis also focuses on member choice activity broken down by fund and the mean level of risk reflected in these choices, as measured by exposure to the major asset classes.
Each fund permitted members to make an investment switch that applied to their existing balance (a balance investment change or BIC) and/or a contributions investment change (CIC) that applied to future contributions. Summary statistics are presented for both BICs and CICs. The proportion of members who make both at the same time ranges between a low of 28 per cent and a high 81 per cent. More members make changes to contributions than their existing balance. The reason for the variation across funds is intriguing. The two funds with more than 75 per cent making both a BIC and CIC together have the largest average member balance and the two funds with the lowest proportion have the smallest average member balance. There is also a possibility that the presentation of the choice form itself by the fund influences this choice. In addition, the variation in the frequency of switching allowed and the processing speed of changes across funds, further discussed in Section 5, may also play a role. Such analysis will be pursued in future work.
To further investigate the factors explaining choice, a multinomial logistic regression was estimated using data from October 2006 to March 2009, with member choice coded into four groups. The first group contained those members who made no choice through the whole 30-month period (No Choice). The second group includes members who only made an investment choice in the 15-month Pre-GFC period, October 2006 to December 2007 (Pre-GFC). The third group includes the members who only made a choice in the 15-month GFC period, January 2008 to March 2009 (GFC). The fourth group includes those who made a choice in both periods (Both). These are four non-overlapping groups. Member investment choice here reflects whether a BIC or CIC was made during the respective period.
A base model was estimated that included five member demographics: age; balance; contributions; membership; and gender. A second specification was estimated to assess non-linearities in the impact of age and membership length. A final model specification introduced interactions between gender and each demographic. The probability of individual i being in category c can be expressed as:

where the No Choice group is reference category 1 and the three remaining groups, c, are those who made changes in the Pre-GFC, GFC or Both periods. Balance and contributions are entered as the natural log of 2009 values. Age and membership length are calculated at the beginning of the GFC period.
Model specification was assessed through a likelihood ratio test of the nested models. Robust standard errors were estimated, with residuals allowed to cluster by fund membership. A test of independence of irrelevant alternatives (Hausman and McFadden, 1984) was applied to assess group impact. In addition, specification assessments were made by allowing for possible combinations of the four dependent groups; for example, comparing a specification with three dependent groups where the No Choice and Pre-GFC group were combined and compared to the two remaining groups. Six such combinations were assessed relative to the full model with four categories, using a likelihood ratio test. Before assessing coefficients linked to gender, a test of the equality of unexplained variation by gender was conducted as suggested by Allison (1999).
5. Results
This section firstly describes the overall level of choice evident across the sample period and, in particular, contrasts the activity before and during the GFC. Secondly, the level of risk of investment changes is explored. Finally, a regression is estimated to examine the explanatory power of those factors identified in the theoretical and empirical literature, namely age, income, wealth and gender.
Through front-page banner headlines describing financial market plunges, collapse of some of the largest financial institutions in the world, government bailouts and fiscal stimulus packages, two distinct groups of fund members emerged, as summarised in Tables 3 and 4. Table 3 provides an overview of the choice behaviour across the whole period for which data was provided, broken down by fund. The first, overwhelmingly larger, group did not do much, at least judged by their investment choice behaviour. The second, much smaller, group reacted to events and reduced their risk exposure. This period captures the challenge that investment choice presents to individuals, fund trustees and architects of retirement income planning systems. Based on the sample of funds and members analysed here, for the majority of fund members investment choice appears of little consequence. As much as the focus of the analysis in this paper turns to the smaller group of members who did in fact make a change, the bigger story is of the overwhelming majority of members who did not make a change, remaining in their respective investment defaults through the period.
Comparison of members making investment choices by fund

This table compares the profile of those members who made an investment change during the whole data period. Only those members with complete records are shown, including new members during the period. BICs refer to changes to balance investment choices and CICs refers to contributions investment choices
Investment choice breakdown before and during the global financial crisis (GFC)
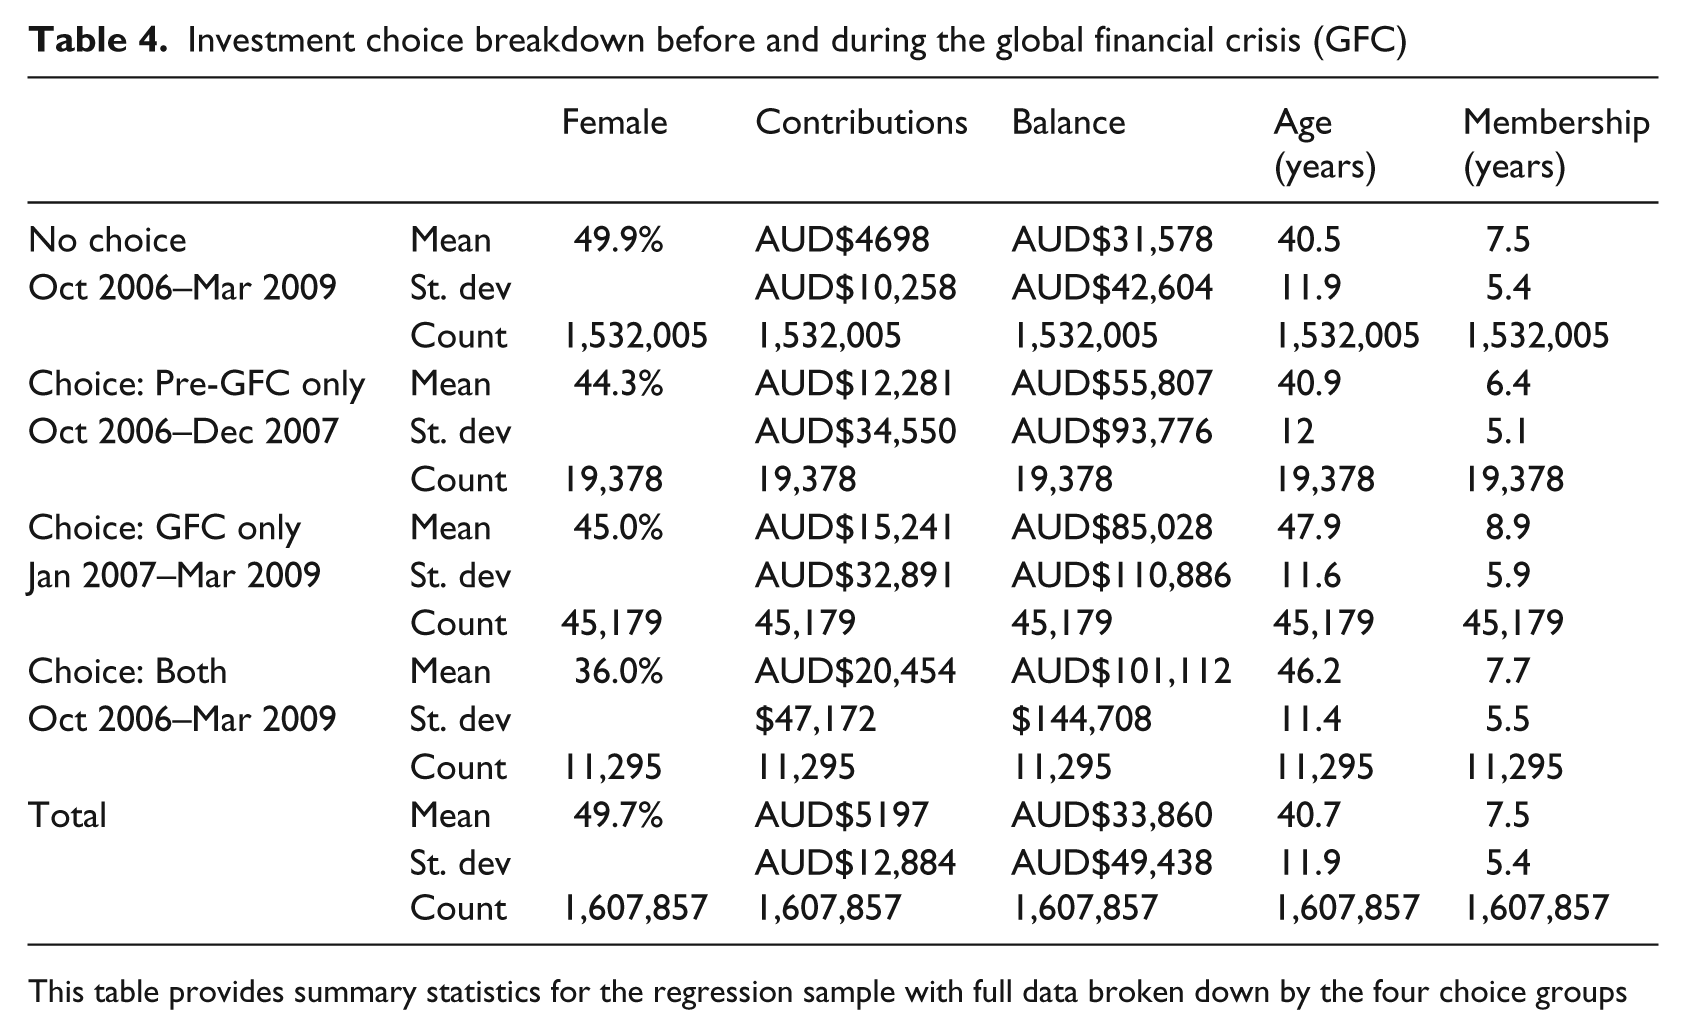
This table provides summary statistics for the regression sample with full data broken down by the four choice groups
5.1. Overview of member choice
Across the sample of funds in Table 3, between 5 and 6.5 per cent of members made an investment change through the whole period. The group who made changes in each fund can be characterised as having larger balances, making larger contributions and being older. For three (two) funds the change group had been members of the fund for a longer (shorter) period. A larger proportion of those in the change group were male, with the exception being Fund Two. Fund Two is different in member profile in that is has the highest proportion (92 per cent) of males compared with other funds. In addition, the group of females making changes in Fund Two have higher mean contributions than their male counterparts, reflecting higher incomes. This is different to each of the other funds, where males have higher average contributions, and suggests subtle relationships among member characteristics. The distribution of the number of changes is skewed, with most members making a single change through the period, and the maximum number of changes for each fund varying from 14 to 113.
5.2. Member choice activity level before and during the GFC
Table 4 provides a consolidated summary for a common 30-month period broken into the 15-month period Pre-GFC (October 2006–December 2007) and during (January 2008–March 2009) the GFC. This additional breakdown by time period reveals that more members only made a change in the 15-month period during the GFC period than only in the 15-month Pre-GFC period. The number who made a change in both periods was less again. Those in the Both group had larger balances and made larger contributions than those in the GFC and Pre-GFC groups. Those in the Pre-GFC group were younger, with those only making a change in the GFC period the oldest. The same relative pattern is evident in membership length. However, while for those who only made a choice in the GFC period the membership length is longer than those in the Pre-GFC period (8.9 versus 6.4 years), the average age of those making choices was seven years older (47.9 versus 40.9 years). That is, those making choices were relatively newer members, although they were older. All differences in group means are significant at a 99 per cent confidence level.
To further examine the trend in choice activity, Figures 2–5 provide a monthly breakdown in the distribution of choice activity over the 30-month period. In comparing activity, care must be taken to acknowledge the different speeds that funds allow and process investment choices. Fund Three permitted changes monthly, Fund One daily and the three other funds weekly. Fund Three’s activity clearly lags each of the other funds, reflecting the slower implementation. In periods of significant market movement, this raises issues for the member and fund. In the regression analysis, Fund Three’s activity is brought forward one month to make it more comparable with the other funds.
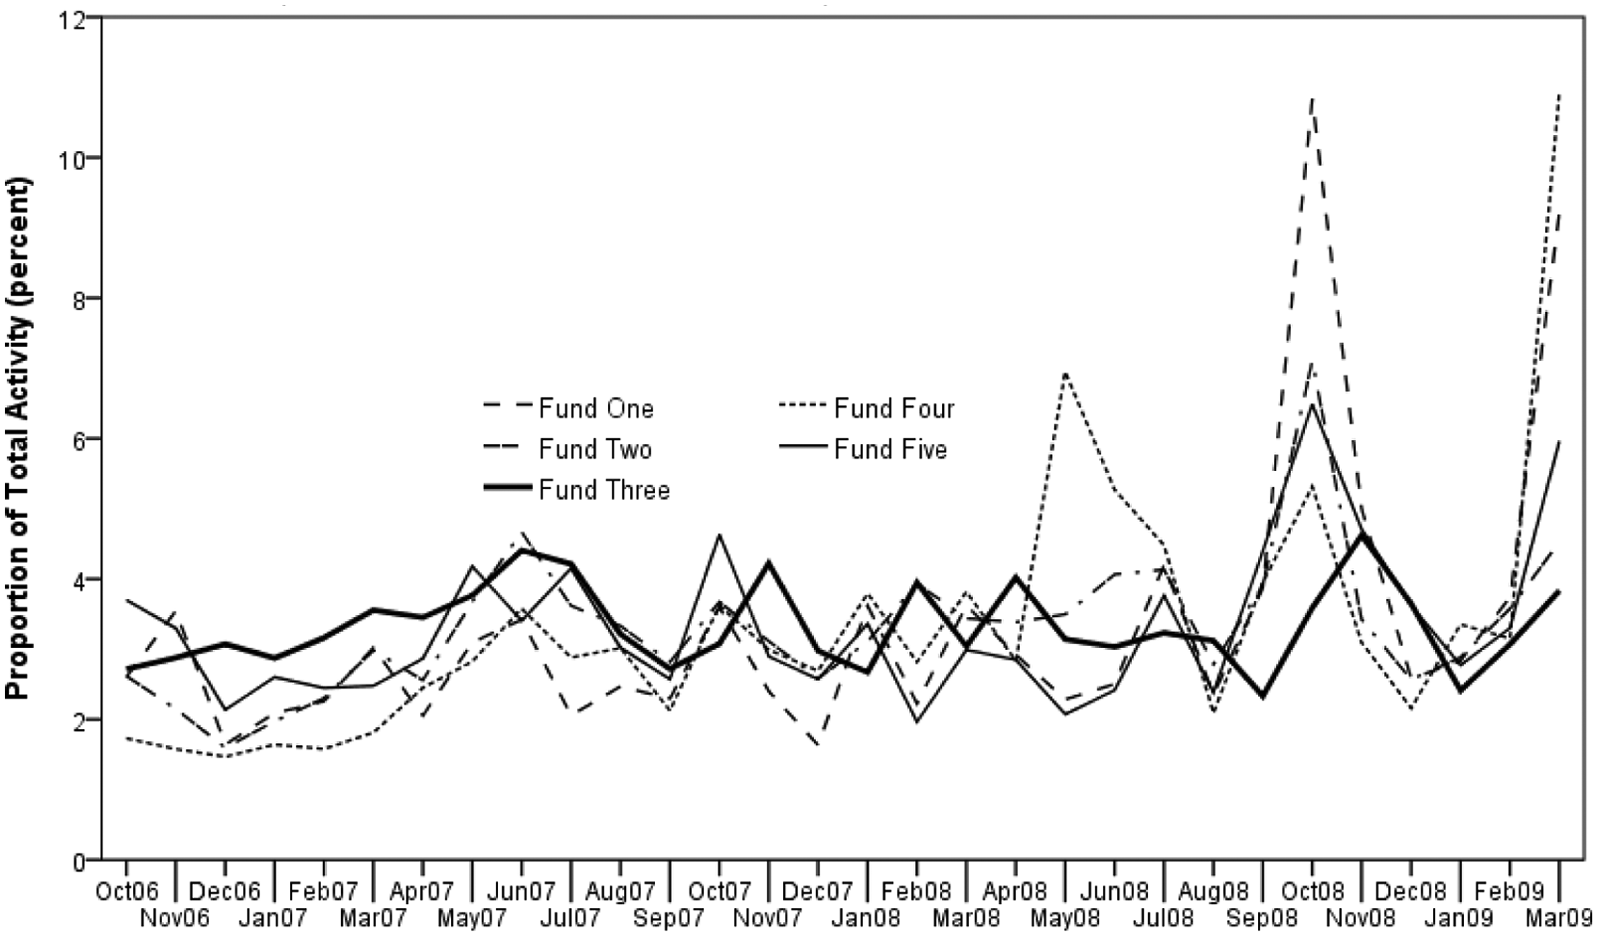
Monthly investment change activity.
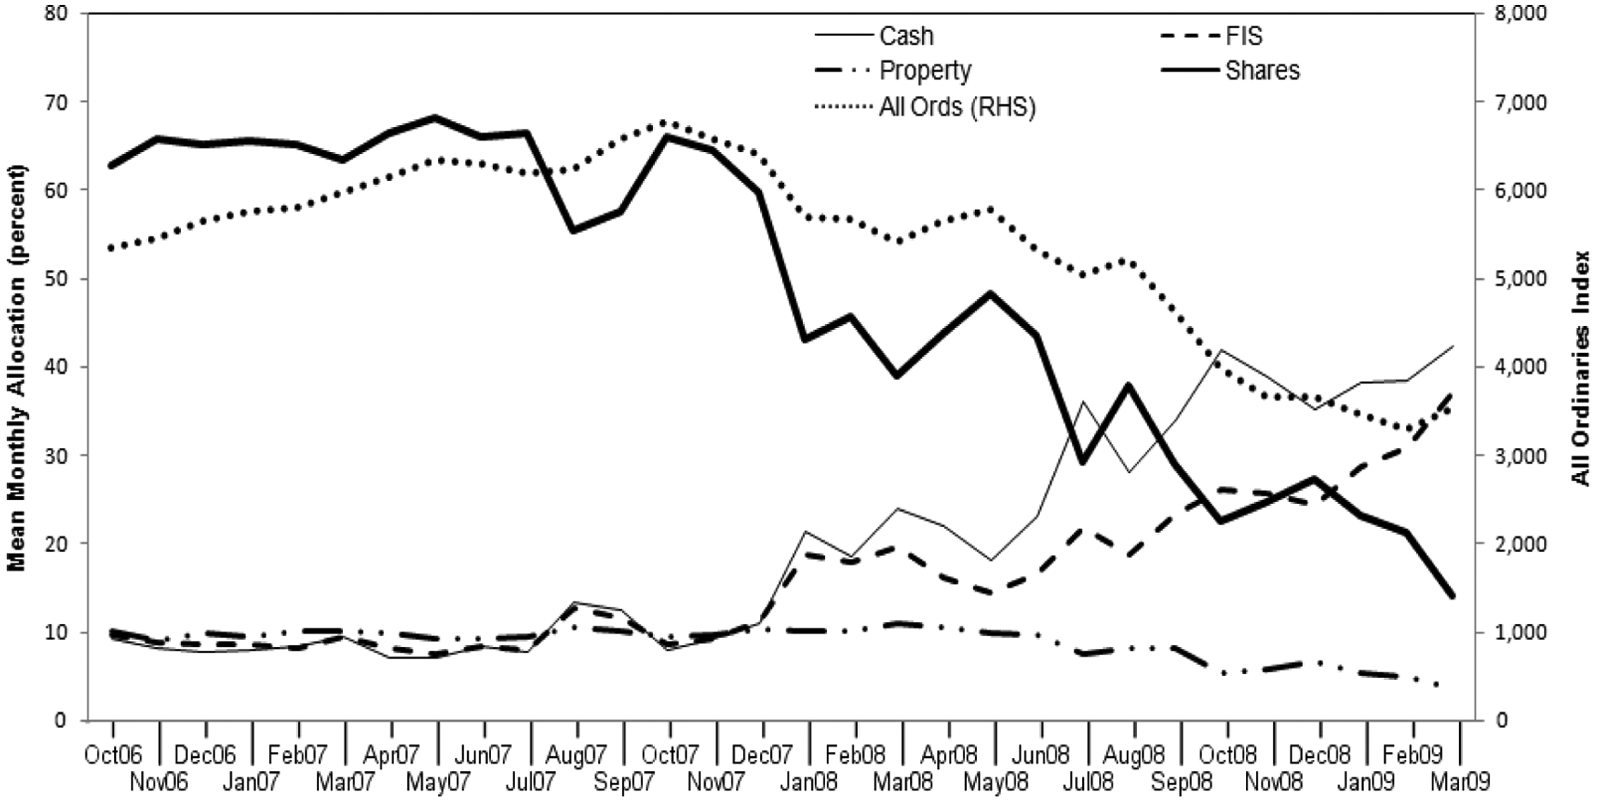
Asset class exposures of member choices.
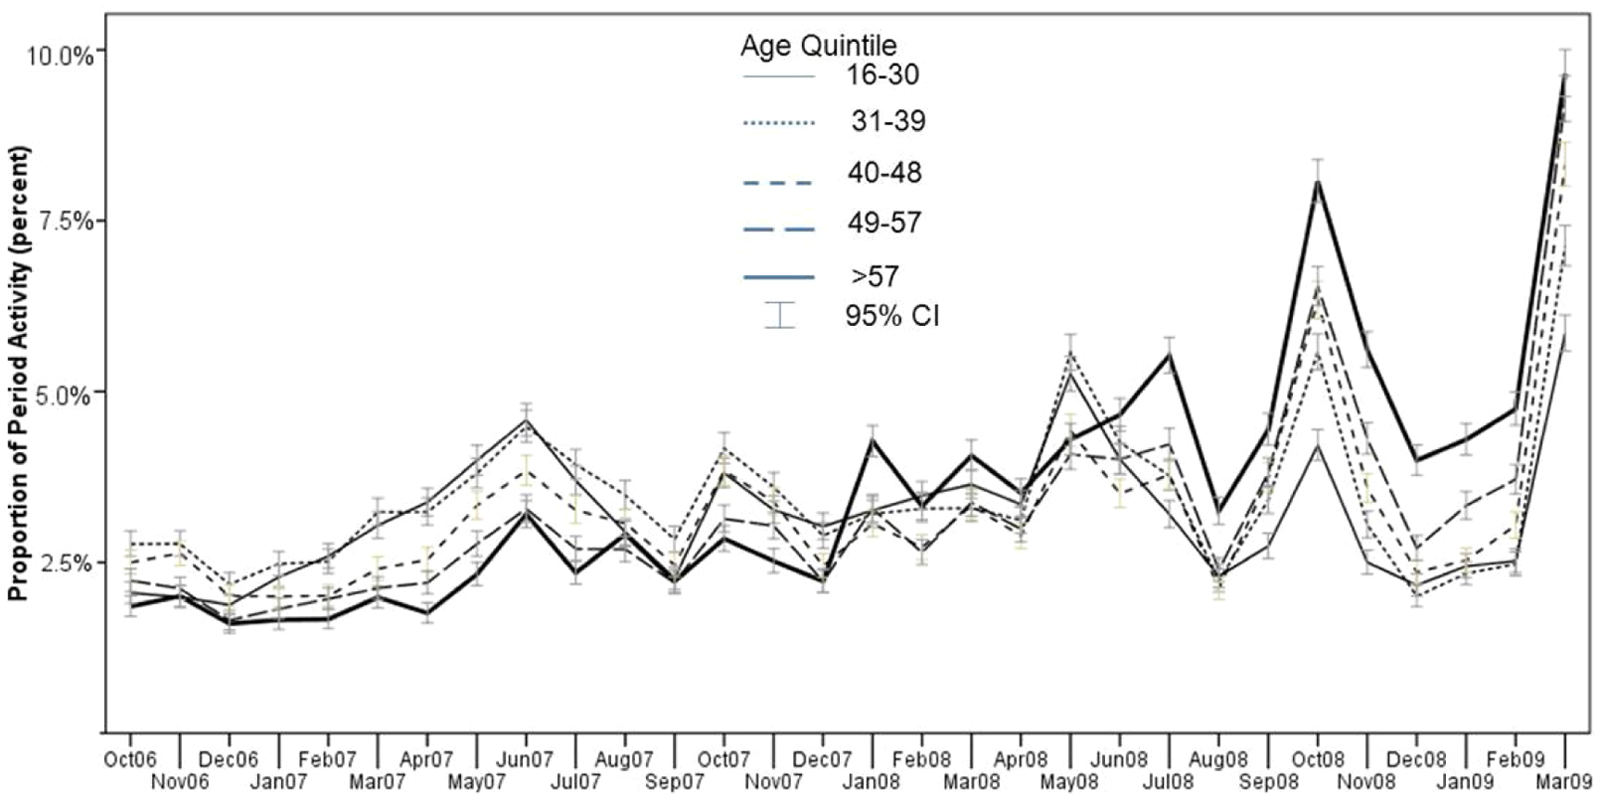
Distribution of choice activity by member age.
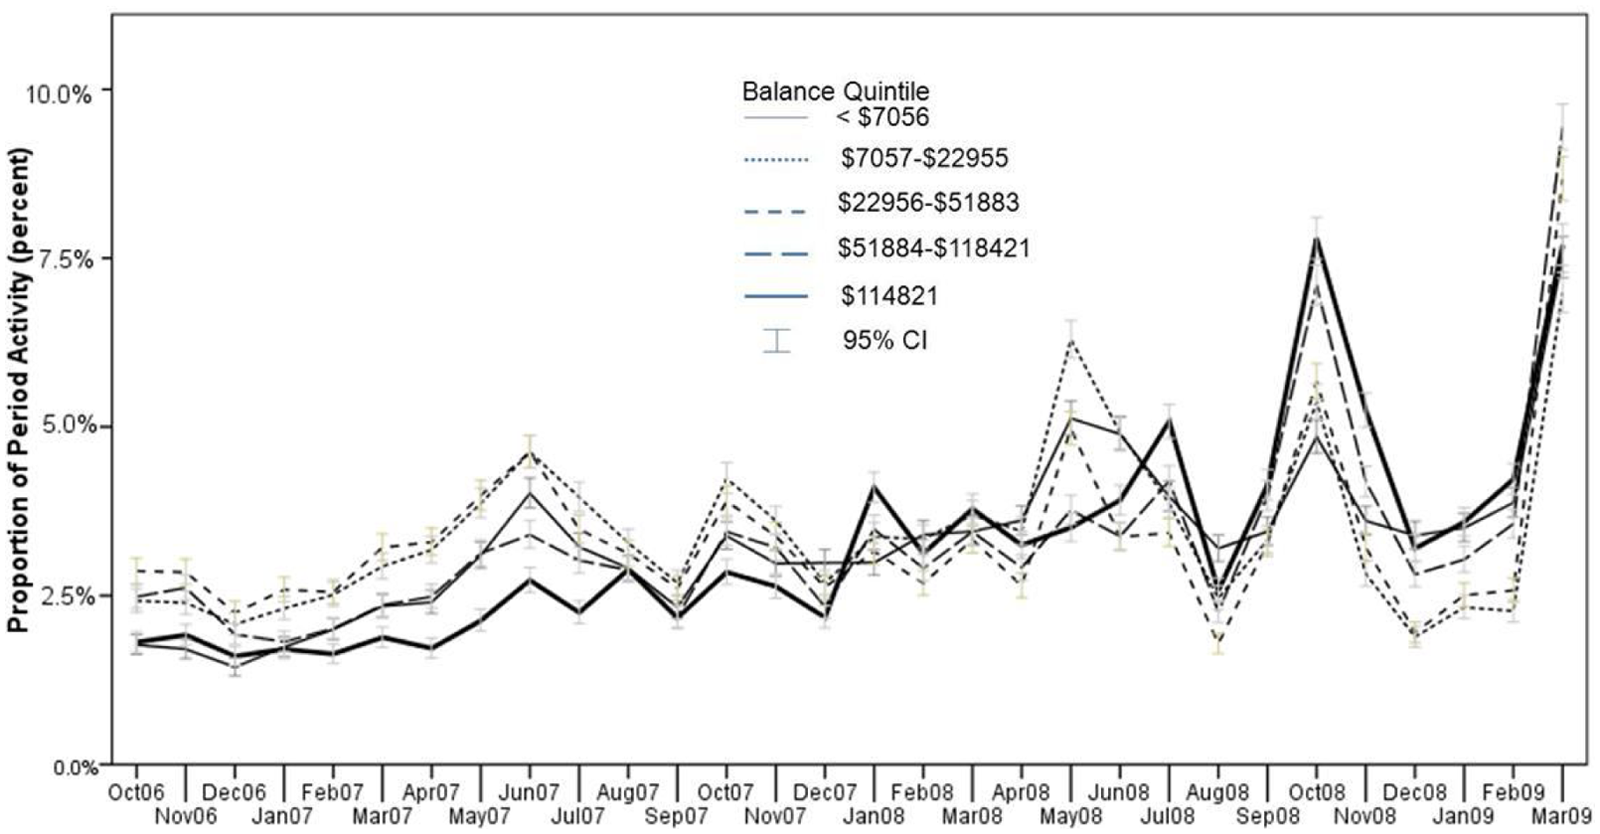
Distribution of choice activity by member balance.
Figure 2 identifies that fund-level differences in choice activity do exist, but overall stock market performance provides a strong narrative in describing member activity across funds. Increased market returns after September 2006 produced rolling six-month market returns exceeding 20 per cent at several points up until May 2007. This coincided with increased choice activity, which peaked in May and June 2007. The subsequent market decline to August 2007 is reflected in activity in September and October 2007. The substantial market declines in January, March and July 2008 also coincided with increased member activity. The peak in activity for Fund Five in August 2008 is the only outlier relative to other fund member behaviour. With the exception of Fund Five, the months of October 2008 and March 2009 stand out as those with the largest activity. These months are clear markers of the GFC, with October 2008 being where the market had the largest daily declines and March 2009 being where the market reached, in hindsight, its low point.
By their behaviour these members identify themselves as engaged. To what extent this engagement is due to higher levels of financial literacy, including general financial knowledge and awareness of processes such as how to make an investment change and the super system more generally, or is a short-term reaction to short-term market performance consistent with return chasing behaviour documented previously (Clark-Murphy et al., 2009) is unclear. To further explore these choices, Figure 3 examines the mean monthly asset class exposure in CICs. 5 Effective asset class exposures were determined using the reported asset allocations listed in the fund annual report. The decline in equity exposure in August 2007 followed the 11 per cent drop in equity markets commencing from the last week of July 2007 to the middle of August 2007, with corresponding increases in cash and fixed interest exposures. Similarly, in December 2007, July 2008 and October 2008 equity exposures declined substantially following stock market movements and exposure to equity reached its low point in March 2009. While fixed interest exposures increased, the reduction in risk was achieved through comparatively larger increases in cash. The lowest equity exposure in investment changes in March 2009 was also the period of greatest activity, as shown in Figure 2. For most members this represented their one and only change during the period, which meant a double hit from the declines experienced until that point, without the compensation of the subsequent market rebound.
5.3. Who made the changes?
To further examine trends in change activity, the distribution of activity through the period was examined within each of the demographics. Figure 4 provides a distinctive picture of activity by member age, represented by age quintiles. The age pattern after December 2007 is a reversal of the trading in the 15 months to December 2007. During 2007, a largely positive market return period, the youngest age group was most active, with the oldest age group least active. In contrast, the latter largely more negative period had the oldest age group as the most active. This same pattern is evident, if less pronounced, in the three months to September 2006, characterised by stagnant market returns. Older (younger) age groups responded more to down (up) markets, although all were more active during the worst of the GFC.
The distribution of activity by member balance is presented in Figure 5. The behaviour of the largest balance quintile is similar to the oldest age group before and after December 2007. However, the activity of the other quintiles is less consistent. For example, the smallest balance group is more prominent after December 2007, more so than middle-balance quintiles. This suggests a correlation between age and balance, as expected, but not a uniform relationship. The distribution of choice activity by member contributions, not reported, is similar in that the highest contributions quintile changes went from being the least active in the early part of the period to more active in later periods. In contrast with activity by balance, the timing of this change is earlier, such that more of the choice activity for the largest contributions’ quintile occurs after July 2007. The relative distribution pattern of other contributions’ quintiles is less consistent again than balance or age. An examination of activity by membership length, not reported, suggests that the newest and longest-term members were least active until July 2008, when they became the most active. The remaining quintiles do not suggest a consistent relative pattern in activity over time. A final analysis of gender suggests only a marginal difference in the distribution of activity by gender. There is some evidence of marginally more activity in the first seven months for females and corresponding smaller activity in some months, but this is not for any consistent length of time.
5.4. Regression analysis results
The univariate analysis suggests differences in the demographic profile of those who made an investment change across the whole period, as well as before and during the GFC. It is also suggestive of possible interrelationships between factors that can be better assessed through a regression framework, which compares each of the three investment change groups to the No Choice group. The estimation was applied only to members who had been a member during the whole period. That is, new members or members who exited during the period were not included. This introduces a potential bias in results in that they are restricted to ‘surviving’ members. In the sample used in the regression, 95 per cent of members made no change. Of those who made a change, 25 per cent made one change in the Pre-GFC period. A further 60 per cent made a choice only in the GFC period and the remaining 15 per cent made a choice in both.
Three models were estimated. The first model (not reported) included member demographics and fund membership dummies. The second model (reported as the base model in Table 5) includes a non-linear specification for age and membership length. The full model additionally includes interactions between gender and each demographic. Results are presented in Table 5, together with a summary of a number of specification tests. In addition, the final two columns report marginal effects and standard errors calculated at mean values of each of the remaining covariates.
Regression results of choice group and member demographics

n = 1,607,857, ***99%, **95%, *90% confidence levels
This table presents the results of a multinomial logistic regression of choice (Pre, GFC, Both) relative to the base no choice category. Robust standard errors were estimated with residuals clustered by fund membership. A likelihood ratio test of the full versus base model specification is reported. Hausman’s test of independence of irrelevant alternatives (Hausman and McFadden, 1984) was estimated for the deletion of each category in turn and rejected at 99% confidence level using likelihood ratio tests. In addition, a collapsed three-category regression was estimated by in turn combining all pairings of dependent categories (six in total). A likelihood ratio test rejected each specification relative to the full model
As Ai and Norton (2003) have highlighted, the sign of interaction terms cannot be relied on at face value to reveal either the direction or significance of a relationship. To investigate this, the marginal effects were estimated across a range of covariate combinations, which indicated that the sign and significance of marginal effects can in fact be interpreted as reported over the distribution of observed values in the sample. Allison’s (1999) test for unexplained variation by gender does not reject the null hypothesis of equality supporting comparisons of coefficients linked to gender.
The marginal effects of the full model presented in Table 5 suggest that, relative to those in the No Choice group, the likelihood of making a change was positively related to member balance and contributions level for the Pre-GFC, GFC and Both groups. Age was not significant for the Pre-GFC group, either by itself, squared or moderated by gender. In the GFC group, both age and age-squared are significant and combined suggest a U-shaped relationship such that there is a decline in the likelihood of making a change to the age of 27 and increase afterwards, although the combined effect of age is negative until age 53 years. This does not appear to be moderated by gender. While the signs of age and age-squared are similar for the Pre-GFC and Both groups, only the squared term is significant for those in the Both group. Membership length also provides a U-shaped relationship with the likelihood of making a change, with both the level and squared term significant. However, the relationship is negative up to a membership length of 14 years, which accounts for 85 per cent of the sample. The interaction term for gender and membership is also significant for the Pre-GFC group, suggesting a moderated U-shaped relationship for males.
5.5. Economic significance
To examine the economic significance of the marginal effects, the estimated probability for each of the four groups was estimated at the 5th percentile, median and 95th percentile combinations for two variables at a time, holding all other covariates at their mean value. In addition, to account for interactions, predicted probabilities were estimated separately by gender. A selection of results is presented in Table 6.
Predicted probabilities based on full model
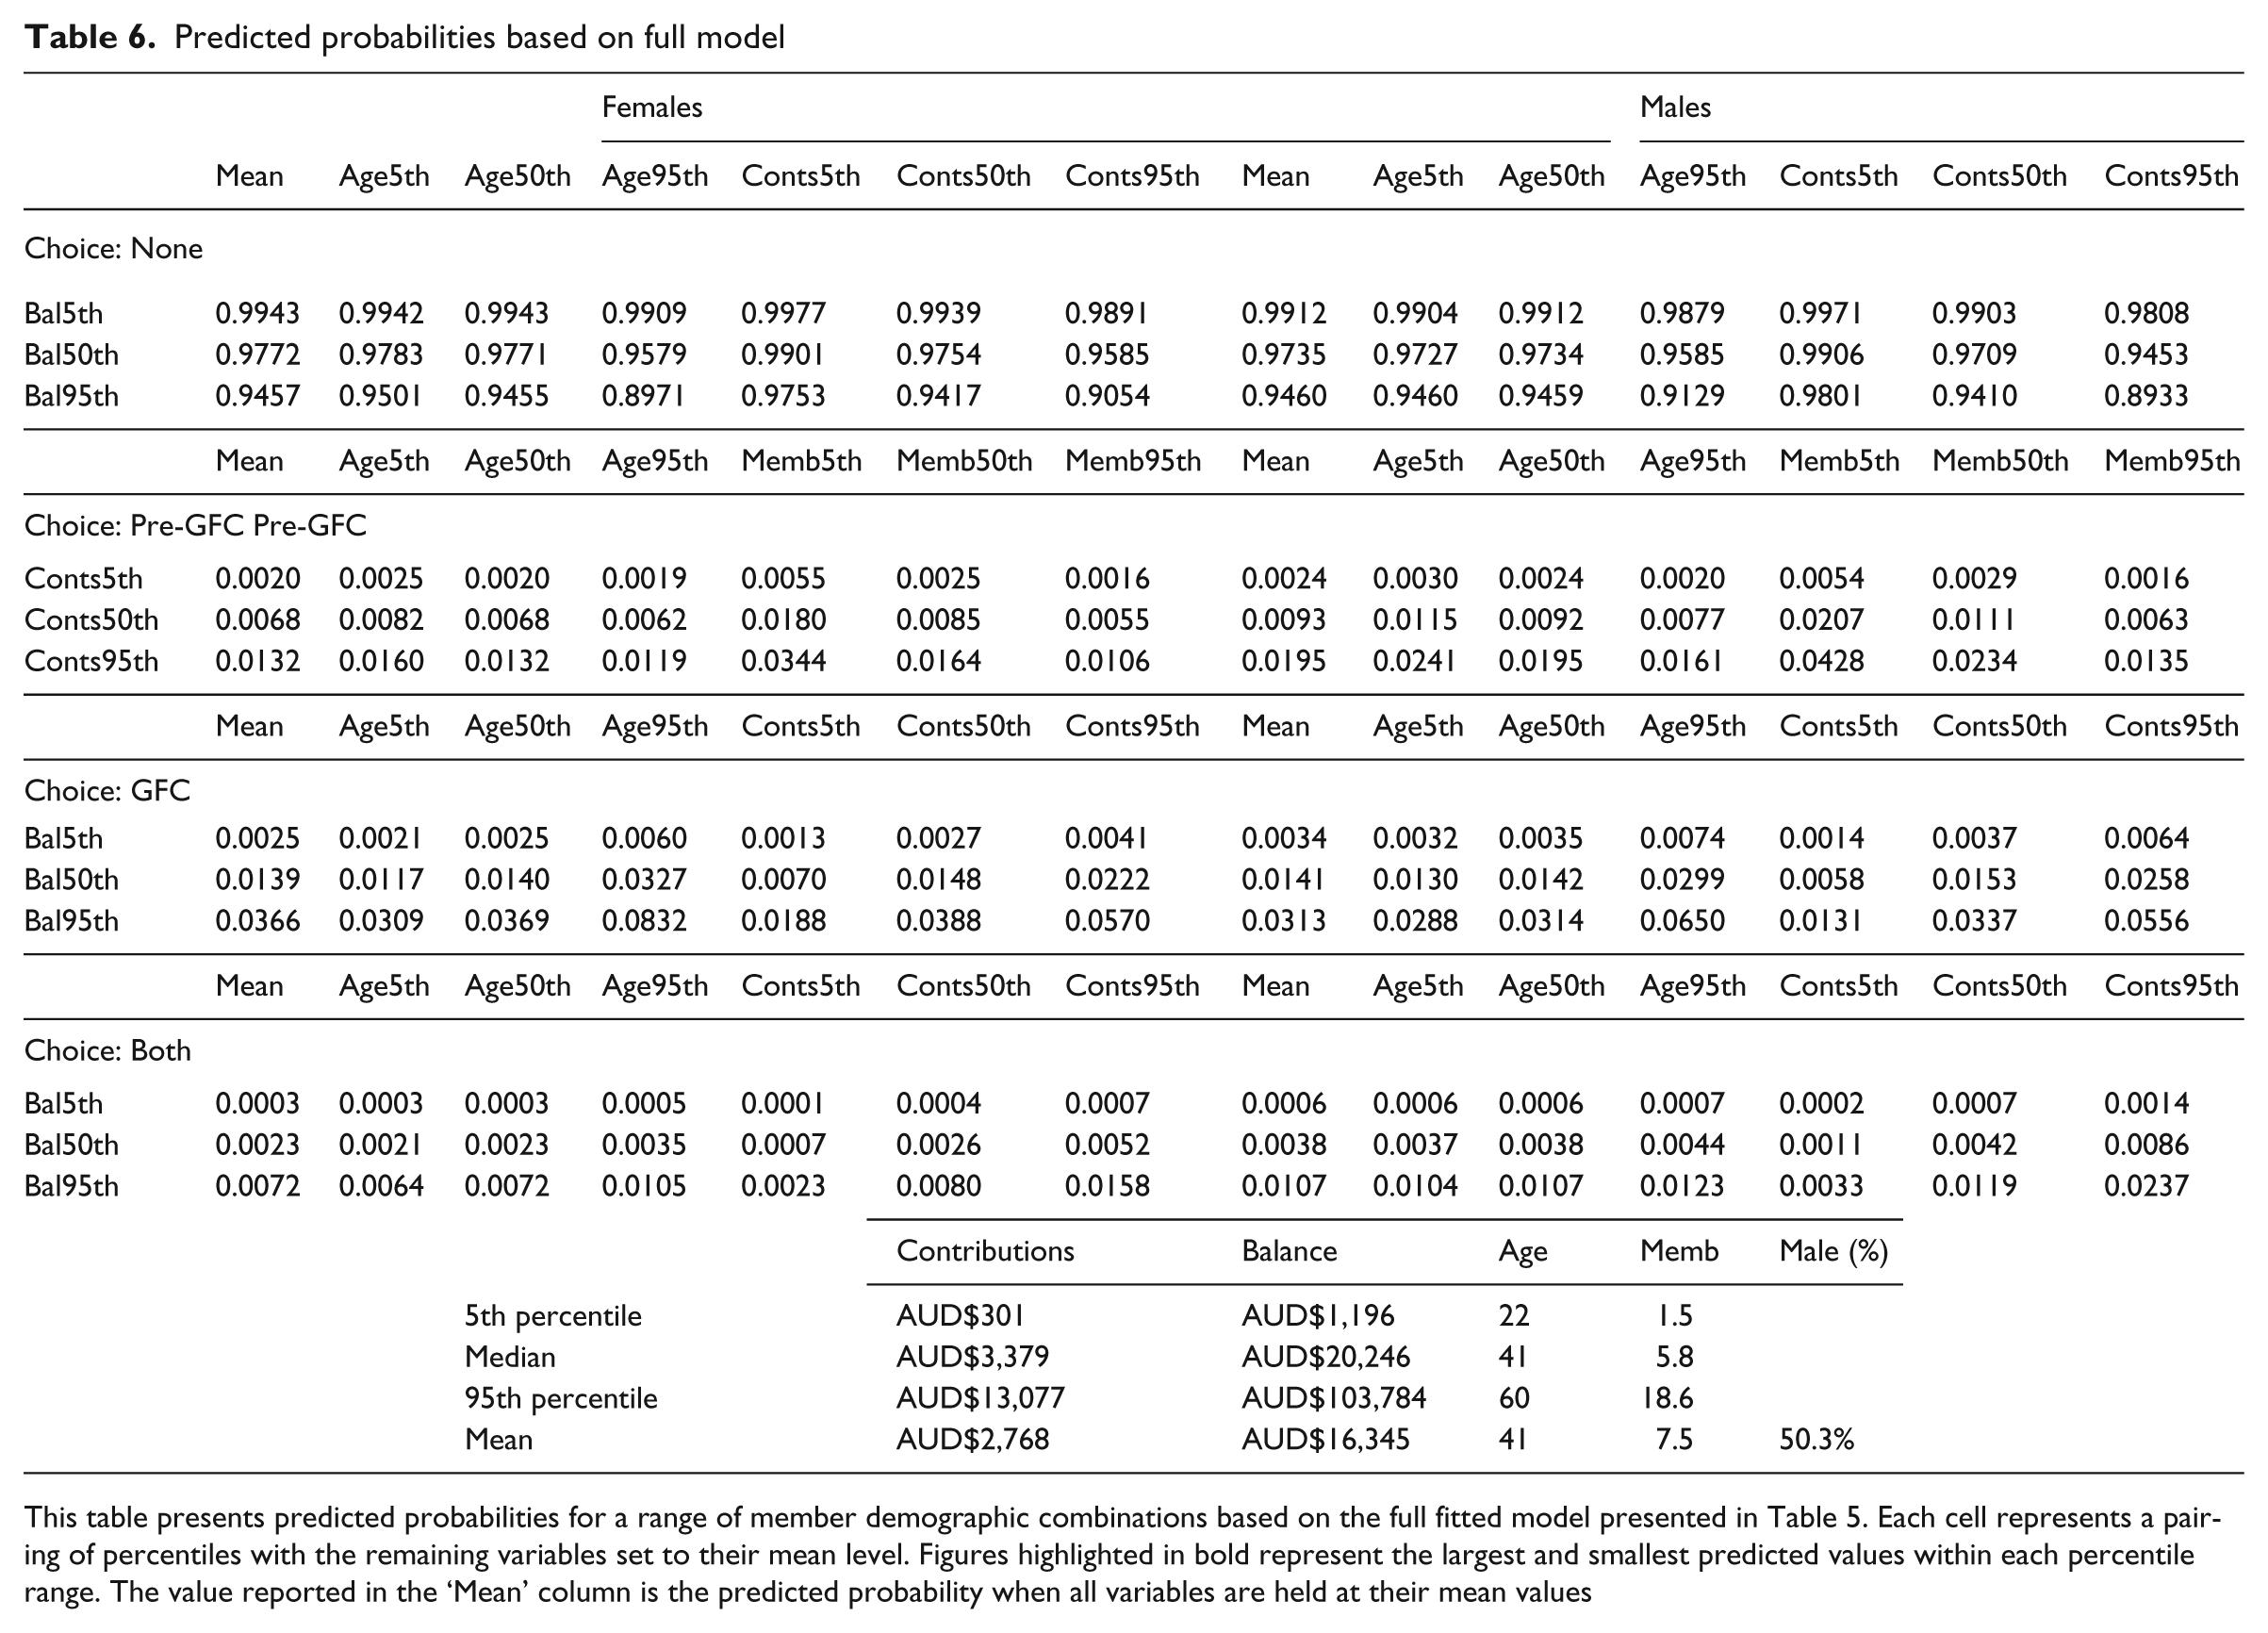
This table presents predicted probabilities for a range of member demographic combinations based on the full fitted model presented in Table 5. Each cell represents a pairing of percentiles with the remaining variables set to their mean level. Figures highlighted in bold represent the largest and smallest predicted values within each percentile range. The value reported in the ‘Mean’ column is the predicted probability when all variables are held at their mean values
The differences in probabilities across the distributions are relatively large for age, membership, balance and contributions. Firstly, the predicted probability of being in the No Choice group is largest for those members at the 5th percentile of both contributions and balance (99 per cent) relative to members in the 95th percentile of each (90 per cent). The negative marginal effect of membership is large, as evidenced in the Pre-GFC group. For example, the predicted probability for a male at the 95th percentile of contributions is 4.3 per cent for the 5th membership percentile and only 0.5 per cent for the 95th percentile of membership. Similarly, for females in the GFC group at the 95th percentile of balance, the predicted probability is 8.3 per cent at the 95th percentile of age but 0.6 per cent at the 5th percentile of age.
While some gender differences are evident, the magnitudes are smaller generally. Interestingly though, females have larger predicted probabilities within the GFC only group, whereas males have higher predicted probabilities in the Pre-GFC and Both groups. The significant and negative marginal effect for the gender interaction for balance in the GFC group can also be identified in the predicted probability. Female members at the 95th percentile of age and balance had a higher probability (8.3 per cent) than males (6.5 per cent). This is a significant difference at the 95 per cent confidence level, whereas the larger predicted probability for females at the median balance level is not significant.
5.6. Limitations
The sample of funds analysed in this analysis is significant in terms of the assets and number of members. A limitation of the analysis is that it does not include retail funds; however, the sampled funds have investment choice menus characteristic of many retail products and, in addition, the members are drawn from a wide range of industries and employers, and therefore provide an insight into the behaviour of a significant proportion of Australians. The data does not allow an insight into whether those who made a choice during the period had made a choice previously. It is therefore not possible to determine whether those who had previously been in the default were any more or less likely to have made a change than those who previously exercised choice.
The analysis has been restricted to the revealed behaviour of a sample of superannuation fund members, rather than any direct evidence of motivations or attitudes. Changes in attitudes and beliefs underlying these changes, or lack thereof, are not captured completely by the behaviour. Aside from the choice of investment strategy, the level of contributions a member saves is also critical in determining accumulated savings. The two choices are related in that, for example, a desired accumulated savings level may be achieved by combining a higher (lower) contributions level with a lower (higher) investment risk level. However, no information on changes to contribution levels was available for the sample.
The GFC’s substantive impact on members may have been through their employment and other financial assets, which are both unobserved in the available data. To the extent that each fund represents industries impacted differentially by the GFC, the estimation controlled for this to some degree via the inclusion of fixed effects for fund membership.
Finally, Iwaisako et al. (2004) have suggested little of relevance can be said about retirement savings asset allocation decisions unless other assets, such as pension entitlement and housing, are included in the analysis. To that list we can add human capital, which Campbell (2000) described as the largest component of wealth for most households. Some members may have responded to the GFC by increasing their stock of human capital through deferring retirement, rather than adjusting their superannuation investment strategy. The view that individuals consider each of these forms of savings as part of a total portfolio is contestable (Thaler, 1999). Notwithstanding, not having access to additional member information is a limitation of the analysis and the conclusions drawn need to bear this caveat in mind.
6 Discussion and future work
The GFC provided many superannuation fund members with their largest negative annual return since the introduction of the Superannuation Guarantee in 1992. A compelling result presented in this paper is that the majority of members over this period did not make an investment strategy change in response. Over a three-year period, including the GFC, the proportion of members who made a change to their investment strategy ranged between 5 and 6.5 per cent across funds. Relative activity did increase during the most volatile month of the GFC (October 2008) as well as the month of the market’s lowest point (March 2009), but overall this represents a minority of members. Of those who did make a choice, 25 per cent were in the Pre-GFC period (October 2007–December 2008), 60 per cent were in the GFC period (January 2008–March 2009) and 15 per cent were in both. If these are consolidated, 65 per cent made a choice during the GFC period compared with 35 per cent in the Pre-GFC period. A concerning aspect of this is that most members made their one choice, reducing equity exposure, just as the market reached its bottom, thus ensuring a double hit of enduring the GFC declines and missing out on the subsequent market improvement.
In terms of explaining the likelihood of making changes, the hypothesised influence of member demographics was confirmed in respect of wealth and income. Making a change during the GFC, or in both periods, was positively related to member balance and contributions, and was stronger in the GFC. The estimated relationship for age was richer than evident in previous work. The likelihood of making a choice during the GFC period was non-linear, declining to age 27 before increasing. Age was not a significant factor in the likelihood of those making a change in the period before the GFC and, while it was positive for those making a choice in both periods, the effect was small. The negative relationship between membership length and likelihood of making a change was unexpected. This could be attributed to new members who had rolled over balances into the fund having a particular focus on investment change options compared with members with similar balances but longer membership. These results may also suggest greater salience of fund communications to new members that highlight the menu of investment choice offerings, which tapers with familiarity. The significant marginal gender effect in the GFC change group is also not as suggested by previous research, which has generally identified greater choice activity among males. Significant differences were isolated to female members with large balances.
It remains difficult to assign these findings as supporting a particular theory in isolation. The suggested role of human capital in life-cycle model extensions (Bodie et al., 1992) fits well the pattern of older members being more active during the GFC. With less stock of labour and less flexibility in labour, adjusting financial risk becomes more likely. However, younger males, who were disproportionately represented in those made unemployed during the GFC, are not similarly estimated to be more likely to make a change as would be predicted. It could be argued that the human capital risk was not perceived by the younger group as having been significantly changed by the GFC. The lower likelihood estimated for younger members to make a change during the GFC is also consistent with empirical evidence that younger members were more likely to listen to injunctive messages from funds and government advising against a change, although the same was not true of female members, as was previously suggested (Croy et al., 2010b).
The small proportion of choice activity matches levels described elsewhere, both in Australia and internationally, as evidence of member inertia. The low levels of choice have led to a common refrain that members are not engaged (Australian Treasury, 2008) due to apathy (Association of Superannuation Funds of Australia Limited, 2008: 9) or poor understanding (Mercer Australia, 2010: 9).This is despite a growing choice menu available to members. Given the increased size of fund investment choice menus, funds clearly consider investment choice important to their members. The degree of choice varies, however, across funds, which mirrors the variability in retirement savings systems at a country level, as reviewed by Rozinka and Tapia (2007). Given the proportion of members who actually exercise choice though, it would appear that for the majority of members it is of limited value. The members exercising choice are older, have larger balances and contribute more. Therefore, while constituting a small proportion of members, they represent a sizeable asset pool and funds are understandably loathe to lose funds under management if these members look elsewhere to make investment choices. The focus can, however, be turned back on the funds to ask why changes or innovations to investment choice menus have not led to any significant overall change in member activity or engagement.
A further area of worthwhile future research is the impact of the choice timing permitted by funds. The difference in choice being effective the next day or the next month can be significant, particularly in periods of market decline, such as the GFC. It is important to distinguish between such differences being motivated by administrative factors or deliberate choice by trustees to dampen activity. The question is whether the result reported here that the lowest level of activity belonging to the fund with the longest effective choice lead time is more widespread and, if so, what the consequences are for members.
The behaviour of members over the period provides support for the Super System Review (Commonwealth of Australia, 2010) choice architecture, which separates those members wishing to exercise choice from the majority who choose not to and remain in the fund default. However, the behaviour of those who did make a change also underscores a potential risk in the new ‘choice architecture’. The majority of members do not make changes, and the majority of members who do make a change only make one. The act of choice does not cast these individuals as informed investors, just as the lack of choice by the majority does not mean they are disengaged. In fact, the latter supports a view that advice was heeded and that communication of injunctive norms are important to members (Croy et al., 2010a). Consistent with this, and the Super System Review’s approach, financial literacy efforts that attempt to separately target those who do and do not make choices may be more effective. Future work that can report on the subsequent choice activity of these members would be worthwhile in this regard and particularly given that evidence suggests rebalancing is a worthwhile activity.
Footnotes
Acknowledgements
Thanks to Jacqui Whale who provided the expertise and stamina to complete the task of assembling a coherent database from the various data sources used in this paper. Thanks also to the funds for agreeing to supply the data and administrators, including Hans Van Daatselaar. Thanks to Alissa Harnath and Andrew Barr from the Australian Institute of Superannuation Trustees (AIST), who facilitated the data supply. Finally, thanks to the helpful comments of an anonymous referee.
Funding
We thank the Australian Institute of Superannuation Trustees for funding support for this project.