
Abstract
We investigate the coexistence of momentum and contrarian strategies in the Australian equity market from 1992 to 2011. We show that contrarian strategies prevail in the short-term investment horizon while momentum strategies dominate in the intermediate- and long-term horizons. However, only short-term contrarian strategies significantly outperform the simple buy-and-hold strategy of investing in the market index over the same period. Further examination of these strategies shows that the Australian mining sector undermines the performance of momentum while enhancing performance of contrarian strategies. Lastly, using both parametric and non-parametric approaches, we show that these strategies’ returns are persistent anomalies and not completely explained by standard return-generating models.
1. Introduction
While no consensus exists about the profitability of a particular trading strategy, it has been reported that creating a portfolio by buying securities that have had high returns over the past few months (winner securities), and selling those that have had poor returns over the same period (loser securities) yields significantly positive returns (Jegadeesh and Titman, 1993). This momentum strategy exploits behavioural shortcomings in investors, such as investor herding, investor over- and underreaction, and the need for confirmation. In contrast, many investors believe that the best time to invest in a security is when shortsightedness of the market has beaten down the price. This contrarian strategy relies on buying such distressed stocks, and selling after the stocks recover while financing the purchase through short selling unjustifiably high valued securities that will eventually drop in price.
Our study has three objectives. Firstly, we document the concurrent profitability of momentum and contrarian strategies for three investment horizons from December 1992 to August 2011 and compare them to the simple buy-and-hold strategy of investing in the Australian market index over the same period. Secondly, we question whether size, price-to-book values (PTBVs) and industry classification are important variables in forming loser and winner portfolios. Lastly, we investigate risk-based sources of momentum and contrarian returns using both conventional time-series regression analysis and a non-parametric model-based bootstrap approach. While regression analysis is important to identify relevant risk factors to explain momentum and contrarian returns, the bootstrap test allows us to examine if any return-generating models can produce simulated returns mimicking the characteristics of actual momentum and contrarian returns.
In their seminal work, De Bondt and Thaler (1985, 1987) show that winner stocks of the previous two to five years become losers due to long-term correction after investors overreact to adverse information. Therefore, contrarian strategies of simultaneously buying previous losers and selling previous winner stocks produce positive returns for the investment holding periods from two to five years. Subsequent studies by Jegadeesh (1990), Jegadeesh and Titman (1995) and Lehmann (1990) reaffirm these findings for the short-term investment periods ranging from one week to one month.
In contrast to De Bondt and Thaler (1985), Jegadeesh and Titman (1993) demonstrate that investors underreact to information over an intermediate horizon leading to profitable momentum strategies when simultaneously buying previous winners and selling previous losers over holding periods that range from three to twelve months. Since then, studies on profitability of momentum and contrarian strategies have generated great interest among scholars, spanning several past decades and across developing and developed markets. These studies can be broadly categorised into two strands. The first strand is the empirical testing of momentum and contrarian strategies for various asset classes. The second strand aims to explain the momentum and contrarian premiums with changes in stock fundamentals and behavioural information.
A large body of literature has documented the coexistence of momentum and contrarian strategies in the US market (Conrad and Kaul, 1998; Grundy and Martin, 2001; Jegadeesh and Titman, 1993, 2001; Karolyi and Kho, 2004; Mun et al., 2000; Wu, 2002). 1 While momentum strategies were found profitable in the intermediate horizon ranging from three to twelve months (Conrad and Kaul, 1998; Grundy and Martin, 2001; Jegadeesh and Titman, 2001; Karolyi and Kho, 2004; Korajczyk and Sadka, 2004; Novy-Marx, 2012; Wu, 2002), the profitability of contrarian strategies was significant at either shorter or longer than the three-to-twelve-month horizons (Conrad and Kaul, 1998; Mun et al., 2000). The recent study by Jegadeesh and Titman (2011), however, shows that the momentum profitability has diminished over time and did poorly in the most recent period. This is consistent with the finding in Hwang and Rubesam (2013) suggesting that momentum profits have slowly eroded in the US market since the late 1990s and its positive momentum returns during the late 1990s are driven by the extraordinary performance of high-tech and telecom stocks. Once these stocks were excluded, the profitability of momentum strategies decreased significantly and was smaller than that reported by Jegadeesh and Titman (2001). In this study we investigate whether the mining sector plays a similar role in the Australian equity market, given its performance in the past two decades.
Theories to explain the momentum or contrarian anomalies, however, are not conclusive. The literature raises a question as to whether a risk- or behavioural-based explanation is the underlying reason for the superior performance of the momentum and contrarian anomalies. De Bondt and Thaler (1985), Conrad and Kaul (1998), Grundy and Martin (2001), Karolyi and Kho (2004), Lee and Swaminathan (2000) and Rouwenhorst (1998) support the risk-based explanation of momentum arguing that returns of winner and loser portfolios appear to be correlated with the expected market risk premium. This suggests that momentum returns are sensitive to the way risks are estimated. Conrad and Kaul (1998) show that momentum profitability can be explained completely by the cross-sectional dispersion of unconditional mean returns. This suggests that risk-factor models, such as the three-factor Fama and French (1992) model, can explain the cross-sectional momentum return. In contrast, Grundy and Martin (2001) propose that while the factor models can explain most of the variability of momentum returns, they fail to explain their mean returns. Wu (2002) demonstrates that incorporating conditional market information into asset pricing models appears to capture both short-term momentum and long-term reversal.
Studies favouring a behavioural-based interpretation argue that the magnitude and persistence of momentum and contrarian returns are too strong to be explained in a traditional risk-based asset pricing paradigm (De Bondt and Thaler, 1985; Hong et al., 2000; Lakonishok et al., 1994). De Long et al. (1990) and Daniel et al. (1998) argue that investors are overconfident and overoptimistic when forming return expectations that are too extreme from the fundamental value. This leads to a behavioural tendency to overreact to bad news while underreacting to good news. Therefore, momentum is a symptom of underreaction and contrarian overreaction. According to this line of research, short-term return anomalies are characterised by the serial correlation of individual stock returns. If the serial correlation is caused by underreaction in the ranking period, then positive momentum return is experienced during the holding period. Conversely, when the serial correlation is caused by delayed overreaction in the ranking period, then negative contrarian return is expected in the holding period. 2
Given the thin literature on the coexistence of momentum and contrarian strategies outside the US market, we investigate the phenomena of return reversal and continuation (De Bondt and Thaler, 1985; Jegadeesh and Titman, 1993) in the context of the Australian equity market for the short-, intermediate- and long-term investment horizons. We define a strategy as short-term if the holding and ranking periods are from one to twelve weeks; as intermediate-term if they are from three to twelve months and as long-term if they range from two to five years. Our results show that it is possible to generate profits in the Australian equity market using contrarian strategies in the short-term investment horizon as well as momentum strategies in the intermediate- and long-term horizons. The best contrarian return in the short term arises from the one-week holding and one-week ranking period, earning $55.93 in August 2011 for $1 invested in December 1992. 3 The best momentum strategies in the intermediate- and long-term are the nine-month holding and six-month ranking period and 60-month holding and 48-month ranking, respectively, earning $2.70 and $1.90 for $1 invested over the same period. Nevertheless, only the contrarian strategies outperform the simple buy-and-hold strategy of investing in the market index over the same period.
Our results confirm the findings of Jegadeesh (1990) and Lehmann (1990), which show that losers over the past one week to one month outperform winners over the next one week to one month, and of Jegadeesh and Titman (1993) that return continuation occurs in intermediate horizons with ranking and holding periods from three to twelve months. Our results suggest that return momentum persists strongly in the long-run horizons for the Australian equity market while other developed markets experience a long-run tendency toward reversal of price trends (see Conrad and Kaul, 1998; De Bondt and Thaler, 1985, 1987; Wu, 2002; Yao, 2012 for the US market, Schiereck et al., 1999 for Germany and Chin et al., 2002 for the New Zealand market).
Since the Australian economic growth is largely driven by the mining boom spurred by the demand for resources by emerging economies, with China being the most significant (Battellino, 2010, p. 67), our investigation on the impact of mining stocks on the profitability of contrarian and momentum strategies provides insights on the role of the mining sector in the Australian equity market. We show that mining stocks made up at least one-quarter to at most one-third of total stocks in the strategies at all times. Over time, they undermine the performance of momentum strategies while enhancing the performance of contrarian strategies. Furthermore, these effects are more pronounced when the lengths of ranking and/or holding periods are extended. It is therefore suggested that investors seeking to benefit from short-term contrarian strategies in Australia should include mining stocks in their portfolios while those interested in longer-term momentum strategies are better off without them.
Finally, the concurrent existence of momentum and contrarian anomalies in the Australian equity market from December 1992 to August 2011 prompts us to evaluate if these returns are a compensation for exposure to risk factors, implying zero risk-adjusted return, or persistent anomalies unexplained by conventional asset pricing models. Our time-series analysis shows that the market factor does not explain contrarian returns; it plays a significant role in explaining momentum returns. The size (SMB) factor is found to have significant explanatory power for all three strategies, whereas the value (HML) factor plays a significant explanatory role only for the short-term contrarian strategies. 4 In addition, using non-parametric techniques we examine if the random walk with drift (RW) model, the capital asset pricing model (CAPM) and the Fama and French three-factor (FF) model can generate simulated returns as large as the actual momentum and contrarian returns, implying zero-risk adjusted returns for these strategies. Our bootstrapped results show that none of these models completely characterise the return anomalies. We therefore suggest that momentum and contrarian returns are persistent anomalies in the Australian equity market.
This study is the latest investigation of momentum and contrarian strategies in the Australian equity market and therefore allows us to reconcile mixed findings of previous studies within the Australian market. For example, we complement momentum existence in intermediate-term investment horizons in Bettman et al. (2009), Brailsford and O’Brien (2008), Demir et al. (2004) and Hurn and Pavlov (2003) but join Gaunt and Gray (2003) in being sceptical about the strategy performance compared to the buy-and-hold strategy of investing in the market index. We extend these studies and show that the momentum phenomenon continues to exist in long-term investment periods from two to five years. Our study is the first one to show that short-term return reversal from one week to one month is pervasive in the Australian stock market, although this trend has been long reported by Jegadeesh (1990) and Lehmann (1990) and Jegadeesh and Titman (1995) for the US market. Most importantly, our study is the first to show that the distinctive characteristic of the Australian economic growth spurred by the mining boom in the last two decades explains the influential role of mining stocks in the performance of momentum and contrarian strategies.
The paper proceeds as follows. Section 2 describes the data and methodology. Section 3 presents the empirical results, followed by Section 4 that investigates the sources of momentum and contrarian profits. Finally, Section 5 concludes.
2. Data and methodology
Using daily prices of 2234 common stocks listed on the Australian Securities Exchange (ASX) from December 1992 to August 2011, we calculate weekly and monthly individual stock returns. To control for the weekend and end-of-the-month effects, we use closing Wednesday quotes for weekly returns and mid-month quotes to compute monthly returns. We form momentum and contrarian strategies by evaluating cumulative stock returns over the past
To address the concern of illiquid and unshortable stocks in the loser portfolio, we perform two robustness checks: (1) we only consider stocks constituting the ASX300 market index;
5
(2) we remove stocks with the average market value below $50 million during the ranking period as per ASX Market Rules Guidance Note 34
6
in constructing winner and loser portfolios. We form a zero-investment momentum (contrarian) portfolio by buying (selling) the winner portfolio and selling (buying) the loser portfolio and hold the position for the next
In this study we assess the performance of momentum and contrarian strategies in the short-term, intermediate-term and long-term investment horizons. The short-term strategies are based on the holding and ranking periods ranging from one to twelve weeks. We consider six different horizons for both holding and ranking periods (i.e. one, two, three, six, nine and twelve weeks). For the intermediate-term strategies, the holding and ranking periods are three, six, nine and twelve months. The long-term strategies are formed when the ranking and holding periods range from two to five years. We consider 24-, 36-, 48- and 60-month alternatives as ranking and holding periods. 8
The Australian economy is largely driven by the growth of countries such as China and India, suggesting that the mining boom may have been crucial to the Australian market in the past two decades (Battellino, 2010). We study if this factor is crucial in determining successful momentum and/or contrarian strategies by comparing the performance of these strategies for stocks of all industries and a subset of stocks exclusive of the mining sector. Figure 1 shows market values and total number of stocks available from 1992 to 2011 for portfolio formation in each ranking period

Market value and the total number of stocks available when forming trading strategies. A total of 2234 common stocks were listed on the ASX at any time from December 1992 to August 2011. Stocks delisted during the ranking period are not considered whereas stocks delisted during the holding period are included in calculating the portfolio returns with the risk-free rate replacing the data from the moment of delisting to the end of the holding period. The number of stocks in the figure is obtained using ranking period
3. Results
Table 1 summarises the average weekly returns of the winner, loser and zero-investment portfolios for the short-term investment horizons. While average weekly returns of the winner portfolios are all significantly negative, those of loser portfolios are significantly positive for most
Short-term contrarian strategies in the Australian market from 1992 to 2011. Weekly returns of winner, loser and zero-investment contrarian portfolios;

and **denote 5% and 1% significance levels respectively.
When mining stocks are excluded, winner portfolios are less negative while loser portfolios are less positive. In other words, the mining sector deepens the loss of winners while strengthening the gain of the losers in post-ranking periods. As a result, returns on zero-investment contrarian portfolios without mining stocks reduce significantly in every combination when compared to portfolios with mining stocks. Nevertheless, these returns remain statistically significant. For example, when mining stocks are not considered, the return of the
In Table 2 Panel A, we report average returns of the winner, loser and zero-investment portfolios for the intermediate-term investment horizons. In contrast to results in the short-term investment horizons, the returns of the loser and winner portfolios are both negative in the three-to-twelve month post-formation periods. However, the winner tends to perform better than the loser portfolio, generating positive momentum returns for 13 out of the 16
Intermediate-term momentum strategies in the Australian market from 1992 to 2011. Monthly returns of winner, loser and zero-investment momentum portfolios;

and ** denote 5% and 1% significance levels respectively.
Although not reported in Table 2, we examine whether the performance of the intermediate-term momentum strategies improve for holding periods longer than 12 months while maintaining the initial ranking period lengths. (Results are available upon request.) We find that the intermediate-term momentum returns reverse to negative in 13 to 36 months after the portfolio formation before picking up positive values again from month 37 to month 60. Our results are in contrast to Jegadeesh and Titman (2001) who report negative returns on the intermediate-term momentum portfolios 13 to 60 months post-formation for the US market.
In Table 2 Panel B, we summarise the results of the 16 momentum strategies when the mining stocks are excluded. Consistent with the results in Table 1, the inclusion of mining stocks, on average, deepens the losses of winner portfolios while increasing the gain/lowering the losses of loser portfolios. It can be observed from Table 2 Panel B that without mining stocks, the returns of winner portfolios are less negative while those of loser portfolios are more negative. Consequently, positive returns of winner-minus-loser portfolios are substantially strengthened in every combination in Panel B. In particular, 15 out of 16 combinations have significantly positive momentum returns as compared to only two combinations reported in Panel A. The
In Table 3 we show that long-term momentum strategies continue to prevail in the Australian market. Overall, 10 out of 16
Long-term momentum strategies in the Australian market from 1992 to 2011. Monthly returns of winner, loser and zero-investment momentum portfolios;
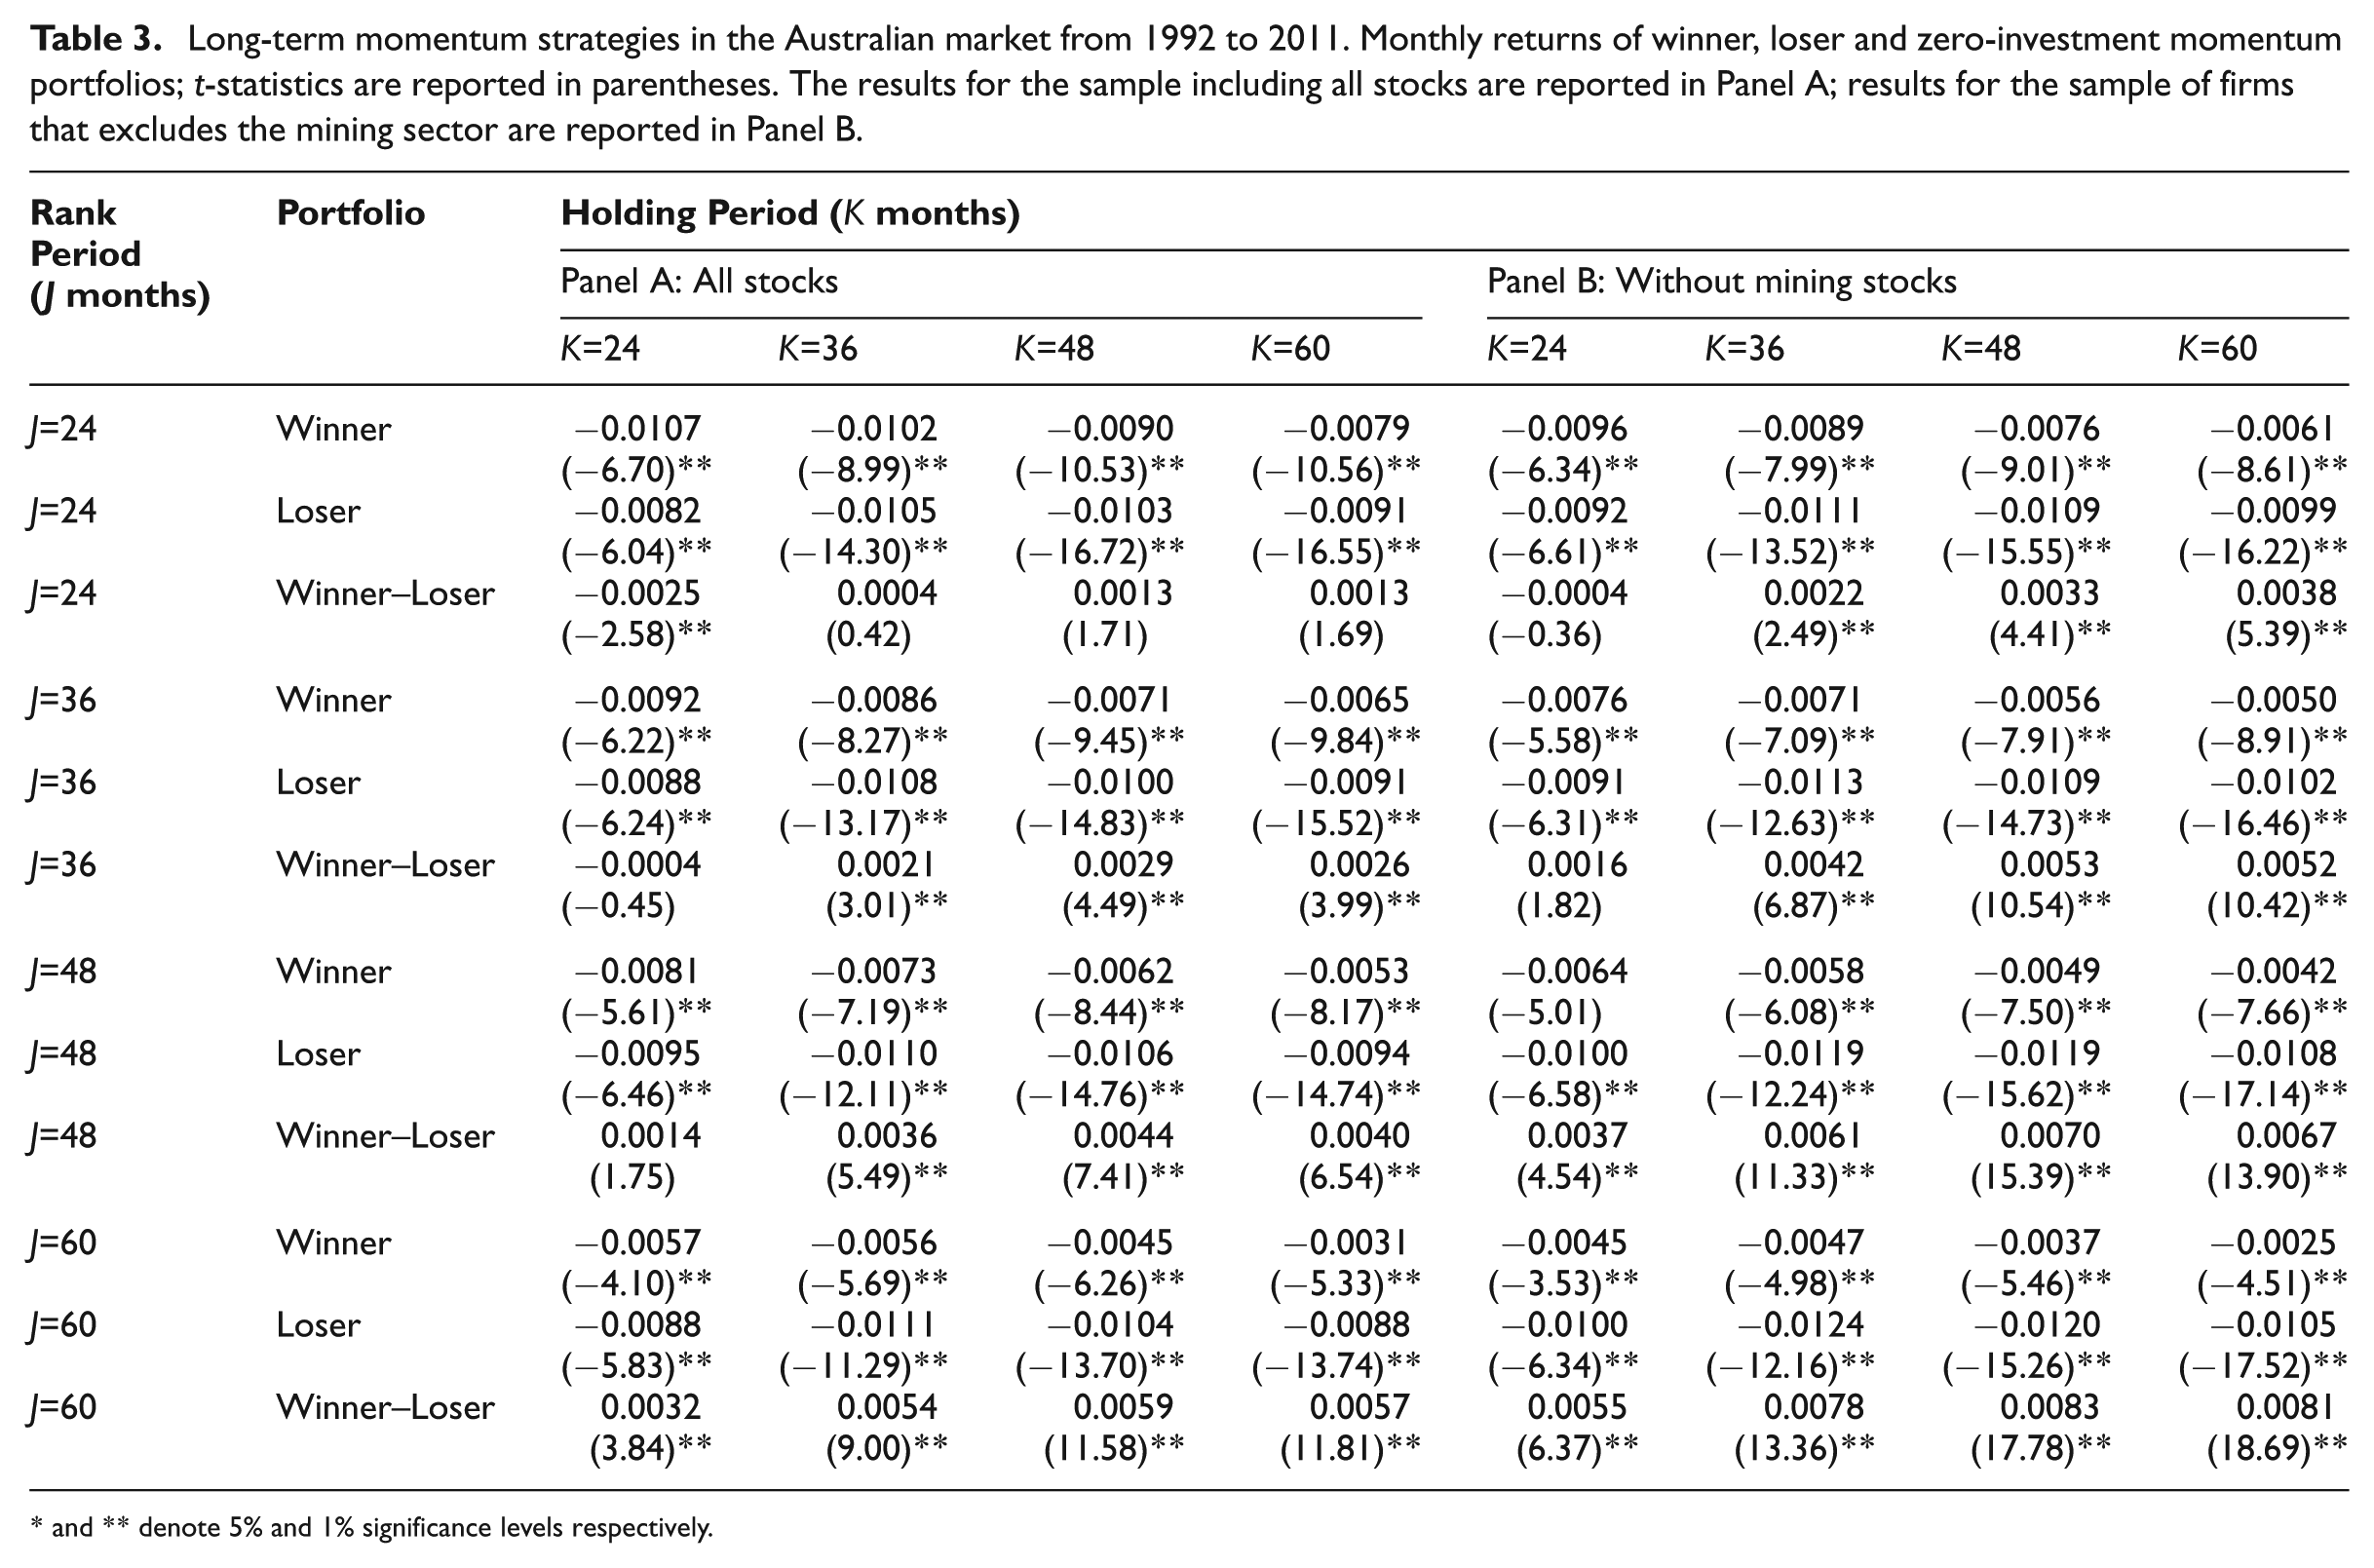
and ** denote 5% and 1% significance levels respectively.
While the contrarian strategies prevail in the short-term investment horizons, the momentum strategies dominate in the intermediate- and long-term horizons. The best returns for short-term, intermediate- and long-term investment horizons arise from the
The investigation of trading strategies without mining stocks provides insightful information about the role of the mining sector in the Australian market. We find that unlike the US momentum returns, which are driven by the extraordinary performance of high-tech and telecom stocks during the late 1990s (e.g. Hwang and Rubesam, 2013; Jegadeesh and Titman, 2001), the performance of momentum and contrarian strategies in the Australian equity market is significantly influenced by the mining stocks. In particular, these stocks undermine the performance of the intermediate- and long-term momentum strategies while enhancing the performance of the short-term contrarian strategies.
3.1 Can momentum and contrarian strategies outperform the Australian market benchmark?
The persistence of short-term contrarian strategies and intermediate- and long-term momentum strategies in the Australian market from 1992 to 2011 prompt us to seek evidence of whether these strategies significantly outperform the broad market index. In Table 4, we investigate the significance of the abnormal return (AR), defined as the difference in returns between the zero-investment portfolio and the ASX300 market index. We examine the period from December 1992 to August 2011 as well as the four equal sub-periods: (i) December 1992 to March 1997, (ii) April 1997 to January 2002, (iii) February 2002 to October 2006 and (iv) November 2006 to August 2011. While periods (i) and (ii) are characterised by the Asian financial crisis and dot-com bubble respectively, period (iv) is characterised by the GFC and the European debt crisis.
ARs of short-term contrarian strategies. Monthly ARs of the short-term contrarian portfolios for the full period as well as the four sub-periods when companies from all industries are available;
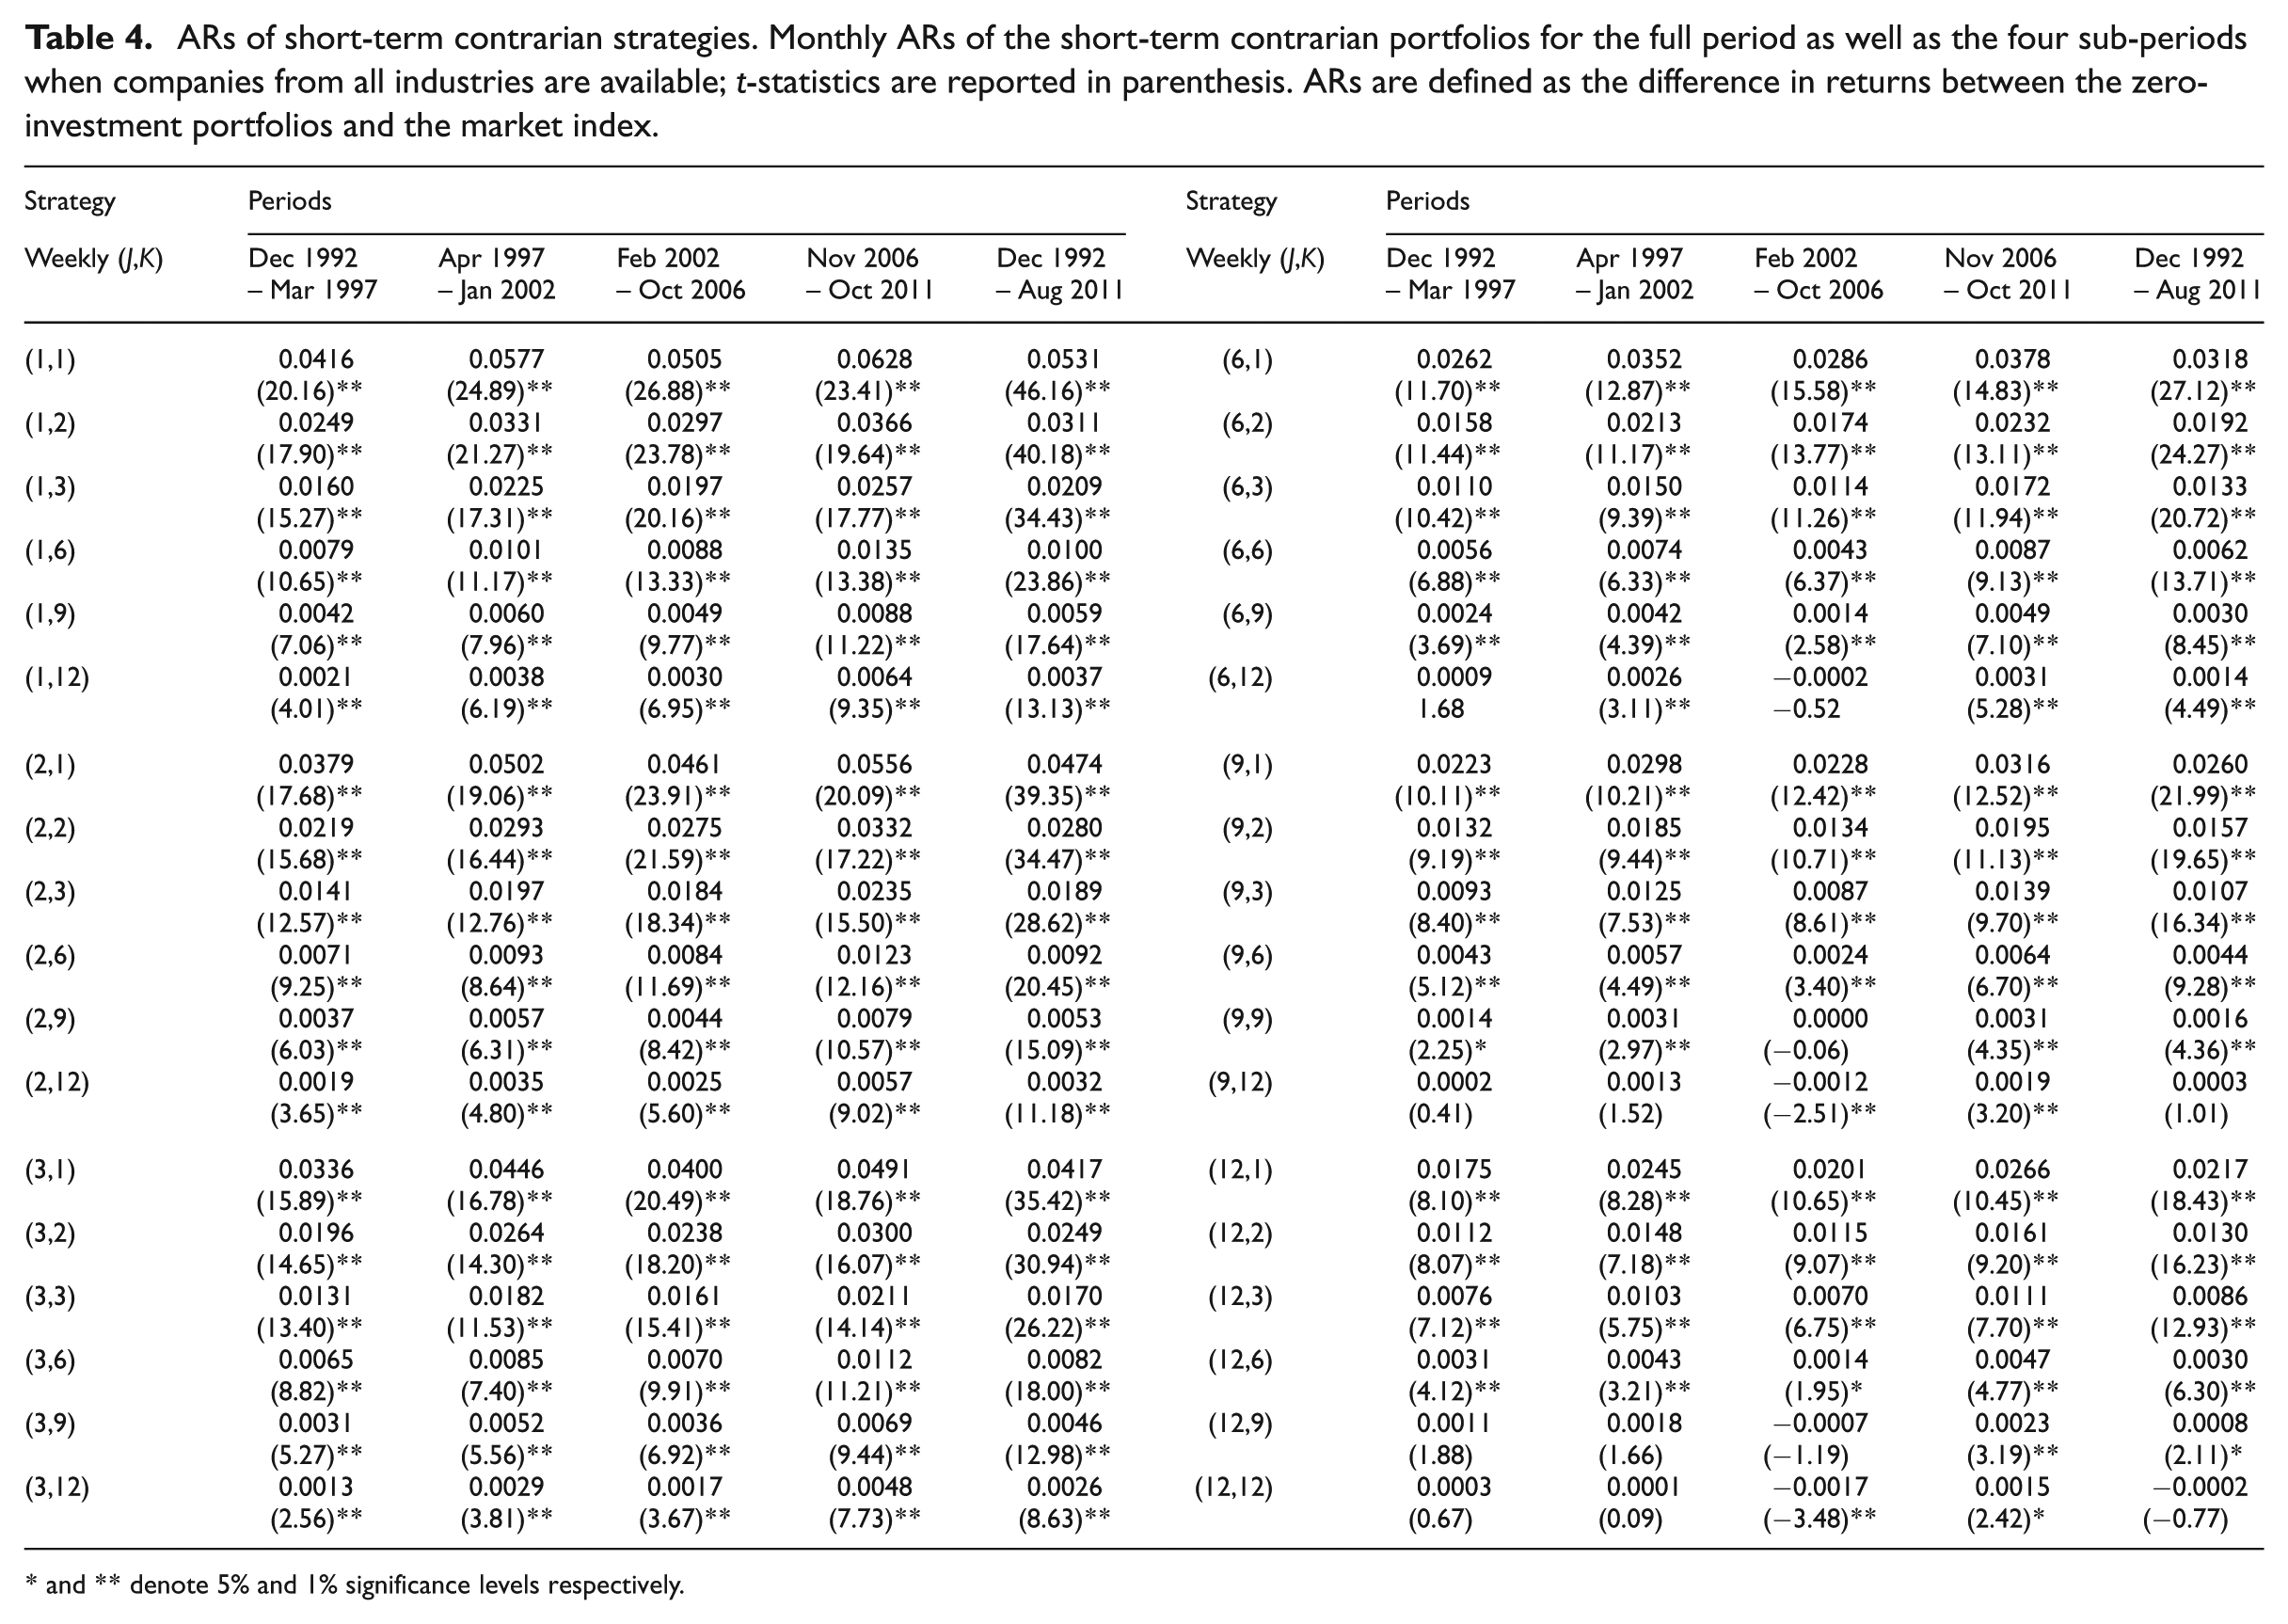
and ** denote 5% and 1% significance levels respectively.
We observe that all short-term contrarian strategies significantly outperform the market in all four sub-periods as well as the full period. The highest AR in each period is consistently generated by the
In Table 5 Panel A we present the ARs of the intermediate-term momentum strategies. Comparing performances of these strategies across the four sub-periods, we observe that only seven strategies generate positive ARs and all of them are in period (iv). On the other hand, the least successful strategies appear in period (i). For longer holding periods, as the ranking period increases the least successful strategies appear to shift from period (i) to period (ii). These returns, however, are not statistically significant. Likewise, none of the momentum strategies earn statistically significant positive ARs in the full period from December 1992 to August 2011. We conclude that, although there is strong evidence that the momentum strategies are profitable in Australia for the intermediate investment horizons, they do not outperform the buy-and-hold strategy of investing in the market index during the same period.
ARs of intermediate- and long-term momentum strategies. Monthly ARs of the intermediate- and long-term portfolios for the full period as well as the four sub-periods when companies from all industries are available;
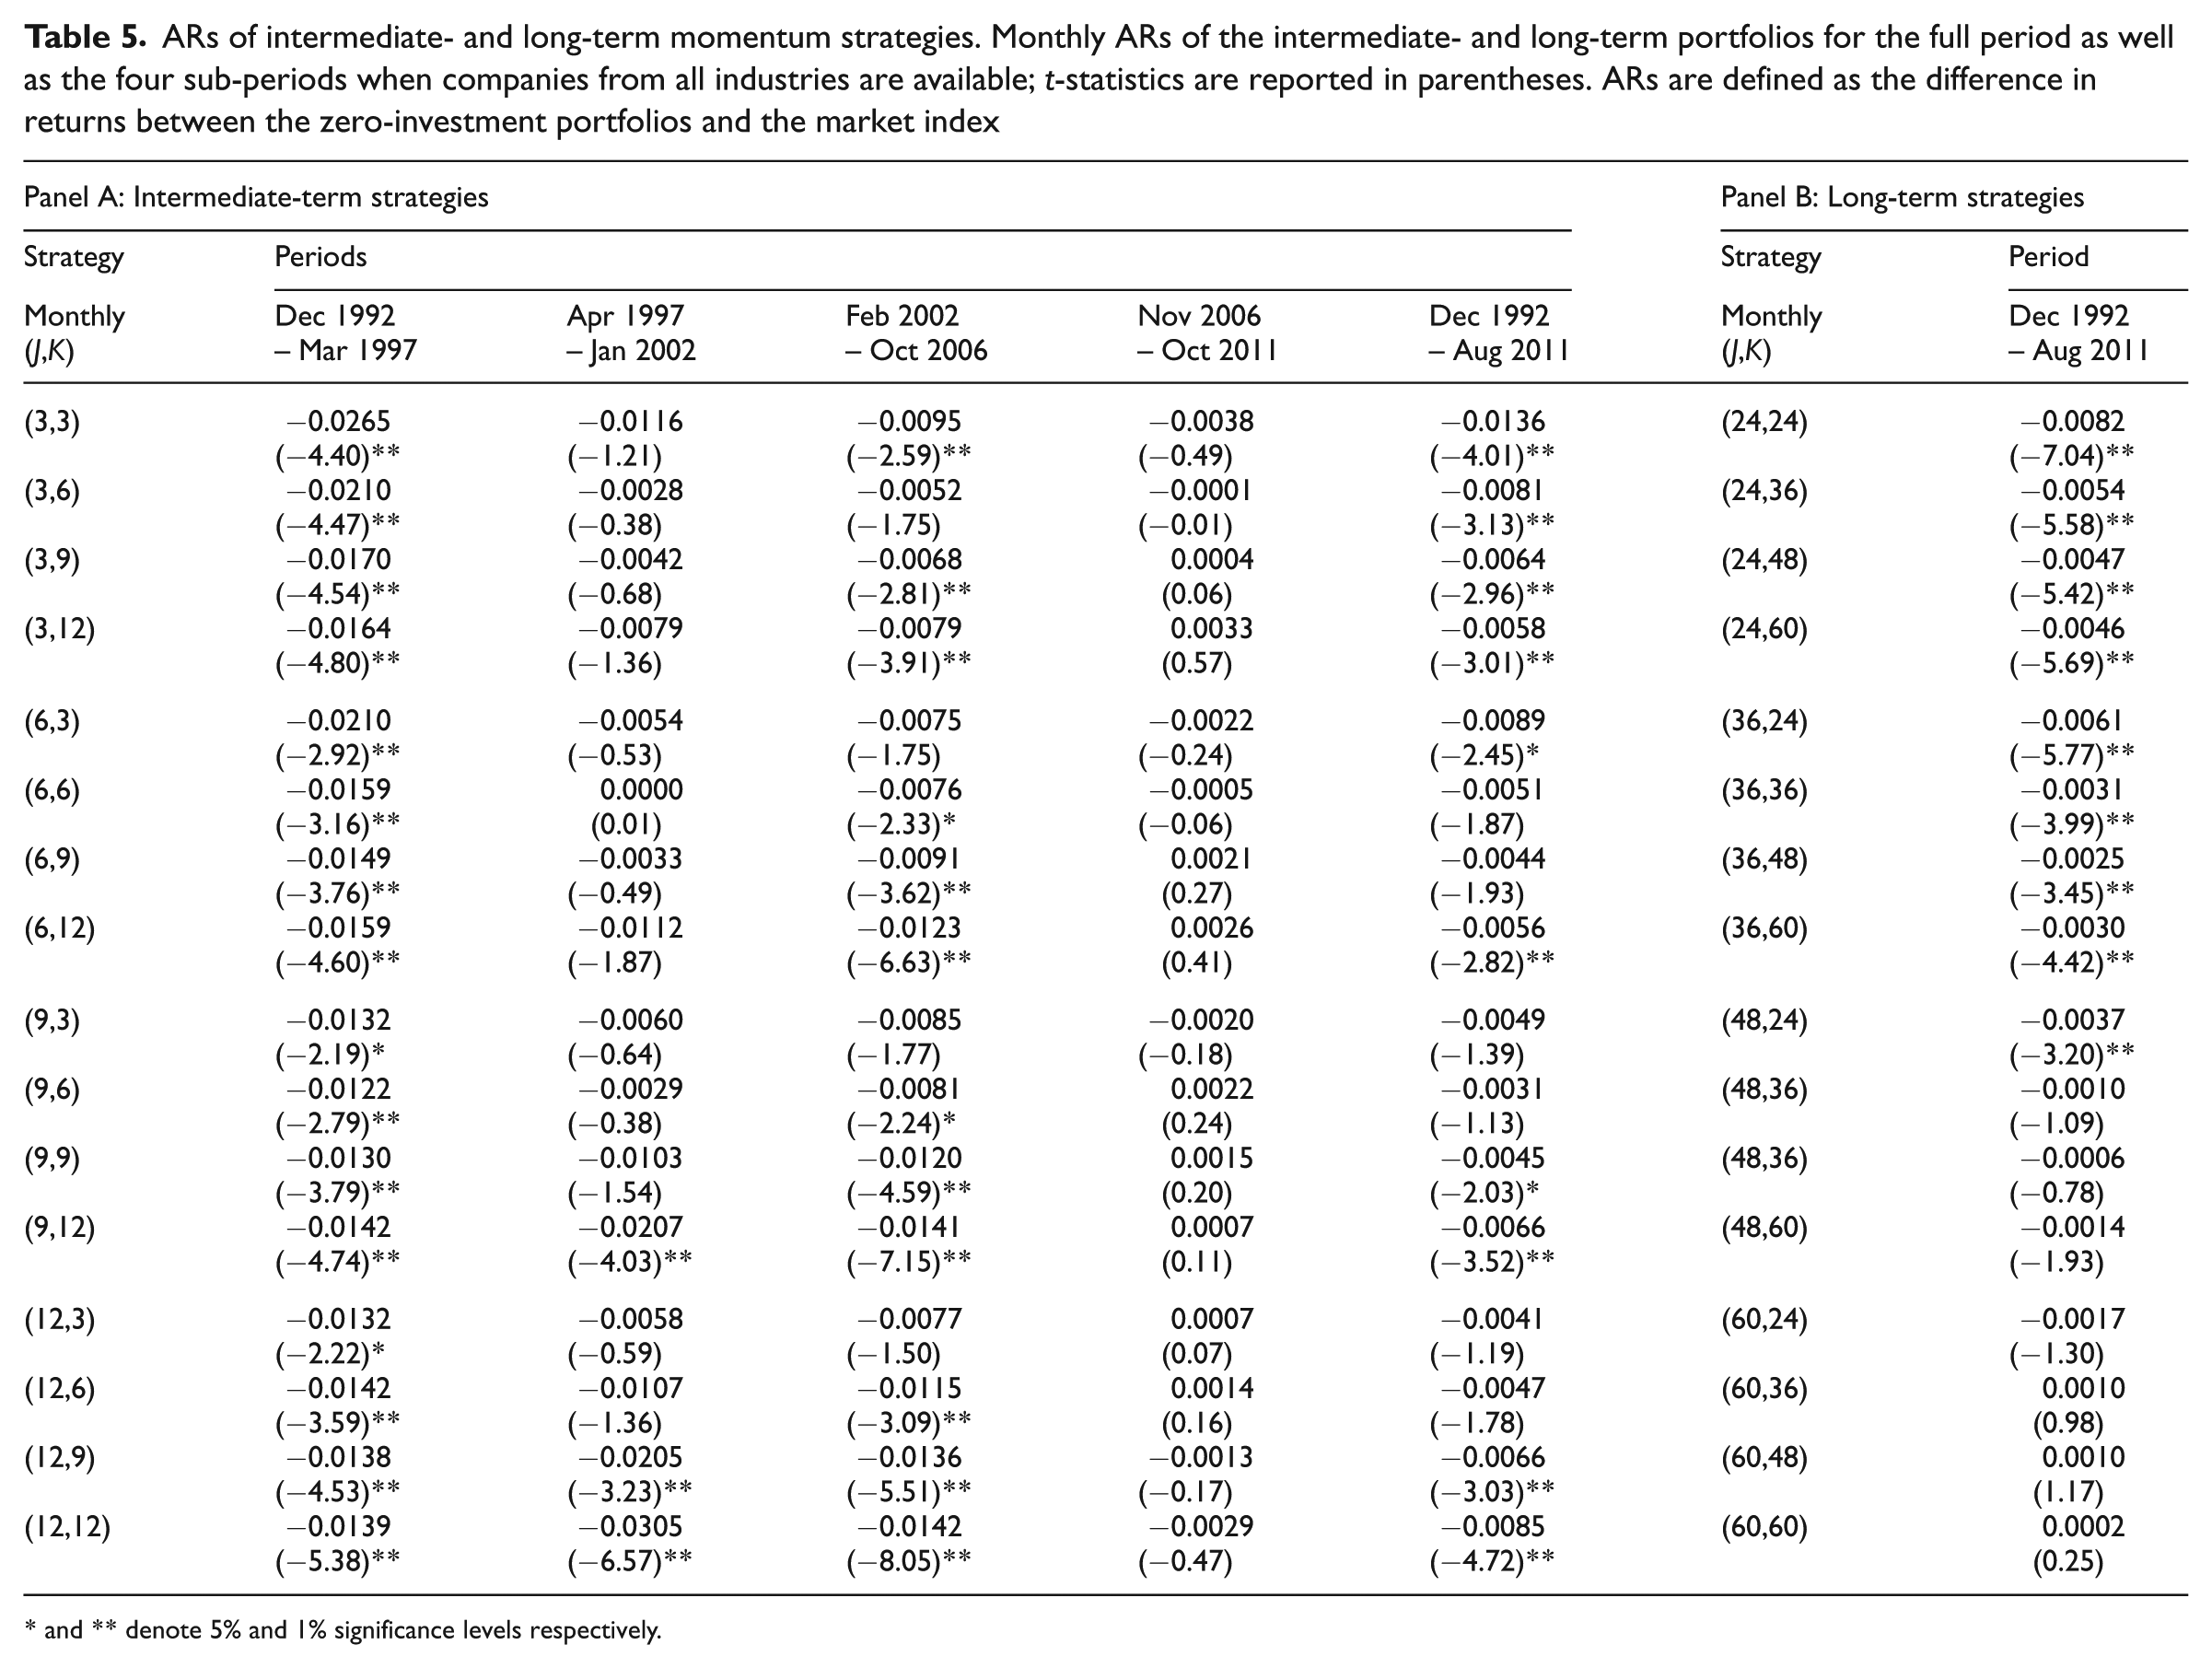
and ** denote 5% and 1% significance levels respectively.
As the Australian market is one of the few markets in the world in which momentum strategies prevail in the long term, we further test if these strategies outperform the market and report the results in Panel B of Table 5.
11
There are only three strategies generating positive ARs, with the highest of 0.10% per month (1.20% per year), offered both by the
In Figure 2 zero-investment portfolio cumulative returns are compared to the market index. We observe that the short-term contrarian strategy results in significant positive returns over the 20 years, beating the market 50 times. Consistent with results in Table 4, the short-term contrarian strategy, when implemented in December 1992 and rolled over to August 2011, consistently outperforms the market index. The average return on this strategy is 33.4 times the market average return (equivalently, $1 invested in the short-term contrarian portfolio will return $55.93 after 20 years while the same investment in the market index will return $2.64). The overall evidence indicates that the short-term contrarian strategies are significantly more profitable than the simple buy-and-hold strategy of investing in the market index over time. On the other hand, the intermediate-term and long-term momentum strategies work well in generating significant positive returns but they do not outperform the market index. We also find that both short-term contrarian and intermediate-term strategies tend to perform best in period (iv) and least in period (i).

Cumulative returns of momentum and contrarian strategies. The graphs present cumulative returns for the
3.2 Industry effects
The study of Moskowitz and Grinblatt (1999) suggests that industry is a primary driving factor of momentum, while Grundy and Martin (2001) argue that the industry effect is not the primary cause of the momentum phenomenon. Our results in Tables 1 to 3 suggest that the mining sector plays an important role in determining the success of trading strategies in the Australian market. Therefore, we further extend this analysis to investigate the impacts of Australian industries, namely oil and gas, basic materials, industrials, consumer goods, health care, consumer services, telecommunications, utilities, financials and technology, to our trading strategies. In particular, we examine time-series industry compositions of the three most successful contrarian and momentum strategies from 1992 to 2011.
Figure 3 displays the industry compositions of winner and loser portfolios of

Industry composition of portfolios in successful trading strategies. We present the industry breakdown of winner (top panels) and loser (bottom panels) portfolios formed over J periods for each rolling time window from December 1992 to August 2011. From top to bottom we consider technology, financials, utilities, telecommunications, consumer services, health care, consumer goods, industrials, basic materials, and oil and gas.
In contrast, the industry composition of the
While basic materials dominates other industries in the winner portfolio in the short-term
3.3 Size effects
We examine the impact of size on the most profitable momentum and contrarian strategies in Figure 4. The presence of large capitalisation stocks in winner portfolios (left panels in Figure 4) is more pronounced compared to that in the loser portfolios (right panels) especially for larger

Market value distribution of winner and loser portfolios. In a series of box plots we show the distributions of market values of individual stocks forming winner (panels on the left) and loser (panels on the right) portfolios for each of the three successful strategies. The composition of the portfolio depends solely on the formation period (ranking period
3.4 Value effects
Similar to the analysis of size impact, we investigate whether PTBVs differ between winner and loser portfolios. Figure 5 box plots the distribution of PTBVs for each of the three selected strategies, contrasting the distribution of PTBVs between winner and loser portfolios. The composition of the portfolio depends solely on the formation period (ranking period

PTBV distribution of winner and loser portfolios. In a series of box plots we show the distributions of PTBVs of individual stocks forming winner (panels on the left) and loser (panels on the right) portfolios for each of the three successful strategies. The composition of the portfolio depends solely on the formation period (ranking period

Market beta distribution of winner and loser portfolios. In a series of box plots we show the distributions of market beta values of individual stocks forming winner (panels on the left) and loser (panels on the right) portfolios for each of the three successful strategies. The composition of the portfolio depends solely on the formation period (ranking period
Overall, we observe no particular pattern discerning loser from winner portfolios when examining the PTBV distributions of these portfolios over time. Winner portfolios seem to have lower variance in the PTBV constituents, while the PTBVs of loser portfolio constituents seem to have a much wider spread. This is true for the short-term and long-term strategies but is the opposite for the intermediate-term strategy.
4. Sources of momentum and contrarian profits
Our results in Section 3 indicate that momentum and contrarian strategies can be profitable at different investment horizons. We question if these profits are in fact a compensation for exposure to risk factors, implying zero risk-adjusted return, or persistent anomaly unexplained by standard return-generating models. We use the RW model, the CAPM and the FF model to test if the momentum and contrarian returns of the three most profitable strategies, the short-term contrarian (
4.1 Explaining momentum/contrarian return using asset pricing models
Table 6 shows that the RW model can explain neither contrarian or momentum returns nor the winner or loser returns in all three strategies. When the market factor is included in the model, it does not explain the short-term contrarian returns but does explain the winner and loser portfolio returns. On the other hand, the market factor plays a significant role in explaining momentum returns as well as the returns on the winner and loser portfolios in the intermediate- and long-term horizons. However, the significance of the momentum or contrarian alphas (intercepts) in every regression suggests that the inclusion of the market factor alone cannot fully characterise the momentum or contrarian returns.
Risk factor analysis. Regression coefficients and

and ** refer to 5% and 1% significance levels.
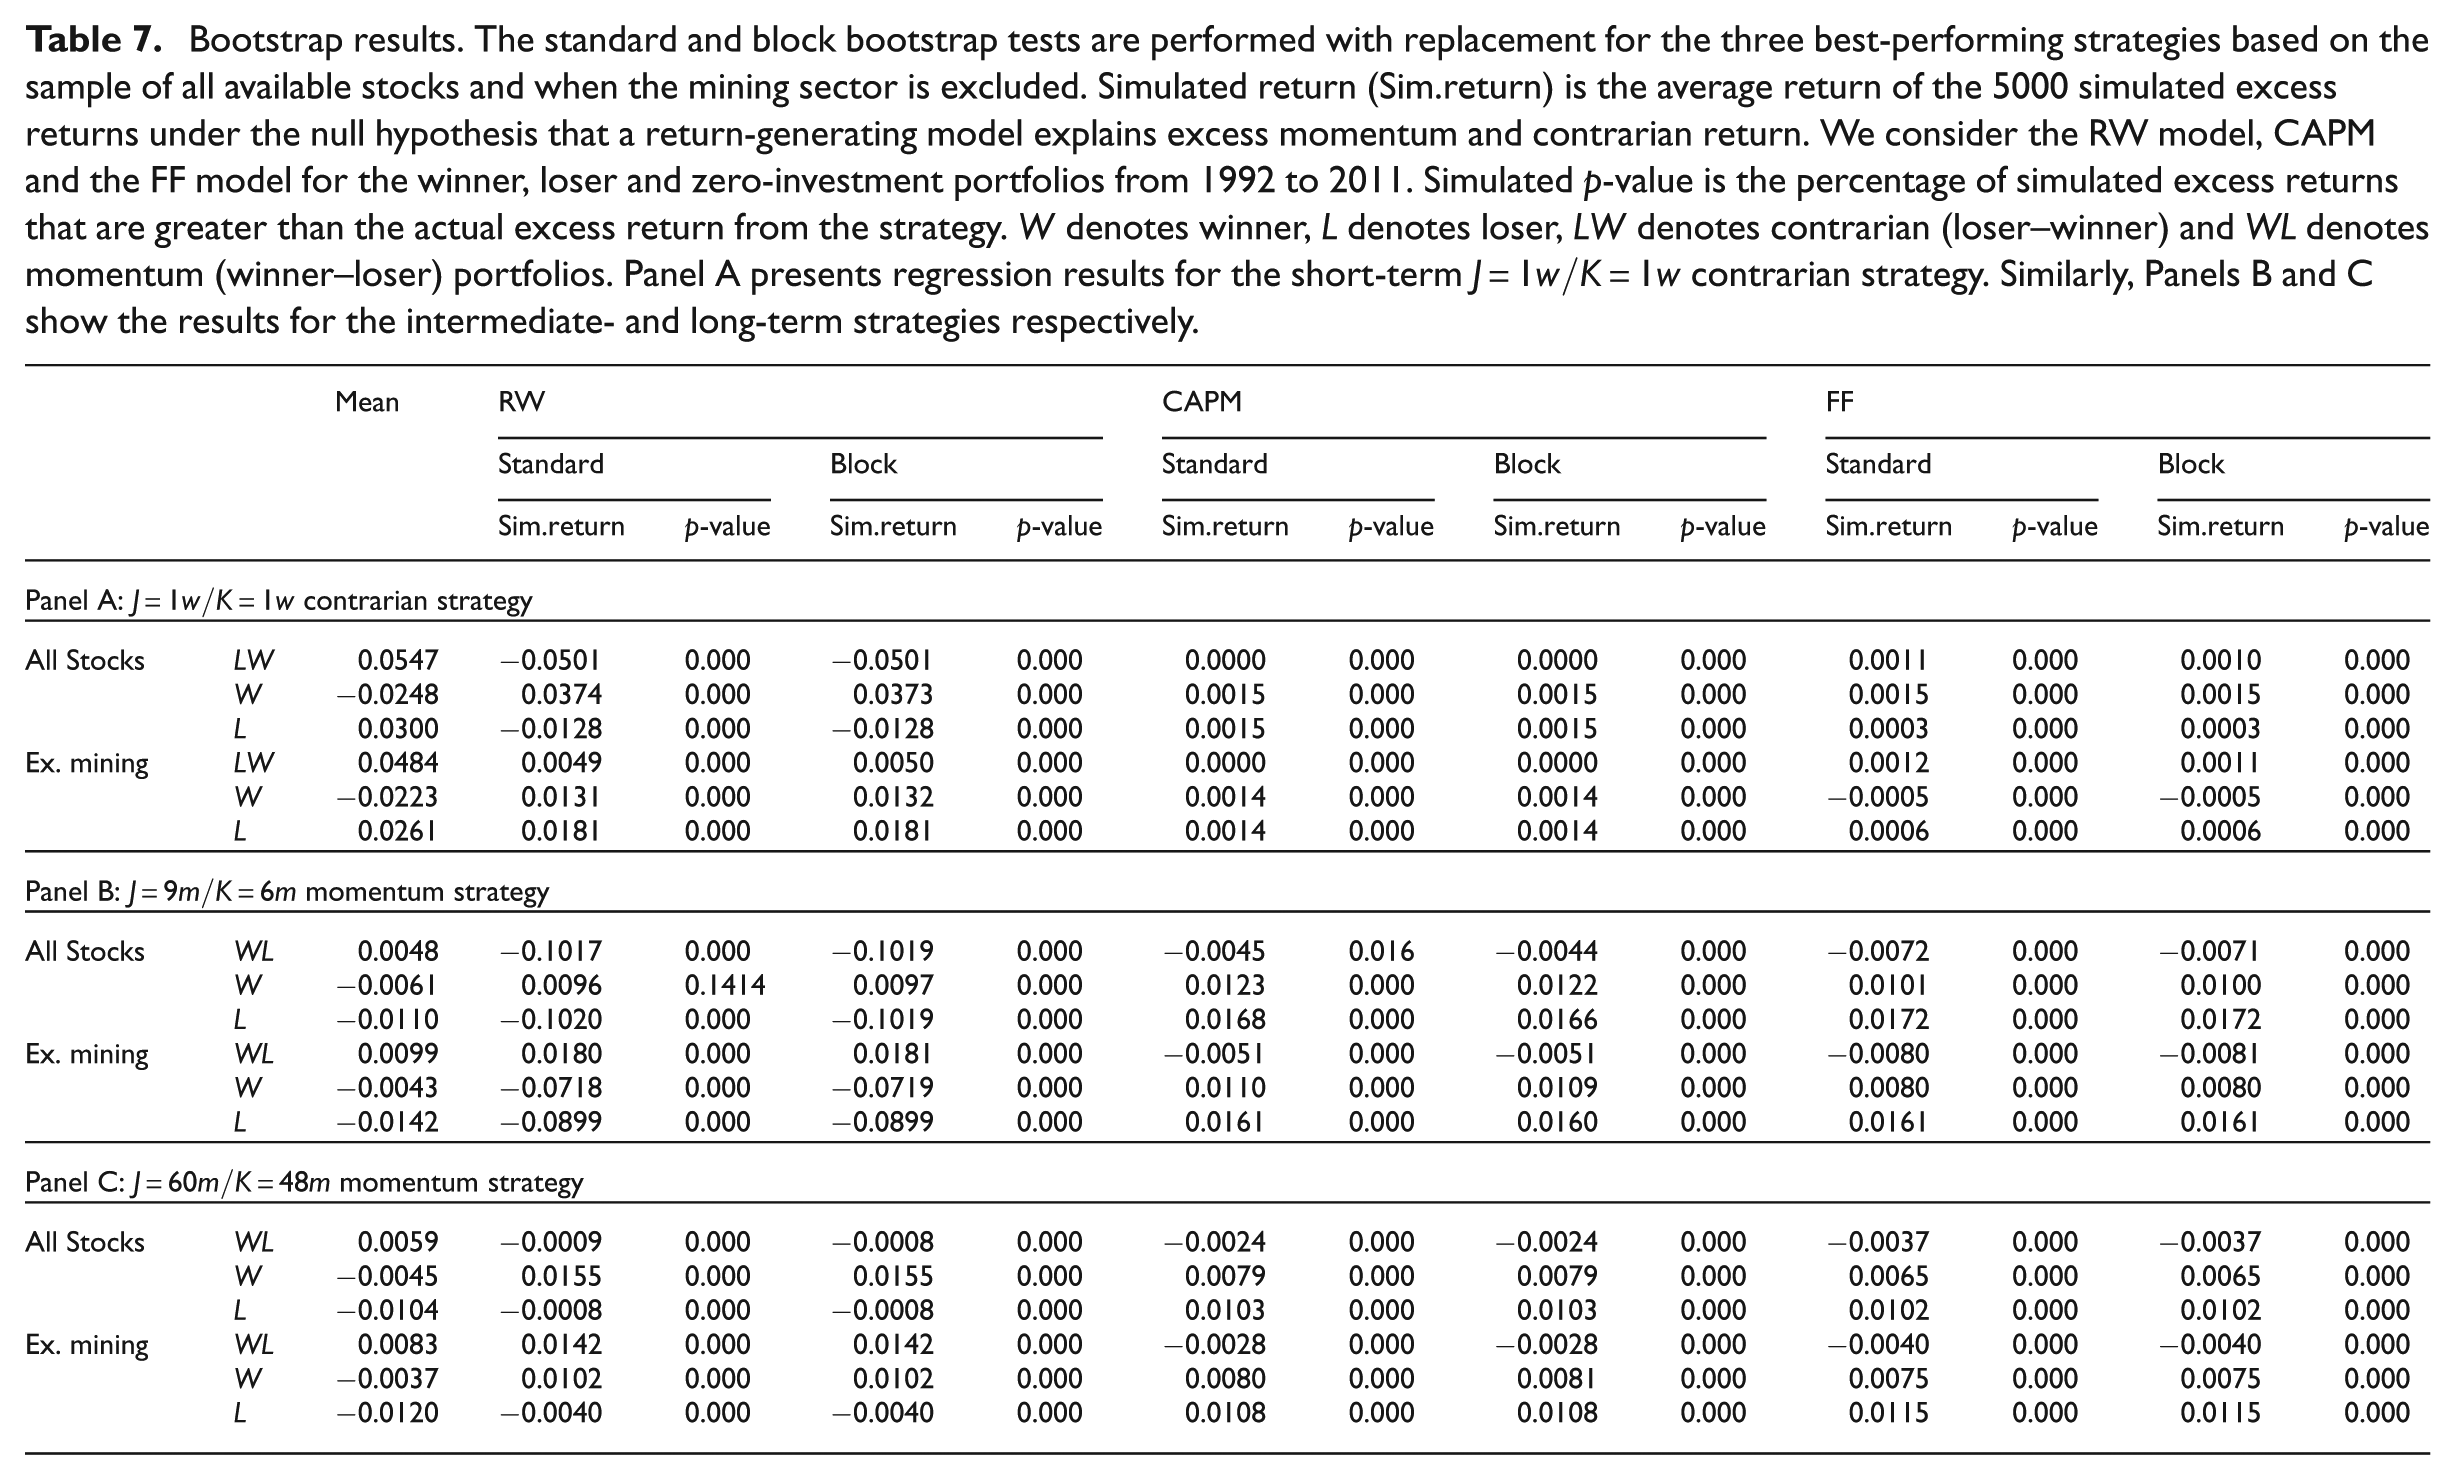
Based on our conclusion from Sections 3.3 and 3.4 and following Fama and French (1992), we include the SMB and HML factors to test if they help explain patterns of momentum and contrarian returns. Firstly, we observe that the significance of the market factor, in the presence of the size and value factors, is consistent with the results obtained from the RW model for all strategies. Secondly, while the size factor is found significant for all three strategies, the value factor plays a significant explanatory role for the short-term contrarian strategy only. This is consistent with the observation in Section 3.4 that PTBV has limited influences on the constitution of winner and loser portfolios over time. Lastly, although the Fama–French factors are statistically significant in explaining patterns of contrarian returns, the significance of the regression alphas generated from the FF model seems to suggest that the model does not fully characterise the time-series contrarian returns. Likewise, the significance of the intercepts for the intermediate- and long-term momentum suggests similar conclusions. Our results with non-mining stocks confirm the results obtained for all stocks. We further test the appropriateness of these models to explain patterns of the returns in the bootstrap simulation in Table 7.
Bootstrap results. The standard and block bootstrap tests are performed with replacement for the three best-performing strategies based on the sample of all available stocks and when the mining sector is excluded. Simulated return (Sim.return) is the average return of the 5000 simulated excess returns under the null hypothesis that a return-generating model explains excess momentum and contrarian return. We consider the RW model, CAPM and the FF model for the winner, loser and zero-investment portfolios from 1992 to 2011. Simulated
4.2 Bootstrap tests
Traditional asset pricing models assume that the disturbance term in the model is normal, an assumption that may not necessarily hold in our sample. If the assumption does not hold, standard errors of the
Table 7 shows the results of the standard and block bootstrap tests for the three best-performing strategies based on the sample of all available stocks and when the mining sector is excluded. Simulated return (Sim.return) is the average return of the 5000 simulated excess returns under the null hypothesis that a return-generating model completely explains excess momentum and contrarian returns. Simulated
5. Conclusion
Returns from momentum and contrarian strategies have been one of the most persistent anomalies challenging the efficient market hypothesis.
12
These phenomena have been consistently reported in the US market as well as markets around the world. In this paper, we show that Australian investors in the period from December 1992 to August 2011 can benefit from implementing concurrent momentum and contrarian strategies by forming portfolios with various ranking and holding periods. The contrarian strategies work well in the short-term investment horizons: we find that the
Our investigation of fundamental factors that may constitute momentum and contrarian portfolios shows industry and market value may play an important role in forming loser and winner portfolios. We find that PTBVs have no distinct characteristics in either of the two portfolios across all investment horizons. Our regression analysis on sources of momentum and contrarian returns shows that standard asset pricing models such as the RW model, CAPM and the FF model are limited in explaining the return anomalies. While there is some evidence suggesting the significance of CAPM in explaining momentum returns and of the FF model in explaining contrarian returns, the bootstrap and block-bootstrap results show that none of these models successfully generate simulated returns mimicking the characteristics of the actual returns obtained from these strategies. This leads us to conclude that momentum and contrarian returns, being the long-standing anomalies in markets around the world, continue to persist strongly in the Australian market and defy fundamental explanations.
Footnotes
Final transcript accepted 8 April 2014 by Karen Benson (AE Finance).
Funding
This research received no specific grant from any funding agency in the public, commercial or not-for-profit sectors.