
Abstract
Small stocks tend to reverse, whereas large stocks tend to trend over a one-month horizon, which explains the lack of short-term reversals in the Australian market as a whole. However, large stocks exhibit intra-industry reversals, in which industry winners underperform industry losers in the subsequent month, when controlling for price momentum. Conversely, once this intra-industry reversal is neutralised, large stocks display momentum behaviour, in which market winners outperform market losers. These conditional strategies generate positive, significant risk-adjusted returns on large stocks in Australia. This paper documents significant industry momentum, as winning industries outperform losing industries in the following month. This industry momentum effect dominates the intra-industry reversal. The paper also finds evidence that conditional reversals are driven by illiquidity and are inhibited by stock prices under-reacting to earnings announcements.
1. Introduction
Jegadeesh (1990) and Lehmann (1990) provide early evidence on short-term return reversals, showing that past losing stocks outperform past winning stocks. They show that a contrarian strategy that buys past short-term losers and sells past short-term winners generates a positive, significant profit. The short-term reversal effect has since been studied extensively (e.g. Lo and MacKinlay, 1990). Avramov et al. (2006) find that these contrarian profits are, however, strongest in small and illiquid stocks, raising doubts as to whether the effect can be profitably exploited.
More recently, Hameed and Mian (2014) examine methods that are better able to extract reversals than the standard contrarian strategy. They show that the return on the standard contrarian strategy can be decomposed into intra-industry reversals, in which past within-industry losers outperform past within-industry winners and inter-industry reversals, which arise if past losing industries outperform past winning industries. Hameed and Mian (2014) document positive intra-industry reversals but negative inter-industry reversals, which explain why there are weak reversals when the standard strategy is applied. In their earlier version of the study, Hameed et al. (2010) examine an intra-industry reversal strategy that controls for market momentum. This ‘conditional’ strategy is found to generate an alpha of 1.77 per cent per month, which is substantially higher than the 0.54 per cent per month produced by the ‘unconditional’ market-wide contrarian strategy in the US market.1,2
This paper uses the framework in Hameed et al. (2010) to analyse the dynamics of short-term return behaviours in the Australian equity market. We first document the existence of standard contrarian profits in smaller stocks, which is consistent with the literature. However, we also find significant contrarian profits for large stocks when a conditional intra-industry reversal strategy controlling for short-term price momentum is implemented. For instance, this conditional strategy generates a risk-adjusted return of 0.90% per month (t-statistic = 2.97), or nearly 10% per annum in the largest 30% of stocks.
We also document evidence of momentum over short-term horizons. We find that once the intra-industry reversal effect is controlled for, large stocks exhibit short-term momentum. The average risk-adjusted return on the strategy implemented for large stocks is 1.11% per month (t-statistic = 2.87). We therefore document the co-existence of economically and statistically significant reversals and momentum over a one-month horizon.
The paper makes several contributions. We are the first to document a significant reversal effect in the large stocks in the Australian market. Gaunt and Gray (2003) document negative autocorrelations in Australian equities that led to positive contrarian profits of up to 6% per month. However, this huge return is only present in stocks outside the top 200, selected by market capitalisation. Lee et al. (2003) test Lo and MacKinlay’s (1990) version of contrarian strategies using weekly data, assigning a weighting to individual stocks that is directly linked to the stock’s performance relative to the market. They document statistically significant but economically insignificant profits of just 2.58% per year for small stocks and 0.78% per year for large stocks. Using daily and intra-day data, Lo and Coggins (2006) also document economically insignificant contrarian profits of approximately 0.017% for daily strategies and 0.025% for hourly strategies. 3 Our finding of larger contrarian profits for large stocks naturally yields practical implications for investment practitioners. 4
We also contribute to the sparse literature on industry momentum in Australia. Moskowitz and Grinblatt (1999) document the first evidence of industry momentum in the US market, in which past winning industries outperform past losing industries. They also find that industry momentum dominates price momentum. For the Australian market, price momentum has been investigated by a number of studies (e.g. Brailsford and O’Brien, 2008; Demir et al., 2004; Dou et al., 2013; O’Brien et al., 2010). However, Australian evidence on industry momentum is sparse and the findings are mixed. Hurn and Pavlov (2003) find strong evidence of industry momentum using the 200 largest stocks in Australia over the period 1973–1998 as a sample. They note that, unlike price momentum, this industry momentum effect is robust after controlling for risk over one-month and six-month horizons. However, the dominant industry momentum finding is only mentioned briefly, as the study focuses mainly on price momentum. In their examination of George and Hwang’s (2004) 52-week high momentum study, Marshall and Cahan (2005) find no evidence of industry momentum when all of the stocks in the market are considered. In this paper, we show that industry momentum exists only in large stocks and not in the entire market, hence reconciling the discrepancy between Hurn and Pavlov (2003) and Marshall and Cahan (2005). Further, we find that controlling for industry momentum does not help to magnify intra-industry reversals, suggesting that industry momentum and price momentum may be separate effects in Australia, which is a possibility that deserves future investigation.
Finally, we contribute to the literature by providing additional insights into the sources of reversals and momentum. We extend Hameed and Mian’s (2014) methodology and jointly examine the effect of illiquidity and earnings announcements on short-term return behaviour. We confirm the liquidity-based explanation for short-term reversals, which attributes the effect to illiquidity shocks. We find that the reversal is weakened by earnings news, suggesting that investors’ under-reaction to earnings news drives short-term momentum.
Australia is an interesting market to study reversals and momentum. According to the Australian Securities Exchange (ASX), the Australian equity market ranks eighth in the world and second in the Asia-Pacific region in terms of total market capitalisation. Its institutional settings are similar to those of the US market, with institutional investors dominating. However, the market’s stock composition is heavily skewed towards small and tiny stocks. According to Brailsford et al. (2012) the smallest 60% of stocks account for just 1.6% of the total market capitalisation, compared to 13% in the US market. This imbalance makes it challenging to find any economically significant phenomena. Our finding of both reversals and momentum in the largest stocks demonstrates the efficacy of the sorting methods used and helps to add insights into the underlying drivers of the effects.
The rest of the paper is organised as follows. Section 2 outlines the methodologies and data. Section 3 reports the main empirical findings. Section 4 concludes the paper.
2. Methodologies and data
2.1. Portfolio sorting
We examine several return-based sorting strategies to investigate short-term return behaviour in the Australian equity market. The base case is the standard contrarian strategy studied by Jegadeesh (1990) and the subsequent short-term reversal literature. For this ‘unconditional’ setup, each month, we sort all of the stocks in the market into deciles based on their returns in the previous month. A long–short portfolio is formed by buying last month’s bottom decile (i.e. losers) and selling last month’s top decile (i.e. winners). The strategy is repeated monthly over our sample period from January 1983 to December 2009, giving rise to 324 non-overlapping monthly returns. This analysis extends the evidence in Gaunt and Gray (2003), who study the short-term reversal effect from 1975 to 1998. Based on Gaunt and Gray’s (2003) evidence, this standard strategy should be profitable only for small stocks.
We also examine Hameed and Mian’s (2014) intra-industry contrarian strategy. Each month, stocks within each industry are ranked according to the prior month’s returns. The stocks are classified as Industry Winners (the top 20% of performers within each industry), Industry Neutrals (the middle 60%) and Industry Losers (the bottom 20%). The intra-industry contrarian strategy involves buying the Industry Losers and selling the Industry Winners. Intuitively, by benchmarking against industry peers, this intra-industry sorting uncovers extreme performance that is attributable to firm specific and, arguably, non-fundamental factors. Avramov et al. (2006) show that return reversals are driven mainly by illiquidity, which is a firm specific attribute. Similarly, Da et al. (2012) report stronger contrarian profits when stocks are sorted using residual returns that are the net of industry returns, expected returns and cash flow news. In light of these findings, extreme performers from the intra-industry sorting are likely to reverse, leading to contrarian profits. Hameed and Mian’s (2014) decomposition further shows that the standard contrarian strategy’s returns are made up of both the intra-industry reversal effect and the inter-industry reversal effect. Their empirical analysis shows that the inter-industry reversal effect is negative, suggesting that the intra-industry contrarian strategy should outperform the standard strategy.
The presence of momentum over medium-term horizons implies that part of short-term reversals can be offset by price continuation over the same horizon. This counteracting force will therefore disadvantage the ‘unconditional’ contrarian strategies. Poor contrarian performance is guaranteed in larger Australian stocks, as they have strong momentum (Brailsford and O’Brien, 2008; Hurn and Pavlov, 2003). We examine two conditional strategies to control for momentum in contrarian strategies. The first strategy, based on Hameed et al. (2010), involves sorting stocks both within their industries and within the entire market. The first sort is the intra-industry sorting described above, which classifies stocks as Industry Winners, Industry Neutrals and Industry Losers. The second sort, based on the same month’s return, independently identifies stocks as Market Winners (the top 20% of performers in the stock universe), Market Neutrals (the middle 60%) or Market Losers (the bottom 20%). The independent double sort creates nine intersections. The intra-industry sort identifies extreme performers relative to their peers, whereas the market-wide sort identifies extreme performers in the entire market. Market-wide extreme performers are thought to be driven by fundamental shocks, which cause price momentum instead of reversals. Naturally, there is some overlap between Industry Winners and Market Winners, Industry Losers and Market Losers, etc. However, the intersections of interest are between Industry Winners and Market Neutrals, and between Industry Losers and Market Neutrals. These intersections contain extreme performers relative to their peers, which are likely to reverse. As the members are also Market Neutrals, these intersections minimise momentum forces and thus amplify reversals. A conditional intra-industry contrarian strategy therefore involves buying stocks at the intersection of Industry Losers and Market Neutrals and selling stocks at the intersection of Industry Winners and Market Neutrals.
Another way to disentangle reversals from momentum is to control for industry momentum. Moskowitz and Grinblatt (1999) find that past winning industries outperform past losing industries and that this industry momentum dominates the individual stock momentum. They show that this effect is particularly strong when the industry portfolios are formed using the past month’s returns and are held for one month. Therefore, if short-term industry momentum exists in Australia, as documented by Hurn and Pavlov (2003), a clearer reversal signal can be extracted by ensuring that the intra-industry extreme performers do not belong to extreme performing industries. We examine this alternative conditional strategy by first verifying the existence of industry momentum as documented by Hurn and Pavlov (2003). We then perform a double sort similar to the conditional intra-industry strategy described above. Industries are first sorted into Winning Industries (the three best performing industries according to the past month’s equal-weighted returns), Losing Industries (the three worst performing industries according to the past month’s equal-weighted returns) and Neutral Industries (the remaining industries). 5 Independently, stocks within each industry group are sorted into Industry Winners, Industry Neutrals and Industry Losers, based on a 20:60:20 split as discussed above. A conditional contrarian strategy can be formulated by buying the intersection of Industry Losers and Neutral Industries and selling the intersection of Industry Winners and Neutral Industries.
In summary, we examine the performance of four contrarian strategies. The standard strategy takes a long position on Market Losers and a short position on Market Winners. The intra-industry strategy buys Industry Losers and sells Industry Winners. The conditional intra-industry strategy buys at the intersection of Industry Losers and Market Neutrals and sells at the intersection of Industry Winners and Market Neutrals. The second conditional contrarian strategy buys at the intersection of Industry Losers and Neutral Industries and sells the intersection of Industry Winners and Neutral Industries.
Although our primary focus is contrarian strategies, the double sorting methods also enable us to examine possible momentum effects over the same horizon. If Market Winners and Market Losers do indeed exhibit drifts, and Industry Losers and Industry Winners display reversals as conjectured, a strategy which classifies Market Winners and Industry Neutrals as long stocks and Market Losers and Industry Neutrals as short stocks should generate momentum profits. Similarly, a strategy that buys stocks in Winning Industries that are also Industry Neutrals and sells stocks in Losing Industries that are also Industry Neutrals may be more profitable than the standard industry momentum strategy. We examine these two short-term momentum strategies in conjunction with the above contrarian strategies. 6
Throughout this paper, we report value-weighted returns to alleviate concerns associated with small firm effects, such as tradability, liquidity and bid–ask bounces. We use Fama and French’s (2014) three-factor model to adjust for the risk associated with our strategies. The Fama-French factors are constructed as follows. Following their study, we form six portfolios from the intersections of two size and three book-to-market portfolios. At the end of December of year t, we first rank stocks according to their market capitalisation, and the median market capitalisation is used to split stocks into two groups, small and large. Independent of the size sort, we then rank stocks based their book-to-market ratios, and separate them based on the breakpoints of bottom 30% (low), middle 40% (medium), and top 30% (high). Value-weighted portfolio returns are calculated monthly from January to December of year t+1. The portfolios are updated on a yearly basis. Small Minus Big (SMB) is the difference between the average return on the three small size portfolios and the average return on the three big size portfolios. High Minus Low (HML) is the difference between the average return on the two high book-to-market portfolios and the average return on the two low book-to-market portfolios. 7
2.2. The effect of illiquidity and firm-specific information on short-term returns
The literature suggests two possible explanations for the reversal effect. Investors may overreact to firm-specific information in the formation month, leading to a correction or reversal in the next month (Jegadeesh and Titman, 1995). However, Jegadeesh and Titman (1995) do not explicitly measure the reaction to information. Rather, they measure the reversal behaviour in the firm-specific component of the return, which includes the reaction to firm-specific news. Alternatively, short-term liquidity pressure may result in large price movements that revert when the pressure subsides. This liquidity-based explanation is supported by recent empirical studies (Avramov et al., 2006; Da et al., 2012; Hameed and Mian, 2014).
To identify the potential sources of the contrarian effect, we estimate the following regression using Fama and MacBeth’s (1973) procedure:
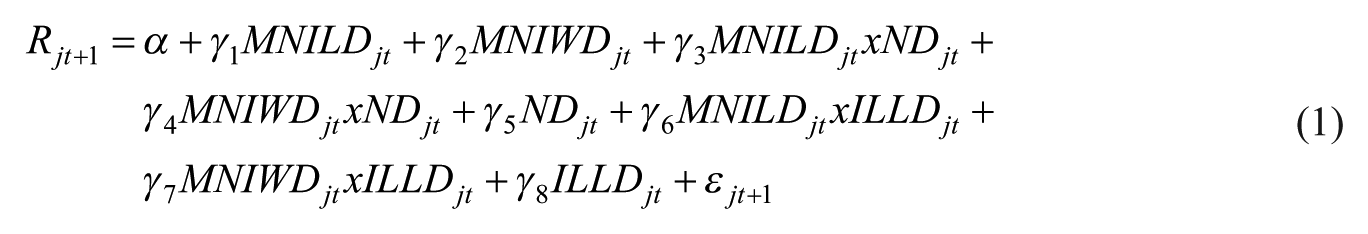
where the dependent variable, Rjt+1, is the return on stock j in month t+1. MNILDjt (MNIWDjt) is a dummy variable that takes the value of 1 if stock j lies in the intersection of Market Neutrals and Industry Losers (Winners) in month t. NDjt is a news dummy and equal to 1 if there is firm-specific news for firm j in month t. ILLDjt is an illiquidity dummy, taking the value of 1 if stock j is classified as illiquid in month t.
Adapted from Hameed and Mian (2014), this regression framework with interaction terms between the dummy variables enables us to directly estimate the effect of the variables of interest (namely, illiquidity and news events) on the profitability of the conditional intra-industry contrarian strategy. In particular, the estimated spread in the first two coefficients, (γ1–γ2), captures the magnitude of the conditional intra-industry reversal in liquid and no-news firms. Further, the spread (γ3–γ4) captures the effect of news on the returns on the conditional intra-industry reversal strategy, such that (γ1+γ3)–(γ2+γ4) represents the conditional reversals returns on the liquid and news firms. A positive (negative) news effect indicates that news events exacerbate (inhibit) the conditional reversal, thus pointing to over- (under-)reaction to news. Similarly, the spread (γ6–γ7) captures the effect of illiquidity on the conditional reversals, such that (γ1+γ6)–(γ2+γ7) measures the reversals in illiquid and non-announcing firms. A positive illiquidity effect suggests that liquidity pressure magnifies the conditional reversal. The reverse is implausible, because illiquidity should not induce momentum. 8 Finally, (γ1+γ3+γ6)–(γ2+γ4+γ7) captures the conditional reversal in illiquid and announcing firms. If illiquidity is found to drive the conditional reversal and under-reaction to news negates the reversal, then if this quantity is greater than (γ1–γ2), that is (γ3+γ6)–(γ4+γ7) > 0, the positive effect from illiquidity dominates the negative effect from firm-specific news in driving the conditional reversal.
We use Amihud’s (2002) illiquidity ratio to measure stock illiquidity, which captures the price movement associated with trading volume. 9 Consistent with the literature, stocks are labelled illiquid (i.e. ILD = 1 in equation (1)) if their Amihud ratios are greater than the median value of all of the firms in the same industry.
We use firm earnings announcements to measure firm-specific news. These include half-year results (known as ‘Appendix 4D’ or ‘half-year financial report’), full-year results (‘Appendix 4E’ or ‘preliminary final report’) and, for certain firms especially mining firms, quarterly results (‘Appendix 4C‘ or ’quarterly financial report‘). Firms are also required to update the market whenever they are aware of circumstances that are likely to affect their earnings. Anecdotal evidence suggests that these market updates are typically followed by strong market reactions. Therefore, our news data consist of both scheduled earning announcements and market updates. 10 We set NDjt equal to 1 if there is at least one earnings announcement for firm j in month t.
As our analysis involves controlling for momentum, we also investigate the role of news information on short-term momentum. Our analysis is motivated by the behavioural explanations of the momentum effect in the literature. Daniel et al. (1998) show that overconfident investors, who also have biased self-attribution, overreact to their private signals and under-react to public news. Trading by these investors causes medium-term momentum and long-term reversals. Hong and Stein (1999) offer an alternative explanation for the existence of momentum. Rather than focusing on the representative agent, they examine the interaction between ’news watchers‘ and ’momentum traders‘ in the market. When information diffuses gradually among news watchers, an initial under-reaction to firm-specific information occurs in the price. Momentum traders who base their trading on the history of price changes accelerate this reaction, causing momentum in the medium term and reversals in the long term. Both models predict an under-reaction to firm-specific news. Accordingly, we run the following Fama-MacBeth (1973) cross-sectional regression to examine the role of earnings announcements in explaining momentum.
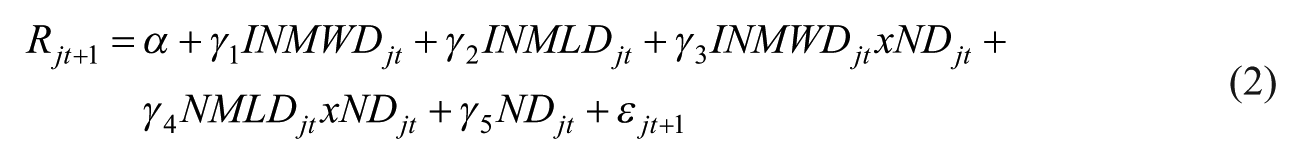
Where INMWDjt (INMLDjt) is a dummy variable that takes the value of 1 if stock j lies in the intersection of Market Winners (Losers) and Industry Neutrals in month t. We can assess the direction of the news effect on the conditional momentum, which is measured by (γ1 + γ3)–(γ2 + γ4), by allowing these dummies to interact with the news dummy, NDjt.
2.3. Data
This study examines short-term return behaviours at the monthly level using ordinary stocks traded on the ASX from January 1983 to December 2009. 11 A stock must have a valid price, return and market capitalisation for the month t to participate in portfolio formation in that month. Monthly data on stock returns, market capitalisation and risk-free interest rates is obtained from the Centre for Research in Finance (CRIF) database. Industry classifications for the sample stocks are also obtained from the CRIF database and warrant some discussion. In the past, the ASX maintained an industry classification system that placed firms into one of 24 to 25 industry groups, depending on the year. From the start of our sample to 2002, the CRIF records five minor changes in the ASX classification, either introducing a new industry or splitting one industry into two. Since September 2002, the ASX system has been replaced by a scheme of 25 industries that are based on Standard and Poor’s Global Industry Classification System (GICS). Our industry classification carefully tracks these changes.
Table 1 provides some descriptive statistics over the period 2002–2009 for which the GICS system is used, to give some perspective on the data and classifications used. We do not show the results for the ASX classifications for the earlier periods to conserve space, but they are available upon request.
Descriptive statistics for individual stocks and industry returns.
This table reports summary statistics for each of 25 industries that are maintained in the CRIF database based on GICS. The sample comprises monthly data from September 2002 to December 2009. For ‘Industry portfolios’, return statistics are constructed using equally weighted industry returns, ‘Standard deviation’ is the standard deviation of the monthly industry returns and ‘Auto-correlation’ is the first order auto-correlation of the monthly industry returns. For ‘Individual stocks’, statistics are constructed using monthly individual stock returns, ‘Standard deviation’ is the time series average of monthly cross sectional standard deviations of the returns of stocks in the industry and ‘Auto-correlation’ is the cross-sectional average of the first order auto-correlation of monthly stock returns.
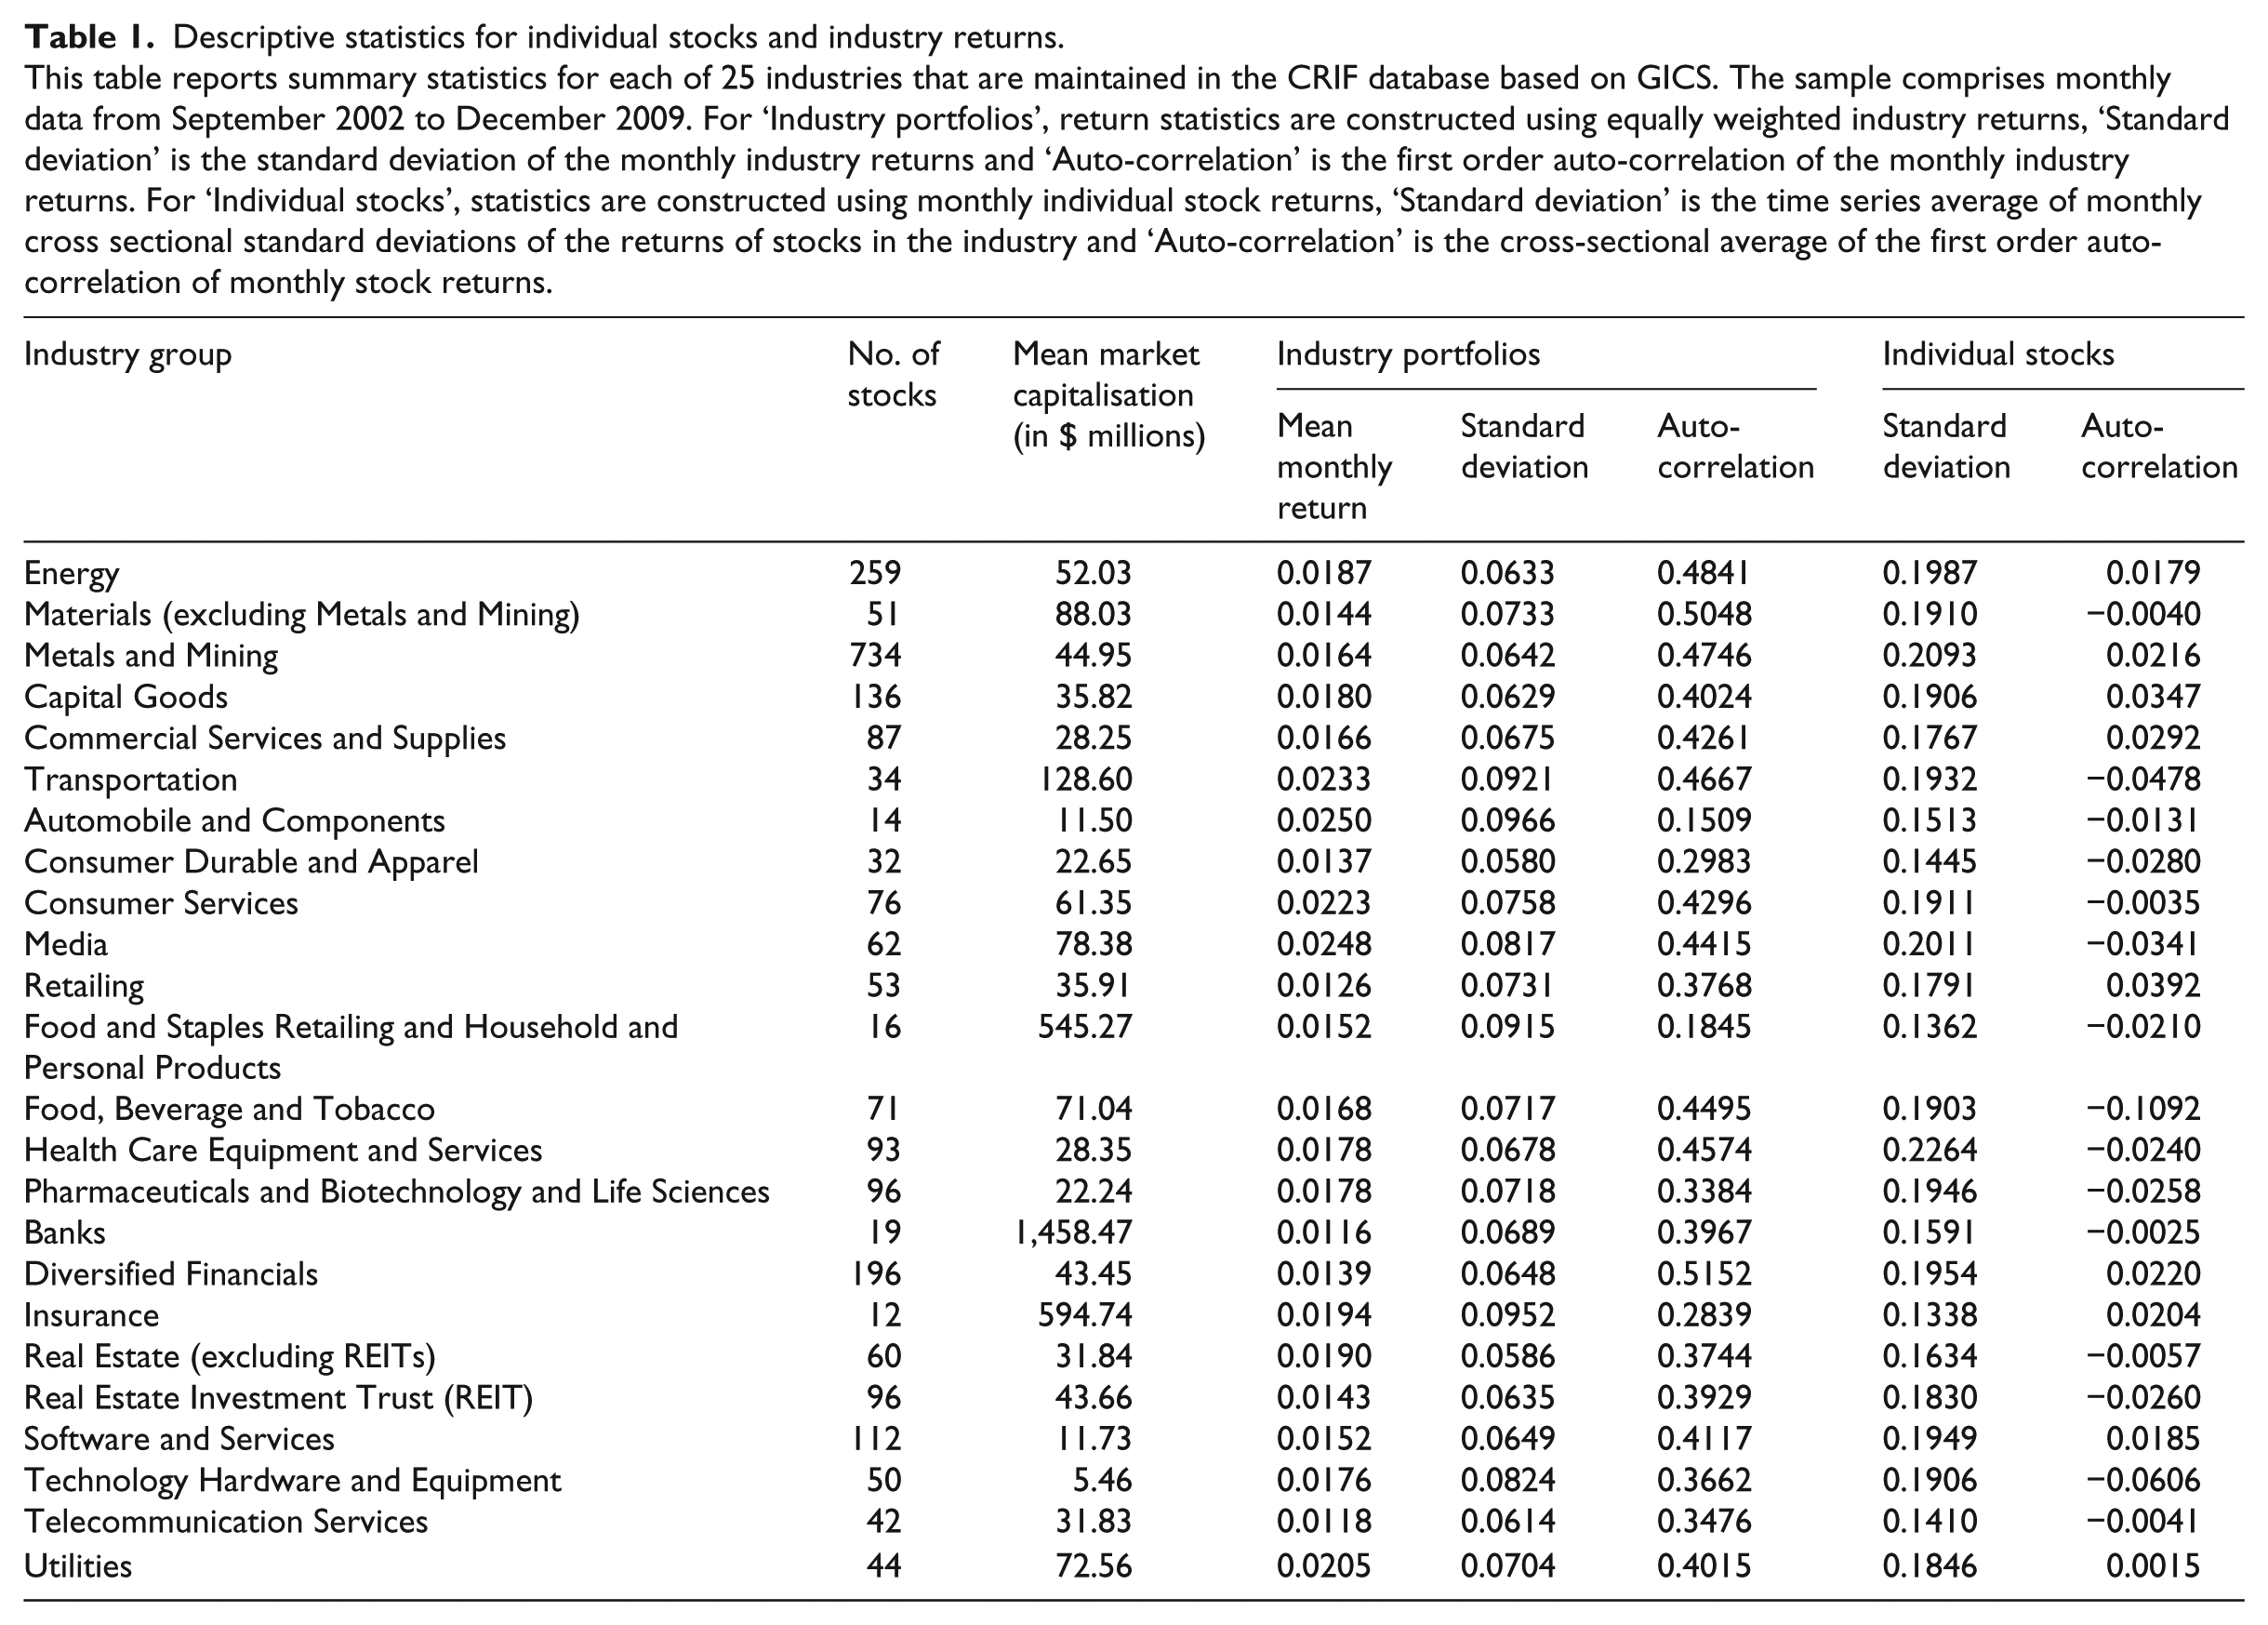
There is a sizeable variation in industry membership. Industries such as Energy, Metals and Mining, and Financials contain hundreds of firms, whereas Insurance, Automobile and Components, and Food and Staples Retailing have less than 20 firms each. This variation in industry membership may prevent us from finding significant effects. The mean return, standard deviation and auto-correlation statistics are consistent with well-known facts about returns at the industry level and at the individual stock level. The cross-sectional fluctuations in stocks within the same industry are much larger than the time-series fluctuations at the industry level. Although several industries report negative auto-correlations at the stock level, industry average returns uniformly exhibit positive auto-correlations, which implies that momentum is likely to be industry related, whereas contrarian effects may be more prevalent at the individual stock level.
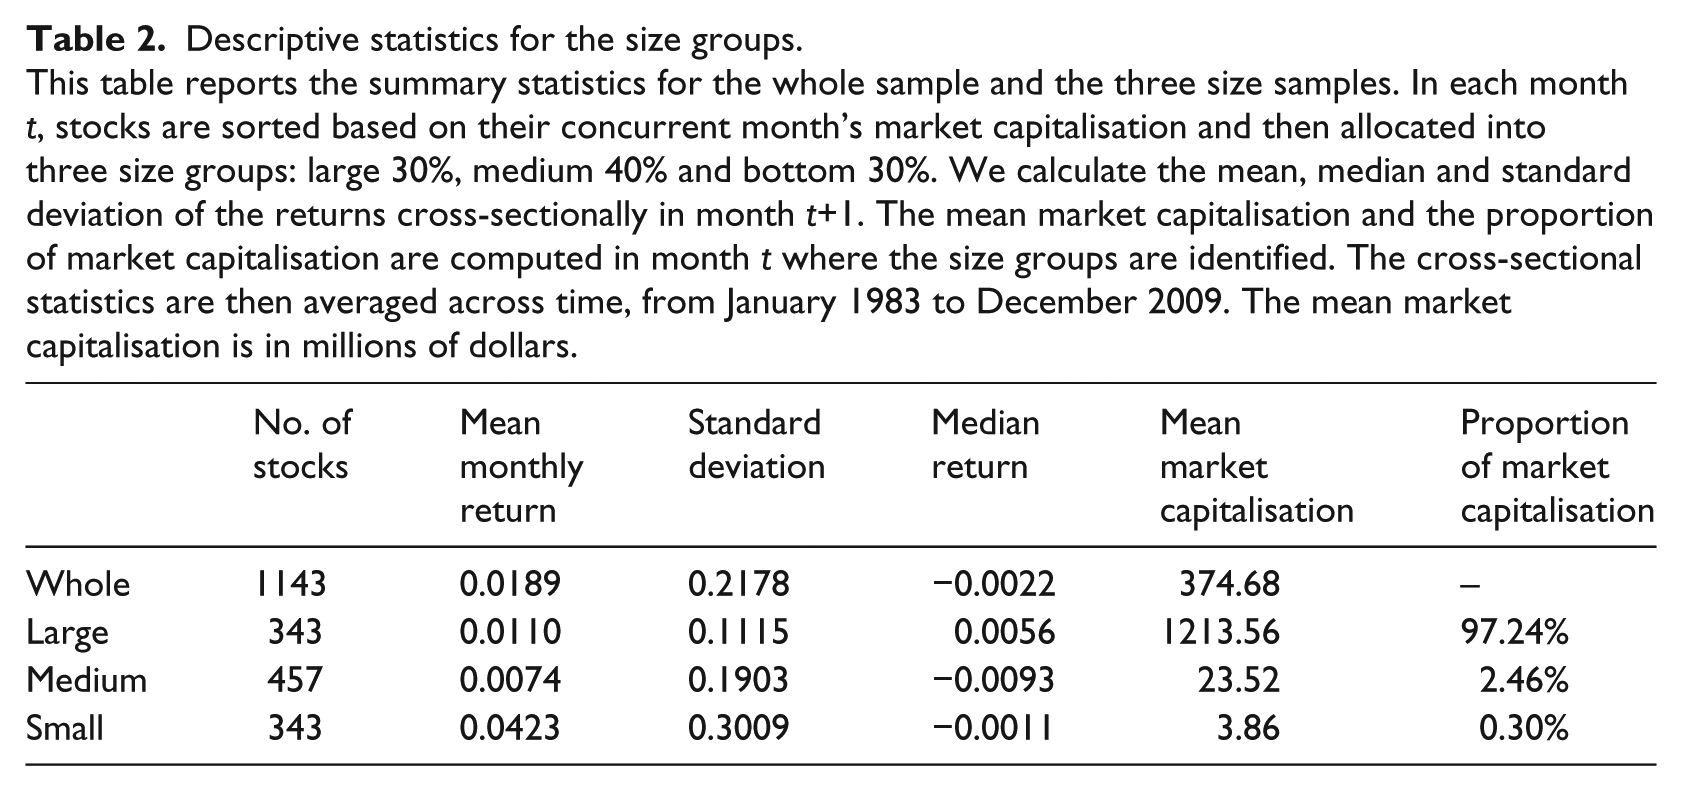
The Australian literature suggests that size plays an important role in explaining both the contrarian and momentum effects. We separate the sample into three size groups to examine the role that size plays. In each month in which portfolios are formed, stocks are sorted based on their current month’s market capitalisation and are then separated into the largest 30%, the medium 40% and the bottom 30%. Table 2 reports summary statistics for the three size groups and shows that the small group has the largest mean return, whereas the medium group exhibits the lowest. However, the large group has the lowest return volatility. Importantly, the large stocks represent 97.24% of the total market capitalisation, whereas the small stocks only represent 0.3%, showing that a disproportionately large part of the Australian market is dominated by a small number of large firms.
Descriptive statistics for the size groups.
This table reports the summary statistics for the whole sample and the three size samples. In each month t, stocks are sorted based on their concurrent month’s market capitalisation and then allocated into three size groups: large 30%, medium 40% and bottom 30%. We calculate the mean, median and standard deviation of the returns cross-sectionally in month t+1. The mean market capitalisation and the proportion of market capitalisation are computed in month t where the size groups are identified. The cross-sectional statistics are then averaged across time, from January 1983 to December 2009. The mean market capitalisation is in millions of dollars.
3. Empirical results
3.1. Market-wide reversals and intra-industry reversals
Table 3 reports the profitability of the two unconditional strategies: the standard contrarian strategy (Panel A) and the intra-industry contrarian strategy (Panel B). We report the results for the whole market and for the three size groups, large (the top 30% as calculated by market capitalisation), medium (the middle 40%) and small (the bottom 30%).
The returns on the single sorting strategies based on stocks’ performance relative to either the entire market or their own industry.
This table reports the returns on short-term contrarian strategies in which portfolios are formed using the past month’s returns and are held for one month. Panel A reports the market-wide contrarian strategy, in which stocks in the market are sorted into winners (the top decile) and losers (the bottom decile). Panel B reports the intra-industry contrarian strategy, in which stocks are sorted within their own industries and portfolios are formed by collecting winners (the top decile in each industry) and losers (the bottom decile in each industry) across all of the industries. The portfolio returns are value-weighted. ‘Losers-Winners’ represents the results for the contrarian strategy that takes a long position on losers and a short position on winners. Alpha is the risk-adjusted return using Fama and French’s (1993) three-factor model. ‘Whole Market’ represents the results when all of the stocks in the CRIF universe are included. ‘Large’, ‘Medium’ and ‘Small’ represent the results for the three size groups: the top 30% by market capitalisation, the middle 40% and the bottom 30%, respectively. For the results in each size group, stocks are allocated into size groups first, and then are sorted by their returns. t-statistics are reported underneath the return. *, **, *** indicate statistical significance at the 10%, 5% and 1% levels, respectively.
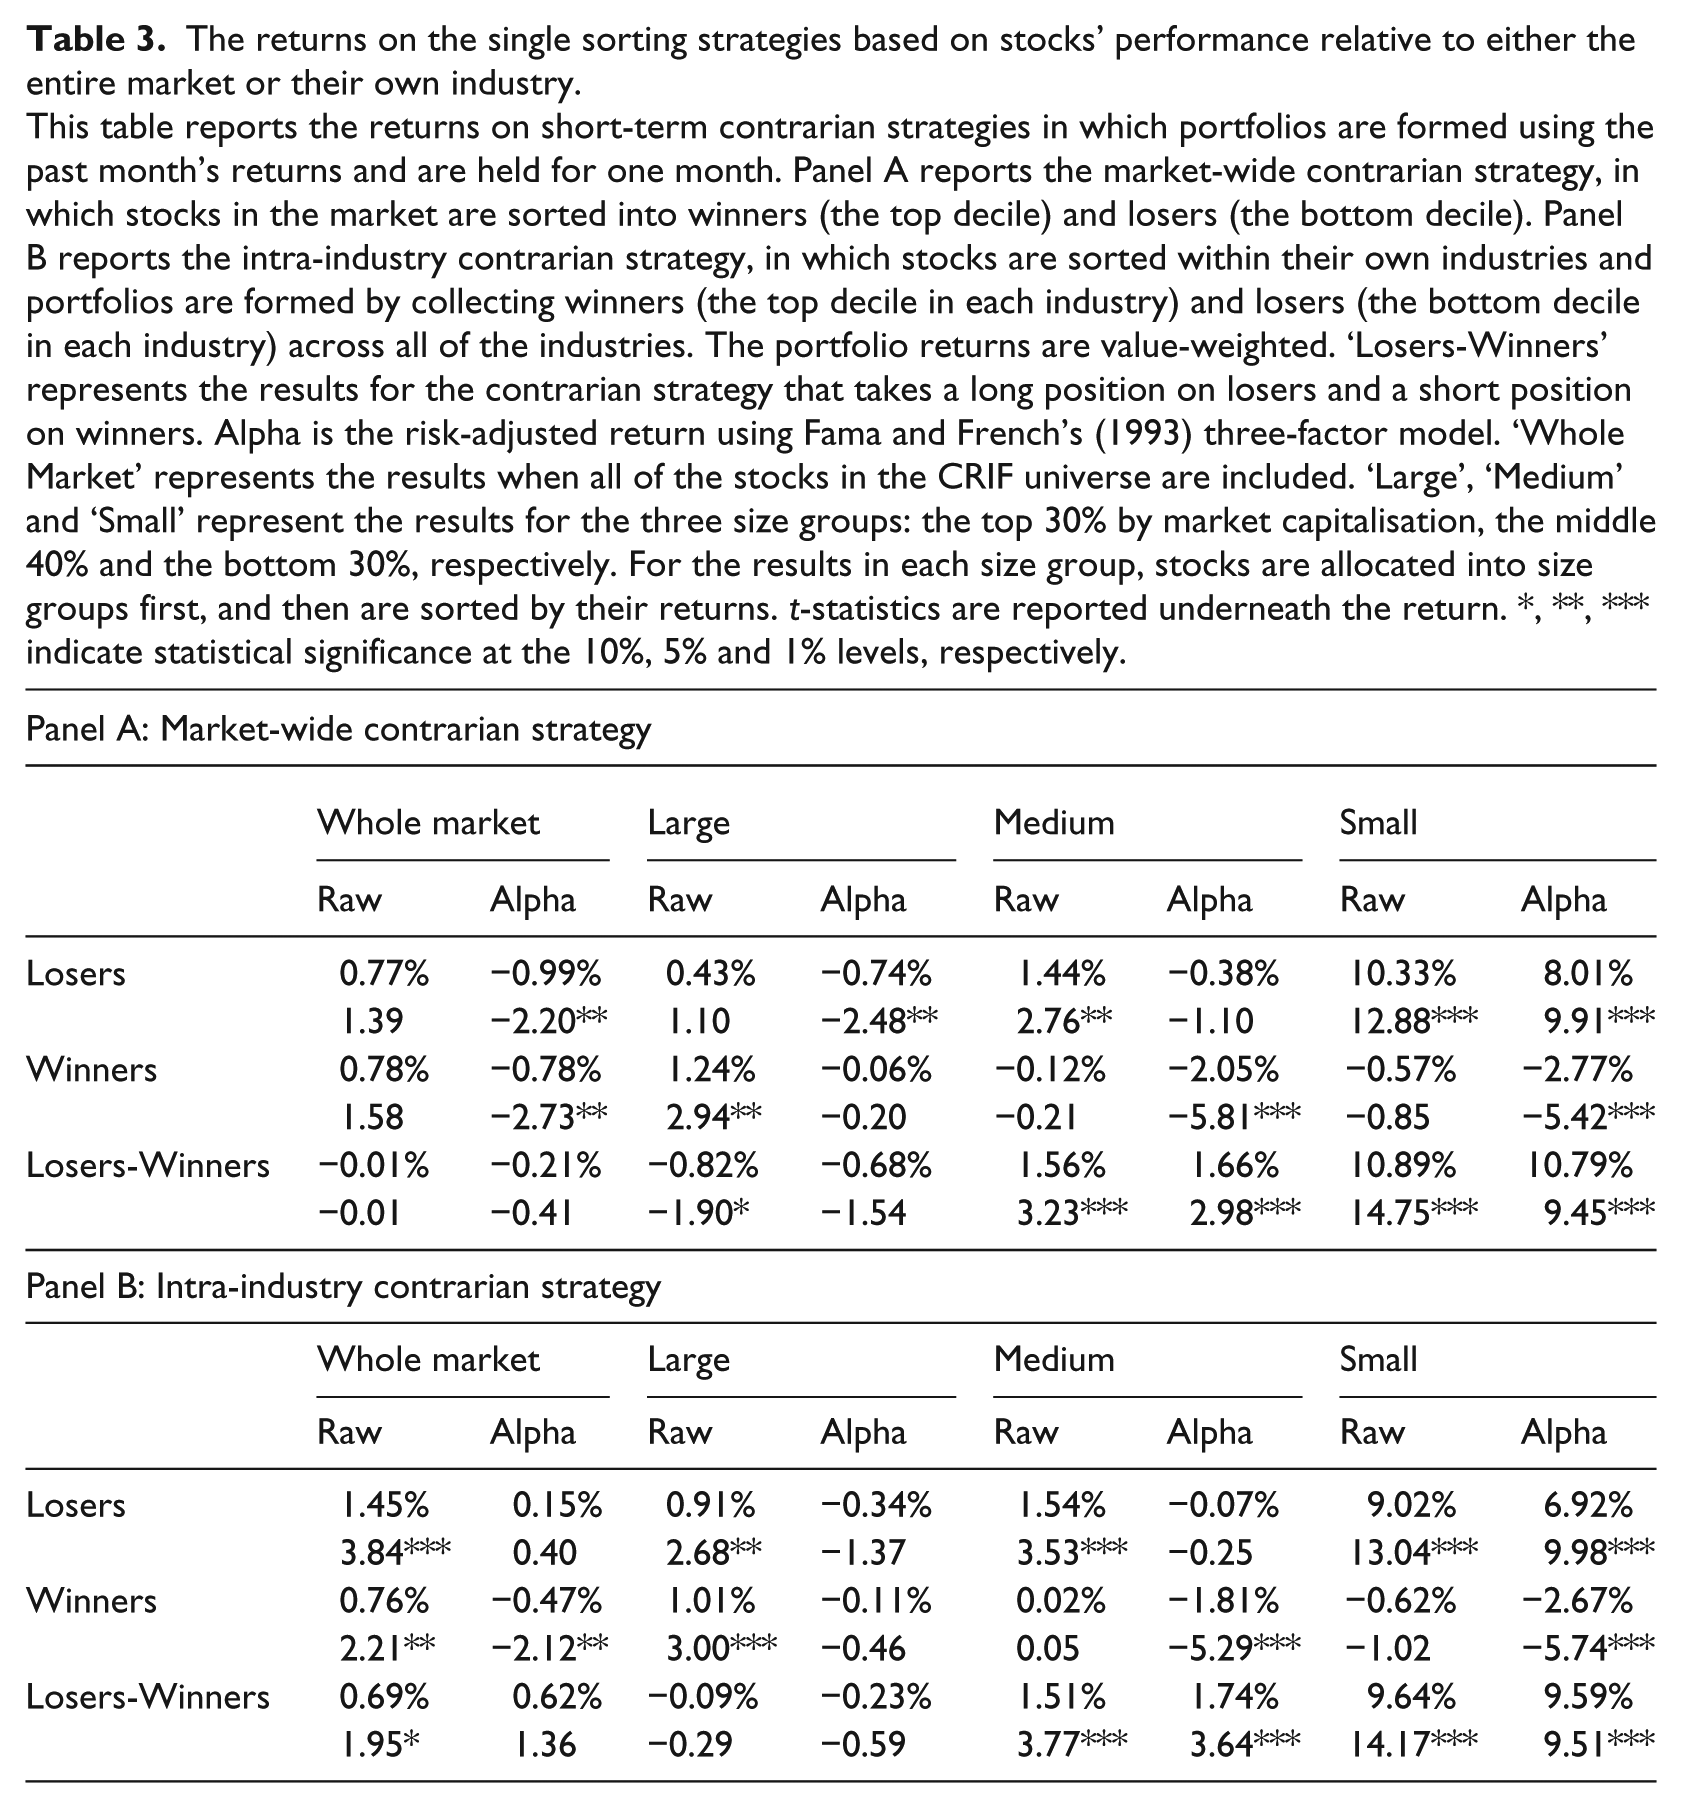
Panel A shows that the unconditional reversal effect is present only in the small and medium stocks, confirming prior evidence (e.g. Gaunt and Gray, 2003). The risk-adjusted returns on the portfolio that takes a long position on Market Losers and a short position on Market Winners are 1.66% per month (t-statistic = 2.98) for the medium group and 10.79% (t-statistic = 9.45) for the small group. In contrast, the large group exhibits some weak evidence of momentum over this short-term horizon with an alpha of −0.68% (t-statistic = −1.54). The value-weighted long-short return for the market as a whole is −0.01% and the alpha is −0.21%, both of which are statistically insignificant. The return reversal observed in smaller stocks is negated by the presence of some momentum in larger stocks, resulting in negligible contrarian effects for the whole market. 12
The intra-industry strategy reported in Panel B exhibits a much clearer contrarian pattern. The losers outperform the winners by 0.69% per month (t-statistic = 1.95) in the whole sample, although the alpha of 0.62% is not statistically significant. This represents an improvement over the result reported in Panel A of 0.70% for the raw return and 0.83% for the risk-adjusted return. Interestingly, the results by size show that the greater reversal is largely driven by large stocks exhibiting less of the momentum effect. The contrarian alpha for this subset is −0.23%, compared to -0.68% when the standard contrarian strategy is used. The medium and small groups display less variation between the two strategies. Although Hameed et al. (2010) find that the intra-industry contrarian strategy generates greater profits than the standard strategy in both large and small groups, they do show that the biggest improvement comes from large stocks.
Notwithstanding this improvement, the return on the intra-industry contrarian strategy remains negative (and statistically insignificant) for large stocks. Sorting stocks within their peer group does help in identifying potential reversals, but it is not sufficient to negate the momentum effect that apparently remains in large stocks. Indeed, Panel B shows that, although the medium and small groups exhibit clear reversals, momentum tends to be the dominant force in large stocks. This finding is consistent with prior Australian momentum research, such as Hurn and Pavlov (2003) and Brailsford and O’Brien (2008). Therefore, contrarian strategies will benefit from filtering out the momentum element. The next section examines conditional strategies that are designed to isolate short-term momentum from reversals.
3.2. Conditional strategies
Table 4 reports the performance of nine groups of stocks from the intersections of the market-wide and intra-industry sorts. We again report the results for the whole sample and for the three size groups, although the focus remains on the large group. The portfolios of interest are those in the Market Neutral group, because the previous evidence on the standard contrarian strategy implies that stocks in this group will exhibit less momentum, if any, than the Market Losers and Market Winners. Indeed, Table 4 shows that within the Market Neutral population, Industry Losers outperform Industry Winners for the entire market and in the three size groups. The contrarian strategy that buys Industry Losers and sells Industry Winners from the Market Neutral stocks generates 0.90% per month after controlling for risk (t-statistic = 2.97) for large stocks (see ’Market Neutral, Industry Losers – Market Neutral, Industry Winners’ at the bottom of Table 4). It should be noted that the profits accrue approximately equally from both the long and short sides. The conditional results are weaker than the unconditional results in Table 3 for medium and small stocks. Our finding is expected, as momentum in Australia exists mostly in larger stocks (Brailsford and O’Brien, 2008) and the double-sorting technique is designed to minimise momentum. We conclude that short-term reversals do exist in large stocks in the Australian market in the form of intra-industry reversals, but only when momentum over the same horizon is controlled for.
The returns on the double sorting strategies based on stocks’ performance relative to the entire market and their own industry.
This table reports the results for the portfolios that are double-sorted on their returns relative to the market and industry. Stocks are first sorted market-wide into ‘Market Winners’ (the top quintile), ‘Market Neutrals’ (the middle 3 quintiles) and ‘Market Losers’ (the bottom quintile). Independently, all stocks are also sorted within their own industries into ‘Industry Winners’ (the top quintile within their own industry), ‘Industry Neutrals’ (the middle 3 quintiles) and ‘Industry Losers’ (the bottom quintile). The value-weighted portfolio returns of the resulting nine intersections are reported. ‘N’ is the number of stocks in the intersection. Alpha is the risk-adjusted return using Fama and French’s (1993) three-factor model. ‘Whole Market’ represents the results when all of the stocks in the CRIF universe are included. ‘Large’, ‘Medium’ and ‘Small’ represent the results for the three size groups: the top 30% by market capitalization, the middle 40% and the bottom 30%, respectively. For the results in each size groups, stocks are allocated into size groups before the double sorts. t-statistics are reported underneath the return. *, **, *** indicate statistical significance at the 10%, 5% and 1% levels, respectively.
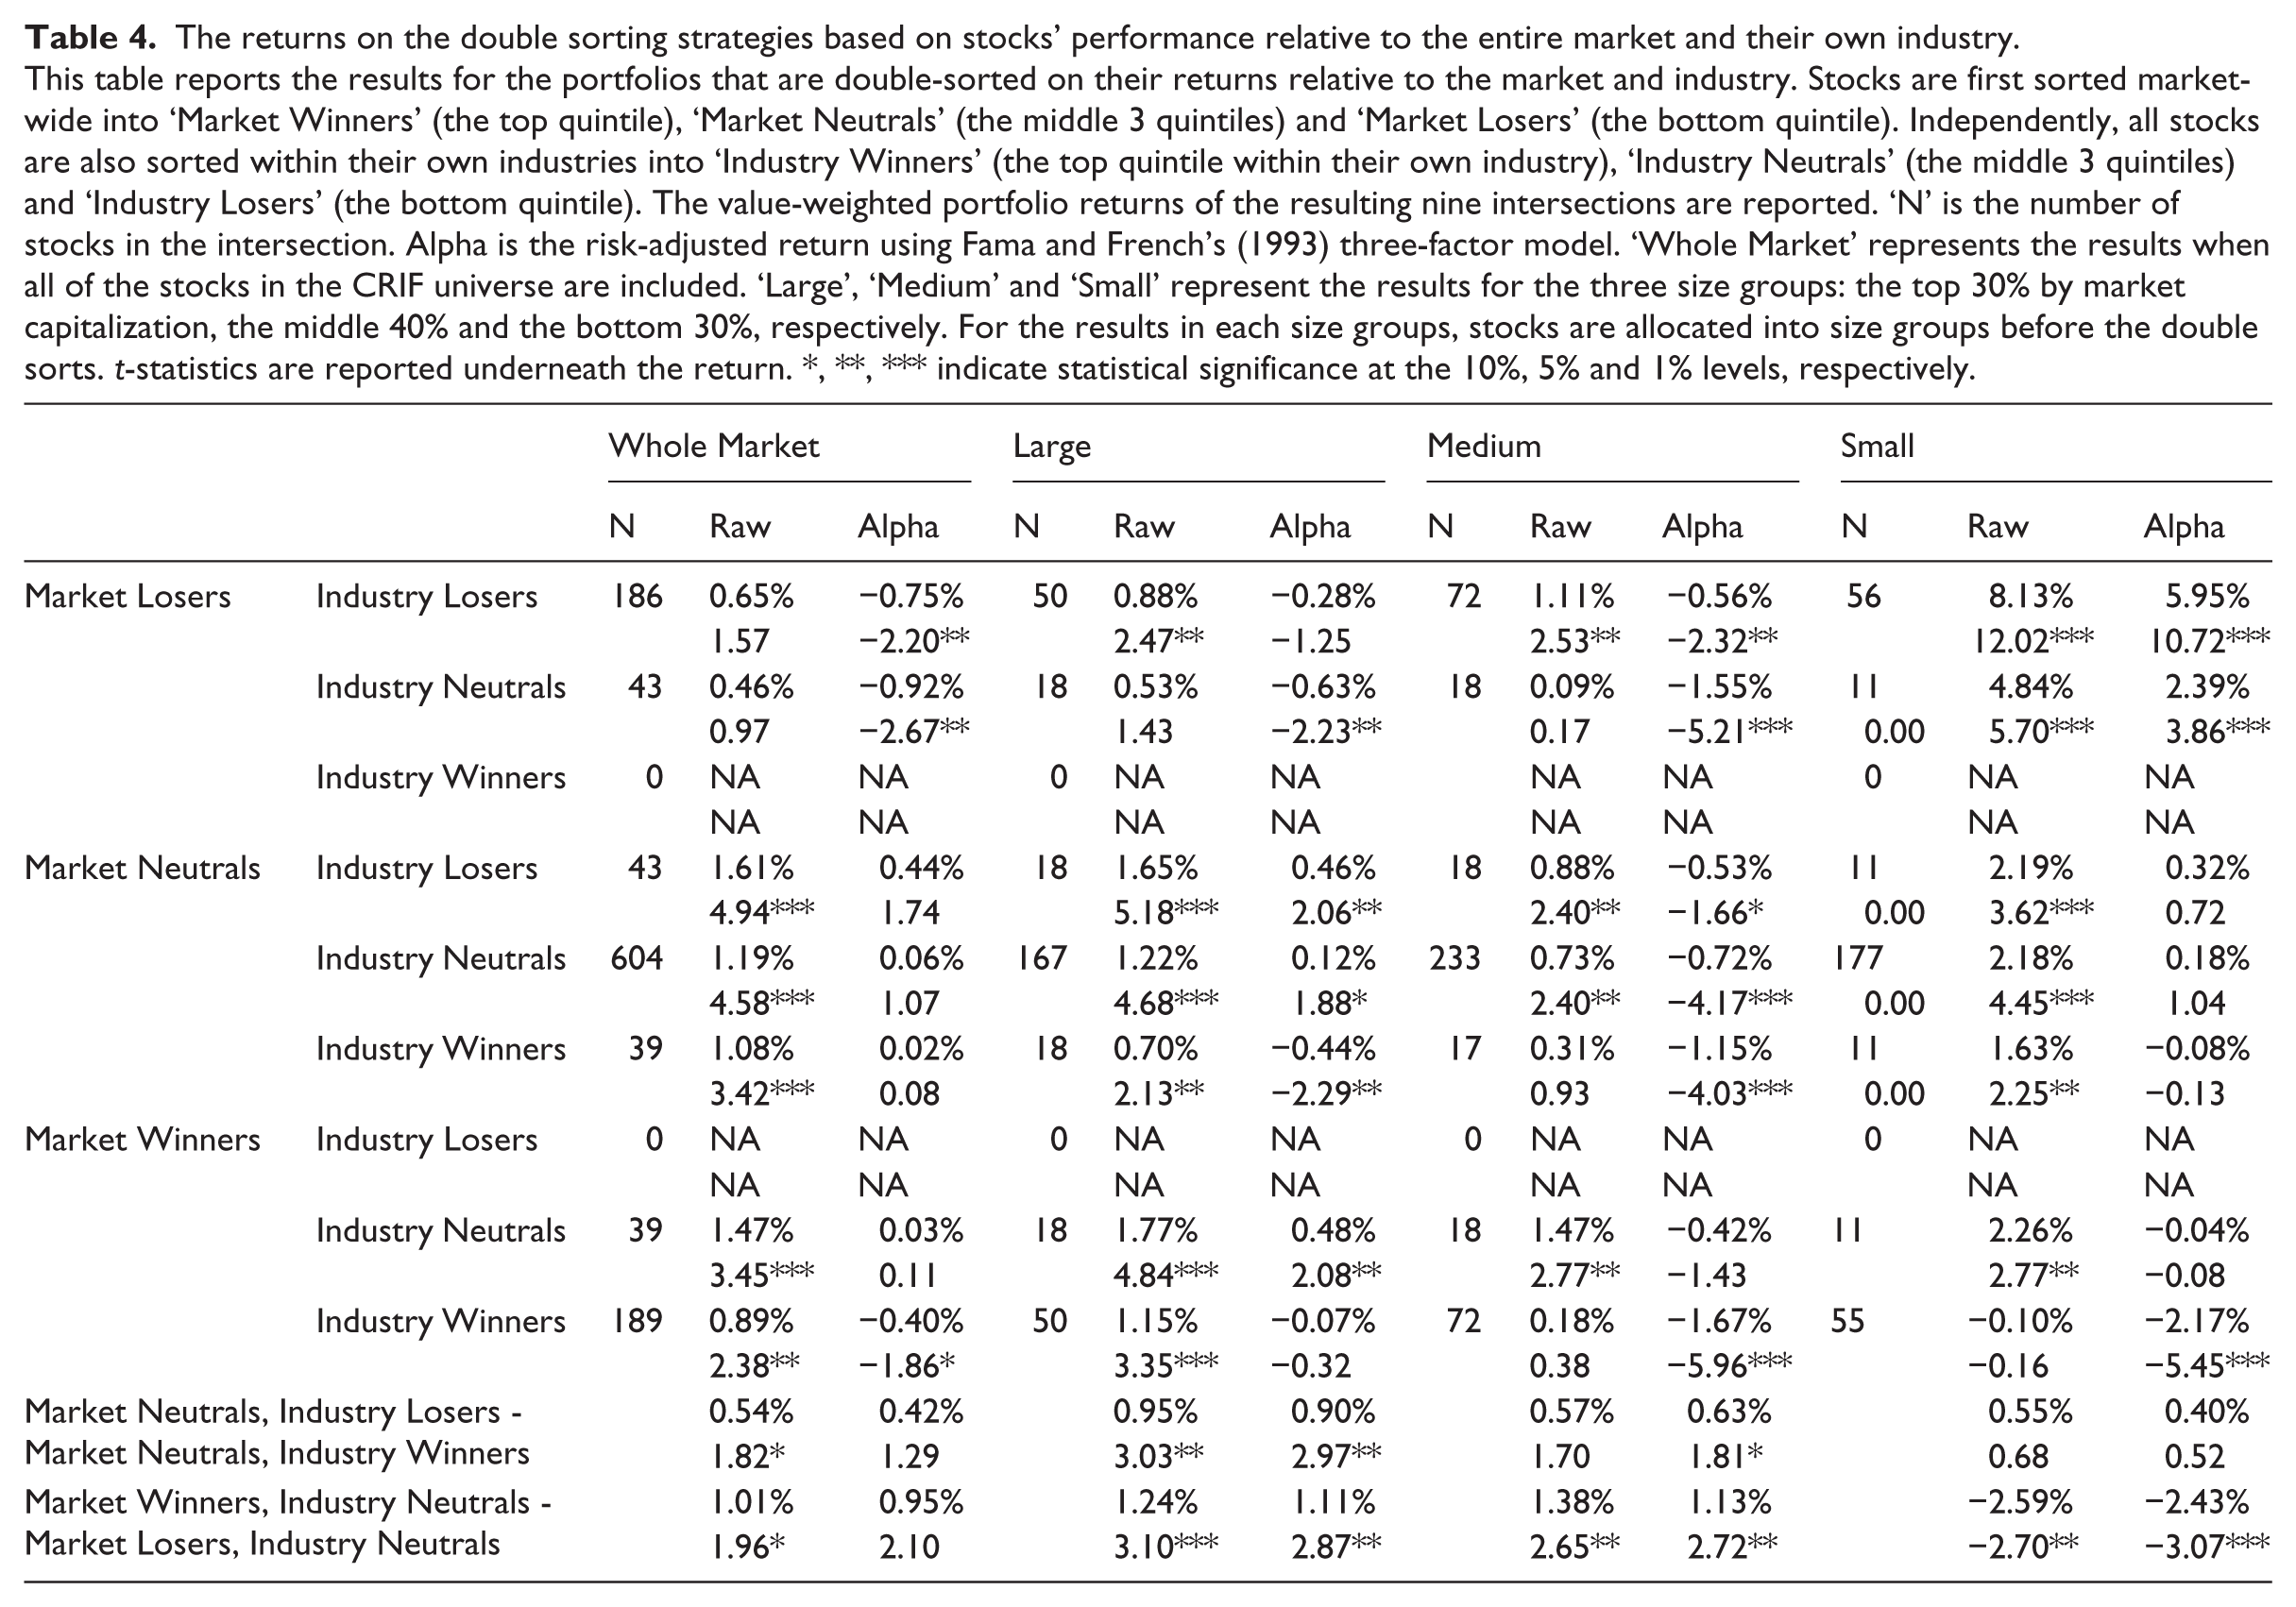
Table 4 further shows that momentum is observed once intra-industry reversals are neutralised. The intersections of Market Winners and Industry Neutrals, and Market Losers and Industry Neutrals seek to amplify market momentum while minimising intra-industry reversals. As expected, except for small stocks, these portfolios do exhibit momentum. Among Industry Neutral stocks, Market Winners outperform Market Losers. A strategy of long stocks at the intersection of Market Winners and Industry Neutrals and short stocks at the intersection of Market Losers and Industry Neutrals generates an alpha of 1.11% (t-statistic = 2.87) for large stocks (see ’Market Winners, Industry Neutrals – Market Losers, Industry Neutrals’ at the bottom of Table 4). Again, the profitability of the strategy is evenly split between the long and short positions. 13 Medium stocks experience a similar, smaller in magnitude, momentum effect, whereas small stocks exhibit negative momentum or positive reversals. Table 4 therefore shows that reversals and momentum co-exist over the same horizon, especially in large stocks. Extreme performance relative to the industry benchmark tends to revert, if the performance is not extreme when benchmarked against the entire market. Conversely, extreme market-wide performance tends to trend, if the performance is not extreme relative to peers. These results implicitly indicate a positive industry momentum, which we now examine. 14
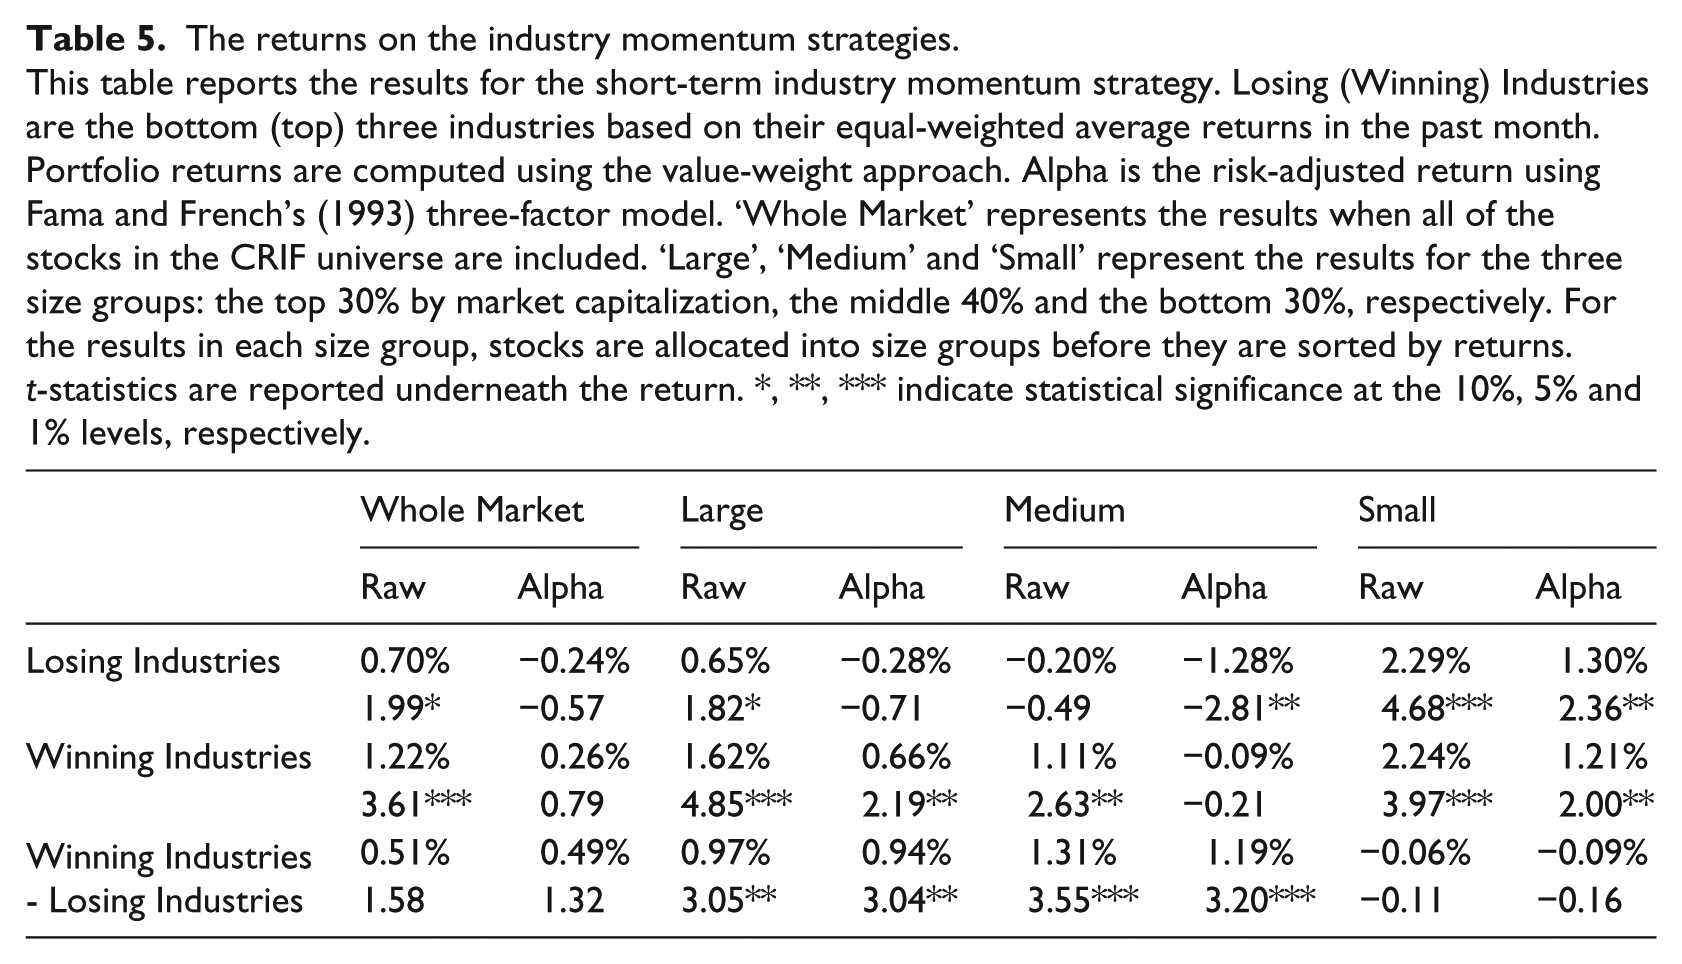
Table 5 reports the returns on Moskowitz and Grinblatt’s (1999) industry momentum strategy implemented over a one-month horizon. The strategy involves buying the three best performing industries and selling the three worst performing industries, based on their equal-weighted returns in the previous month. Portfolio returns in the following month are computed using the value-weighted approach. We first sort stocks by their size and repeat the same procedure as discussed above to obtain the results for the three size groups. Table 5 shows that short-term industry momentum does exist in large and medium stocks. The returns on buying the three best performing industries and selling the three worst performing industries are 0.94% per month (t-statistic = 3.04) for large stocks and 1.19% per month (t-statistic = 3.20) for medium stocks, after controlling for risk. The industry momentum effect in large (medium) stocks is driven more by the long (short) position. There is no industry momentum effect for small stocks. Industry momentum profits are statistically insignificant for the market as a whole. These findings reconcile the discrepancy between Hurn and Pavlov (2003), who document strong industry momentum in the top 200 largest stocks, and Marshall and Cahan (2005), who report insignificant industry momentum in their sample of all stocks.
The returns on the industry momentum strategies.
This table reports the results for the short-term industry momentum strategy. Losing (Winning) Industries are the bottom (top) three industries based on their equal-weighted average returns in the past month. Portfolio returns are computed using the value-weight approach. Alpha is the risk-adjusted return using Fama and French’s (1993) three-factor model. ‘Whole Market’ represents the results when all of the stocks in the CRIF universe are included. ‘Large’, ‘Medium’ and ‘Small’ represent the results for the three size groups: the top 30% by market capitalization, the middle 40% and the bottom 30%, respectively. For the results in each size group, stocks are allocated into size groups before they are sorted by returns. t-statistics are reported underneath the return. *, **, *** indicate statistical significance at the 10%, 5% and 1% levels, respectively.
Can we also uncover reversals in large stocks after controlling for this industry momentum in the same way as we controlled for individual price momentum in Table 4? We answer this question in Table 6.
The returns on the double sorting strategies based on inter-industry and intra-industry performance.
Industries are sorted into Winning Industries (the top three industries by equal-weighted return), Losing Industries (the bottom three industries), and Neutral Industries (the remaining industries). Independently, stocks are also sorted within their own industries into Industry Winners (the top quintile within their own industry), Industry Neutrals (the middle three quintiles) and Industry Losers (the bottom quintile). The value-weighted portfolio returns on the resulting nine intersections are reported. ‘N’ is the number of stocks in the intersection. Alpha is the risk-adjusted return using Fama and French’s (1993) three-factor model. ‘Whole Market’ represents the results when all of the stocks in the CRIF universe are included. ‘Large’, ‘Medium’ and ‘Small’ represent the results for the three size groups: the top 30% by market capitalization, the middle 40% and the bottom 30%, respectively. For the results in each size group, stocks are allocated into size groups before they are sorted by returns. t-statistics are reported underneath the return. *, **, *** indicate statistical significance at the 10%, 5% and 1% levels, respectively.
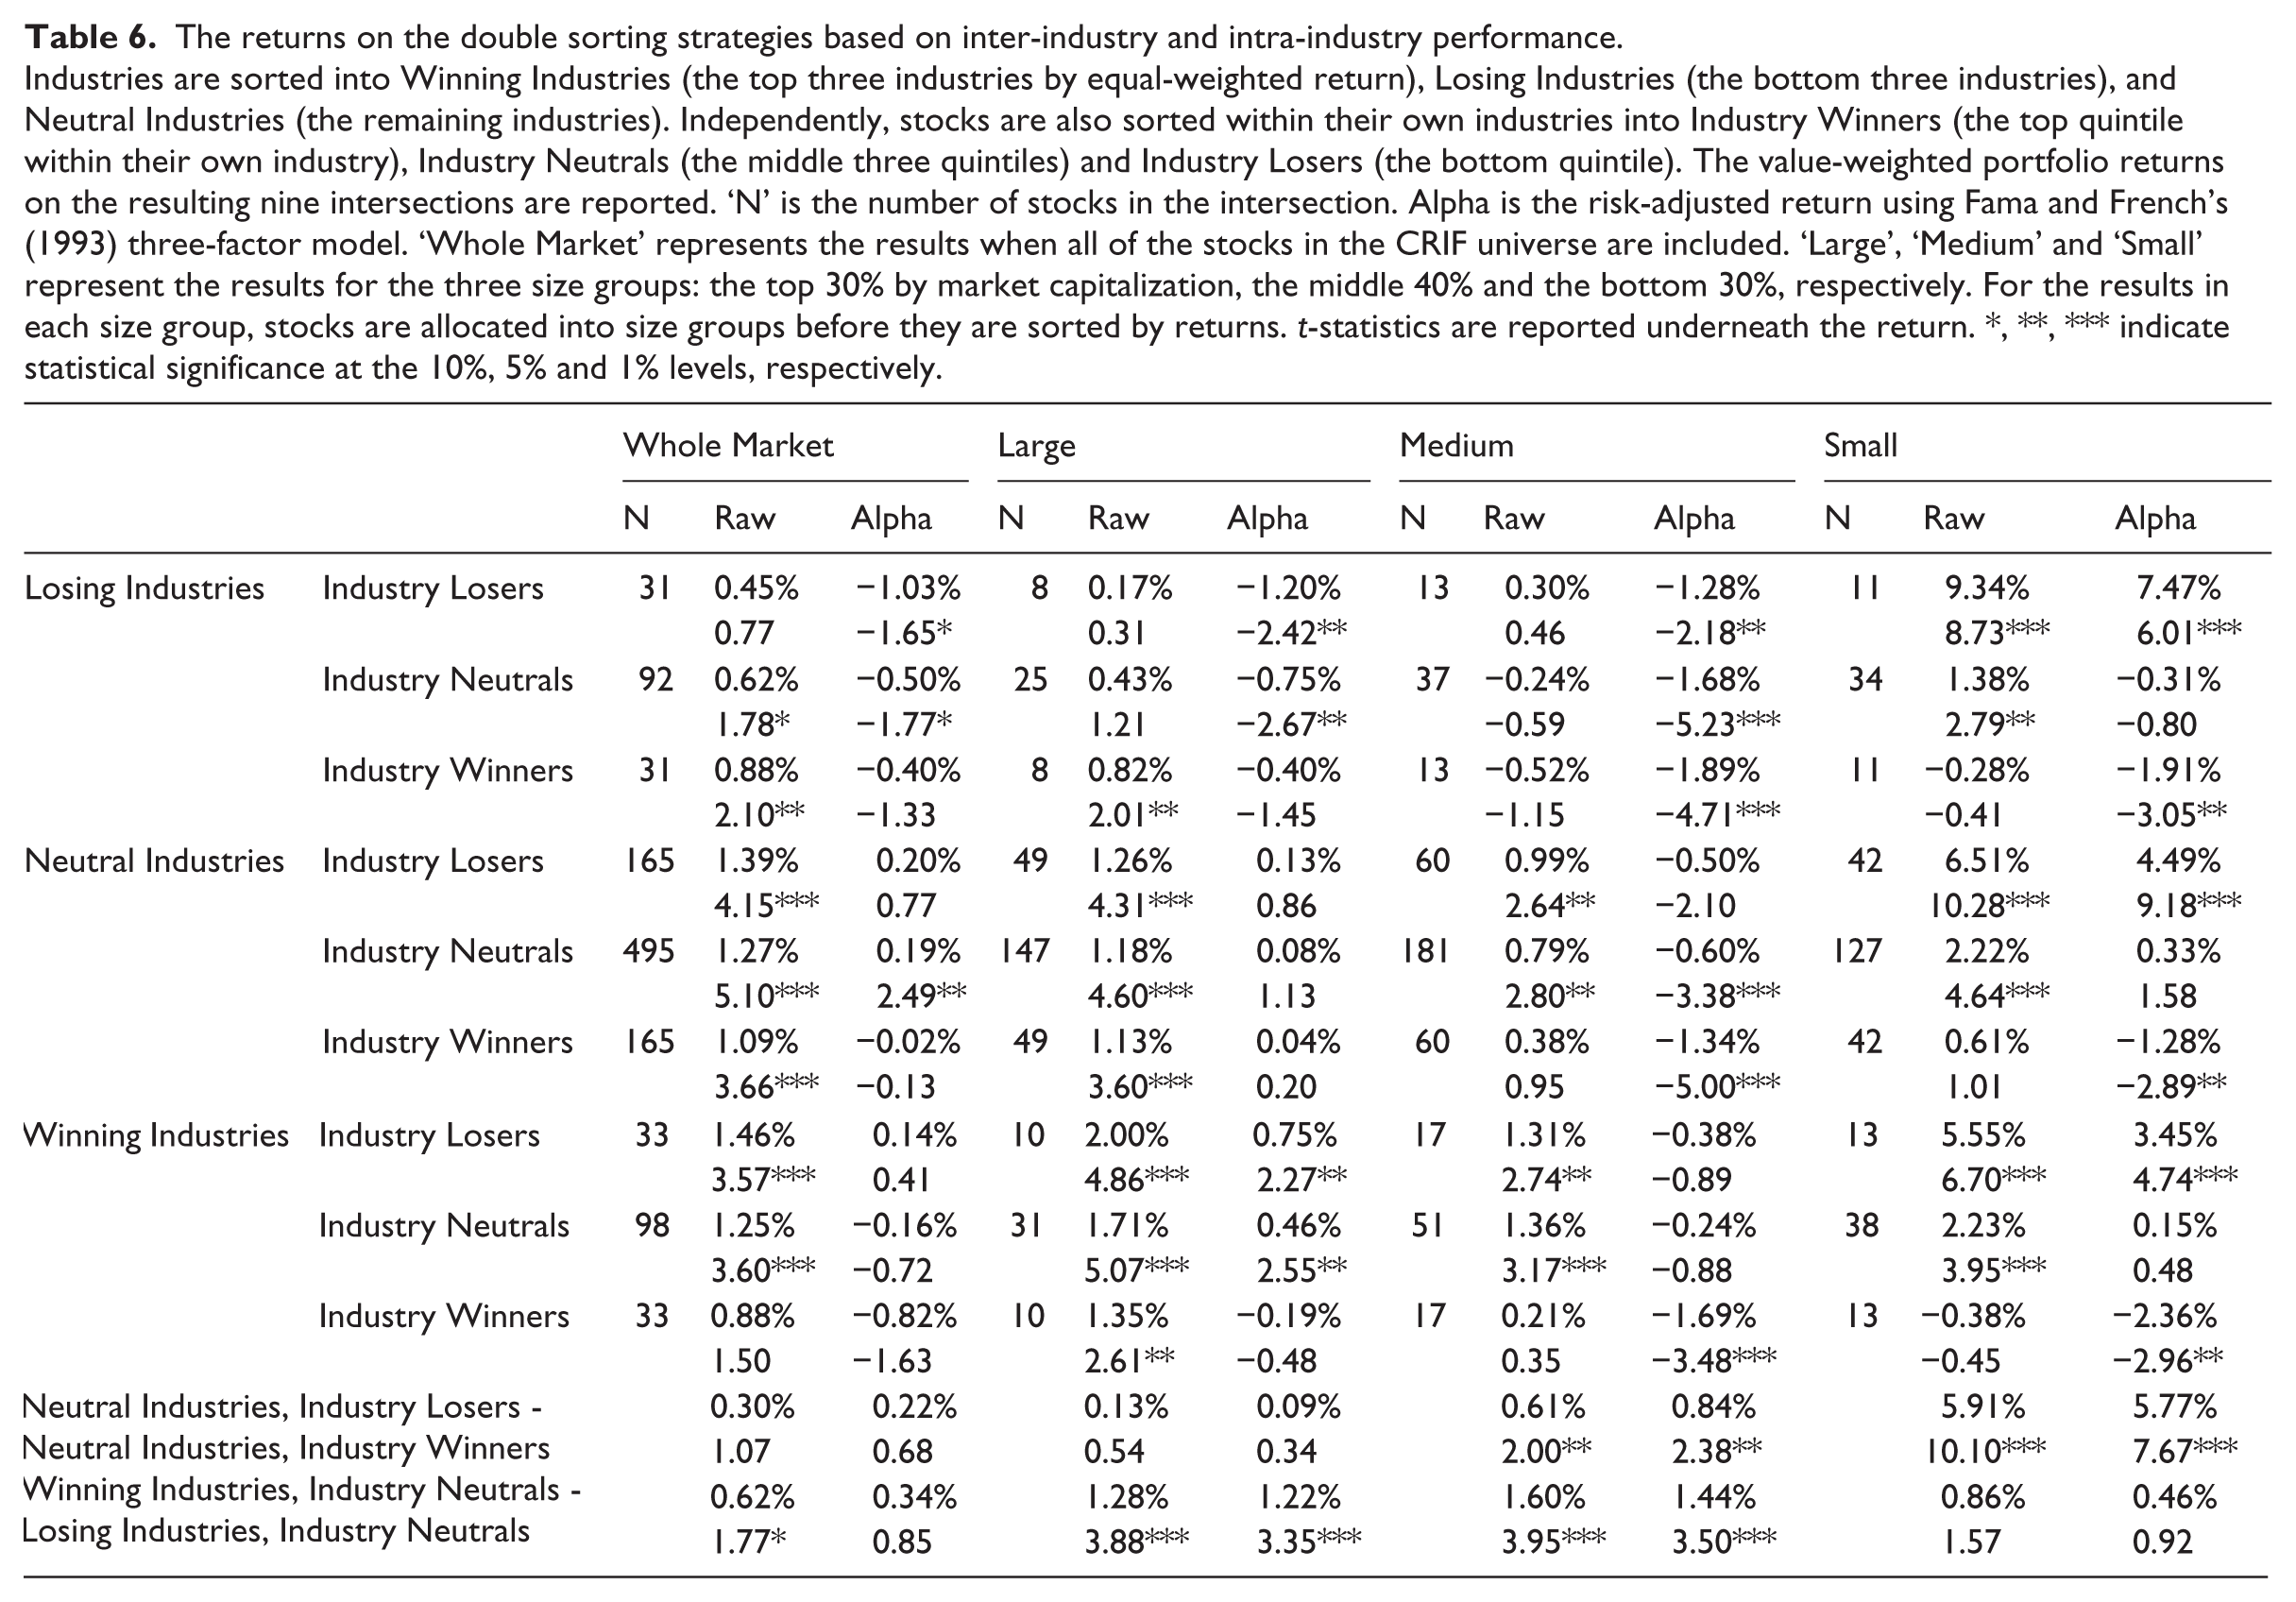
Similarly to Table 4, Table 6 reports the performance of nine portfolios formed from independent intra-industry and inter-industry sorts. The risk-adjusted returns for the intersections of large stocks appear to be dictated by the identity of the industry group that the stock belongs to. The returns generally improve as we move from Losing Industries to Winning Industries. Neutral Industries neutralise the effect of industry momentum and are therefore of interest. There is little performance difference between Industry Winners and Industry Losers in the large stock sample of Neutral Industries. A conditional contrarian strategy that buys Neutral Industries/Industry Losers and sells Neutral Industries/Industry Winners generates a positive but insignificant alpha in this group. However, the returns are significant for medium and small stock samples, indicating that the dominance of the industry momentum factor may be the reason behind the poor performance of the conditional contrarian strategy that controls for industry momentum in the large stock sample.
In contrast, when the intra-industry contrarian effect is neutralised, industry momentum is strengthened. Table 6 shows that a conditional momentum strategy that buys at the intersection of Winning Industries and Industry Neutrals and sells at the intersection of Losing Industries and Industry Neutrals generates an alpha of 1.22% (t-statistic = 3.35) for large stocks. This return is considerably larger than that generated by the ‘unconditional’ industry momentum strategy reported in Table 5. A similar dominance of the industry momentum effect exists in medium stocks but not in small stocks. This finding is not surprising, as Table 5 shows that the industry momentum effect only exists in large and medium stocks. 15
The results from Tables 4 to 6 therefore show the co-existence of contrarian and momentum effects over a one-month period. More importantly, both of the effects can be observed and are economically meaningful in the large stocks in the Australian market. 16
3.3. Robustness checks
3.3.1. Risk adjustment
We used the Fama-French three-factor model to adjust risk in our main analysis. We recalculate the alphas using the CAPM and Carhart’s (1997) four-factor model to ensure that the results are not driven by our risk specification. We also consider Brailsford et al.’s (2012) method for constructing the Fama-French factors. 17 In total, we consider four different risk models. The results (not shown) are largely the same.
3.3.2. Seasonality
Brown et al. (1983) find that January and July exhibit higher returns in Australia, due to seasonal effects. In their study of momentum in Australia, Durand et al. (2006) find that winners and losers reverse strongly in July and, to a lesser extent, in January. We re-examine the performance of the conditional strategies when January and July returns are excluded, to check that our results are not driven by seasonality. The exclusion of the January and July performances does weaken the conditional intra-industry reversal effect for most of the size groups (the results are not shown). However, the effect is most pronounced in smaller stocks, which is consistent with Brown et al.’s (1983) finding that seasonality only affects smaller stocks. The conditional momentum strategies are, however, not affected by the seasonality effect. The strategies continue to report positive, statistically significant profits when the returns for January and July are excluded, which corroborates well with Marshall and Cahan’s (2005) finding that seasonality does not materially affect momentum results.
3.4. The effect of liquidity and firm-specific information on short-term returns
Is the contrarian effect caused by liquidity pressure and negated by an under-reaction to news or is it driven by an overreaction to news? Is the momentum effect driven by an under-reaction to news? What is the marginal contribution of these counteracting forces to the phenomena? We now attempt to answer these questions.
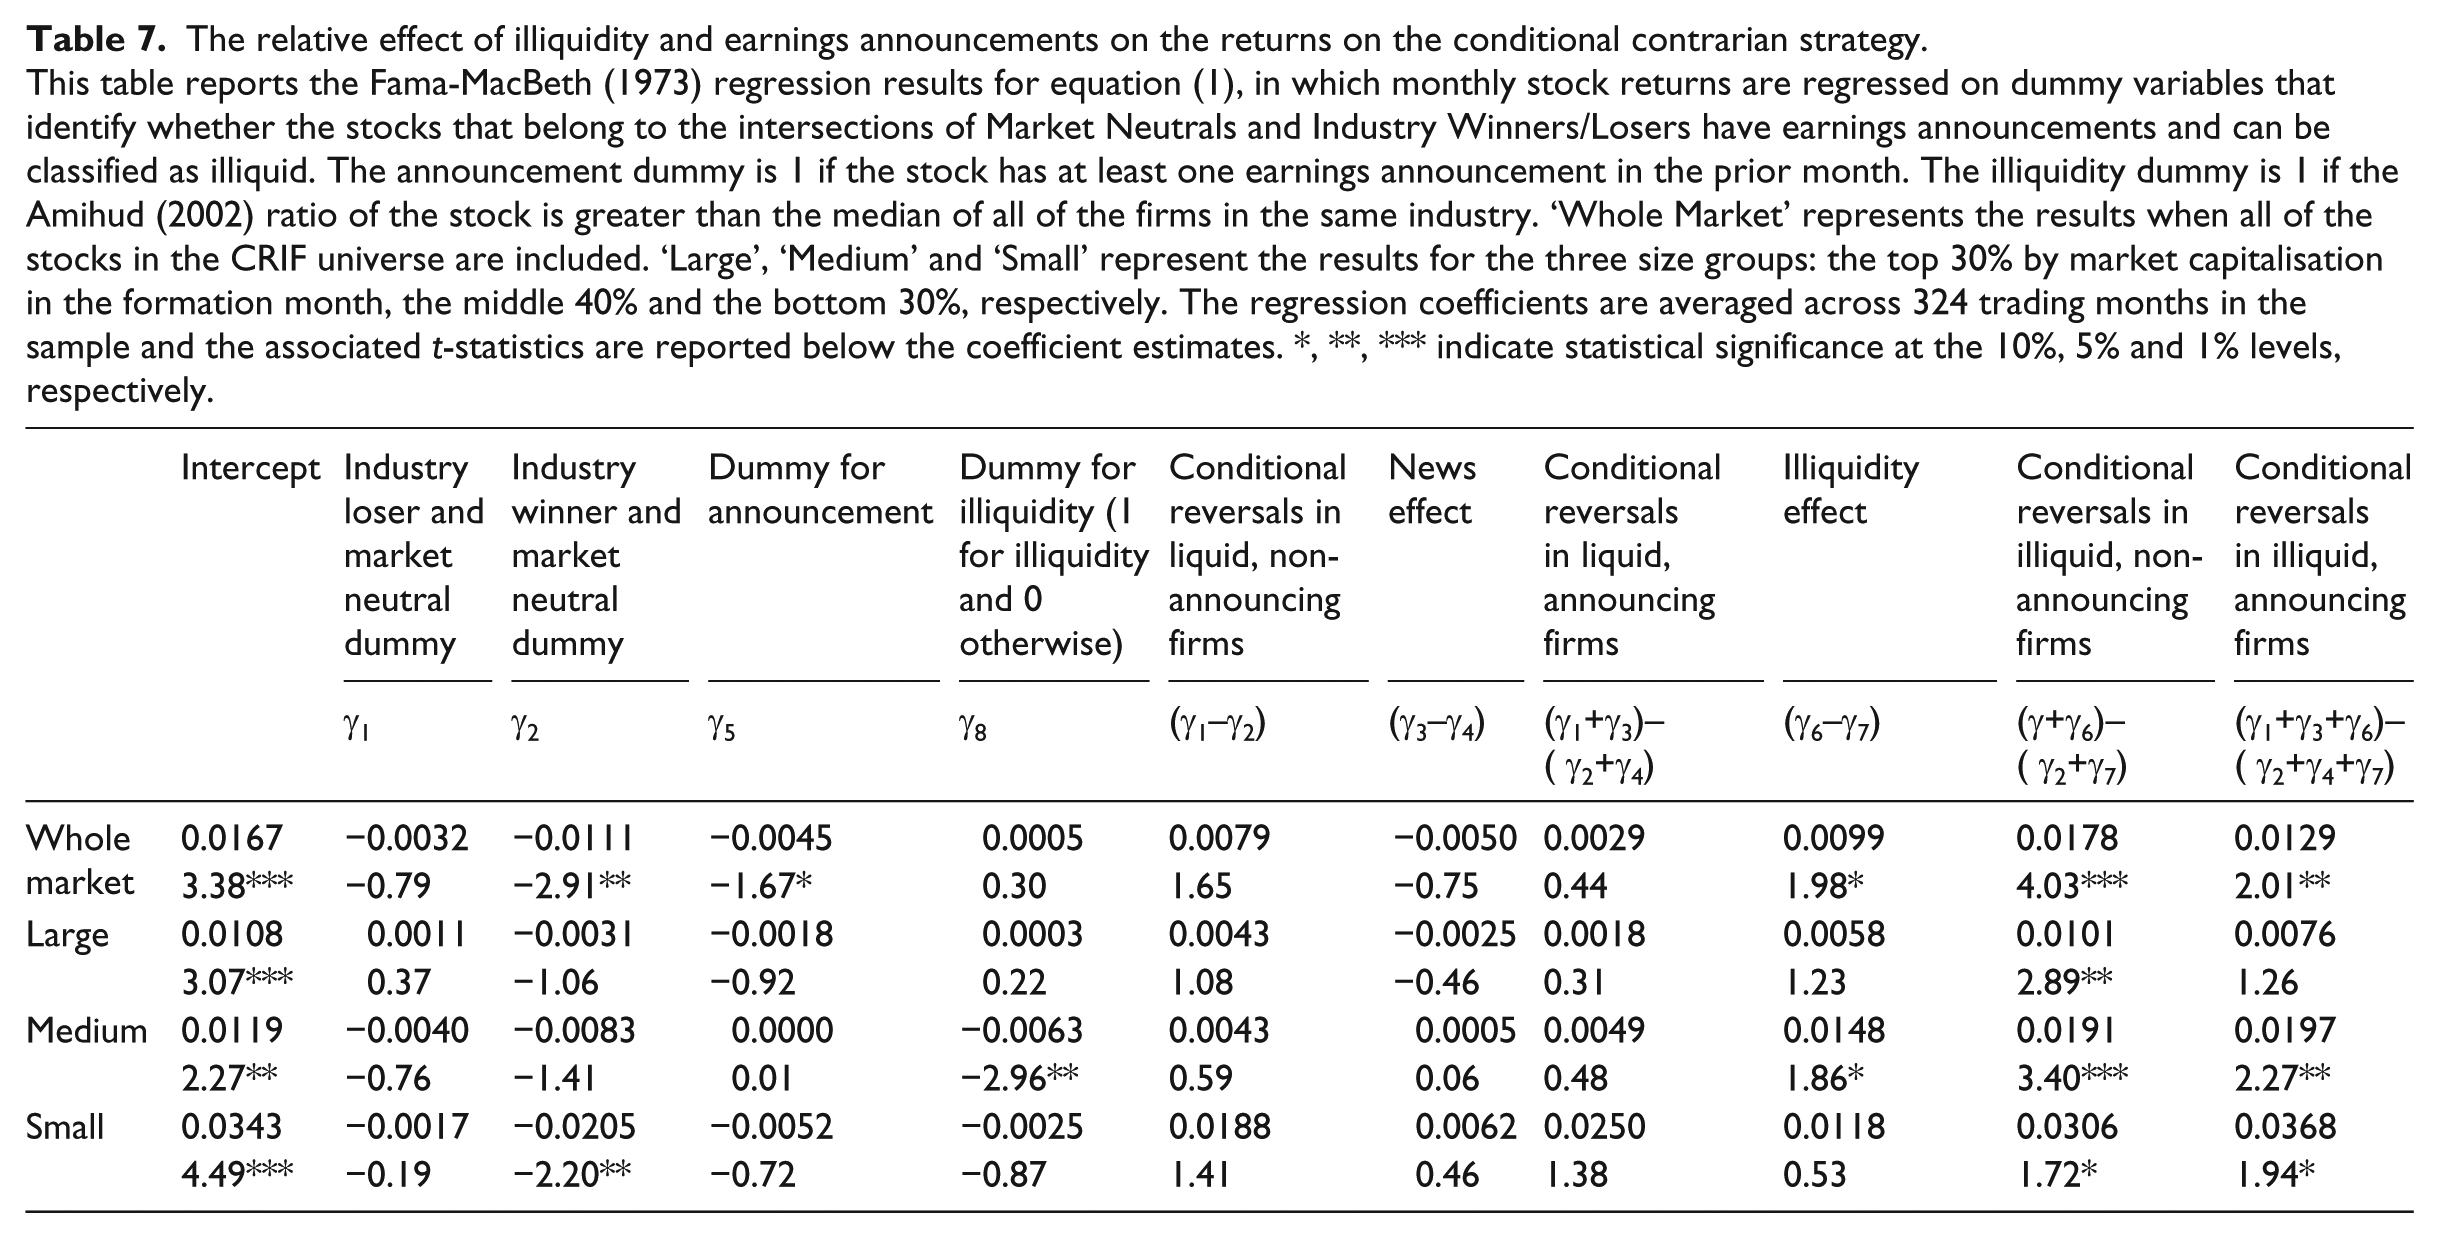
Table 7 presents the regression results for equation (1). We again report the results for the whole sample and for the large, medium and small groups. The earnings announcements have a negative effect on the conditional contrarian profit in large stocks, which are the subset that exhibit significant conditional reversals. After controlling for illiquidity, reversals are weaker in the firms that make announcements. This evidence is consistent with Hameed and Mian (2014) and agrees with theoretical predictions (e.g. Hong and Stein, 1999). The illiquidity effect is positive across all of the samples analysed: the firms that suffer illiquidity in the formation month reverse more after controlling for earnings announcements. This confirms prior evidence in the literature that reversals tend to be driven by illiquidity shocks. The firms that are illiquid but make earnings announcements in the formation month show a positive conditional contrarian profit (the last column in Table 7), suggesting that reversals induced by illiquidity outweigh the price continuation caused by an under-reaction to earnings announcements. Although our results lack statistical significance due to limited earnings events in the dataset, they corroborate well with the literature.
The relative effect of illiquidity and earnings announcements on the returns on the conditional contrarian strategy.
This table reports the Fama-MacBeth (1973) regression results for equation (1), in which monthly stock returns are regressed on dummy variables that identify whether the stocks that belong to the intersections of Market Neutrals and Industry Winners/Losers have earnings announcements and can be classified as illiquid. The announcement dummy is 1 if the stock has at least one earnings announcement in the prior month. The illiquidity dummy is 1 if the Amihud (2002) ratio of the stock is greater than the median of all of the firms in the same industry. ‘Whole Market’ represents the results when all of the stocks in the CRIF universe are included. ‘Large’, ‘Medium’ and ‘Small’ represent the results for the three size groups: the top 30% by market capitalisation in the formation month, the middle 40% and the bottom 30%, respectively. The regression coefficients are averaged across 324 trading months in the sample and the associated t-statistics are reported below the coefficient estimates. *, **, *** indicate statistical significance at the 10%, 5% and 1% levels, respectively.
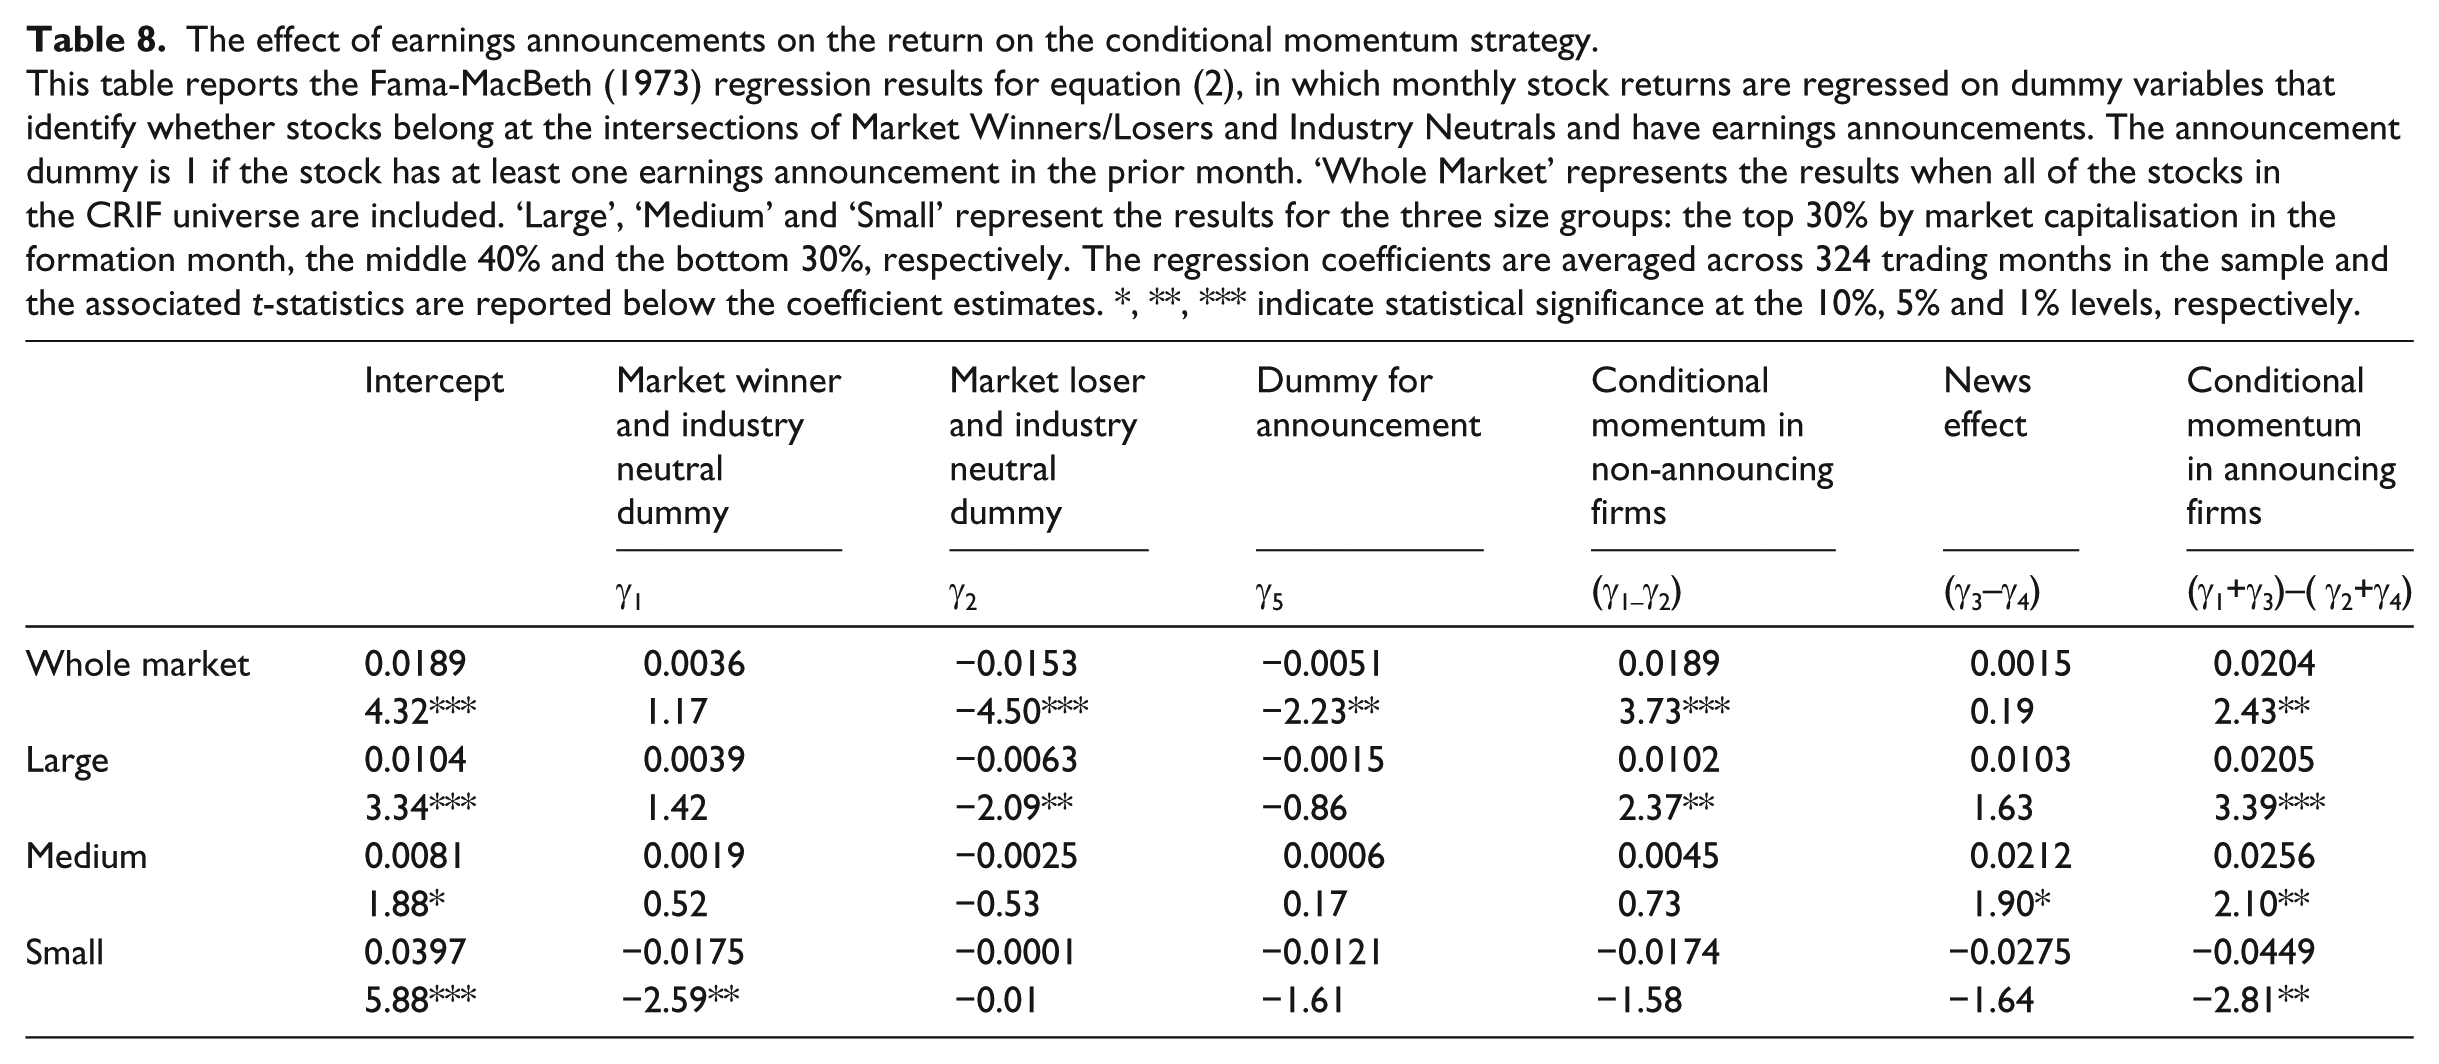
In our final analysis, we examine the effect of earnings announcements on momentum. Table 8 presents the results for equation (2) and shows that earnings announcements have a positive effect on the conditional momentum strategy. The conditional momentum is stronger in announcing firms than non-announcing firms, except in small stocks, which is consistent with the theoretical prediction that momentum is driven by an under-reaction to firm-specific news.
The effect of earnings announcements on the return on the conditional momentum strategy.
This table reports the Fama-MacBeth (1973) regression results for equation (2), in which monthly stock returns are regressed on dummy variables that identify whether stocks belong at the intersections of Market Winners/Losers and Industry Neutrals and have earnings announcements. The announcement dummy is 1 if the stock has at least one earnings announcement in the prior month. ‘Whole Market’ represents the results when all of the stocks in the CRIF universe are included. ‘Large’, ‘Medium’ and ‘Small’ represent the results for the three size groups: the top 30% by market capitalisation in the formation month, the middle 40% and the bottom 30%, respectively. The regression coefficients are averaged across 324 trading months in the sample and the associated t-statistics are reported below the coefficient estimates. *, **, *** indicate statistical significance at the 10%, 5% and 1% levels, respectively.
4. Conclusion
The Australian-based literature documents medium-term momentum in large and medium stocks and short-term reversals in small stocks. In this study, we examine the interaction between short-term reversals and short-term momentum. Using portfolio sorting techniques, we are able to investigate short-term reversals that are free from the influence of price momentum and to examine short-term momentum free from the influence of short-term reversals. This investigation leads us to the first Australian evidence of short-term reversals in large stocks in the form of conditional intra-industry reversals: among market neutral stocks, past industry losers outperform past industry winners. The strategy results in a risk-adjusted return of almost 10% per annum for the top 30% stocks by market capitalisation. We also record individual stock momentum and industry momentum over a one-month horizon. We confirm that illiquidity drives short-term reversals, whereas an under-reaction to earnings announcements adds to momentum. Our paper provides further insights into the dynamics of short-term return behaviour in the stock market and yields practical implications for practitioners who wish to implement return-based trading strategies for liquid stocks in Australia.
Footnotes
Acknowledgements
We would like to thank Keith Godfrey, Robert Faff, Howard Chan and participants at the 2013 AFAANZ Conference for helpful comments and suggestions. We are grateful for comments from Karen Benson (associate editor) and an anonymous referee.
Final transcript accepted 8 April 2014 by Karen Benson (AE Finance).
Funding
This research received no specific grant from any funding agency in the public, commercial, or not-for-profit sectors.