
Abstract
We examine announcement effects and the long-run stock performance associated with spin-offs for companies listed on the Australian Securities Exchange. The 3-day announcement effect is a significantly positive 2.93%. Contrary to previous studies, we find no differences between ex post completed and non-completed spin-off announcements. The abnormal returns do not seem to be related to factors found significant in previous studies, such as an increase in industrial or geographical focus, information asymmetry, and the amount of bank debt of the parent company. There is some evidence that Australian spin-offs are associated with a positive long-run excess stock performance for up to 24 months after the spin-off. This effect is mostly driven by focus-increasing spin-offs.
1. Introduction
In a corporate spin-off, a company splits off its subsidiary as a separate business. Existing shareholders of the parent company receive common shares of the company’s subsidiary on a pro rata basis. Thus, a spin-off creates an independent company through the sale or distribution of new shares of an existing division of a parent company. Hite and Owers (1983) suggest that spin-offs, by nature, are the mirror image of mergers. While value creation from mergers arises from positive synergy, spin-offs create value by eliminating dissimilar operating units that have a negative synergy.
There is ample evidence in the academic literature that spin-offs create value for shareholders. This value creation is largely caused by spinning off unrelated or underperforming subsidiaries, allowing the company to increase its focus on the core business in which it has a comparative advantage. Studies by, for example, Desai and Jain (1999), Krishnaswami and Subramaniam (1999), Mulherin and Boone (2000), and Jain et al. (2011) document strongly significant cumulative abnormal returns (CARs) ranging from 3.28% to 4.86% over a 3-day event window for various sample periods in the United States. Veld and Veld-Merkoulova (2004) and Murray (2008) document positive abnormal announcement effects for relatively large samples of European countries and the United Kingdom, respectively. These abnormal returns are mostly in line with those found for the United States in earlier studies. In an overview of studies that document wealth effects associated with spin-offs, Veld and Veld-Merkoulova (2009) point out that research on the spin-off announcement effect is fairly limited and they call for more evidence from markets around the world.
A major obstacle in spin-off research is the fact that spin-offs, compared to other corporate events, are relatively uncommon. Australia is one of the few exceptions to this rule. In Australia, however, spin-offs are relative common, especially among mining companies. A recent example of an Australian spin-off that attracted media attention is the announcement on 1 August 2013 of packaging company Amcor to spin off their Australasian and Packaging Distribution (AAPD) operations. Analysts were very positive about this move, because the parent company (Amcor) and the subsidiary (AAPD) are in unrelated activities. Bank of America Merrill Lynch commented: “There is very little overlap between the two – AAPD does glass, metals, fibre & cartons in Australia, while the rest of the business does flexibles and rigid plastics mostly overseas”. Ausbil Dexia chief executive Paul Xiradis, an Amcor shareholder, also commented, “Here the sum of the parts should be greater than the whole.” 1 Amcor shares closed 1.4% higher after rising more than 5% in early trade. In an article in the Australian Securities Exchange (ASX) Investor Update newsletter, spin-off activities in the Australian market were highlighted and the author suggested that spin-offs could potentially provide good returns based on past results. 2
Academically, Durand et al. (2003) provide the first Australian evidence on the spin-off announcement effect. Their sample covers the period from 1992 to 2000. In this period, spin-offs were not very popular and hence their sample includes only 22 spin-off announcements. Nevertheless, the authors show a significant CAR of 6.9% over a 3-day event window. They suggest that Australian companies undertaking a spin-off to restructure assets created value for shareholders and call for further investigation on whether this increased value is maintained. Other related studies include those of Cooney et al. (2004) and Lal et al. (2013). The former focuses on asset sell-offs and the latter investigates the announcement effect of Australian divestitures. While these studies document significant positive abnormal returns over the announcement of divestitures, they do not include spin-offs.
The purpose of the underlying study is to further examine the wealth effects of spin-offs in Australia using a richer sample covering a more recent period. The period also covers the boom and bust of the global financial crisis, which allows us to examine the announcement effect across different market states. This article not only extends that of Durand et al. (2003), but also provides a comparison with other spin-off studies. Apart from the fact that Australia is one of the few countries that hosts a relatively large amount of spin-offs, the current study is motivated by the uniqueness of the structure of this market and mixed findings in the literature outside Australia.
First, there is a large discussion in the literature on spin-off announcements that focuses on whether spin-offs are associated with wealth transfer between stockholders and bondholders. Given that assets are taken away from the parent company and transferred to a new, independent company, a spin-off has the potential to lead to a loss of collateral for bondholders. Besides that, a focus-increasing spin-off will normally lead to a loss of diversification potential for the parent company. This decrease in diversification is bad news for bondholders, because it reduces the potential for cross-subsidization between divisions that could ultimately lead to a higher chance of default. Parrino (1997) studies the Marriott case and finds that there was substantial wealth transfer involved from bondholders to stockholders. 3 The Australian market is heavily dominated by the banking sector in terms of size. Companies listed in Australia also rely heavily on bank debt, given the size of the debt market in this country. For example, Matic et al. (2012) show that small and medium businesses in Australia rely heavily on bank debt, with more than 75% of debt financing coming from banks. Davis (2011) also shows that bond financing represents only 10% of the corporate liability structure, indicating that Australian companies rely on bank debt rather than bond financing. Generally, banks are more powerful in terms of defending their own rights when an important corporate decision, such as a spin-off, is made. Therefore, there could be a lower possibility of wealth transfer from debtholders to shareholders, leading to a weaker stock price announcement effect. An earlier study by Murray (2008) shows that UK spin-offs are associated with a smaller stock market reaction (1.82%) compared to US spin-offs. The author attributes this difference to the domination of bank debt. Our study will allow this premise to be tested in an out-of-sample setting.
Second, although the previous literature finds a significant announcement effect for corporate spin-offs, the source of the effect remains diverse. Possible sources include an improvement of industrial or geographical focus and a reduction in information asymmetry. Current studies do not find a unified explanation on why a spin-off would create value for shareholders. Some documented factors also seem to be sample specific, which calls for further investigation. 4 In addition, the dominance of the mining sector in Australian spin-offs enables us to gain further insights on the source of the announcement effect.
Finally, this article answers the call of Durand et al. (2003) by examining long-run performance after spin-offs. Even though previous studies agree that spin-offs are associated with positive wealth effects on the announcement date, there is no such consensus on their long-run abnormal stock performance. Studies by Cusatis et al. (1993) and Desai and Jain (1999) find that both the subsidiaries and their parents generate positive abnormal returns for up to 36 months after spin-off announcements in the United States. However, Fama (1998) argues that these studies use the wrong methodology and are therefore not reliable. Follow-up studies by McConnell et al. (2001) for the United States and Veld and Veld-Merkoulova (2004) for Europe use the methodology suggested by Fama (1998) and find very little evidence of positive long-run returns. This study will provide evidence of long-run returns for Australia that will contribute to the debate on whether spin-offs are associated with long-run outperformance.
Consistent with previous studies, we document a significant spin-off announcement effect. The CAR over a 3-day window surrounding the announcement day is 2.93%, significant at the 1% level. We do not find a difference between spin-offs that were later completed and those that were not. This result is different from the findings of Veld and Veld-Merkoulova (2009). They do a meta-analysis of previous spin-off studies and find that incomplete spin-offs are associated with higher abnormal returns than completed spin-offs. Another finding that goes against the previous literature is that focus-increasing Australian spin-offs are not associated with higher abnormal returns than spin-offs that do not increase industrial focus. Our result could be explained by looking at the long-run abnormal returns. We find significant positive long-run abnormal returns for parent companies for up to 12 or 24 months after the spin-off, depending on whether we consider equal- or value-weighted returns. There is weak evidence that these are driven by the focus-increasing spin-offs. Therefore, it is possible that the benefits of a focus increase are only recognized by the market well after the spin-off announcement.
We find average abnormal 3-day returns of 3.63% for mining companies and only 1.55% for companies in other industries, but the difference between the two samples is not significant. Similarly, we find 3-day abnormal returns of 3.66% for the crisis period (2006–2010) and only 2.10% for the non-crisis period but, here also, the difference is not significant. The wealth effects also do not seem to be related to other factors documented in the literature, such as an increase in geographical focus, differences in information asymmetry, and the use of bank debt.
The remainder of this study is organized as follows. Section “Potential sources for the wealth effects from spin-offs” briefly reviews the literature, with a particular emphasis on potential sources for the spin-off announcement effect. Section “Data and methodology” describes data and research design. Section “Results” reports the main findings. Finally, Section “Conclusion” concludes the article.
2. Potential sources for the wealth effects from spin-offs
There are many motives for companies to engage in spin-off activities. This section reviews different explanations for the spin-off announcement effect and establishes our testing ground.
2.1. Refocusing
Among all the wealth creation factors that contribute to the positive abnormal returns around spin-off announcements, the refocusing explanation has received the most support from the literature. Hite and Owers (1983) suggest that a spin-off allows both the parent and the subsidiary to specialize in their own contracts in which they have a comparative advantage. The authors find that parent companies that divest units whose activities do not closely relate to the primary business line are associated with the largest significant excess returns, 14.5%, throughout the entire event period. Moreover, when companies engage in focus-increasing spin-offs, the diversity of assets under management is reduced, leading to an increase in managerial efficiency (Desai and Jain, 1999). Daley et al. (1997) also document that the operational performance of focus-increasing spin-offs is significantly improved after spin-offs. Given this backdrop, we hypothesize that the spin-offs of companies that increase their industrial focus will exhibit higher abnormal returns than the spin-offs of companies that do not increase their industrial focus.
2.2. Information asymmetry
Aron (1991) suggests that the share prices of large companies with multiple products contain very noisy signals about any divisional manager’s productivity. Intuitively, it makes sense that a well-diversified company, which engages in different kinds of businesses, limits the ability of analysts to accurately forecast earnings, since analysts do not have specific knowledge about each division of the company. In this case, information asymmetry problems could arise, leading to a lower valuation. Thus, spinning off subsidiaries could result in less information asymmetry and can therefore lead to a fair valuation of the company. This information asymmetry hypothesis is supported by Krishnaswami and Subramaniam (1999), who find that companies that choose to spin off their subsidiaries have a higher level of information asymmetry compared to their industry- and size-matched counterparts.
In contrast, Huson and MacKinnon (2003) argue that a spin-off could increase information asymmetry. They suggest that if informed traders have insider information on a particular line of business, a well-diversified company might reduce such an advantage, since any informational advantage might be offset by changes in the value of other parts of the company about which informed traders have less information. The authors’ empirical results show that both transaction costs and the price impact of trades are higher after spin-offs. Furthermore, Veld and Veld-Merkoulova (2004) find that information asymmetry, proxied by the normalized standard deviation of analyst forecasts, does not play a significant role in explaining the abnormal returns of spin-off announcements. In this article, we test the hypothesis that the announcement effect of spin-offs is stronger for companies with a higher level of information asymmetry.
2.3. Geographical focus
By spinning off a foreign subsidiary, companies can increase their geographical focus. For example, in the case of the Amcor spin-off mentioned earlier, this argument played a role, as Ken MacKenzie, CEO of Amcor stated: “Although Amcor and AAPD are both packaging companies they are actually very different in terms of product segments and geographic focus.” 5 However, the literature does not provide a unified answer on whether companies that increase their geographical focus would result in an increase or decrease in firm value. It is possible to expect a negative impact, because a parent company spinning off its subsidiary overseas could lead to reduced economies of scale in production and may be at a relative disadvantage with respect to their competitors that operate internationally (Veld and Veld-Merkoulova, 2004). In contrast, some theories suggest that increased geographical focus could lead to an increase in firm value. The argument is based on the fact that multinational companies are more complex than domestic companies, and the agency problem of conflicts between managers and shareholders could be relatively higher for these companies. Denis et al. (2002) suggest that benefits of global diversification could arise from investors’ diversification preferences. Investors who want to diversify their investments are likely to pay a premium for globally well-diversified companies. Moreover, Bodnar et al. (1997) also suggest that an increase in geographical focus would result in an increase of value because it allows companies to arbitrage institutional restrictions such as tax codes and financial restrictions. Given the arguments presented above, the relation between geographical focus and the spin-off announcement effect is an empirical question.
2.4. Other variables
In addition to the factors discussed above, the literature documents other firm characteristics that may be associated with abnormal returns around spin-off announcements. A spin-off could result in wealth transfer from bondholders to shareholders, since bondholders could suffer a loss of collateral if a company transfers a disproportionate amount of debt to the new company. This explanation is known as the wealth expropriation hypothesis. However, empirical support of wealth transfer is mixed. Hite and Owers (1983) and Schipper and Smith (1983) find no evidence that the spin-off announcement effect is due to wealth transfer. In contrast, Maxwell and Rao (2003) and Veld and Veld-Merkoulova (2008) find some support for the wealth transfer hypothesis. In a similar vein, Murray (2008) suggests that if a company relies heavily on bank loans, its creditors will be in a strong position to protect themselves from any wealth transfer to shareholders, as in the case of spin-offs. Given this possible wealth transfer explanation, we test whether the announcement effect of spin-offs is weaker for companies with a higher proportion of bank debt.
Spin-offs also include tax and regulatory motives and merger and takeover motives. Copeland et al. (1987) and Schipper and Smith (1983) contend that a company may undertake a spin-off to optimize its tax structure, tax, and regulatory constraints, thus providing incentives for companies to spin off subsidiaries. However, Schipper and Smith (1983) also contend that this benefit by itself cannot fully explain shareholders’ gain from spin-offs. Unlike spin-offs in the US market, spin-offs in Australia do not create a tax problem. In contrast, tax relief has been applied to company demergers or spin-offs since 1 July 2002. However, the relief is only provided if the spin-off results in continuity of the underlying ownership of the demerged entity. The demerging entity must divest at least 80% of its ownership interests in the demerged entity. Therefore, capital gains and income tax relief for demergers will apply at both the shareholder and entity levels.
A parent company may decide to spin off a subsidiary if a potential acquirer is targeting the company’s specific assets; hence, spinning off the subsidiary makes the targeted asset easier to be acquired. Cusatis et al. (1993) suggest that spin-offs may generate wealth for shareholders by facilitating mergers of assets to higher-valued uses. This suggestion of the authors is confirmed by their finding that spin-offs are associated with positive long-run abnormal performance. In this article, we do not examine the merger and takeover factor due to data limitations. 6
3. Data and methodology
3.1. Data
The spin-offs included in our study are all subsidiaries spun off by an Australian parent company, whether the subsidiary is located inside or outside Australia. The sample period is from January 1999 to December 2013. The data are gathered from various sources. To measure the announcement effect of spin-offs, daily stock return information is obtained from the Securities Industry Research Centre of Asia-Pacific (SIRCA) database. To measure long-run performance, we obtain monthly stock returns from the Share Price & Price Relatives (SPPR) database managed by SIRCA. Accounting information used to proxy for bank loans is obtained from the Morningstar Aspect Huntley database. Spin-off announcement data, such as announcement dates and their Standard Industrial Classification (SIC) codes, are obtained from the Thomson Reuters SDC Platinum Mergers & Acquisitions database. We manually check each announcement and clean up the sample by excluding announcements that are contaminated by other important financial news. 7 We also exclude companies that have less than 1 year of data. 8 After this clean-up, we are left with 103 observations.
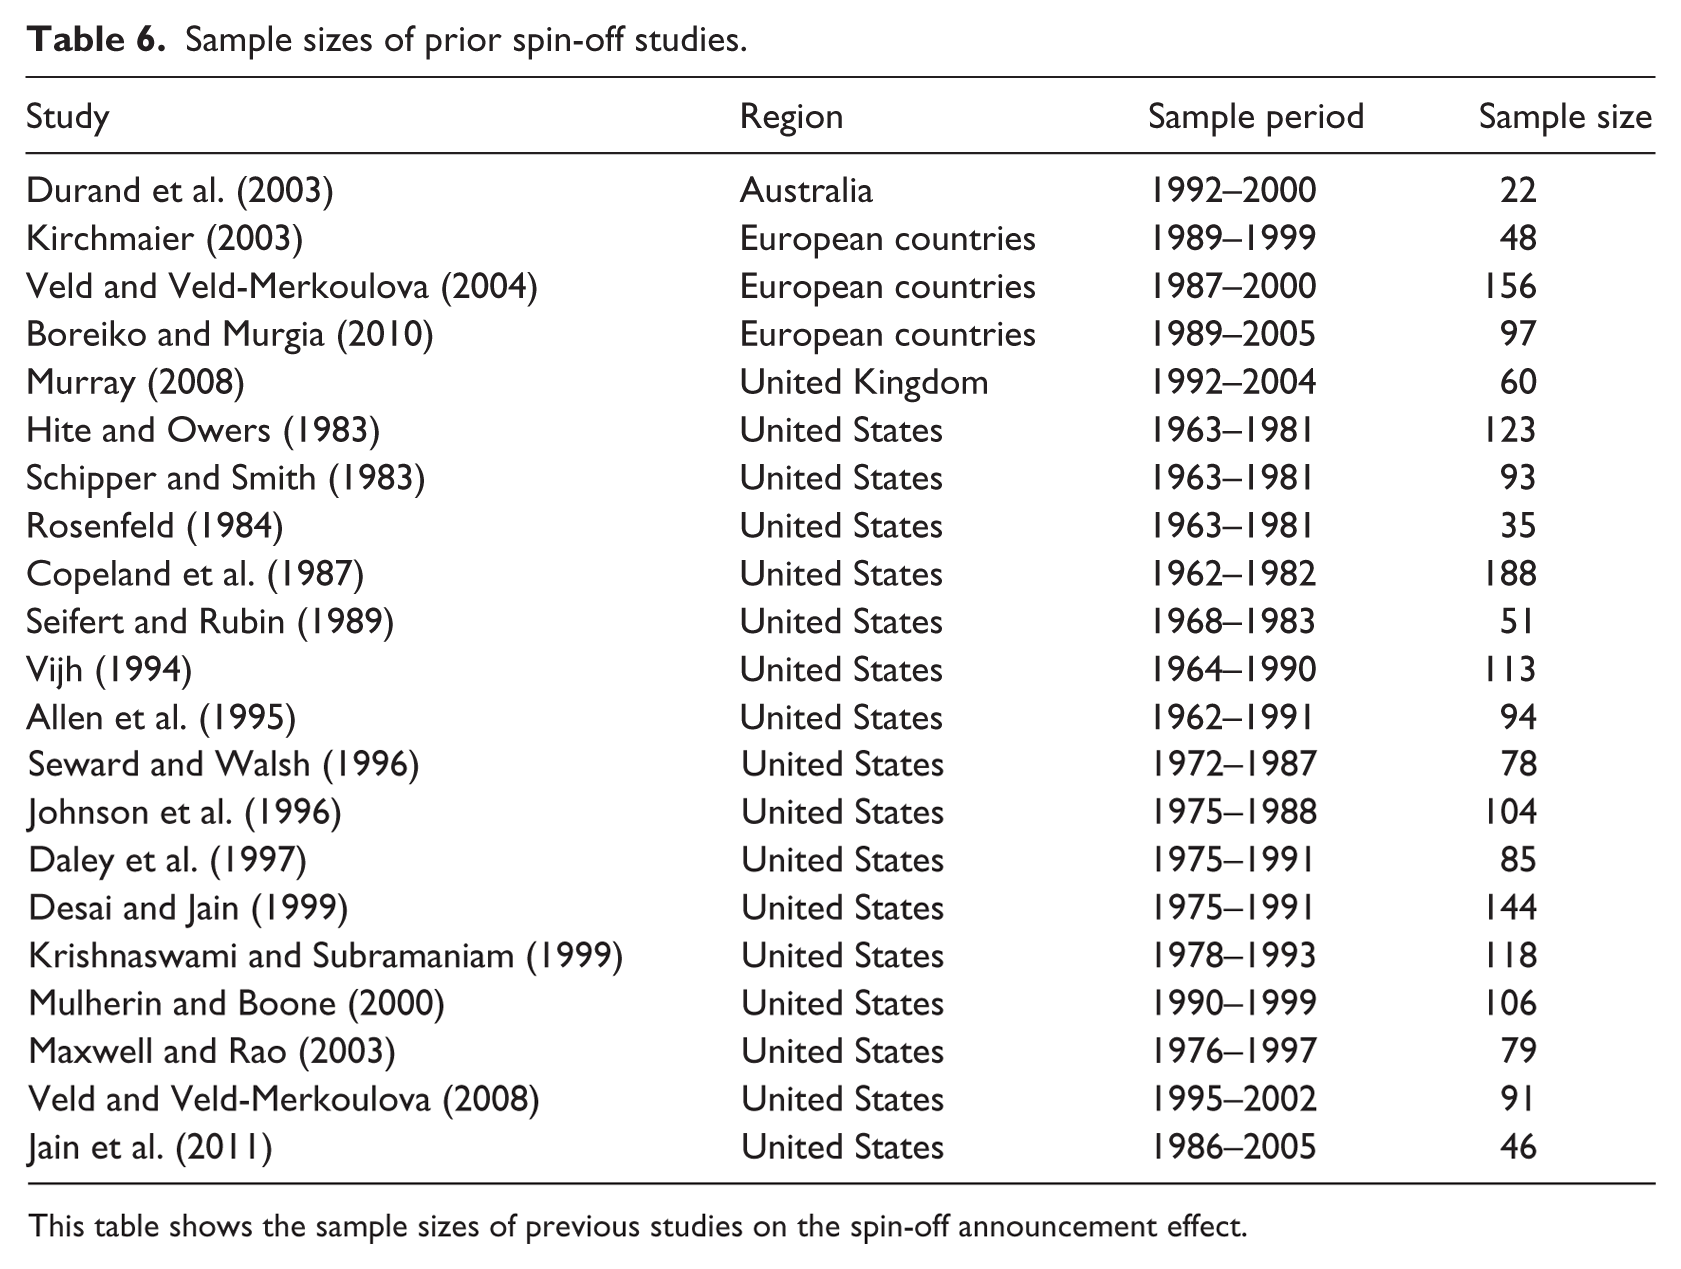
Thin trading is an important issue that researchers must handle with caution in calculating stock returns. It is well known that small stocks in the Australian market have severe non-trading problems. This issue is less of a concern for our sample because most companies that engage in spin-offs are large. For a better idea of the potential non-trading issue, we calculate the frequency of non-trading 1 year prior to the spin-off announcement date. This result shows an average of 40 non-trading days within the 242-day estimation period that ranges from 11 to 252 days prior to the announcement date. Hence, our sample is made up of actively traded stocks rather than illiquid stocks. Nevertheless, to eliminate potential outliers, we apply a filtering rule to the sample; that is, stocks must have at least a 50% trading frequency within the 242-day estimation period to be included. This filtering rule eliminates 16 observations. Of these 16 stocks, 10 have missing returns more than 200 days within the estimation period, suggesting that these stocks are extremely illiquid. Although previous studies do not apply such a rule to their samples, without such a filtering rule, our sample would contain some extremely illiquid stocks. Estimating market model parameters based on such illiquid stocks tends to bias the result. Our final sample contains 87 spin-off announcements from 1999 to 2013. 9 Table 6 in Appendix 1 summarizes the sample in prior spin-off studies conducted in the United States and Europe. Note that the sample sizes in previous spin-off studies are also relatively small, ranging from 35 to 188 in the US market and from 48 to 156 for European countries. Therefore, our sample is comparable to those of prior studies.
3.2. Methodology
3.2.1. Event study methodology
The announcement effect of spin-offs is measured using an event study methodology, as in prior studies (e.g. Hite and Owers, 1983; Veld and Veld-Merkoulova, 2004). The method involves using a market model to compute expected returns. We obtain a value-weighted market index from SIRCA. 10 The announcement date is denoted as day 0; the estimation period ranges from day −252 to day −11. The event window ranges from day −10 to day +10.
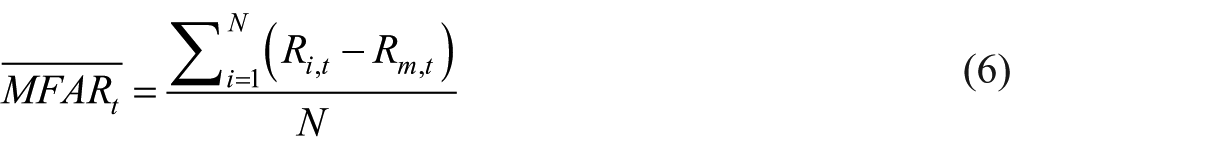
For security i, the abnormal return during the event window t is defined as ARi,t (abnormal return). The abnormal return is computed as

where Ri,t is the rate of return for security i on day t, Rm, t is the rate of return of the market index on event day t, and βi,ac and αi,ac are the market model parameters estimated from the market model over the estimation period. To address the non-synchronous issue, we use Dimson’s (1979) aggregate beta with three lead and three lag estimates. 11 We calculate the CARs over various event window intervals: [−10, −1], [–1, 0], [0], [0, 1], [–1, 1], and [1, 10].
Since the sample sizes in spin-off studies are small, it is likely that the CARs are not normally distributed. Accordingly, to test the significance of the abnormal returns, this article uses the non-parametric rank test proposed by Corrado (1989) and later refined by Corrado and Zivney (1992). This test is advocated by Corrado and Truong (2008), who find it to perform the best among all parametric and non-parametric tests commonly used in event studies in Asia-Pacific security data, including those in Australia. The rank test is computed as follows.
Let Kit denotes the rank of excess return Ait in security i’s estimation and event period. In our case, the entire period includes 263 observations

where day −252 to day −11 is the estimation period and the entire event period starts from day −10 to day +10. To allow for missing returns due to non-trading, Corrado and Zivney (1992) standardize the ranks by dividing by one plus the number of non-missing returns in each company’s excess return time series
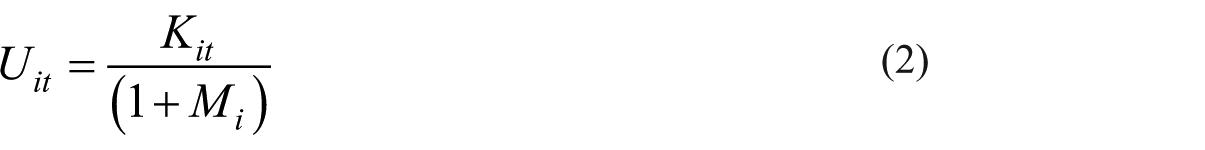
where Mi is the number of non-missing excess returns for security i over the entire period. Corrado and Zivney (1992) suggest that this yields order statistics for the uniform distribution with a mean expected value of one half. The test statistic for day t is computed as
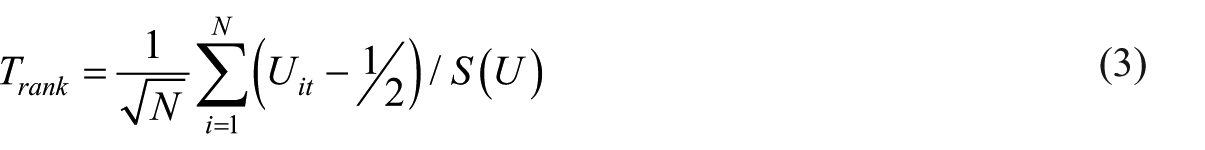
where
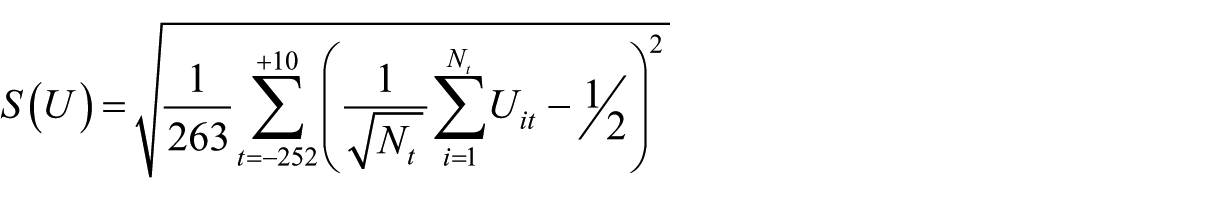
with Nt representing the number of non-missing returns in a cross section of N companies on day t. Hence, the test statistic for the CARs during a t-day interval is given by
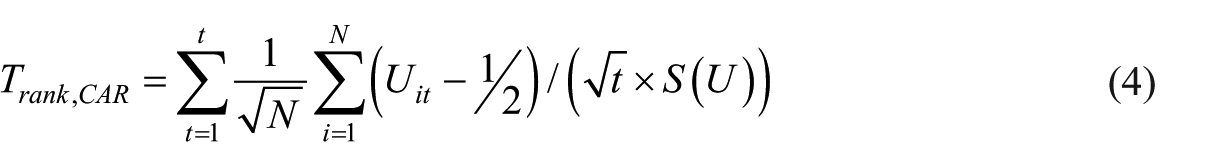
where t represents the number of days in the interval to compute the CARs.
In addition to the rank test, we report conventional t-statistics for the purpose of comparison.
3.2.2. Measuring long-run performance
To measure the long-run performance of parent companies after spin-offs, we use the commonly accepted control-firm approach proposed by Barber and Lyon (1997). Specifically, for each company in our sample, we look through all the ASX-listed stocks and choose five companies to match with each sample company. These five matching companies must have the closest market capitalization to the sample company, as well as the same industry classification as provided by the SPPR database. Next, we rank these five matching companies based on the absolute difference of the value of market capitalization between the matching company and the sample company. Therefore, the first matching company has the closest market cap to the sample company and so on. In terms of measuring long-run excess returns, we compute the difference between the buy-and-hold return of the sample company and that of the closest matching company. If there is a missing return for the first matching company, the second closest matching company will be used and so on. If the sample company was not traded or was delisted, we assume that the proceeds were invested in the matching company. Following prior studies, we examine long-run performance 6, 12, 24, and 36 months after the spin-off. 12
For each parent company, we compute its buy-and-hold return as
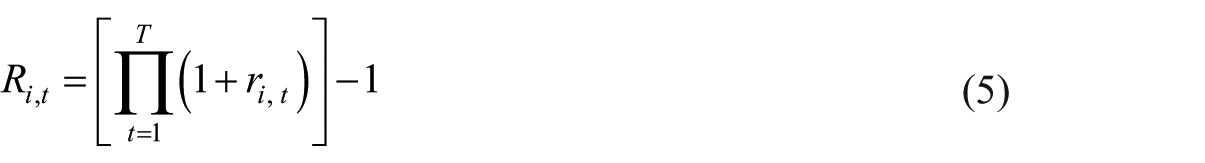
where
where
Conventional t-statistics used to measure the significance of long-run buy-and-hold abnormal returns assume that the buy-and-hold abnormal returns of the event company are independent (Fama, 1998). However, this condition may not be fulfilled for spin-offs. Lyon et al. (1999) recognize this problem and present a method to adjust the t-statistics for overlapping samples
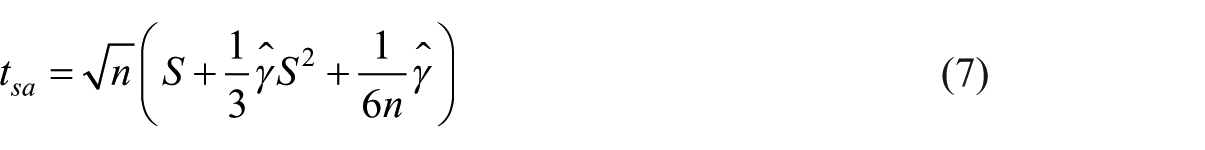
with
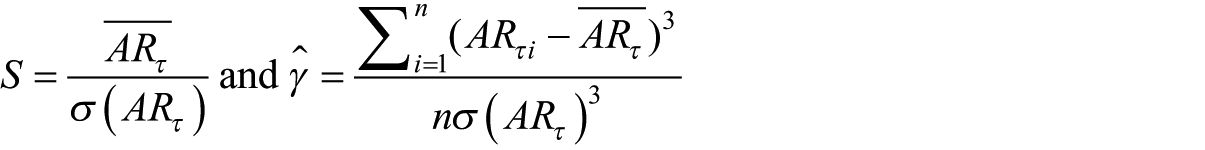
where
4. Results
4.1. Sample statistics
Table 1 presents the frequency distribution of spin-off announcements during our sample period. Panel A of Table 1 shows the number of spin-off announcements per year. Spin-offs were not very popular in the early 2000s. The majority of spin-offs were announced during the second half of our sample period. Spin-off activity especially took place in 2007 and 2010, just before and after the global financial crisis period. Panel B shows the distribution of spin-off announcements across industries. The industries are classified using their primary two-digit SIC codes. From Panel B, we can see that the mining industry dominates in spin-off activities. Almost 67% of the spin-offs during our sample period were announced by mining companies. The subsidiaries being spun off are also highly concentrated in the mining sector. This finding is not surprising, given the fact that the Australian economy is strongly dominated by the mining sector in terms of number of companies. The concentration of spin-off activities in the mining sector highlights the difference between Australia and other international markets.
Frequency of spin-off announcements by Australian companies.
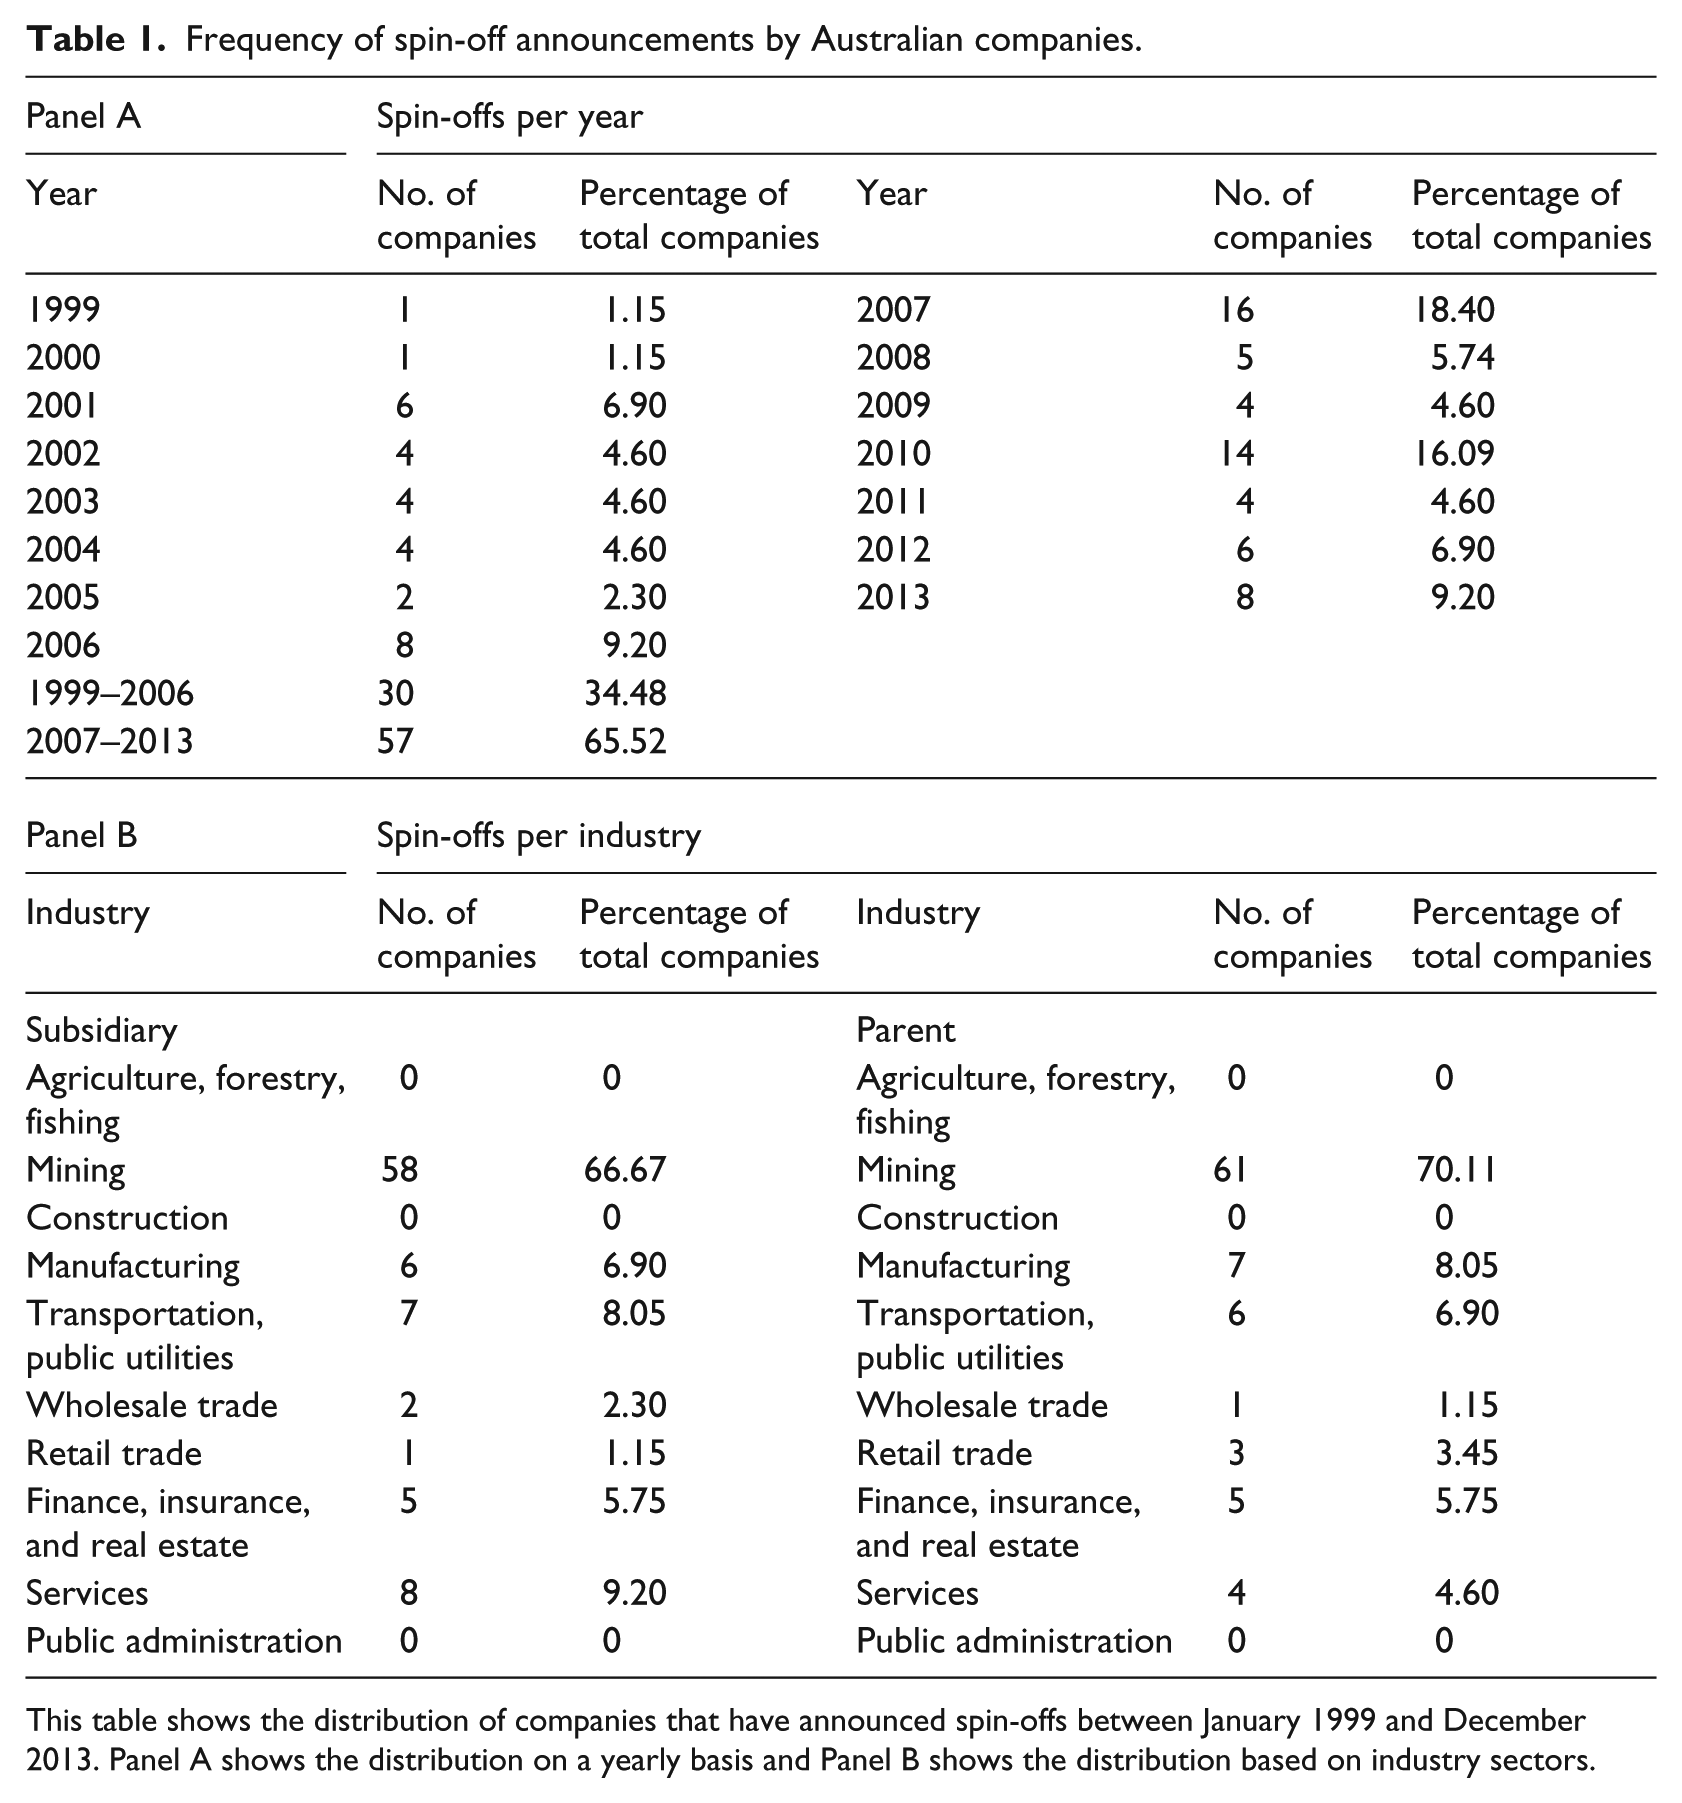
This table shows the distribution of companies that have announced spin-offs between January 1999 and December 2013. Panel A shows the distribution on a yearly basis and Panel B shows the distribution based on industry sectors.
4.2. Returns around spin-off announcements
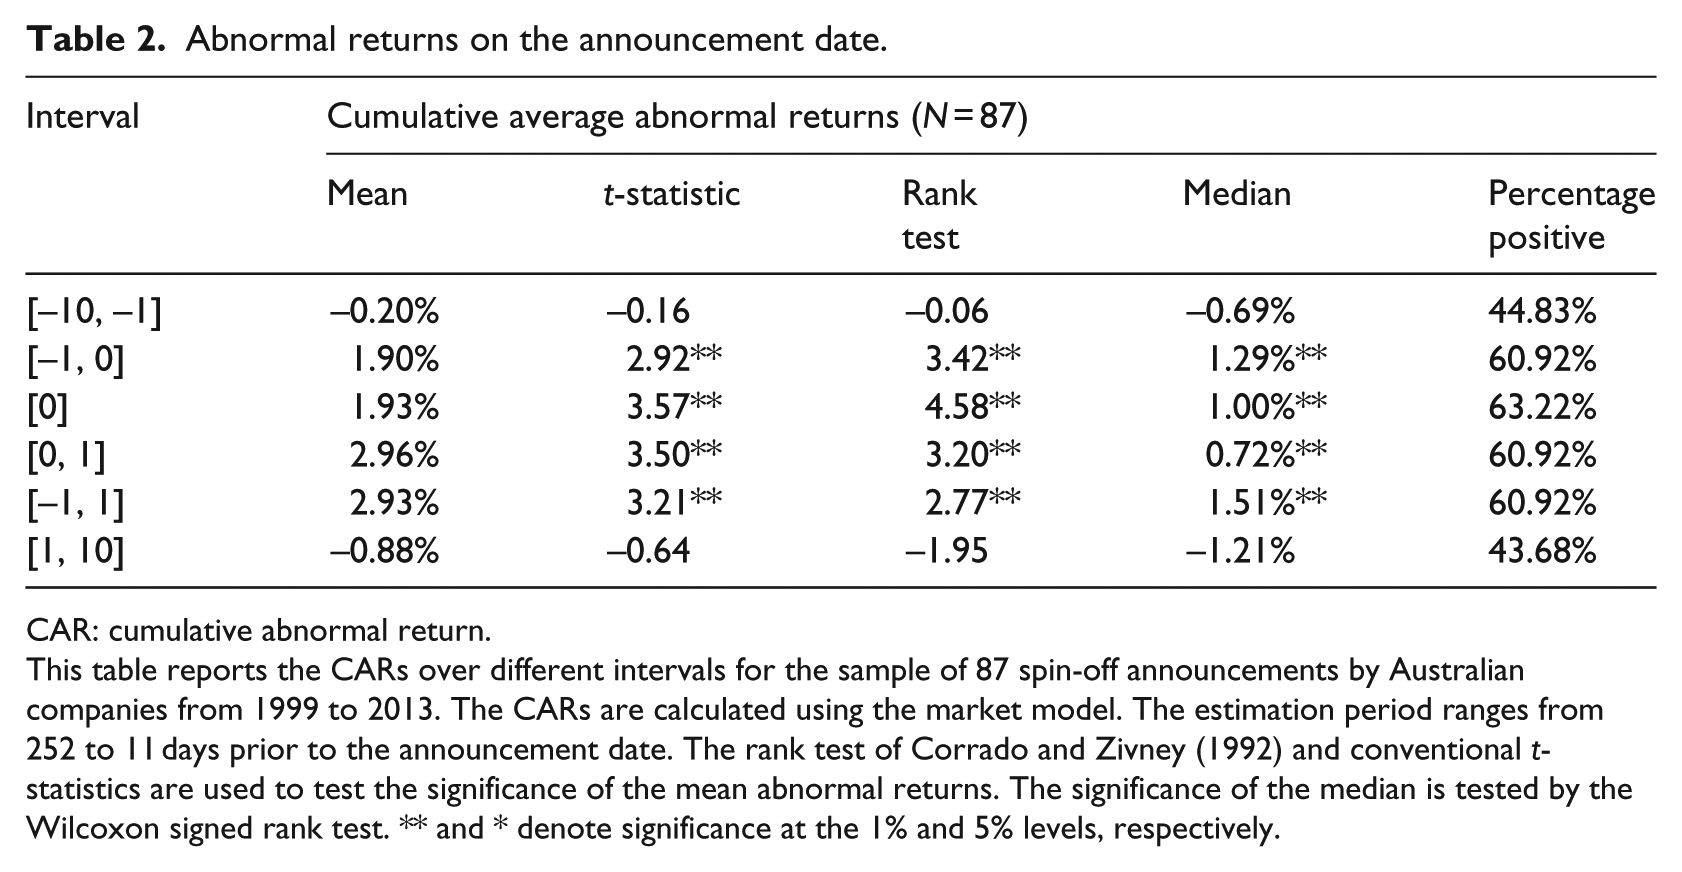
The CARs for different event intervals surrounding the spin-off announcements are reported in Table 2. The results show a strong spin-off announcement effect in Australia. The 3-day interval [–1, 1] is associated with an average CAR of 2.93% that is statistically significant at the 1% level. The return on announcement day [0] generates a significant and positive return of 1.93%. Consistent with prior studies, significant abnormal returns are observed over short windows around announcements. There is no significant announcement effect for longer event intervals, such as 10 days prior to or after the announcement. The sizes of the abnormal returns during the announcement period are similar to those reported in the United Kingdom (e.g. Murray, 2008; Veld and Veld-Merkoulova, 2004) but lower than for most US studies.
Abnormal returns on the announcement date.
CAR: cumulative abnormal return.
This table reports the CARs over different intervals for the sample of 87 spin-off announcements by Australian companies from 1999 to 2013. The CARs are calculated using the market model. The estimation period ranges from 252 to 11 days prior to the announcement date. The rank test of Corrado and Zivney (1992) and conventional t-statistics are used to test the significance of the mean abnormal returns. The significance of the median is tested by the Wilcoxon signed rank test. ** and * denote significance at the 1% and 5% levels, respectively.
One of the purposes of this study is to examine whether spin-offs are associated with wealth generation for shareholders. Hence, a closer look at spin-offs that are later completed will provide insightful information about their value creation. We define complete spin-offs as those that have an effective date provided by the SDC. The observation is treated as a non-complete spin-off if such information is missing or an exact withdrawal date was recorded by the SDC.
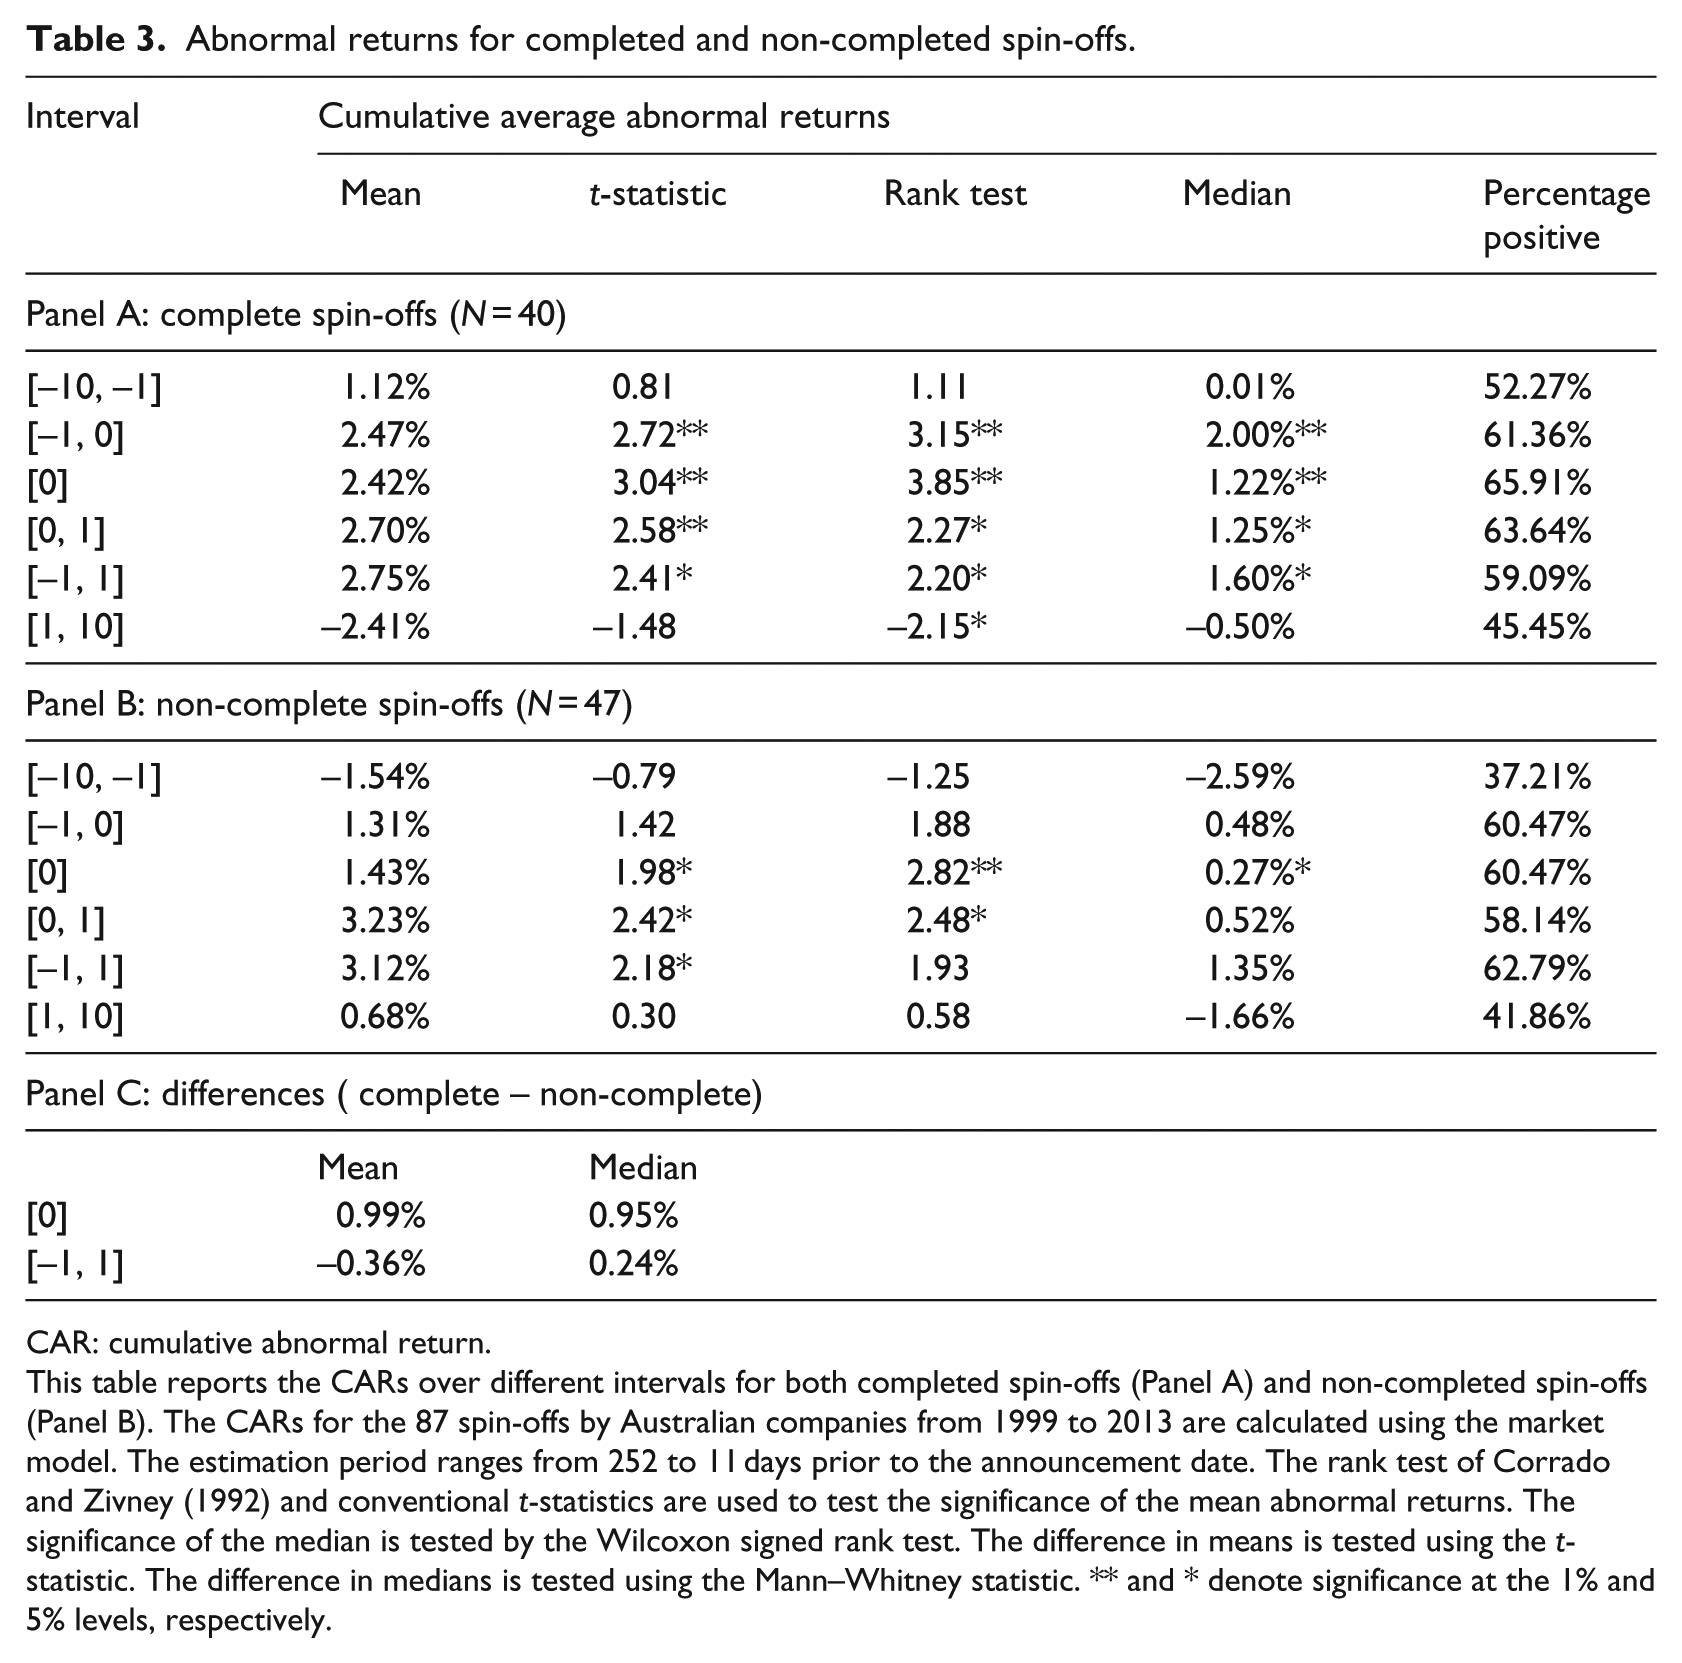
Table 3 provides the results for spin-offs that were later completed and spin-offs that were withdrawn and non-complete. Within the entire sample of 87 spin-off announcements, 40 observations are classified as complete spin-offs and 47 observations do not have a completion date or were later withdrawn. Both subsamples show significant abnormal returns around the spin-off announcement dates. The significant announcement effect for the subsequently non-completed spin-offs is 3.12% for the event window [–1, 1]. This result is remarkable, since these spin-offs were subsequently either officially withdrawn or are still “hanging.” 13 In their meta-analysis based on previously published spin-off papers, Veld and Veld-Merkoulova (2009) find that non-completed spin-offs are associated with significantly higher abnormal returns than completed spin-offs are. As a possible reason for this outcome, they suggest that spin-offs that are later withdrawn are less expected by the market. Hence, a stronger market reaction could take place to reflect a higher information content provided by these spin-offs. A test of the difference between the completed and non-completed spin-offs does not show any degree of significance for our sample. Therefore, we cannot draw the conclusion that non-complete spin-offs are associated with higher abnormal returns than spin-offs that are later completed. Overall, the results in Tables 2 and 3 suggest that spin-offs in Australia, whether complete or non-complete, are associated with significant wealth increases for shareholders in the days surrounding announcements.
Abnormal returns for completed and non-completed spin-offs.
CAR: cumulative abnormal return.
This table reports the CARs over different intervals for both completed spin-offs (Panel A) and non-completed spin-offs (Panel B). The CARs for the 87 spin-offs by Australian companies from 1999 to 2013 are calculated using the market model. The estimation period ranges from 252 to 11 days prior to the announcement date. The rank test of Corrado and Zivney (1992) and conventional t-statistics are used to test the significance of the mean abnormal returns. The significance of the median is tested by the Wilcoxon signed rank test. The difference in means is tested using the t-statistic. The difference in medians is tested using the Mann–Whitney statistic. ** and * denote significance at the 1% and 5% levels, respectively.
4.3. Sources of the spin-off announcement effect
Having established evidence of the spin-off announcement effect, in this section, we now examine possible sources explaining the effect in Australia. We focus on (1) industrial focus, (2) geographical focus, (3) information asymmetry, and (4) total debt levels. In addition to these factors identified in the literature, we consider (5) the mining industry and (6) market states as possible explanatory factors. The former is motivated by the large numbers of spin-off activities identified in the mining sector and the latter is motivated by the fact that our sample period covers the global financial crisis and there were relatively large numbers of spin-offs in 2007 and 2010. For brevity, we compare and report the 3-day CARs between samples split by each factor.
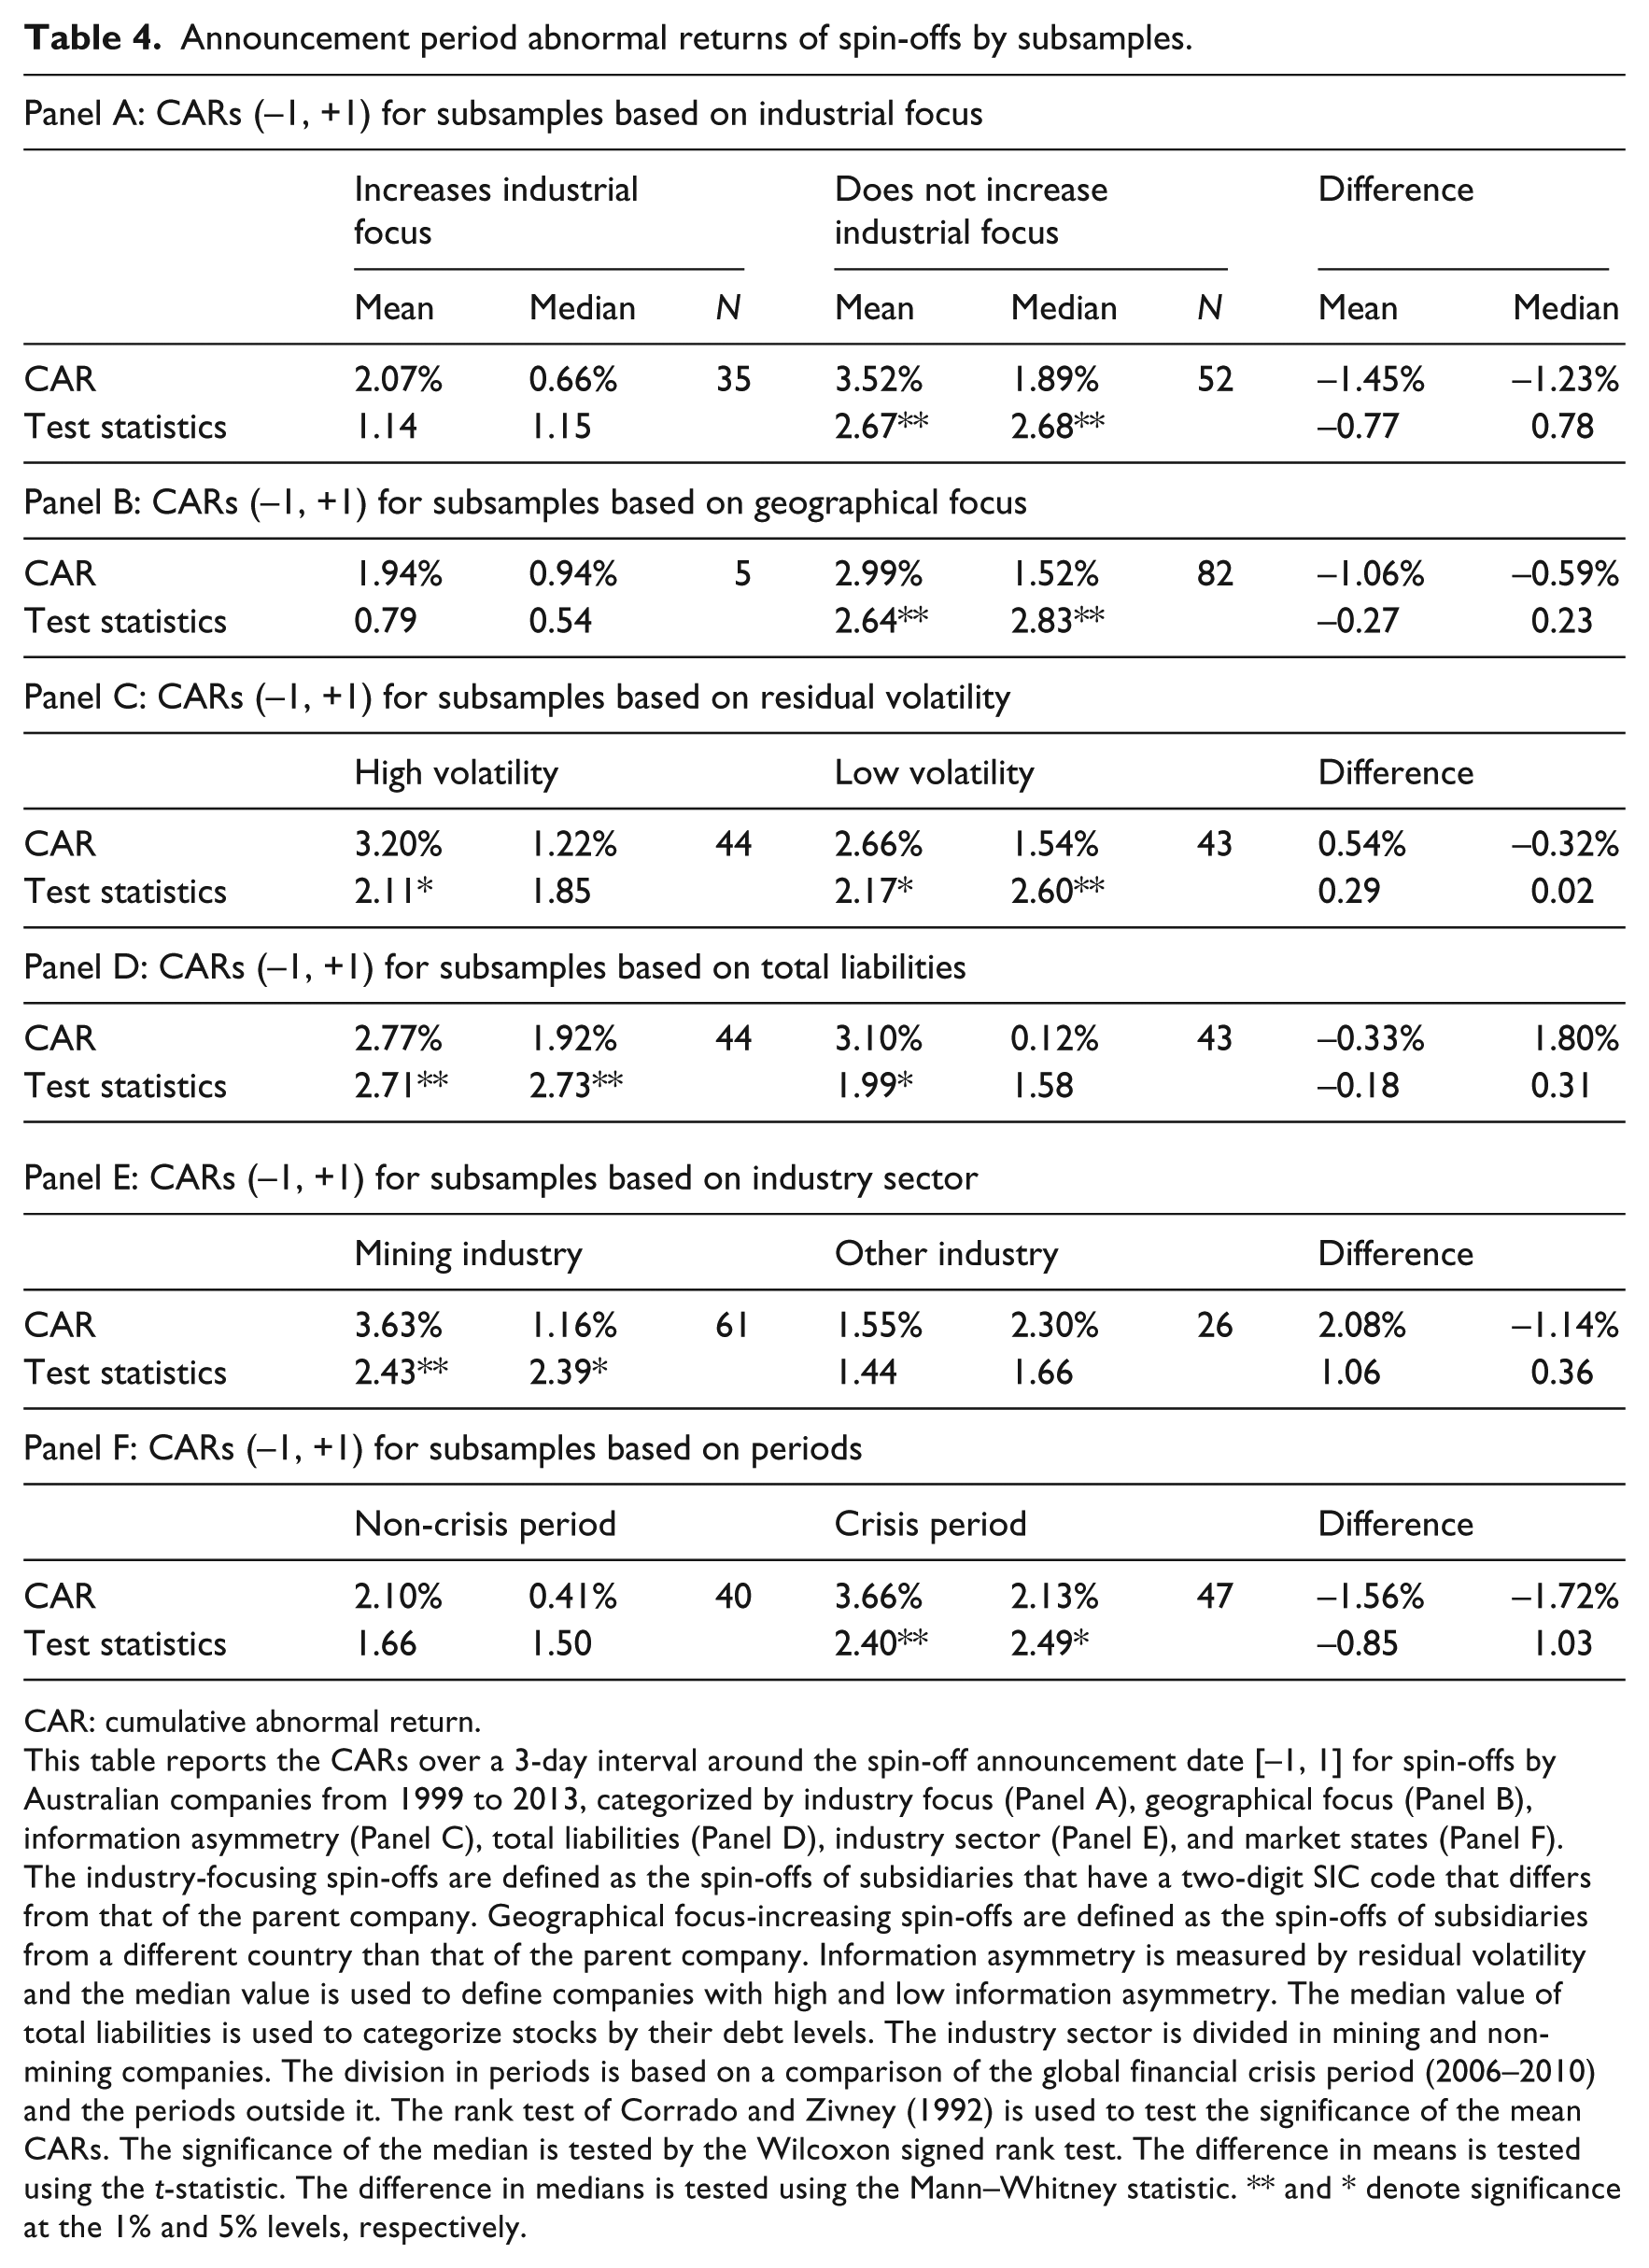
Panel A of Table 4 reports the results for spin-offs categorized by whether they led to an increase of industrial focus. Industry-focusing spin-offs are defined as the spin-offs of subsidiaries that have a two-digit SIC code that differs from that of the parent company. In our sample, there are 35 focus-increasing spin-offs and 52 non-focus-increasing spin-offs. The mean and median of the 3-day CARs are highly significant at the 1% level for the non-focus-increasing spin-offs. The focus-increasing spin-offs also show a positive return (2.07%), but it is not significantly different from zero. The differences in both the mean and median between the two subsamples are also not statistically significant. Therefore, we cannot conclude that non-focus-increasing spin-offs are associated with higher abnormal returns compared to focus-increasing spin-offs. These findings are in contrast to the “back to basics” motive for spin-offs. A possible reason for this result can be that focus-increasing spin-offs underperform because parent companies do not manage to convey that the purpose of the demerger is to improve operating efficiency rather than to signal the standalone value of a business entity.
Announcement period abnormal returns of spin-offs by subsamples.
CAR: cumulative abnormal return.
This table reports the CARs over a 3-day interval around the spin-off announcement date [–1, 1] for spin-offs by Australian companies from 1999 to 2013, categorized by industry focus (Panel A), geographical focus (Panel B), information asymmetry (Panel C), total liabilities (Panel D), industry sector (Panel E), and market states (Panel F). The industry-focusing spin-offs are defined as the spin-offs of subsidiaries that have a two-digit SIC code that differs from that of the parent company. Geographical focus-increasing spin-offs are defined as the spin-offs of subsidiaries from a different country than that of the parent company. Information asymmetry is measured by residual volatility and the median value is used to define companies with high and low information asymmetry. The median value of total liabilities is used to categorize stocks by their debt levels. The industry sector is divided in mining and non-mining companies. The division in periods is based on a comparison of the global financial crisis period (2006–2010) and the periods outside it. The rank test of Corrado and Zivney (1992) is used to test the significance of the mean CARs. The significance of the median is tested by the Wilcoxon signed rank test. The difference in means is tested using the t-statistic. The difference in medians is tested using the Mann–Whitney statistic. ** and * denote significance at the 1% and 5% levels, respectively.
Desai and Jain (1999) specifically analyze non-focus-increasing spin-offs, since the previous literature does not explain why companies engage in such spin-offs. Based on their analysis, they conclude that companies are likely to spin off related units to separate underperforming subsidiaries. If spinning off underperforming units is viewed by investors in Australia as a positive signal about the future performance of the parent company, non-focus-increasing spin-offs would be associated with higher abnormal returns.
Panel B of Table 4 compares spin-offs that do and do not increase geographical focus. Only spin-offs that do not result in an increase in geographical focus are associated with a significant 3-day CAR. However, the difference between the two samples is not statistically significant. In this context, it is important to note that only five spin-offs in our sample are classified as geographical focus-increasing spin-offs. Thus, caution is needed when interpreting these results.
In Panel C of Table 4, we divide the sample companies based on their level of information asymmetry. Previous studies use both residual return volatility and data based on analyst forecast errors and the number of analysts covering the stock as proxies for information asymmetry (e.g. Krishnaswami and Subramaniam, 1999; Veld and Veld-Merkoulova, 2004). Unfortunately, many Australian companies are not covered by analysts and some companies have only one analyst forecast. Therefore, due to data limitations, we use the residual return volatility as a proxy for information asymmetry. 14 Residual return volatility is a widely used proxy for information asymmetry (e.g. Bhagat et al., 1985; Krishnaswami and Subramaniam, 1999). Krishnaswami and Subramaniam (1999) argue that the residual volatility in a company’s stock returns captures the information asymmetry between investors and managers in firm-specific information. Information asymmetry is high when managers have a large amount of price-sensitive or value-relevant information that is not shared by the market. We follow Krishnaswami and Subramaniam (1999) and compute the residual return volatility for a company as the standard deviation of its market-adjusted daily stock returns in the year prior to the spin-off announcement. We then split the sample into equal numbers of companies based on their residual return volatility. 15
Spin-offs from companies with high information asymmetry generate an average 3-day CAR of 3.20%, significant at the 5% level. The counterpart generates a mean return of 2.66%, also significant at the 5% level. The difference is not statistically significant. Therefore, it seems that differences in announcement date effects are not related to differences in information asymmetry.
In Panel D of Table 4, we assess whether total liabilities, as a proxy for the amount of bank debt, is able to explain differences in announcement effects. Ideally, bank loan data are a more suitable proxy for bank debt. Other proxies, such as interest-bearing liabilities and interest expenses, could also capture the level of bank debt. Although these data are available, coverage is very limited. For example, only 23 companies have relevant bank loan data in our sample. Moreover, since the debt market in Australia is very small, most companies borrow from banks. Given this fact and considering the sample size, we use total liabilities as a proxy for bank debt. The results in Panel D show that companies with a high level of liabilities generate a 3-day CAR of 2.77%, significant at the 1% level. For the low-liabilities group, we find a 3-day CAR of 3.10%, significant at the 5% level. The difference between the two groups is not statistically significant.
Panel E of Table 4 displays the results when the sample stocks are grouped into mining and non-mining industries. We find a 3-day abnormal return of 3.63% for mining stocks and only 1.55% for stocks from other industries. However, the difference between the two subsamples is not statistically significant. A similar pattern applies to the results between the crisis period (2006–2010) and the period outside the crisis (1999–2005 and 2011–2013). These results are reported in Panel F. The 3-day period abnormal return for the crisis period is a significant 3.66% (at the 1% level) and the same period abnormal return for the non-crisis period is a non-significant 2.10%. Again, the difference between the two samples is not statistically significant. Therefore, we are unable to conclude that our results are driven by the high concentration of mining companies or by the global financial crisis.
We also run a multivariate analysis of the announcement period abnormal returns on all six factors that we consider in Table 4. We find that none of the variables is significant at a level of 5% or higher. 16
4.4. Long-run stock performance after spin-offs
In this section, we test the long-run performance of parent companies after spin-offs. For this purpose, we restrict the sample to spin-offs that were later completed. We also divide the sample into focus-increasing and non-focus-increasing spin-offs, since our goal is to study whether spin-offs improve companies’ operational performance. This restriction results in a small sample of 40 companies. 17
We also need to control for the fact that some companies announced more than one spin-off in our sample period. This is not a problem for our event study results, but it may be a problem for our long-run abnormal returns, because over- or underperformance of the parent company could then be counted twice or even three times. For example, BHP Billiton appears twice in our sample, with event dates 25 February 2000 and 19 March 2001. 18 Given that the two spin-off announcements are 1 year apart, the 24- and 36-month returns of the first announcement overlap with the 6-, 12-, and 24-month returns of the second spin-off. Accordingly, we remove the 24- and 36-month returns for the first spin-off and rerun the analysis. We apply the same treatment for similar cases.
Long-run performance of parent companies after spin-offs.
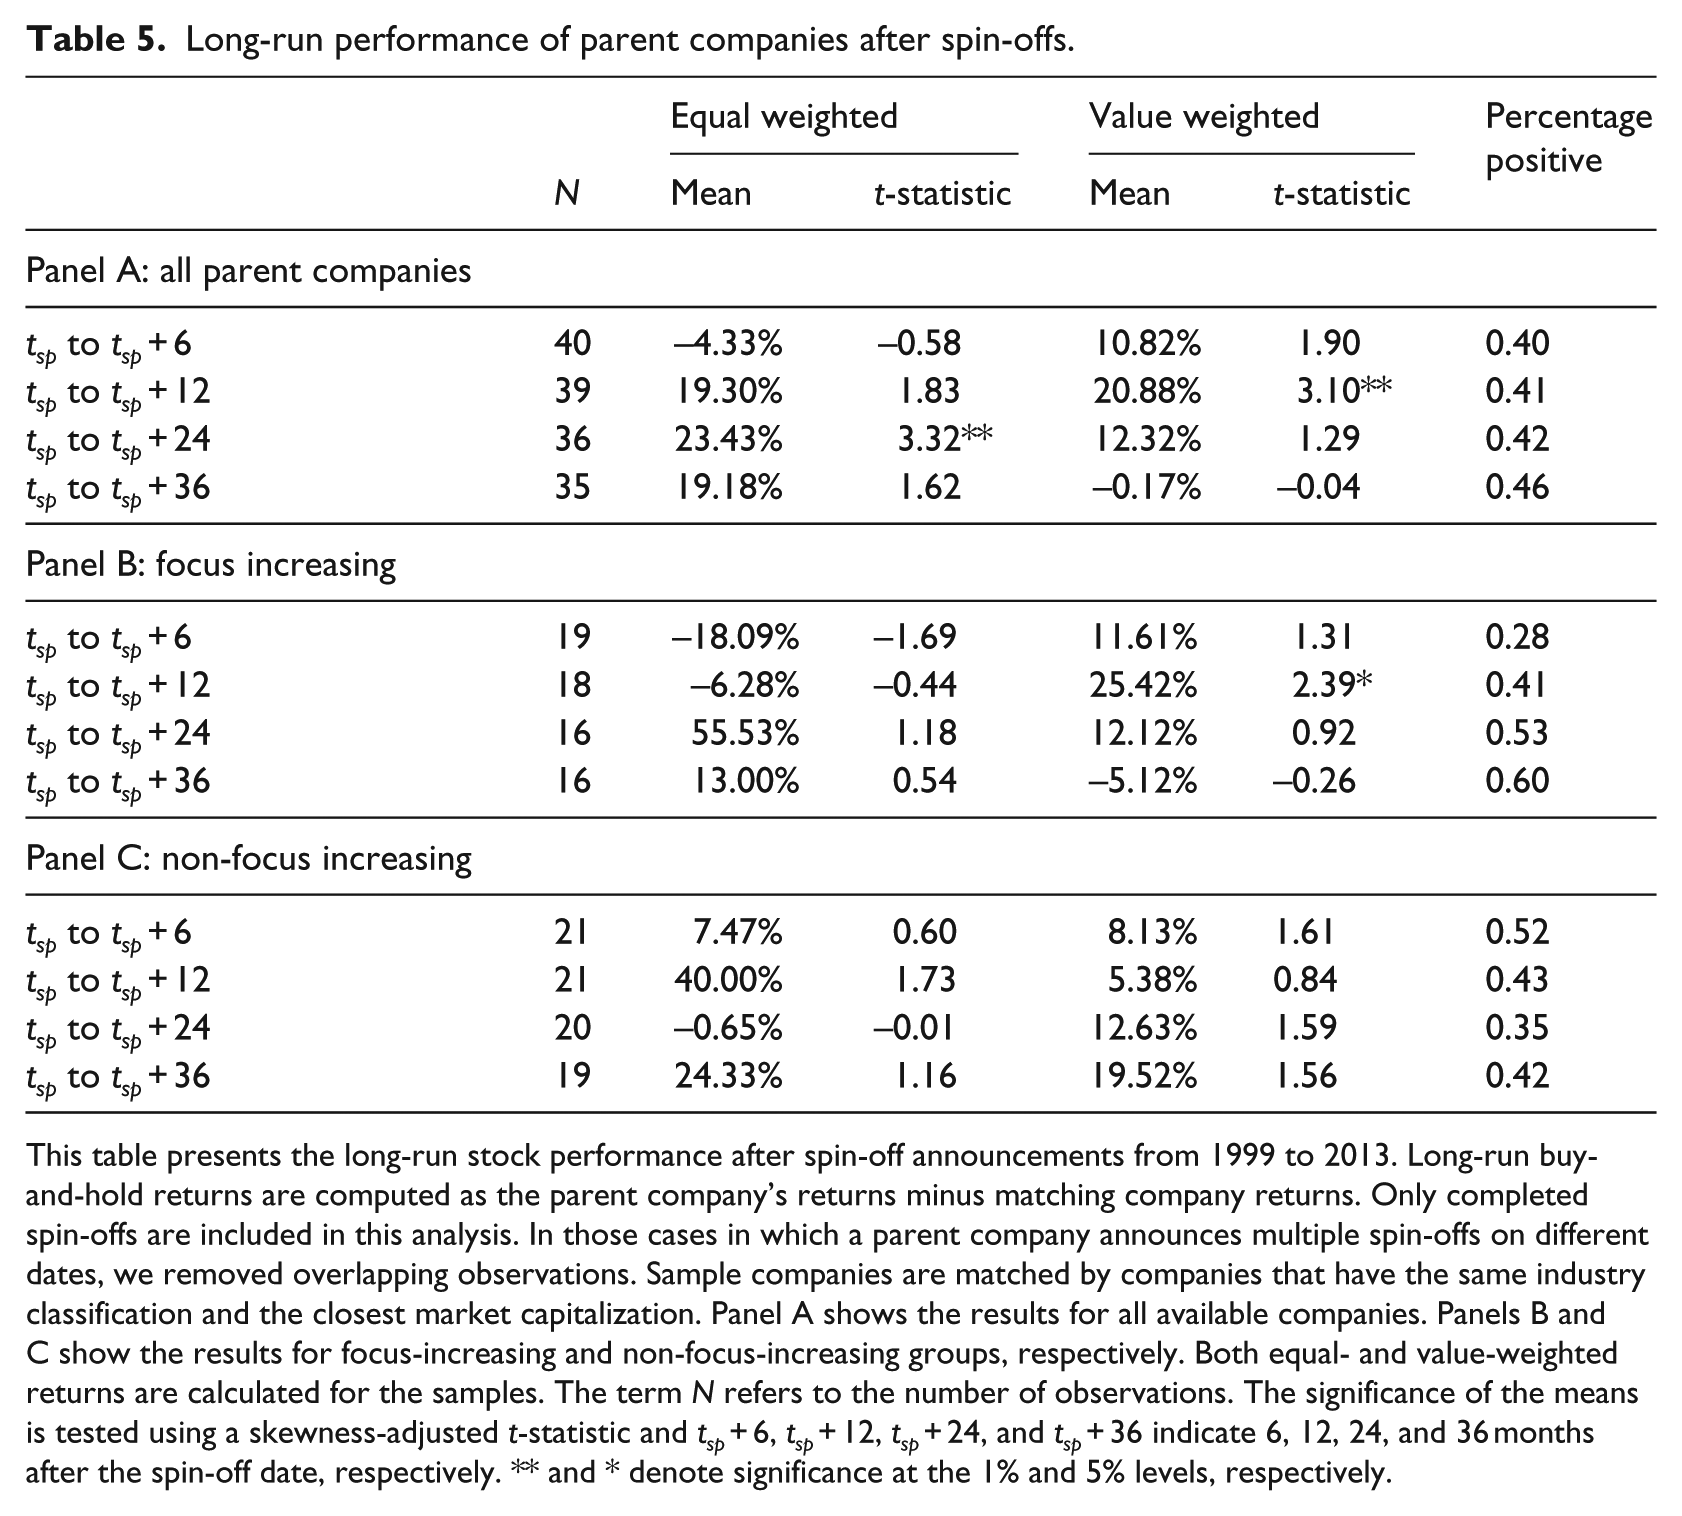
This table presents the long-run stock performance after spin-off announcements from 1999 to 2013. Long-run buy-and-hold returns are computed as the parent company’s returns minus matching company returns. Only completed spin-offs are included in this analysis. In those cases in which a parent company announces multiple spin-offs on different dates, we removed overlapping observations. Sample companies are matched by companies that have the same industry classification and the closest market capitalization. Panel A shows the results for all available companies. Panels B and C show the results for focus-increasing and non-focus-increasing groups, respectively. Both equal- and value-weighted returns are calculated for the samples. The term N refers to the number of observations. The significance of the means is tested using a skewness-adjusted t-statistic and tsp + 6, tsp + 12, tsp + 24, and tsp + 36 indicate 6, 12, 24, and 36 months after the spin-off date, respectively. ** and * denote significance at the 1% and 5% levels, respectively.
Panels B and C of Table 5 report the results for focus-increasing and non-focus-increasing spin-offs, respectively. In the equal-weighted approach, there are no significant long-run returns. However, focus-increasing spin-offs show significant long-run returns for a period of 12 months under the value-weighted approach. These abnormal returns are significant at the 5% level. This result provides mild support for the findings of Desai and Jain (1999), who document significant long-run excess returns for focus-increasing spin-offs. 19 However, because of our small sample and because the returns are only significant up to 12 months after the spin-off, our results should be interpreted with the necessary caution.
5. Conclusion
A number of studies investigate announcement effects and the long-run stock performance associated with corporate spin-offs. However, this evidence is largely restricted to the United States and, to a lesser extent, to European countries. Hardly any evidence of these effects is available outside these regions. This study provides out-of-sample evidence of spin-off announcements by studying the Australian market. We find a significant spin-off announcement effect over a 3-day window surrounding the announcement day. However, the cumulative return of 2.93% is lower than that documented for most studies on the US market. When potential sources for spin-offs such as (1) industry focus, (2) geographical focus, (3) information asymmetry, (4) bank debt, (5) industry sector, and (6) market states are examined, none of the factors offers a solid explanation for the documented spin-off announcement effect in Australia. However, we do find significant long-run excess returns up to 12 months after spin-off announcements. This result especially applies to spin-offs that result in an increase in industrial focus. Therefore, it is possible that the benefits stemming from the elimination of negative synergies are only recognized by the market at a later stage. Please note that our results should be interpreted with caution because of our small sample size.
The evidence presented in this article partly supports previous findings such as the positive announcement effects associated with spin-offs. However, it also questions other findings, such as the role that the increase in industrial focus plays. It is possible that our results are particular to the Australian market, but it is also possible that these effects are applicable to other markets outside the United States. More research beyond the United States would therefore be useful to obtain a full picture of how worldwide markets perceive spin-off announcements.
Footnotes
Appendix 1
Sample sizes of prior spin-off studies.
| Study | Region | Sample period | Sample size |
|---|---|---|---|
| Durand et al. (2003) | Australia | 1992–2000 | 22 |
| Kirchmaier (2003) | European countries | 1989–1999 | 48 |
| Veld and Veld-Merkoulova (2004) | European countries | 1987–2000 | 156 |
| Boreiko and Murgia (2010) | European countries | 1989–2005 | 97 |
| Murray (2008) | United Kingdom | 1992–2004 | 60 |
| Hite and Owers (1983) | United States | 1963–1981 | 123 |
| Schipper and Smith (1983) | United States | 1963–1981 | 93 |
| Rosenfeld (1984) | United States | 1963–1981 | 35 |
| Copeland et al. (1987) | United States | 1962–1982 | 188 |
| Seifert and Rubin (1989) | United States | 1968–1983 | 51 |
| Vijh (1994) | United States | 1964–1990 | 113 |
| Allen et al. (1995) | United States | 1962–1991 | 94 |
| Seward and Walsh (1996) | United States | 1972–1987 | 78 |
| Johnson et al. (1996) | United States | 1975–1988 | 104 |
| Daley et al. (1997) | United States | 1975–1991 | 85 |
| Desai and Jain (1999) | United States | 1975–1991 | 144 |
| Krishnaswami and Subramaniam (1999) | United States | 1978–1993 | 118 |
| Mulherin and Boone (2000) | United States | 1990–1999 | 106 |
| Maxwell and Rao (2003) | United States | 1976–1997 | 79 |
| Veld and Veld-Merkoulova (2008) | United States | 1995–2002 | 91 |
| Jain et al. (2011) | United States | 1986–2005 | 46 |
This table shows the sample sizes of previous studies on the spin-off announcement effect.
Final transcript accepted 7 August 2017 by Sue Wright (AE Accounting).
Funding
The author(s) received no financial support for the research, authorship, and/or publication of this article.