
Abstract
This study examines the knowledge structures (KSs) of CEOs of firms that attempted turnaround from performance decline. We developed and tested a theoretical model that describes how two cognitive characteristics of CEOs, complexity and centrality, influence the likelihood of turnaround. It is found that CEO KS centrality directly increases the chance of turnaround. In addition, CEO KS complexity is found to increasingly improve the chance of turnaround as a firm in decline launches a greater extent of strategic change to their organization. Together, in theory, our research suggests that CEO cognitive competencies matter for managing successful turnaround attempts. Practically speaking, the findings of this article imply that to improve their chance of achieving successful turnaround, declining firms should look for CEOs who are cognitively focused or who are cognitively complex enough to engage in the degree of strategic changes launched to save the firm.
Keywords
The financial obligation was tough, but not nearly as complex as the business is. Mr. Buffett, how can you make a billion-dollar decision in five minutes? Well, it is fifty-years of preparation and five minutes of decision making.
1. Introduction
Attempting to turn around a firm that is in severe performance decline is a daunting task. Research on firm turnaround has found that the cognition of top managers, such as the direction of attention (Clapham et al., 2005), the perceived severity of decline (Musteen et al., 2011), the attribution of decline causes (Barker and Barr, 2002), and the evaluation of controllability of decline causes (Ford, 1985; Liang et al., 2018), influences the turnaround strategies adopted by declining firms. However, most of these previous studies have focused on the content of cognition, which is rather idiosyncratic and situation dependent. Rarely have the structural characteristics of CEO cognition been studied. This lack of research hinders our understanding of the comprehensiveness and depth of CEOs’ perceptions of their firms’ strategic situations, hence causing an incomplete assessment of the competencies of turnaround CEOs, given that previous research has shown that the cognitive competencies of managers are critically reflected by the cognitive structures of managers (McNamara et al., 2002; Nadkarni and Narayanan, 2005, 2007; Walsh, 1995). Such lack of research on the cognitive structures of turnaround CEOs also limits the investigation of the outcomes of turnaround decision making—the success or failure of turnaround attempts.
Studying the cognitive competency of turnaround CEOs is paramount because the ambiguity and uncertainty often surrounding a declining firm (Cameron et al., 1987a; Wiseman and Bromiley, 1996) challenges the decision-making during a firm’s turnaround attempt. Cognitive competency refers to a demonstrated ability that an individual comprehends and understands issues in a knowledge domain to solve complex problems (Wang and Ennis, 1986). Cognitive competency is tested by issue ambiguity and uncertainty. Ambiguity suggests that a phenomenon, or causal relationships embedded in a phenomenon, is subject to multiple interpretations (Joseph and Gaba, 2015; Powell et al., 2006). Uncertainty refers to the uncontrollability (March and Simon, 1958) and unpredictability of a phenomenon (Griffin and Grote, 2020). Ambiguity challenges knowing, while uncertainty threatens forecasting and, subsequently, actions. Both ambiguity and uncertainty increase task complexity (March and Simon, 1958; Wood, 1986). Strategic issues often surface during severe performance decline (Barker and Duhaime, 1997; Hofer, 1980), and they are considered to be notoriously ambiguous to interpret (Lyles, 1981; Starbuck and Milliken, 1988). Ambiguity arises in declining firms from the unknowing relationships between firm actions and firm performance. For example, it is often controversial as to whether incumbent CEOs should be held accountable for their firms’ decline or were just scapegoated for their firms’ problems (Boeker, 1992). In addition, Wiseman and Bromiley (1996) report that performance decline adds to uncertainty and risks due to declining firms’ attempts to increase performance through disrupting organizational routines and norms. Stakeholders’ responses to these changes are also unpredictable. To make things worse, during firm decline, a firm’s resource base depletes quickly, and urgent actions should be taken. Delaying actions means further deterioration of the firm’s resource base. Understandably there will also be mounting pressure from stakeholders for quick actions to save their investments.
Such task environments characterized by increased ambiguity, uncertainty, and time/resource constraints begs for strong cognitive competency of leaders to save declining firms (Eggers and Kaplan, 2009; Liang et al., 2018). Unfortunately, under performance pressure, CEOs’ cognitive structures tend to become simplified, causing them to lose cognitive competency (Graf-Vlachy et al., 2020). These two contrasting movements, decreasing CEO cognitive competency and increasing task complexity, create a question of whether the cognitive competency of CEOs, as disclosed by such structural characteristics as CEO knowledge structure (KS) complexity, matters or not. If it does, how?
This study seeks to investigate the above questions and by doing so, fills a void in understanding what and how exactly CEO cognitive competency affects the outcomes of declining firms’ turnaround attempts. We draw from the literature on strategic cognition in firm turnaround research (Barker and Barr, 2002; Clapham et al., 2005), combined with research on cognition science, specifically the skilled memory theory (Chase and Ericsson, 1982), to investigate these questions. Strategic cognition research studies top management cognitive structure and decision-making processes in an attempt to understand strategic decision-making (Porac and Thomas, 2002), while skilled memory theory focuses on studying the cognitive differences between experts and novices in encoding and retrieving domain-specific knowledge. This inclusion of research on expertise holds promises for understanding decision-making in situations with greater degrees of uncertainty, ambiguity, and time constraints. Presumably firms attempting turnaround would benefit from having CEOs whose cognitive structures resemble that of an expert in a specific knowledge domain, such as a skilled chess player. An expert’s cognitive structure has been found to be more hierarchically organized and contains more knowledge elements in fewer numbers of knowledge categories (Bédard and Chi, 1992; Ceci and Liker, 1986; Chi et al., 1981). These structural characteristics have been said to give experts a skilled memory that “enables them to rapidly encode, store, and retrieve information within the domain of their expertise and, thereby, to circumvent the capacity limitations that typically constrain novice performance” (Ericsson and Staszewski, 1989: 263). Research on cognition science shows that an expert in an area could make decisions that are both fast and quality assuring (Bédard and Chi, 1992; Ceci and Liker, 1986; Chi et al., 1981). It would be advantageous if those leaders of turnaround attempts have an expert-like mindset, such as that of Warren Buffett in investing, which enables them to make high-quality decisions fast.
2. Theoretical model and hypotheses
2.1. Strategic changes and successful turnaround attempts
Firms decline mainly because they have lost touch with their environments (Hannan and Freeman, 1977), resulting in failure to sustain a resource exchange relationship with external resource holders (Pfeffer and Salancik, 1977). To remedy this situation, declining firms need to make changes, especially strategic ones, to realign themselves with their external environments.
For deeply troubled firms, it is often not enough to simply get more competitive at what they had been doing. They need to become relevant in their environment. In response to a severe performance drop, firms may make two types of changes: operative and strategic (Hofer, 1980; Trahms et al., 2013). Operative changes, such as standardizing purchasing systems at Home Depot’s regional offices made by CEO Bob Nardelli, are targeted at making a firm more competitive by resolving issues with strategic execution. Strategic changes involve a shift in an organization’s purpose, priorities, and goals (Gioia et al., 2012), which are important for repositioning an organization in a changed environment or reorienting to adapt to emerging trends. Thus, strategic changes function to make a firm become more relevant in its environment by changing organizational fundamentals (Haveman, 1992; Tushman and Romanelli, 1985), such as launching a totally new product such as iPod during Apple, Inc.’s turnaround. The full recovery of severely declining firms is ultimately driven by a firm’s ability to initiate strategic change (Arogyaswamy et al., 1995).
Generally speaking, declining firms that are able to initiate and implement a greater level of strategic changes show some degree of ambidexterity in their organizational system and are more able to regain relevance in their environment. As a result, these firms launching large-scale strategic changes show more promise to recover (Tushman and O’Reilly, 1996). While any change itself could be destructive to an organization in a short term, due to declining slack resources, it can be expected that the benefits of changes will outweigh the destruction to an organization that launches them. Thus, the promise of recovery will rely on the capacity of firms to initiate necessary changes, which demonstrates an organization’s ability to overcome organizational inertia, resources constraints, and conservativeness of decision makers. Therefore, we expect that
H1. The extent of strategic changes that a declining firm undertakes during its turnaround attempt will be positively associated with the chance of successful turnaround attempts in the firm’s experience with severe performance decline.
2.2. Influence of the characteristics of CEOs’ KSs
Strategic changes are driven by strategic cognition, which is generated by strategic KSs (also called belief structures, schemas, mental models, mental templates, and so on) of strategic leaders, in particular, the top managers (Rajagopalan and Spreitzer, 1997). The KS of a strategic leader can change the outcomes of the turnaround attempts of a firm. A KS is a representation of domain knowledge that a subject (an individual, group, or organization) uses to collect information and make sense of it (Fiske and Taylor, 2017; Walsh, 1995). A Strategic management KS is a mental schema that a strategic leader of an organization adopts to attend to strategic management issues and make strategic decisions for their firm (Lyles and Schwenk, 1992). Dealing with performance decline reconfigures the strategic schema of a CEO into a temporary KS of turnaround, which allows turnaround CEOs to perform the unique task of attempting turnarounds, such as assessing the causes, controllability, and stability of firm decline (Ford, 1985). This temporary KS of turnaround is embedded in the overall KS of strategic management of a CEO, similar to a temporary mental structure of a basketball coach in dealing with a situation of losing a game series in a basketball season. Such a temporary mental structure is not independent from the overall KS of a professional in a knowledge domain.
The cognitive capabilities of a decision maker in a specific knowledge domain are reflected by the amount of knowledge contained in the KS of the decision maker, which can be assessed by the number of conceptual elements, that is, cognitive exemplars, theoretical constructs, and the relationships among these elements contained in the explicit KS of the decision makers (Walsh, 1995). These elements represent the scope and discriminative quality in judgment. Similarly, the cognitive competencies of turnaround CEOs could be fathomed through studying the number of conceptual elements contained in the CEOs’ strategic management KSs as well as by studying how these conceptual elements are connected.
2.2.1. CEO KS complexity
Research in cognition science shows that an expert in an area could make decisions that are both fast and quality-assuring (Bédard and Chi, 1992; Ceci and Liker, 1986; Chi et al., 1981). According to the skilled memory theory in cognition science (Chase and Ericsson, 1982; Ericsson and Staszewski, 1989), this ability can be attributed to some encoding mechanisms in the KS of an expert. One important feature that differentiates the KS of an expert and that of a novice is the degree of complexity, demonstrated by the number of concepts and their connections contained in the KS of that person (Laukkanen, 1994; Schneier, 1979). This difference in complexity between the KS of an expert and that of a novice has been supported in experiments conducted in several professional fields, including the learning of physics, handicapping of horse racing (Bédard and Chi, 1992; Ceci and Liker, 1986; Chi et al., 1981), and selling in business contexts (Sujan et al., 1988).
Some scholars on CEO cognition suggest that this notion of cognitive complexity captures the variety, integration, and breadth of environmental, strategy, and organizational concepts embedded in the schema of a CEO (Nadkarni and Narayanan, 2007; Walsh, 1995), while in comparison, others have emphasized the degree to which a CEO engages in differentiated (as opposed to unitary) and nuanced (as opposed to black-and-white) thinking as a representation of cognitive complexity (Graf-Vlachy et al., 2020). We follow the first definition of cognitive complexity because the second definition puts more emphasis on the content of cognition and less on the structural feature of cognition.
CEOs whose KSs resemble more of an expert’s will have more complex mindsets and therefore, they should possess more cognitive power in decision-making to turn a declining firm around. Complex CEO KSs increase the capacity of CEOs in encoding information when they scan their firms’ ambiguous environment in declining situations. What may take place is that the more information captured by a KS, the more comprehensive the interpretation of the declining situations. Consequently, a greater chance of problem identification (Kiesler and Sproull, 1982) and more effective decisions to save the company ensue (Bartunek et al., 1983). Compared with simplistic KSs, complex KSs would assist in strategic analyses better given the abstract, complex, and ill-structured nature of strategy issues (Lyles, 1981; Starbuck and Milliken, 1988).
Specifically, to recover from performance decline, it is critical for a firm to correctly locate decline causes (D’Aveni and MacMillan, 1990; Ford, 1985). CEOs with complex KSs would be more likely to locate the sources of decline as their KSs contain fewer blind spots and more complete interpretations. Complex schemas also have more decision alternatives in storage. This advantage increases the chance of finding an appropriate solution to the performance problems (Fredrickson, 1984; Fredrickson and Mitchell, 1984).
Moreover, complex KSs also deliver holistic thinking (Bradley et al., 2006), which can speed up decision-making (Wally and Baum, 1994) with respect to the information search and comparing decision alternatives. Because holistic thinking allows a decision maker to simultaneously consider all knowledge elements, the relationships among them in a field, as well as the relationship between one element and its context (Li et al., 2015), holistic thinking is more encompassing in scanning and encoding cues than analytical thinking. Holistic thinking also involves using intuition, which can accelerate turning information into intelligence and identifying outcomes of decision alternatives in a decision-making process (Wally and Baum, 1994). Speedy decision-making ensures prompt and appropriate actions, such as stabilizing the situation (Bibeault, 1982; Pearce and Robbins, 1993), to deal with performance decline. Because of these reasons, we expect that
H2. In a decline situation, the knowledge structure complexity of CEOs will be positively associated with the chance of turnaround of their firms.
We expect KS complexity to be more important to the success of a turnaround attempt as the degree of strategic changes launched to save a company increases. Greater degrees of strategic change add significantly more dynamism and complexity to a turnaround process, making an even more challenging and uncertain task environment. According to the requisite complexity theory (Poulis and Poulis, 2016), a CEO’s KS needs to at least match the degree of complexity in the external environment to effectively manage increased dynamism and uncertainty (Calori et al., 1994). Sufficient degrees of cognitive complexity allow CEOs who are leading turnaround attempts to comprehensively monitor the steps and feedback during the implementation of turnaround strategies, to discern new opportunities, and to improvise new solutions on the go that help their firms regulate uncertainty (Griffin and Grote, 2020).
Expert decision-making research suggests decision-making contains three stages: pre-decision-making, decision point, and post-decision-making 1 (Malhotra et al., 2007). These stages form a decision-making loop that emerges during the process of accomplishing cognitive tasks. Previous discussions illustrate the advantages of complex KS in pre-decision and decision point stages of decision-making. The post-decision stage—a period when decisions are reviewed and then adjusted based on feedback, and temporary results are achieved after the decisions made are implemented—is also influenced by the KS complexity of a decision maker. In dealing with ill-structured issues, such as firm strategies, we posit that the cognitive process at the post-decision process will be more important than at the pre-decision and decision stage because the results of strategic decisions are hardly fully predictable during the stages of pre-decision and decision point. Constant incorporation of new updates and interpretation of feedback are necessary for getting the optimal decision outcomes (Sterman, 1989). In fact, in a continuous cognitive process, sometimes it is hard to differentiate between the temporary pre-decision stage and post-decision stage. As a result, in dealing with ongoing, ambiguous, and highly uncertain decision issues, certain degrees of complexity in KS are essential to high-quality decision-making as far as possessing decision-making dexterity.
Ambiguity and uncertainty generally increase as the degree of change increases from both inside and outside of an organization (Cameron et al., 1987b; Gioia et al., 2012; Wiseman and Bromiley, 1996). In the situation of a turnaround attempt, greater degrees of strategic change, such as mergers and acquisitions, create more ambiguous and uncertain decision scenarios than lower degrees of strategic change because these changes affect a broad scope of stakeholders (Kotter, 2007). These changes may disrupt well-established routines and assumptions as well as break multi-stakeholder relationships internal or external to an organization. They are more likely to create confusion and conflicting interpretation of decision outcomes (Srivastava, 2015). For example, when attempting to save Apple, Steve Jobs asked all existing directors of the board to quit, launched new products, such as iMac, and made a stunning move of inviting Microsoft to invest in Apple. The last move created a lot of confusion and doubts among many stakeholders, who thought Apple was giving away its power to Microsoft as an admittance of defeat in competing against Microsoft. Apparently, Jobs viewed Apple’s relationship with Microsoft as more beneficial than harmful, and how right he was! With the integration of Microsoft office, iMac can offer both features that consumers desire: beautiful hardware design and productivity-enhancing software. It does take a complex mindset to see all of the intricacies in a fluid, competitive environment.
H3. The level of complexity in a CEO knowledge structure will positively moderate the relationship between the degree of strategic changes and the chances of successful turnaround attempts.
2.2.2. CEO KS centrality
Cognition research has also found that expertise is reflected not only in the complexity of KS but also in how the past knowledge is stored to create a hierarchy of an expert’s memory. Compared with the KSs of novices, the KSs of experts are more hierarchically organized where fewer semantic categories exist, but a lot more concepts are contained in these semantic categories. This structure is believed to allow experts to develop a global picture of a knowledge domain and recall large chunks of information (Chase and Simon, 1973; Schvaneveldt et al., 1985). The hierarchical organization of memory can be understood through the concept of KS centrality, which is defined as the degree to which a schema of a subject is hierarchical and focused on a single concept or few concepts (Eden et al., 1981).
CEOs with a centralized KS are likely to have a succinct interpretation of the causes of performance drop. Consequently, we expect that they would be able to effectively evaluate the solutions to the causes of decline as well as select an appropriate turnaround strategy. Highly centralized schemas present clear causal relationships and rules that facilitate prioritization among concepts contained in a KS (Fiol and Huff, 1992). The higher the centrality, the greater the focus and logical pattern in reasoning a KS would have (Nadkarni and Narayanan, 2005). A cognitive structure that lacks focus and order would cause cognitive overload in diagnosing complex problems. Cognitive overload creates confusion in the sense-making process (Newstead and Griggs, 1992). Confusion may even result in emotional discomfort such as stress and anxiety. Together, confusion and emotional discomfort will thwart rationality in decision-making (Ert and Erev, 2007; Mumby and Putnam, 1992).
Besides providing needed rationality for picking a turnaround strategy, a centralized KS also creates a benefit of setting priorities in decision-making. Prioritizing issues is very important to saving a declining business in the presence of time and resource constraints. Because a clear, centralized schema keeps turnaround leaders focused on critical success factors (Hambrick and Lei, 1985) and eliminates unnecessary initiatives, it is relatively easier to rank order goals and make trade-offs with a centralized KS. As such, we can also expect that centralized KSs will effectively save CEOs from cognitive and emotional burdens, such as distractions from heightened politics that are typical in declining organizations (Cameron et al., 1987a; Whetten, 1987).
Having said the above, it is notable that KS centrality may also display rigidity in cognition and may potentially inhibit adaptive changes (Nadkarni and Narayanan, 2007). In the situation of severe performance decline, however, the possibility that KS centrality leads to rigidity is low because from an organizational learning perspective, declining performance outcomes will create negative feedback that alerts a CEO to rethink previous rationale and, as such, to question previous assumptions in their reasoning and judgment (Lant, 1992). We can expect that the focus benefits of KS centrality would outweigh this rigidity tendency in severe decline situations. Therefore,
H4. In a decline situation, CEOs’ knowledge structure centrality will be positively associated with the chance of turnaround of their firms.
3. Methodology
3.1. Sample
Sample firms were drawn from publicly traded US firms. We applied the following general criteria to select the firms in our final sample: (1) a firm should operate in only one dominate industry segment before it declined, (2) a firm should have been in operation for at least 5 years, and (3) a firm should experience performance decline during the period of 1986 to 2005. The industry segment in which a firm operated was checked in the firm’s annual report to shareholders and examined at the four-digit SIC level. The industrial distribution of firm revenue was examined based on business segmentation data reported in a Standard and Poor’s CompuStat data set. We also reviewed each firm’s annual report to ensure that firms in our sample were not diversified across industries at the first year of decline.
To be included in the sample, a firm should be as follows. (1) It should have experienced at least three consecutive years of return on investment (ROI) drop below the risk-free rate of return 2 (Barker and Duhaime, 1997). The trail of performance drop could be non-monotonic. (2) It should have experienced losses in the third year of performance drop. (3) It should be a manufacturing firm. Because the nature of strategic changes may differ between firms in the manufacturing sector and firms in the service sector 3 (O’Neil, 1986), the sample excluded service firms. (4) It should have been in decline during a period that its industry was performing normally. Industry performance was checked at four-digit SIC level using the average sales growth rate of all the public companies contained in the CompuStat database (Hambrick and Abrahamson, 1995) for the first 3 years in the decline period.
3.2. Data collection
Data for measuring cognitive variables were coded from the CEO letters to shareholders (LTS) of declining firms. The firm level variables (ROI, control variables) and industry level data (growth) were computed based on the financial data contained in Standard and Poor’s CompuStat database. CEO and top management team data were collected from Wharton Research Database Service’s (WRDS) executive compensation database.
We expected that the changes initiated by the firms during the second and third year of decline, or between t2 and t3, would have been the major steps that were taken to save the company. As a result, our testing of the hypotheses focused on the KS that emerged at the second year of decline that directly affected the process of subsequent strategic changes to the organizations.
3.3. Operationalization of CEO KS
We adopted a text-based causal mapping (TBCM) approach to extracting the strategic schema of top managers such as CEOs of firms (Huff, 1990). TBCM captures the KS of an individual (or a team; Eden et al., 1992). The texts used here to build the causal maps are the CEO’s LTSs in firms’ annual reports to shareholders (Abrahamson and Hambrick, 1997; Kabanoff and Brown, 2008; Nadkarni and Narayanan, 2007). The content analysis of written or oral communications is a particularly effective method for deriving perceptions and cognition of their authors (Holsti, 1968). Annual LTSs by CEOs are one of the most important communications that CEOs approve and sign to explain their perceptions of the businesses’ situations and their future plans. In decline and turnaround research, these letters have been a well-adopted source of texts used to measure the cognition of top managers (Barker and Barr, 2002; Clapham et al., 2005; D’Aveni and MacMillan, 1990). While there is a main debate over using these letters as to whether they are written by CEOs themselves or not or whether they show real perception of CEOs (Huff, 1990; Salancik and Meindl, 1984), several studies found consistency between the letters and other sources of communication, such as firms’ internal documents (Fiol, 1995) or CEO interviews (Nadkarni and Narayanan, 2007). We believe validity is less of a concern during the period of turnaround than are other actions, such as presenting financial analyses, when stakeholders would examine these letters very closely to get a sense of what and how CEOs have been doing or trying to do to save their firms. Turnaround CEOs will be very careful about the communication with shareholders. As such, the chance of misleading stakeholders would be low, and CEOs disagreeing with the content of the letters would be low. In addition, because we used the CEO letters to study the structural and not content characteristics, this use is unlikely to be subject to criticism related to the attribution of decline causes. These considerations gave us confidence about using LTSs to elicit CEO KS.
To ensure high reliability and validity in measuring the cognition of CEOs, we carefully followed a four-step procedure that was very similar to the procedures used in previous studies (Axelrod, 1976; Nadkarni and Narayanan, 2007) to identify and code the statements in LTS in developing causal maps. To check the validity of causal statements identified in the letters, a hired coder (a junior student in management) was asked to analyze two randomly drawn LTSs following the four-step coding procedure. Another senior doctoral student in strategic management served as the second colder and coded the two letters independently. The two students’ coding of the two sample letters reached an agreement of 94% over the raw phrases identified and 96% over the causal relationships identified in the two letters. A total of 139 constructs of strategic management were developed from the LTSs of these declining firms. Of the 139 concepts, 113 constructs (81%) are included in three popular textbooks written by well-cited scholars of strategic management (Dess and Lumpkin, 2003; Hitt et al., 2007; Pearce and Robinson, 2007). A similar comparison was adopted by Nadkarni and Narayanan (2007). In addition, the dictionary was compared with the list of strategy constructs in the causal map reported by Nadkarni and Narayanan (2007). There were 98 concepts (74%) identified in this study that were also found with exact or very similar concepts in Nadkarni and Narayanan’s dictionary. Together, these two verification steps suggested an acceptable degree of convergent validity in the process of coding text into causal maps. The process is shown in Appendix 1. A causal map example developed out of CEO letter is shown in Appendix 2.
3.4. Measures
3.4.1. CEO KS complexity
Given the definition of CEO KS complexity introduced earlier, we measured the KS complexity of a CEO by adding the number of concepts and the number of links among these concepts contained in a causal map. We used the CEO’s letters from the above procedure to develop the causal map (Nadkarni and Narayanan, 2007; Wasserman and Faust, 1994). As a way to control for the influence of the length of the text (i.e. CEO letters), this variable was standardized in subsequent analysis.
3.4.2. CEO KS centrality
We used the degree centrality-based measure of centralization to measure KS centrality (Freeman, 1979; Scott, 1991). This network centralization captured how a network is concentrated on a few nodes by considering the number of links each individual node (concept) has in comparing with the number of links other nodes have in a network. Mathematically speaking, if in a network, all nodes are linked to one single node where no other links exist among other nodes, then this network has a maximum centralization of 1. Conversely, if each node in a network has an equal number of links with other nodes, then this network has a minimum centralization of 0. This variable was standardized in subsequent analysis as well.
That is

where CD(pk) is the degree centrality of the kth node pk; pi is the ith node in the network that may link TO (cause) pk; n is the total number of nodes (concepts) in the network. If there is a link directed from pi to pk, the link (pi, pk) will have a value of 1. Otherwise, it will have a value of 0.
Network centralization was calculated following the study by Freeman (1979) as noted below,

where Cmax is the maximum value of degree centrality of a node and C(pi) is the degree centrality of node pi, which is computed by the number of direct links connected to the node (strategy constructs in a KS) divided by maximum possible links.
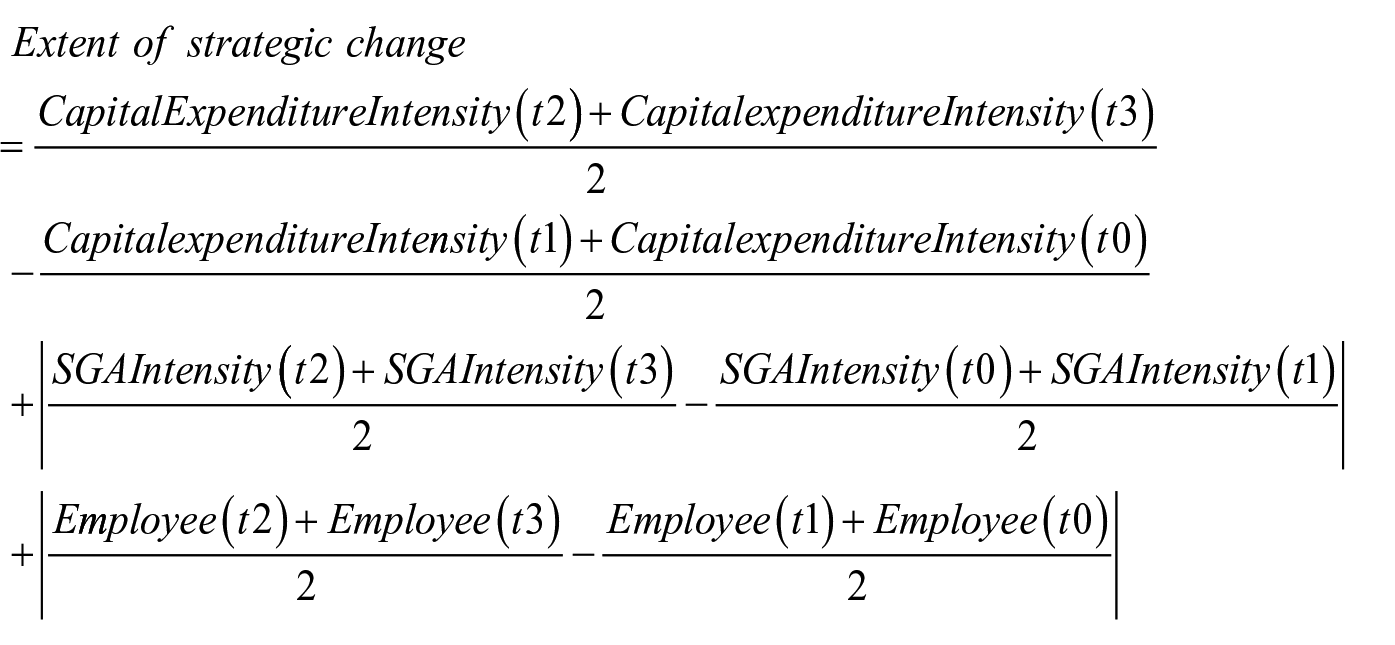
3.4.3. Extent of strategic change
We measured change in strategy as the absolute changes in organizational orientation proposed by Miles and Snow (1978). The extent of strategic change was measured as the changes to the deployment of firm resources in terms of capital expenditure intensity, sales, general and administrative (SGA) expenses intensity (SGA/sales), human resources (percentage change in number of employees). These three dimensions captured entrepreneurial, engineering, and administrative orientations of firms in Miles and Snow’s conception of strategy. We first calculated absolute changes in these three areas between the pre-decline period (year 0 and year 1) and the expected turnaround attempt period (i.e. year 2 and year 3) during a decline and recovery process and then added them together, as shown below
3.4.4. Outcomes of a turnaround attempt
Consistent with the definition of decline and turnaround provided earlier, a turnaround attempt was deemed successful when the following conditions applied to a declining firm identified in the sample:
A firm was able to achieve three consecutive years of positive ROI (again, no need to be monotonic),
Of the three years of ROI improvement in the recovery period, at least 1 year’s ROI was above the risk-free rate of return. If a firm that met the decline pattern described here declared bankruptcy in any of the three following years, the firm was also included in the sample and was considered a failed turnaround attempt.
The turnaround outcome variable was measured as a dichotomous variable. Consistent with its definition in this study, the turnaround variable had a value of 1 for a declining firm that achieved performance conditions described above. Otherwise, a firm was given a value of 0 for this variable.
3.4.5. Control variables
We controlled for some individual (CEO characteristics), team (top management team characteristics), organization (severity of decline and slack resources), and industry level variables (external resources) that may potentially confound the testing of the hypothesized relationships as the turnaround literature suggested (Abebe et al., 2011; Barker and Duhaime, 1997; Barker and Mone, 1998), including:
External resources (variable named industry growth), measured as the 3-year average of the mean value of the sales growth rate of all firms in each of the SIC four-digit level industry in years 2, 3, and 4 during the period of decline and turnaround.
Severity of decline (quick ratio), measured using the quick ratio of a firm at t2.
Firm size, measured as the number of employees at 1 year before a firm declined, that is, t0.
Firm pre-decline performance, measured with the ROI of 1 year before decline (i.e. year t0).
The tenure of CEO (CEO tenure), measured as the number of years the turnaround CEO was in position).
The size of top management team (TMT; TMT size, measured as the number of direct reports to the CEO at t0).
The extent of turnover on the TMT (TMT Turnover), measured as the number of replacements on TMT during the full 3 years of the turnaround attempt.
In addition, we also controlled for total words contained in the letter to shareholders for the year a causal map was developed to prevent the impact of text length.
The sources searched in this study generated 88 firms with complete data for all the variables. Of the 88 firms, 27 were classified as having successfully recovered from decline, and 61 were deemed as having failed their turnaround attempts, based on the strict criteria adopted in this study for identifying turnarounds. These firms were located in 52 SIC four-digit level industries and on average had 1587 employees in the year before they declined.
4. Results
Means, standard deviations, and correlation coefficients are presented in Table 1.
Means, standard deviations, and correlation coefficients. a .

TMT: top management team; KS: knowledge structure.
n = 88.
Outcomes of turnaround attempt is a dichotomy (success = 1, failure = 0).
p < 0.05; **p < 0.01.
The hypotheses were tested using binary logistic regression analysis, which is appropriate for testing the prediction of discrete outcomes with dichotomous values (Menard, 1995). The interaction effect was tested by inserting two multiplicative items between KS complexity and strategic change variable into the regression model with direct predictors of turnaround outcomes. To prevent the influences of multicollinearity between dependent variables and their multiplicative items on model testing, the dependent variables were standardized first before the multiplicative items were computed (Cohen and Cohen, 1983). Table 2 summarizes the coefficients and goodness-of-fit measures of the logit regression models, which are explained in detail below.
Results for turnaround attempt outcomes.
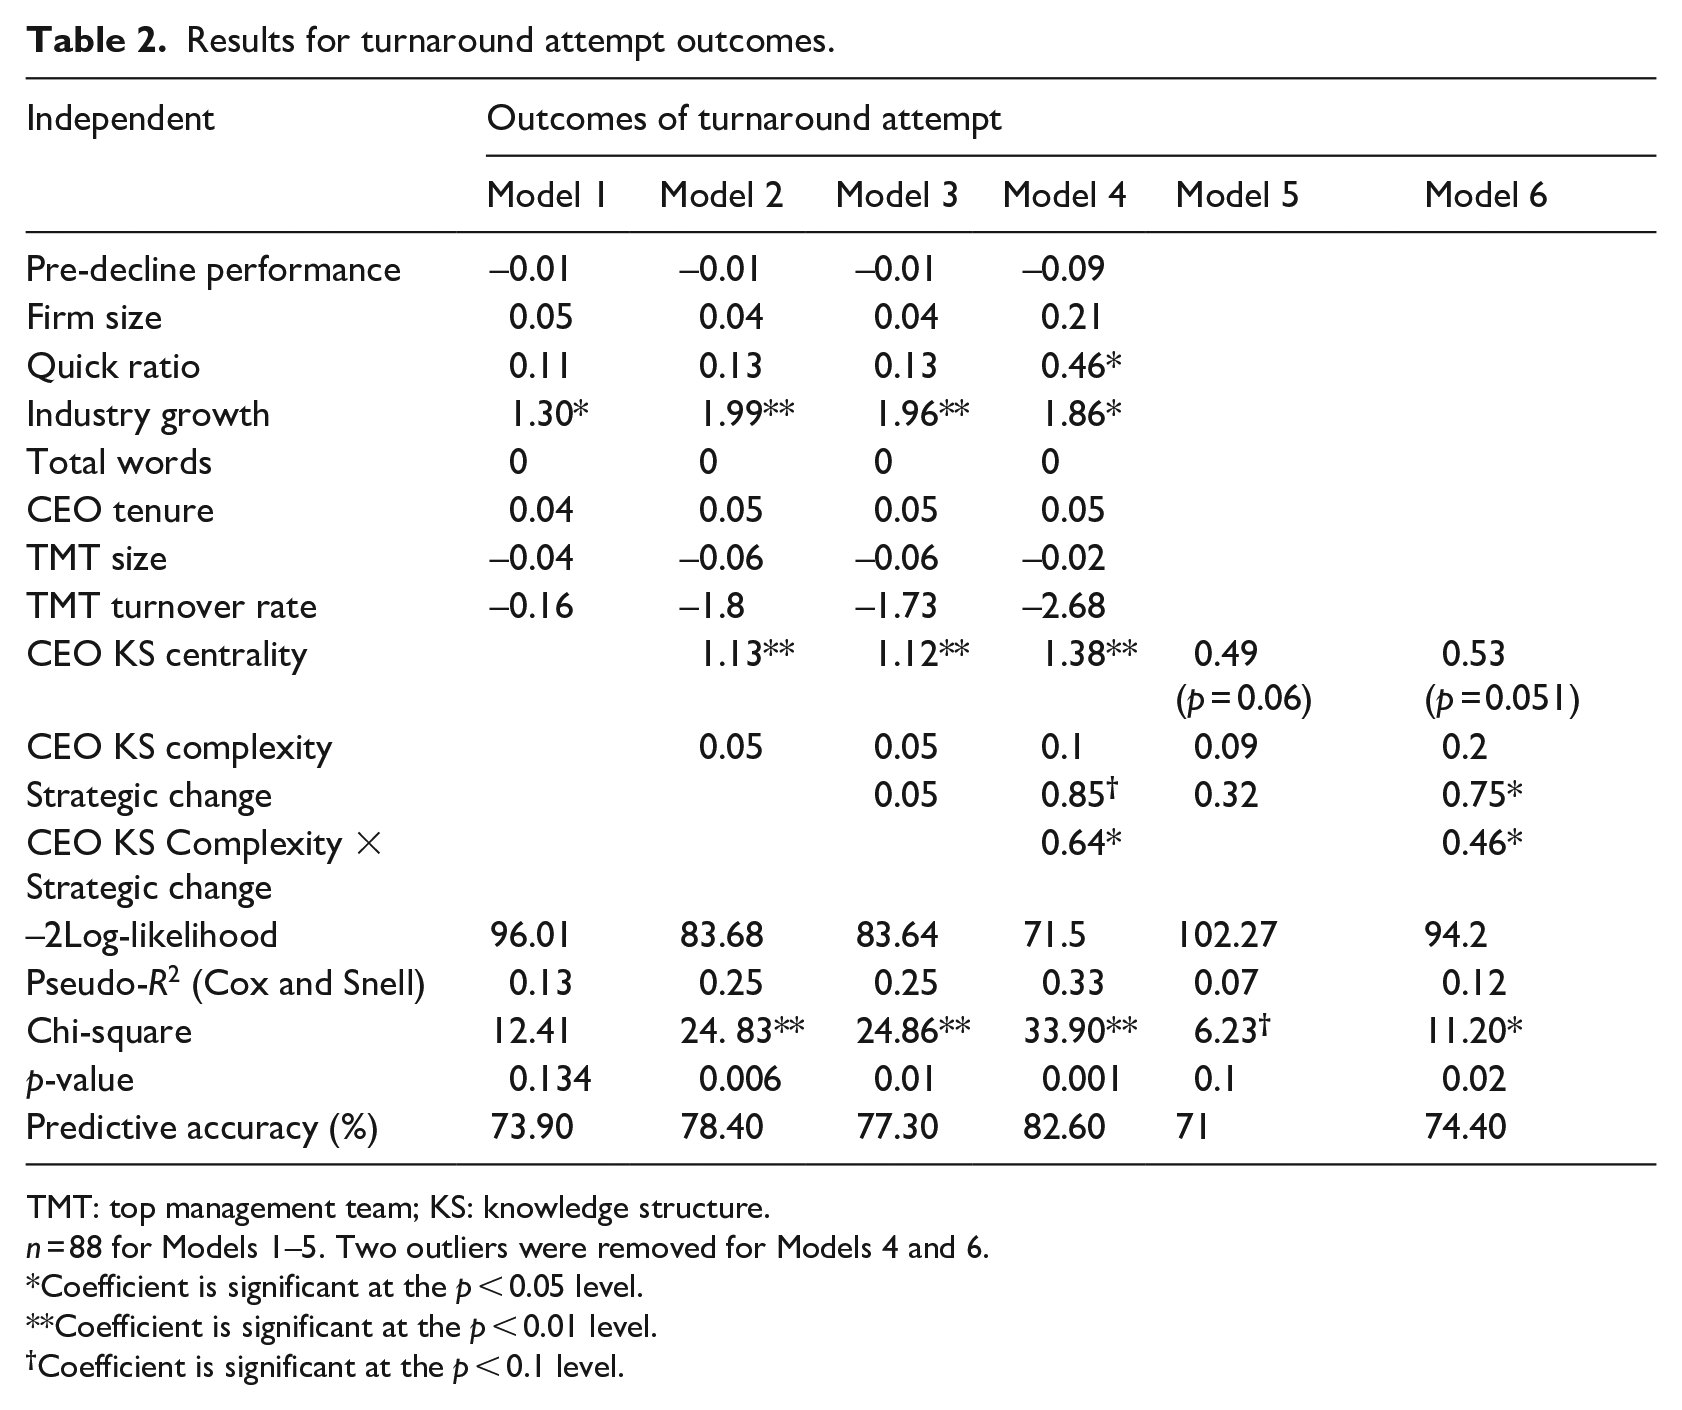
TMT: top management team; KS: knowledge structure.
n = 88 for Models 1–5. Two outliers were removed for Models 4 and 6.
Coefficient is significant at the p < 0.05 level.
Coefficient is significant at the p < 0.01 level.
Coefficient is significant at the p < 0.1 level.
Model 1 uses only the control variables as predicting variables. Among the control variables, only the industry growth variable has a significant coefficient. The overall model is not significant with a Chi-square of 12.41.
Model 2 adds CEO KS complexity and KS centrality as the predicting variables to Model 1 to test Hypotheses 2 and 4. Model 3 adds the strategic change variable to test Hypothesis 1. Hypothesis 1 predicts that the greater the change initiated by a declining firm in attempting turnaround, the more likely the firm will turn around. Hypotheses 2 and 4 predict, respectively, that CEO KS complexity and CEO KS centrality will be positively associated with the chance of turnaround. The results of the regression model do not support Hypotheses 1 and 2. The coefficients of the strategic change variable and the KS complexity variable are not significant, suggesting that strategic change and CEO KS complexity are not directly associated with the chance of turnaround. In contrast, the coefficient of CEO KS centrality is highly significant and positive (b = 1.13; p < 0.01), providing strong support for Hypothesis 4. The odds ratio was 3.08 for CEO KS centrality in Model 2. This suggests that a declining company in our sample with an average level of centrality in the KS of its CEO would increase its turnaround chance by about three times if the centrality in the CEO’s KS increases by one standard deviation. This evidence in support of Hypothesis 4 is also consistent in the two mixed models discussed next.
In Model 4, the multiplicative item of the KS complexity and strategic change variables was added to the explanatory variables to test Hypothesis 3, which predicts that in the circumstance of undergoing a great degree of change, firms led by a CEO with a more complex KS will have a greater chance of achieving turnaround than those led by a less complex KS. After two outliers were conducted, the inclusion of interaction dramatically improved the fit of the overall model. Pseudo R2 (Cox and Snell statistics) increased from 0.25 to 0.33. Correctly predicted cases jumped to 82.6% from 77.3% in Model 3. As for the predicting variable, the multiplicative item, intended to test the interaction effect, is significant and positive (b = 0.64; p < 0.05). These results are consistent with what Hypothesis 3 predicts. Models 5 and 6 tested the above relationships without the control variables. After all control variables were removed, CEO knowledge centrality had a moderately significant coefficient (p = 0.06, Model 5). These three independent variables were able to correctly predict the outcome of 71% of the turnaround attempts. After two outliers were removed in Model 6, both CEO KS centrality and the multiplicative variable between CEO KS complexity and the extent of strategic change are significant at p ⩽ 0.50 level. Collectively, these four variables are able to correctly predict the outcome of 74.4% of the turnaround attempts by declining firms in our sample. Figure 1 shows the supported relationships and unsupported relationships.

Theoretical model and results.
5. Discussion
Three major findings emerged in our investigation of an expert-like mindset of turnaround leaders. First and most important, we found that CEOs who had a centralized KS were positively related to the chance of achieving turnaround. This positive influence of KS centrality was robust even when the interaction effect between KS centrality and strategic change was present. This finding highlights the importance of having lucidly connected and hierarchically organized strategic knowledge in the mindset of turnaround decision makers that appears to show cognitive focus on a theme of change. These characteristics of knowledge representation can bring forth focused efforts and prompt targeted changes during a declining firm’s turnaround attempt.
While this finding is consistent with prior studies in social psychology, which report that a hierarchical organization of concepts in an individual’s mind indicates inductive reasoning ability (Hong and O’Neil, 1992; Newstead and Griggs, 1992), some may perceive this finding to be rather counter-intuitive. One stream of upper echelon literature (Finkelstein and Hambrick, 1996; Hambrick and Mason, 1984) argues that mental focus, framed as commitment to status quo, generally hurts firm performance at the time of external change because it presents a cognitive deadlock or cognitive inertia (Carley and Palmquist, 1992; Hambrick et al., 1993), which could block effective adaptation. While this argument of negativity associated with mental focus is very appealing, the result confirmed our expectation that it may have overshadowed the positive effect of mental focus in the speedy implementation of strategic decisions. The cognitive centrality of top management is a double-edged sword that both benefits and inhibits firm adaptation. Toward reconciling these two opposing views, we suspected that some personality factors may be significant determinants of the actual effect of cognitive focus. For a CEO with a high level of stubbornness or ego that makes belief in one’s decision beyond rational, cognitive focus would become a cognitive inertia and would negatively impact the decision-making. For those CEOs with a low level of stubbornness or ego, we would expect that cognitive focus would display rationality-based confidence. There is a great opportunity for future researchers to incorporate personality characteristics in reconciling the two conflicting effects of cognitive focus.
The second finding of this article shows more promise of our recommendation above. The sample of declining firms in our study demonstrated that high levels of strategic change were only effective in achieving successful turnaround when the complexity of the CEO’s KS was high. A complex structure itself does not have a direct impact on the chance of turnaround, neither does the degree of strategic change. This finding supports the requisite complexity theory (Poulis and Poulis, 2016) that a sufficient cognitive complexity is needed to match the task complexity to accomplish complex tasks successfully. To reveal the exact nature of this interaction effect, we developed the graph shown in Figure 2, using one standard deviation above and below mean to capture a high level and a low level of strategic change and KS complexity (Cohen and Cohen, 1983). As can be seen in the figure, at the low level of strategic change, KS complexity increased the chance of turnaround but only modestly. In contrast, at the high level of strategic change, the chance of turnaround improved significantly more than when the level of complexity changed from low to high.

Interaction effect between CEO KS complexity and strategic change on success of turnaround attempt.
Taking these two findings together, we predicted a unique KS that contributes to the cognitive competency of turnaround managers. Generally speaking, a competent turnaround CEO should have a KS that is centralized with a certain degree of complexity, just like one aspect of an expert’s mindset reported in social psychological research, with few semantic categories containing succinct exemplars and prototypes in each category. However, cognitive complex CEOs do not necessarily have an advantage in managing turnaround attempts where simple strategic actions are sufficient such as cost cutting. Only when large-scale changes are needed to save a firm do complexly minded CEOs have advantages. In general research on cognitive competency, McNamara et al. (2002) found that the best performing firms are managed by top managers whose mindsets contain fewer strategy categories but a larger number of competitors. Nadkarni and Narayanan (2005) reported that both KS centrality and KS complexity were positively associated with the academic performance of a group of MBA students, with centrality associated with the cognitive ability of the subjects but not complexity. Our research extended Nadkarni and Narayanan’s study by showing that cognitive complexity may still be a dormant cognitive competency that could become potent when a unique task environment calls for it.
Our study may be limited by using CEO letters as a source of CEO KS and by our operationalization of strategic change as a continuum. However, these limitations were controlled by following a rigorous coding process adopted in previous research and by using an integrative measure of strategic changes that aligns with Miles and Snow’s strategy typology. Still, future researchers could validate our findings by using a different source to measure CEO KS or trying a typological approach, such as Porter’s competitive strategies, to measure strategic changes.
The findings of this study generated some very unique insights for two groups of practitioners: potential investors who are looking for opportunities to invest, and the existing shareholders of the firms attempting turnaround who are looking for capable managers who can turn financially distressed firms around. Firms experiencing a serious performance drop may receive a significant reduction in their valuation. Some well-known investors, such as Warren Buffett, have excluded firms attempting turnarounds from their list of investment candidates. While the firms in our sample showed that only about one-third of these firms were able to turn themselves around, there were significant chances for shrewd investors to discover value in these distressed companies. High risks may produce high returns. Our findings suggest that an investor can evaluate whether a firm in decline has a CEO who is mentally focused. Those will have a better chance at recovery. Conversely, investors should be more cautious in investing in declining firms led by CEOs who lack a focused theme in their turnaround plan.
Similarly, the existing owners of a firm in decline also benefit from evaluating the cognitive focus of potential CEO candidates when selecting a turnaround CEO. It also is imperative for the owners to watch for the changes proposed by a CEO candidate and ask whether the CEO has a cognitive capacity, in terms of cognitive comprehensiveness, to manage a large-scale change, such as internationalization, mergers, or acquisitions in turnaround attempts. Furthermore, it is better to advise a selected CEO to be conservative and for that individual to focus on the best ability in launching changes if that turnaround CEO has a narrow scope of perception over the competitive environment.
In conclusion, we found that CEO cognitive structure matters for turning a declining firm around. Our findings demonstrate promises of understanding cognitive competency of turnaround CEOs. Given that this competency is demonstrated as the application of a CEO’s strategic KS in performing a specific task-turnaround attempt, characteristics of the KS of CEOs in general offer an important angle to explore general competencies of top management. For example, it would be useful to explore whether these structural characteristics of CEO knowledge can affect the strategic decisions and implementations in other complex situations, such as acquisitions and mergers.
Footnotes
Appendix
Acknowledgements
I would like to thank Associate Editor Dr. Helena Nguyen and two anonymous reviewers of AJoM for their invaluable comments on earlier versions of the paper. This project would be impossible to finish without the supervision of Dr. Vincent L. Barker at the University of Kansas. In addition, Mrs Gina Grensing at the University of Minnesota Duluth provided a significant editing service in the process of revision and resubmission.
Final transcript accepted 16 March 2023 by Helena Nguyen (AE Organizational Behavior).
Funding
The author(s) received no financial support for the research, authorship, and/or publication of this article.
1.
Three stages of decision process. Predecision involves (1) judgment about cues, (2) predictions, (3) integration for a holistic view, and (4) simulating consequences of action choices. At decision point, choices are made amid tradeoffs. Post-decision is marked by review, correction, and consigning the experience to memory. Domain experts add value to decision success by their more accurate judgments or conclusions at the pre-decision stage (Malhotra et al., 2007).
2.
The risk-free rate of return was checked with the Annual Yield of Return of US Treasury Note with 1 year constant maturity published by the US Department of Treasury.
3.
This is because service firms have unique value creation processes and resource base. ![]() pointed out two unique characteristics of services: the intangibility of the service offering and their simultaneous production and consumption. These features create issues for distinguishing activities and for assessing quality of service for a service firm. It is relatively hard to compare strategic moves across different service industries such as hospital, airlines, or banks.
pointed out two unique characteristics of services: the intangibility of the service offering and their simultaneous production and consumption. These features create issues for distinguishing activities and for assessing quality of service for a service firm. It is relatively hard to compare strategic moves across different service industries such as hospital, airlines, or banks.