
Abstract
This article reviews the salaries of the US members of the Special Libraries Association who have responded to the Association’s Salary Surveys and compares them to the Consumer Price Index (CPI) from 1982 to 2012. Salaries are shown to have increased sharply as has the CPI for the years studied. Significant gains have occurred in the mean and median salaries from 1982 to 2002. In the years following 2002, the salary gains were smaller, while the CPI increased at a higher rate. The salaries of these members of the Special Libraries Association are compared to the average salary for all librarians in the United States. This paper also comments on the salaries paid to holders of other advanced degrees which have similar educational requirements.
Preface
In 2012 a major financial magazine suggested that, based on income and in light of the salary at mid –career, the worst Master’s Degree someone could earn was in Library and Information Science. 1 The authors decided to test this statement based on the salaries paid to special librarians in North America using salary data from the Special Libraries Association (SLA) Salary Surveys. In this analysis, the authors compared the Survey results against the US Consumer Price Index to judge whether salaries had kept pace with rising prices. This information allows special librarians to compare their salaries against those in this study.
While special libraries in Europe have never achieved the penetration of those in the United States, nonetheless, there are a great many special librarians in Europe and all over the world and this research can be used by them for comparison purposes. 2
For many years, the Special Libraries Association has compiled useful information on salaries and trends for its members. 3 SLA represents thousands of members with the vast majority in the United States and a substantial minority in Canada. After 1979, salaries for Canadian members and US have been presented in separate tables. Most recent surveys have included salaries for European Chapter members. SLA has small pockets of members in Asia, but they are not yet included in the survey. In this article we focus on the US only.
Matarazzo began a serious study of special library salaries with the publication of the SLA Biennial Salary Survey 1993. 4 In that study, it was suggested that the graph which measured salaries against the Consumer Price Index (CPI) required adjustment. 5 The recommendations to use a graph that more meaningfully compares salary with CPI changes and to use the CPI in a way that was consistent from year to year were incorporated into future SLA salary surveys.
Much of our focus in the current article is on making salary comparisons over time for members of the Special Libraries Association. In using the salary surveys to make such comparisons, we have some critical concerns.
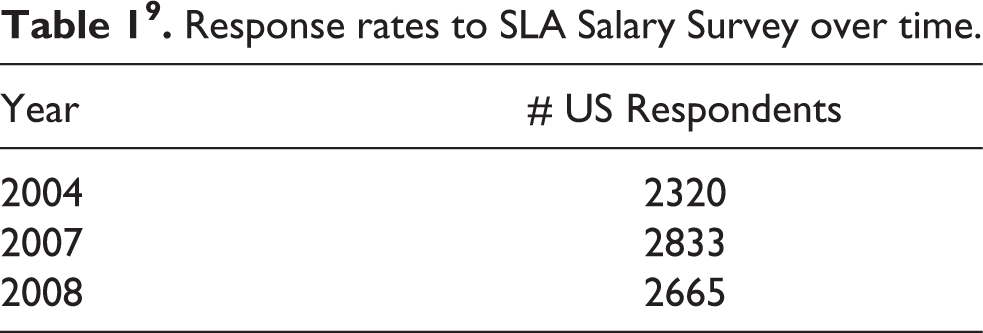
One concern is the extent to which the respondents to the survey consistently constitute a representative sample of the entire membership from year to year. Similar response rates from year to year are neither necessary nor sufficient to assure such representativeness, but the widely varying response rates over time do raise concerns.
Of further concern for some comparisons over time, the geographic mix of respondents has changed over the years. For example, in 2004, Canadian respondents and US were included; but in 2007 and 2008, European respondents were added to those from the US and Canada. However, in order to avoid problems presented by such a changing geographic mix, the salary data presented below for the period from 1982 to 2012 is for US respondents only
Changes in median and mean salaries relative to change in US Consumer Price Index, 1982–2012
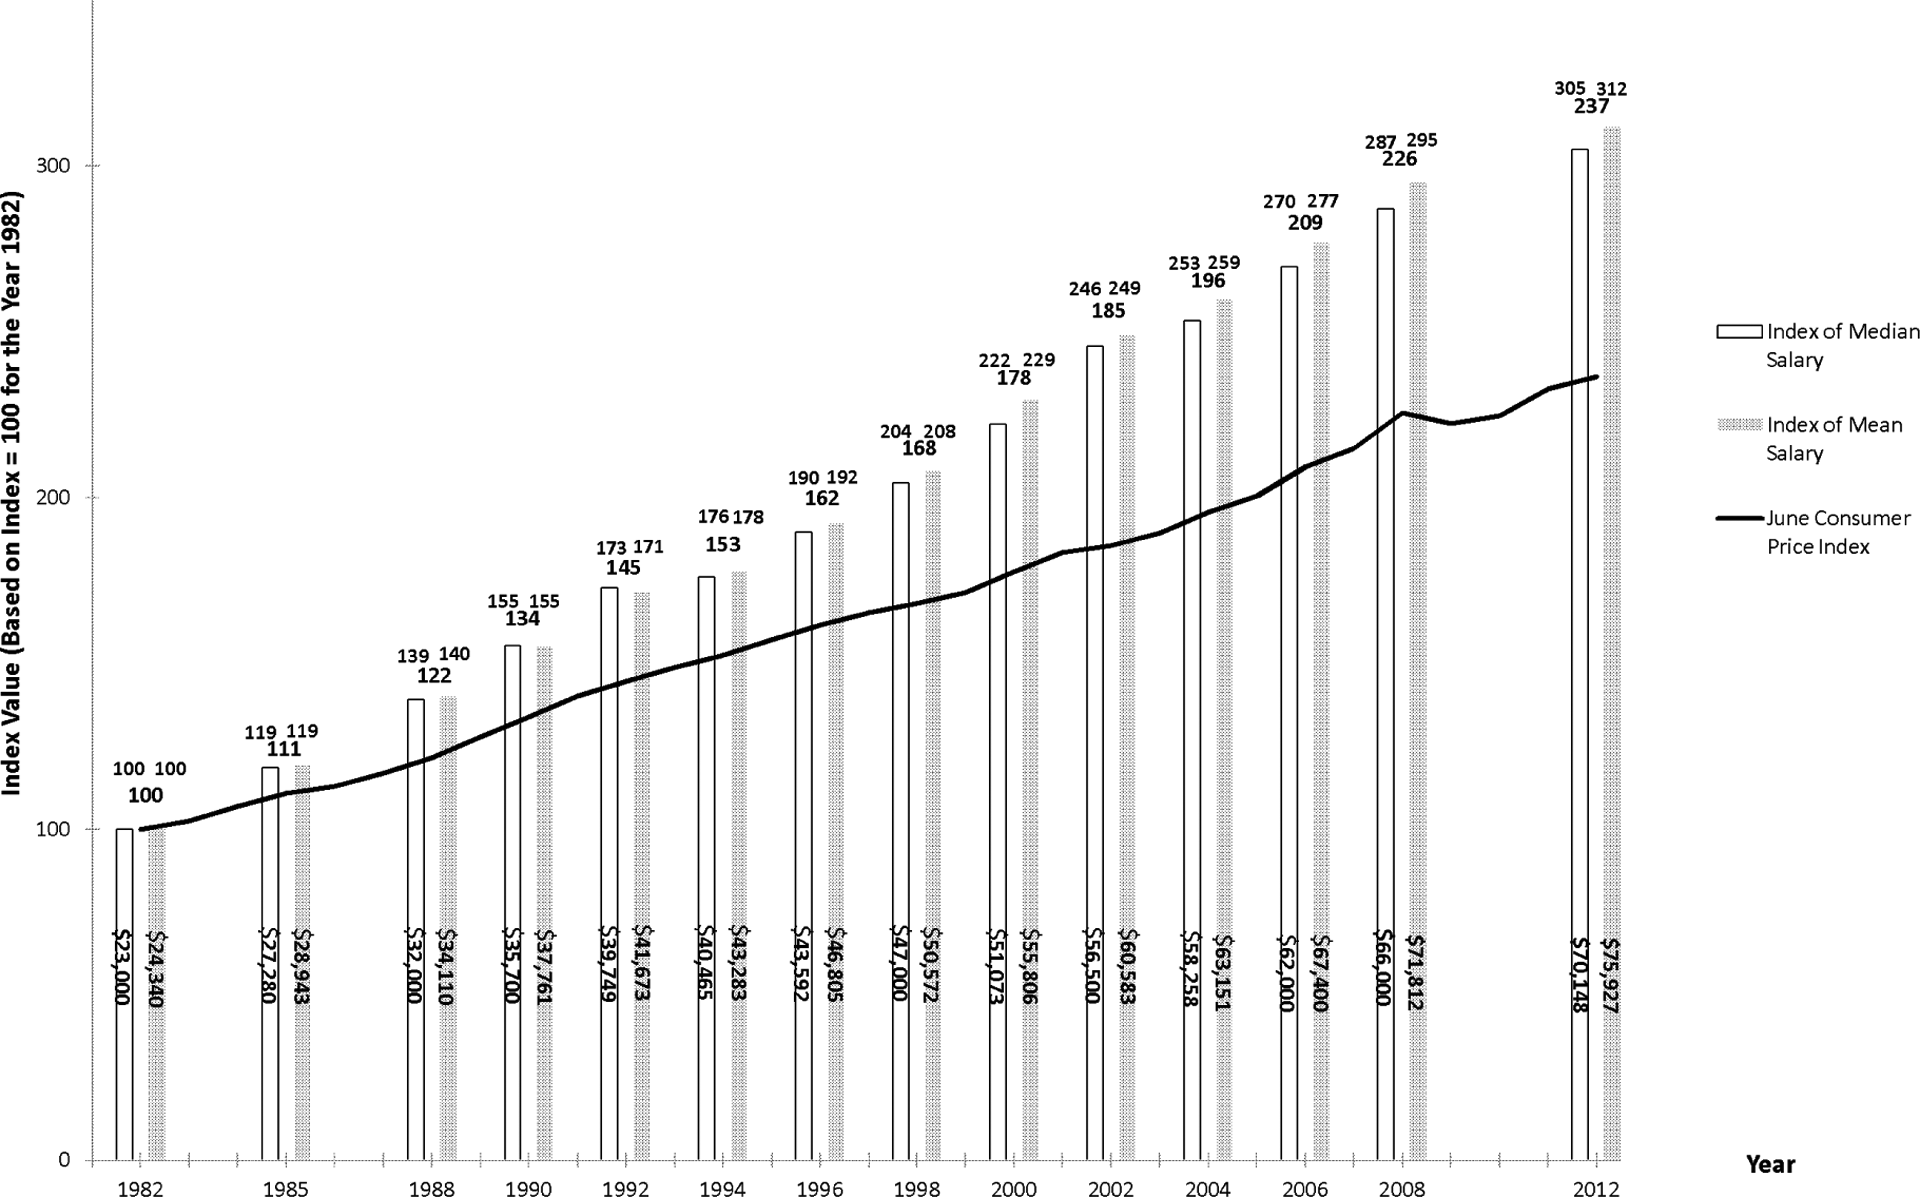
Despite our concerns about using the survey data to make comparisons over time, we plunge ahead with such comparisons. More specifically, we initially present in Figure 1 data on changes in median salary, mean salary, and the US Consumer Price Index (CPI) over the period from 1982 to 2012. 6
Change in Median Salary and Mean Salary Relative to Change in Consumer Price Index, 1982-2012.
For each of these, we have created an index, which we set equal to 100 for the year 1982. We then show the index value for each of these for succeeding years in which survey data are available. As an example, the median salary of $24,340 in 1982 corresponds to an assigned index value of 100. The median salary of $43,283 in 1994 has an index value of 178 since $43,283 is to $24,340 as 178 is to 100. Alternatively expressed, $43,283 is 78 percent above $24,340 and 178 is also 78 percent above 100.
Along with the index values, actual nominal (not inflation-corrected) numerical values for median salaries and mean salaries are shown within each year’s boxes.
For each year, the numerical values for mean salaries are higher than median salaries. As clearly shown by the index values, mean salaries have grown by a slightly higher percentage than median salaries over the period from 1982 to 2012, both have grown more sharply than the CPI. Subject to the methodological concerns expressed above, this real growth (higher than inflation) in salaries paid to the Survey respondents should be reassuring to Association members.
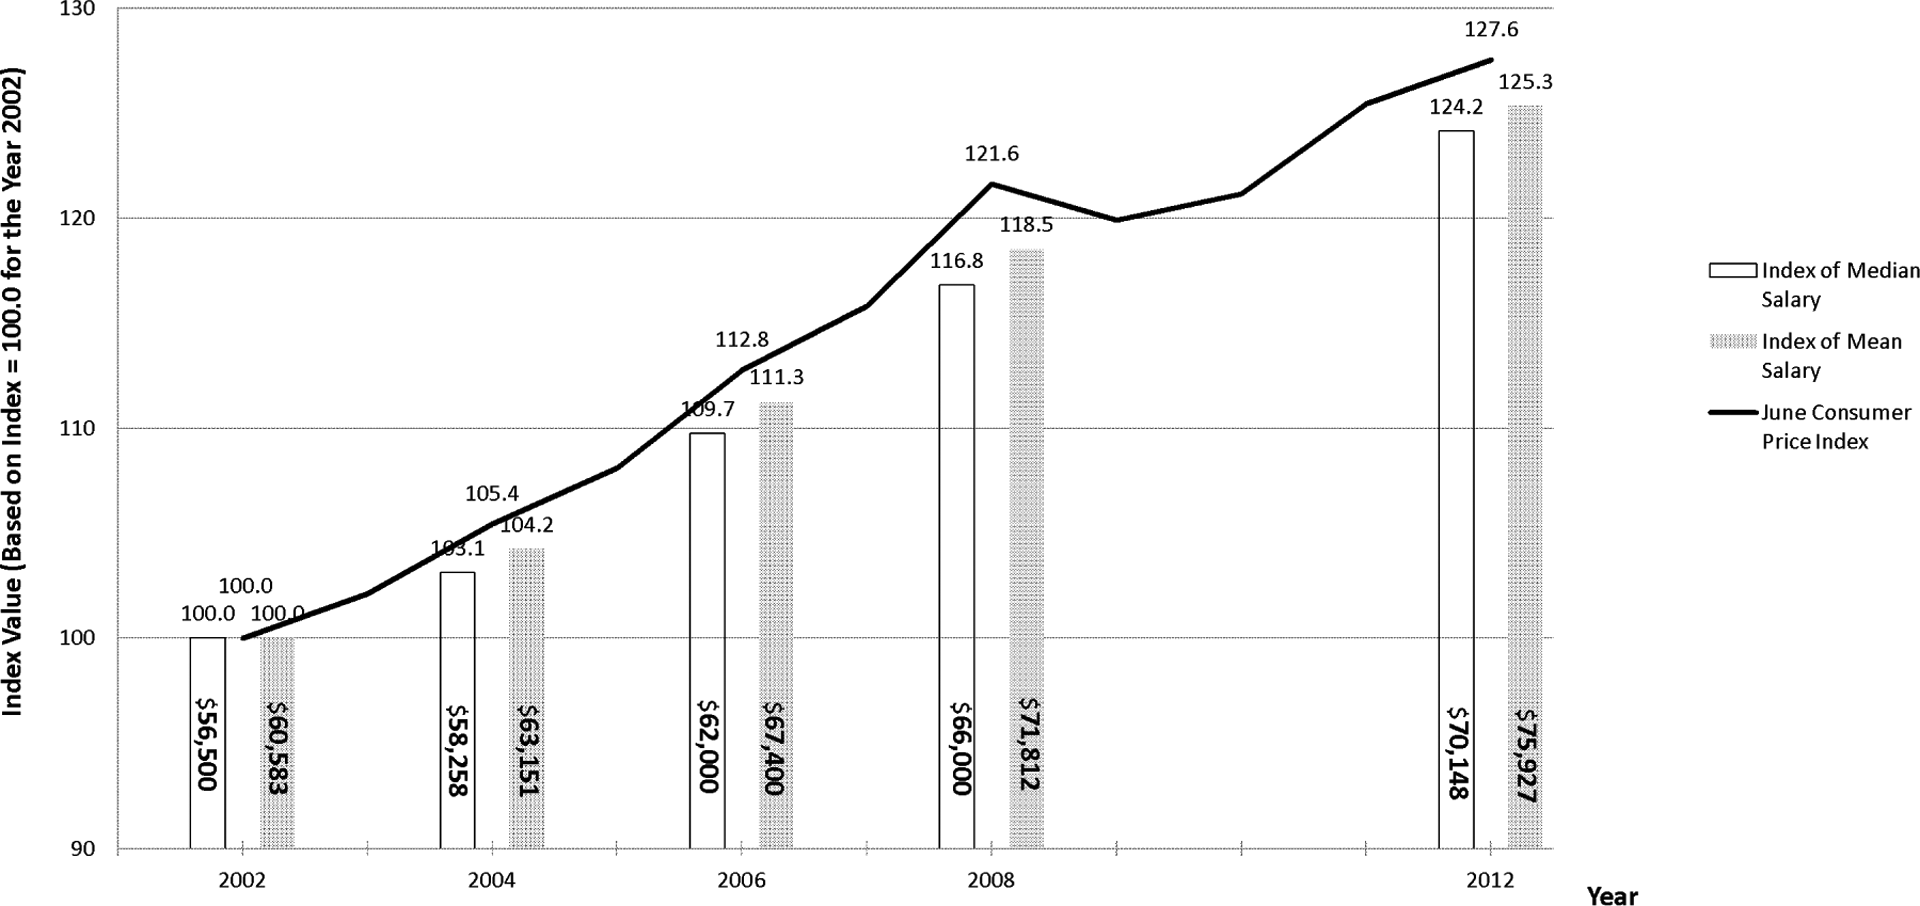
In Figure 2, a similar graph is presented using the year 2002 as the starting point. This allows one to more readily observe how salary increases have compared to CPI increases since 2002. In contrast to the longer time period from 1982 to 2012, the growth of median and mean salaries fell short of CPI increases from 2002 to 2012.
Change in Median Salary and Mean Salary Relative to Change in Consumer Price Index, 2002-2012.
In order to put all of the above results in further perspective, Table 2 extends the time period covered back to the 1970s and breaks the overall time period from 1982 to 2012 into two sub-periods: 1982 to 2002 and 2002 to 2012.
Response rates to SLA Salary Survey over time.
Change in Median Salary and Mean Salary Relative to Change in Consumer Price Index, 1970-2012 and Subperiods.
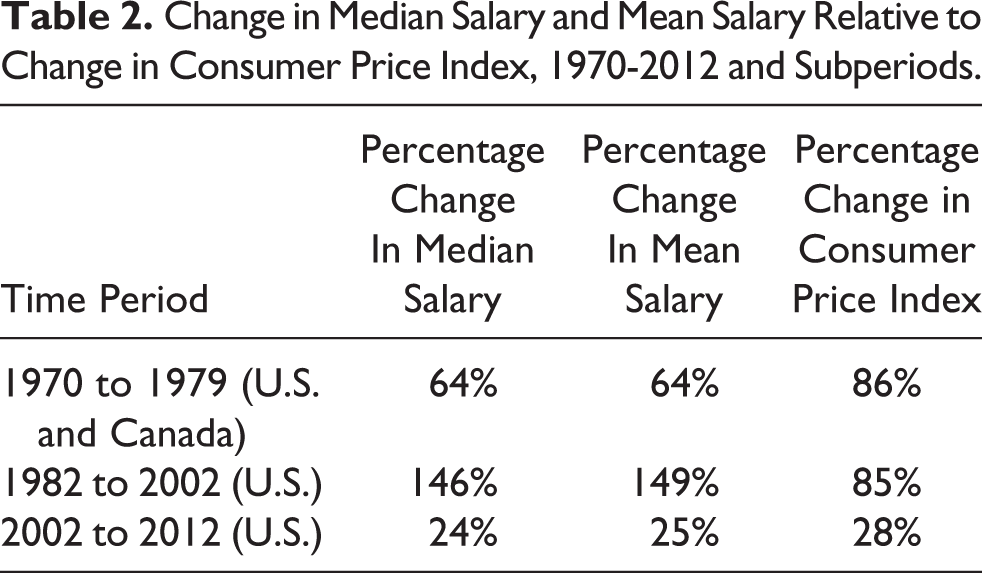
From 1982 to 2002, percentage increases in median (146 percent) and mean (149 percent) salaries sharply outpaced increases in the CPI (85 percent). The data from 1970 to 1979 reminds us that the real salary gains from 1982 to 2002 occurred against the backdrop of salary increases falling short of CPI increases from 1970 to 1979. 5 Further, the data from 2002 to 2012 reveals, corresponding to the previous graph, that salary increases have not quite kept pace with CPI increases over this most recent ten-year period.
Comparison of salaries paid to all librarians
The US Bureau of Labor Statistics collects data on salaries paid to various professionals in the Occupational Employment Statistics Tables. 7 Table 25-4021 - Librarians indicates $57,190 as the Mean salary for all types of librarians. The Table goes on to generate the average salaries of many types of librarians. The average salaries as noted in the “SLA Survey of 2012” are higher in all categories except for librarians in the Federal Executive Branch. Thus, members of SLA can be assured that their salaries on average are more than competitive in general in the library marketplace, at least for the 1,674 US members who responded to the most recent survey.
Librarians’ salaries compared to the salaries paid to other Master’s Degree recipients
The largest number of SLA members in the US is based in libraries that serve corporations. For a number of years, investigators have turned to the “NACE Salary Surveys” for a guide to the starting salaries paid to other Master’s Degree recipients. 8 Salaries paid to the holders of MBAs, Accounting, and Engineering Master’s Degrees start at $20,000-$30,000 higher than salaries paid to librarians. Unfortunately, in the absence of additional data on the information services side, starting salaries of those holders of MLS degrees who also hold a subject-specific degree, the authors must surmise that librarian salaries, in general, have not been able to keep up with, or catch up to, the salaries of those they serve.
It is often said in US corporations that your value is reflected in the salaries paid to various professionals at the organization. While salaries at most firms are confidential, people know roughly what you earn and/or whether you are bonus eligible and at what percentage. This perception of value translates into respect and, in many cases, the way you are treated and valued at the firm. Once again, we encourage organizations like SLA, American Society for Information Science & Technology (ASIST), Strategic and Competitive Intelligence Professionals (SCIP), American Association of Law Libraries (AALL), and Medical Library Association (MLA), as well as associations that represent special librarians in other countries, to aggressively collect and publish data that would better position our professions to compete in terms of salaries.
Having said all of this about salaries, the authors would be remiss if they did not note that there are many other advantages for choosing information services as a profession. Experience and research have shown that many factors contribute to someone’s job satisfaction including location, benefits (e.g. vacation time, health insurance, investment opportunities, etc.) working conditions, and hours. Admittedly, salary may not be everyone’s most important criterion.