
Abstract
As traffic simulation software becomes more effective for realistically simulating and analyzing traffic dynamics and vehicle interactions on the mesoscopic and microscopic level, the management, dissemination, and collaborative visualization of traffic simulation results produced by individual transportation planners presents a significant challenge. Existing online content management systems have a very limited capability in allowing users to query specific traffic simulation scenarios and geospatially visualize simulation results through shareable and interactive web interfaces. This paper presents a web-based application for promoting the archiving, sharing, and visualization of large-scale traffic simulation outputs. The application is developed to enhance cyber-physical controls, communications, and public education for collaborative transportation planning. Unique features of the web application include: (a) allowing users to upload their new traffic simulation scenarios (parameters and outputs), as well as search existing scenarios using easily accessible interfaces; (b) optimizing simulation output files with heterogeneous data formats and projected coordinate systems for web-based storage and management using a scalable and searchable data/metadata standard; (c) standardizing user-uploaded simulation outputs using web interfaces and data processing libraries with parallel computing capacity; and (d) providing shareable web visual interfaces for visualizing the traffic flow and signal information stored in simulation outputs (e.g., regional traffic patterns and individual vehicle interactions) and visually comparing multiple simulation outputs both spatially and temporally. The paper presents the conceptual design and implementation of this application, and demonstrates the application’s performance for sharing, comparing, and visualizing simulation outputs from VISSIM and SUMO, two commonly used traffic simulation software programs.
Keywords
Population growth and the associated rise in the number of vehicles have increased the intensity and frequency of urban traffic-related problems, such as traffic congestion, car accidents, parking shortage, and air pollution from high levels of emissions, in many cities around the world ( 1 , 2 ). Traffic simulation systems (models and software tools) have been developed and widely used for analyzing, designing, planning, and managing sophisticated urban transportation systems for years ( 1 ). Many of these simulation systems, such as VISSIM ( 3 ), TransModeler ( 4 ), Aimsun ( 5 ), Dynameq ( 6 ), CityPhi ( 7 ), and SUMO ( 8 ), are capable of modeling complex dynamics of traffic flow at multiple scales ( 9 , 10 ), and analyzing the performance of various traffic control strategies for specific traffic scenarios ( 11 ). Despite their usefulness in traffic modeling, most of these simulation models and tools have limitations in supporting the collaborative transportation planning, as well as raising public awareness and involvement in urban mobility management through soft measures ( 12 ).
These limitations can be attributed to many different factors, including (a) many stakeholders and decision makers involved in urban planning processes may not have the technical expertise (e.g., domain knowledge and programming experience) and research-based resources (e.g., computational devices and access to traffic simulation models) to properly configure a traffic simulation for a particular planning scenario ( 13 , 14 ); (b) the majority of traffic simulation models and software tools are implemented as desktop applications, limiting their use for dissemination of simulation outputs and sharing insights; and (c) many traffic simulation outputs contains high-resolution vehicle data sets with large spatiotemporal records for storing vehicle trajectories and attributes. As an example, a converted comma-separated values (CSV) file with stored SUMO traffic simulation outputs for a single traffic corridor during one-day’s time span can have a data size of 20 GB, making it challenging to share or visualize using the existing online content management system.
Based on the recent software engineering trend toward the modernization of desktop applications using next-generation web-based technologies ( 1 ), there is an important need for the development of a collaborative web-based environment that can facilitate the archiving, sharing, and visualization of large-scale outputs from various traffic simulation models and software tools. The environment should also serve as an easy-to-access medium for improving social learning, and collaborative planning ( 15 ). Through this web environment, technical users (e.g., urban and transportation planners) can discover, visually explore, inspect, and compare traffic simulation outputs produced by other technical users and learn from their experiences in simulation configuration and calibration.
This paper follows the vision and methodological aspects of generalized online content management systems and presents the conceptual design and implementation of a prototype web-based geospatial application for archiving, sharing, and visualizing traffic simulation outputs from VISSIM and SUMO models. The application is developed under a smart mobility project conducted by the Oak Ridge National Laboratory (ORNL) to address communications and control needs for efficiency-based connected and automated vehicles applications ( 16 ). The Real-Time Mobility Communication and Control System (RyThMiCCS) is a flexible and scalable cloud-based spatial framework that enables vehicle-to-vehicle (V2V) and vehicle-to-infrastructure (V2I) cellular communications, and also includes a range of visualization functions. The new web-based application was developed as an integral part of RyThMiCCS and is intended to function as an internal collaborative modeling tool that can facilitate the quality control of individual simulation scenarios, as well as the sharing of modeling experiences and model-driven insights among researchers at ORNL.
A future direction for the application is to serve as a cyber-physical system that can help increase public awareness and involvement in optimizing vehicle driving behavior in urban areas through the dissemination of model-driven insights. At the high level, the system is designed to educate project collaborators on the efficiency of a speed control algorithm developed by ORNL, which aims to optimize signal controls and reduce congestion at intersections. The speed control algorithm is embedded into multiple VISSIM-based simulated scenarios, and its effectiveness can be demonstrated to non-technical project collaborators and participants through easy-to-understand traffic flow visualizations. Through the web application, these collaborators from other transportation research institutes and industrial corporations are able to search, access, download, and visualize these simulation outputs, as well as visually compare simulation outputs with different simulation configuration parameters. The web application also incorporates a model application that is able to send the suggestions from the speed control algorithm to drivers and travelers.
In its current stage, the application is prototyped as a generic web-based medium for sharing, archiving, and visualization of user-defined simulation outputs. Developed with adaptive design, modular architecture, and a scalable NoSQL database, the application is generalizable and maintainable, and can be readily extended to store and manage outputs produced from traffic simulation models and software tools.
The paper is organized as follows. The second section introduces the research background and related work; the third section describes the conceptual design of the web-based application; the fourth section provides details of the system implementation; the fifth section demonstrates the web-based application’s ability to store, integrate, and visualize simulation outputs from VISSIM and SUMO simulation results in Chattanooga, Tennessee; and the final section concludes the paper with discussion and conclusions.
Background
In recent years, advances in information and communication technologies have significantly improved the performance and capabilities of web-based applications (or web apps) ( 17 ) for effective and integrated data management, analysis, visualization, and communication among stakeholders. A major advantage of web-based applications is that they can be accessed anywhere, anytime via smartphones and/or portable devices connected to the internet. With their readily accessible and interactive nature, web-based applications have become a medium well suited for sharing complex scientific concepts and insights (18, 19), and have served as reliable and interoperable information technology infrastructures (cyber infrastructure) for facilitating collaborative research, planning, and education in various scientific domains. Many past studies have developed web applications as online content management systems to improve the discovery, access, and preservation of user-based data and modeling outputs. Examples of these platforms include the EarthChem web portal in geoscience, and SWATShare and CUAHSI Hydroshare platform in hydroscience, and the SEAD platform in environmental science. In the transportation planning sector, several web-based applications have been developed as parts of the intelligent transportation system (ITS) vision to enable the situational awareness of diverse urban transportation systems (e.g., traffic volume and incidents, parking availability, and public transit operations) across a given city ( 20 – 22 ). These web-based applications provide a practical means to facilitate transportation data retrieval and integration, enhance data usability, and help optimize transportation decisions ( 23 , 24 ). Nevertheless, generic web-based content management systems for archiving, sharing, and visualizing traffic simulation results are still rare ( 25 ) because of several challenges to web application development, such as data standardization, big data processing, management and visualization, and mining and collaborative visualization of archived traffic data ( 26 , 27 ).
The overall conceptual design of the application is outlined in Figure 1. The application should impose an optimized data and metadata standard on archived traffic simulation outputs to make them readily searchable and accessible using both spatial queries (i.e., searching for vehicle trajectories produced by the traffic simulation within a user-defined bounding box) and control vocabularies, which describe the technical aspects of a simulation scenario, and rapidly transferable in the web environment. The target audience of the platform includes both technical (e.g., traffic modelers, and urban and transportation planners) and non-technical users (e.g., vehicle drivers). To fulfill these design requirements, the web application is devised: (i) to allow users to upload and publish their new traffic simulation scenarios (parameters and outputs) in a drag-and-drop manner, as well as to discover existing scenarios using multiple search criteria through easily accessible graphic user interfaces; (2) to integrate simulation output files with heterogeneous data formats and projected coordinate systems for web-based storage and management using a scalable and searchable data/metadata standard; and (3) to provide shareable web visual interfaces to visualize traffic dynamics at multiple scales (e.g., regional mobility patterns, individual vehicle interaction, and traffic signal phase and timing at intersections). By offering intuitive and user-friendly interfaces and easy-to-understand traffic flow visualizations (e.g., kernel density map and animated trail representation) that match the skills and expertise level of a non-technical user, the web application is able to convey model-driven insights (e.g., informed decision supports for optimizing traffic controls and suggestions for individual vehicle driving behaviors) to a broad audience of potential participants in the smart mobility vision.
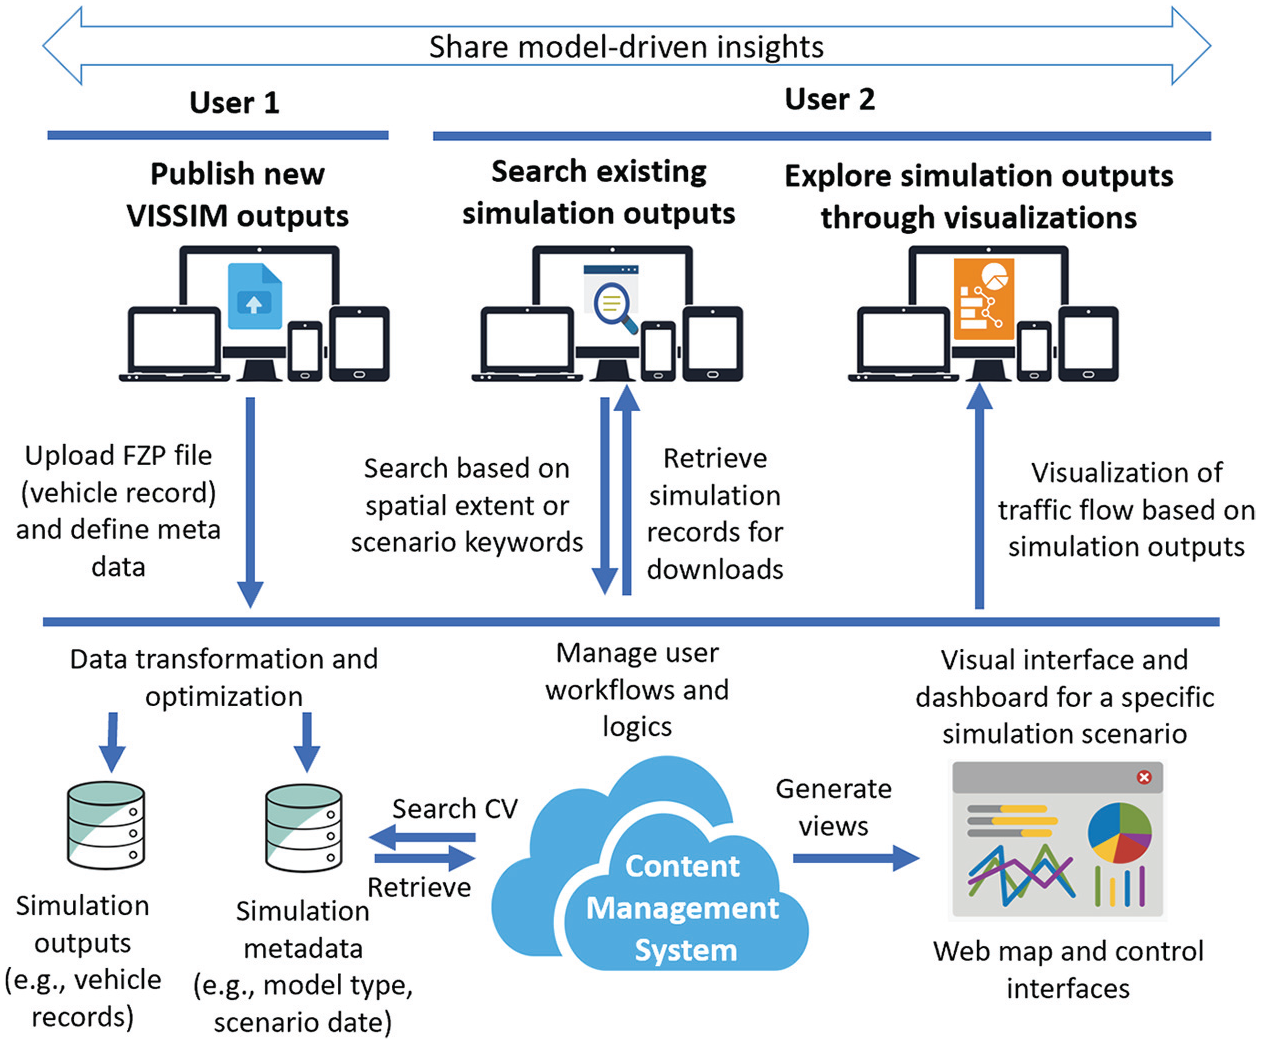
The system requirements are based on the user workflow. Some users add new simulation data and metadata which is transformed and added to the data store. All other users can then query the content management system for available simulation data and either download them, or visualize them on an interactive web map.
In this paper, VISSIM and SUMO simulation outputs are used to build a showcase for demonstration of the capabilities of the web application, while the web application is developed with adaptive data and metadata standards, which have the potential to support the management and sharing of other traffic simulation models. The following sections provide detailed descriptions of the data standardization process and the web platform’s design and implementation.
Data Standardization
Simulation outputs from different traffic simulation software are stored and described using heterogeneous data formats and projected coordinate systems. As an example, simulation outputs from SUMO are exported as CSV files, while simulation outputs from VISSIM normally consist of multiple types of files that store different information, such as FZP files for vehicle trajectories, LSA files for signal changes, and INP files for network information. Both SUMO and VISSIM use customized geographic projection systems to store vehicle trajectories. In VISSIM simulation outputs, spatial information, such as signal controller positions and vehicle trajectories, is stored using geocentric coordinate systems local to the control points and road networks used in the simulation scenario. This results in the heterogeneity of projection systems even among VISSIM simulation outputs that are developed using different road network data.
The heterogeneity in both output formats and geographic projection systems presents a significant challenge that can prevent the effective sharing of and centralized web access to these simulation outputs. As these simulation outputs use obsolete geographic projection systems that are native to the simulation software, conducting comparative visual analysis for visualizing and comparing these traffic simulation outputs, produced from both the same or different simulation models, can be very difficult using third-party GIS software.
In this study, an efficient data and metadata standard is devised to convert heterogeneous simulation outputs into an optimized web data format, which is derived from the well-known hierarchical JavaScript Object Notation (JSON) data structure. The design of the data and metadata standards is based on the following requirements:
Compatibility: It is paramount that the data management is compatible with all components. For RyThMiCCS, a combination of MatLab (simulation and vehicle speed controls interface for VISSIM), Python (data processing and simulation management), and JavaScript (client-side traffic visualization) is used.
Interoperability: Data formats and geographic projection systems should be commonly accepted by popular GIS tools.
Scalability: It has to be extensible to enable future additions to the system.
Efficiency: It should be brief and avoid unnecessary elements.
Searchability: It should be organized in the form of key-value pairs for fast retrieval of the data record based on various search criteria.
Intuitiveness: It should be intuitive to read and write.
Data streaming: It should support an optimized data streaming process for large-scale traffic visualizations on the client-side.
Performance: It should be optimized for web-based storage and data management.
The two base data formats that stand out as being easy to modify are CSV and JSON. CSV provides a tabular representation of the data. It is easy to edit manually with spreadsheet software and is very well understood. It can be read and modified using most programming languages, but it does not load into a native format in most languages, unless the data type for all columns is identical, and accessing specific elements is less straightforward. Moreover, it does not support hierarchical data, which means that hierarchical data requires data duplication, making it much more difficult to understand the hierarchical nature of the data structure when viewing the files. JSON is an open standard format for data storage and interchange, which is used by a diverse range of web applications ( 28 ). The format utilizes human-readable text to store data objects in a hierarchical structure using attribute-value pairs and array data types. The proposed data standard is only applied to the simulation output files that store vehicle trajectory and signal information. Other simulation output files are stored in their original format because they store non-spatial information (e.g., model configuration parameters and network information), which is not used for traffic visualization purposes. Since it allows nested properties, it provides an efficient way of storing hierarchical information. Manual editing is possible using any text editor, but it can be cumbersome. However, some web browsers offer JSON rendering, which makes it easy to view and understand the underlying hierarchy of a file. It is also very easy to read and write JSON files programmatically, and most languages have a native data structure (e.g., Python dictionaries) that can store this type of data and provide very easy access to all elements.
JSON was chosen as a base format, because (a) easy data access and modification in-code has a higher priority than manual editing; and (b) a hierarchical data representation is much more suitable for the data in question.
Vehicle Trajectory
The proposed data standardization is mainly developed to render uniform the format and geographic projection system of vehicle trajectories, which are exported as FZP files from VISSIM and CSV files from SUMO. Both file types rely on formats that use delimiters (e.g., semicolon in FZP and comma in CSV) to separate individual data records. Each record stores the information of a single vehicle at a specific simulation timestamp. In the proposed data standard, a JSON data structure is employed to group and hash vehicle records by their simulation timestamps and vehicle identity (ID), which are two essential fields in both VISSIM and SUMO outputs, in a hierarchical data structure. This implementation can reduce the redundancy of repeating fields, as all the grouped individual vehicle records share the same simulation timestamps and vehicle ID. An example of VISSIM simulation output in the proposed data standard is illustrated in Figure 2. The example is developed using the well-known “Urban Expressway Rome.IT - Rome A” simulation scenario, which is one of VISSIM’s default demonstration scenarios.
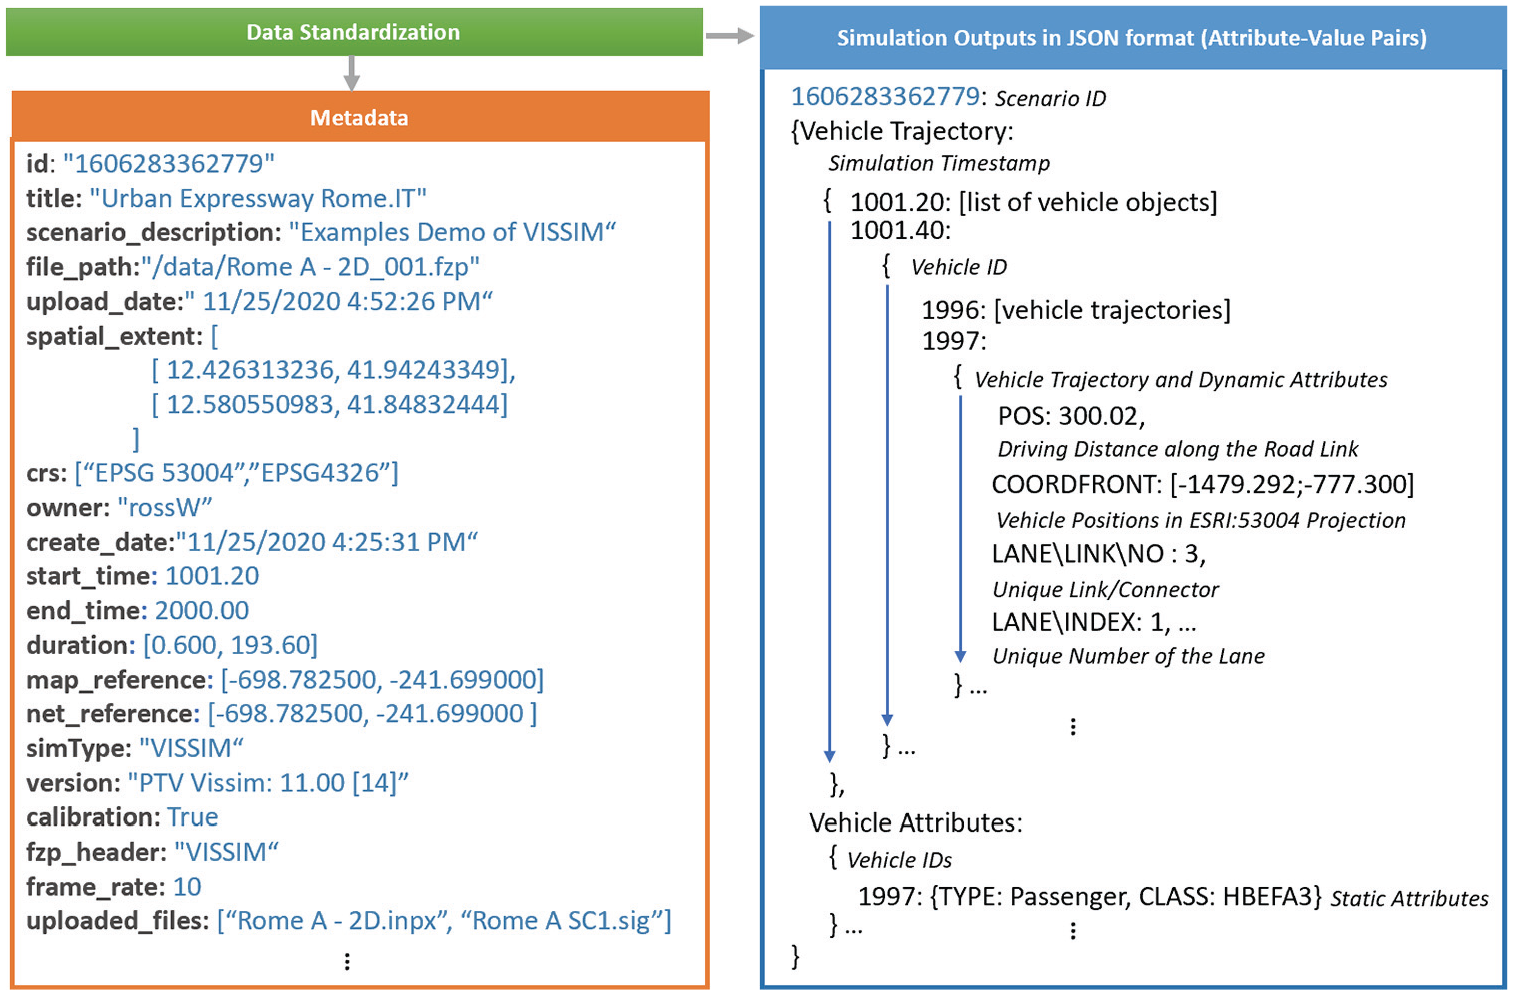
An example of VISSIM simulation output in JavaScript Object Notation (JSON)-based file format, which can easily represent metadata for simulation runs and prepare simulation outputs in an easy-to-access data structure using key-value pairs.
Data fields that are required for the data standardization process include simulation timestamp (
To optimize the storage size of the new data format, static data fields that are repeatedly stored in original simulation output files (e.g., vehicle type and class) are separated into a separated JSONdata store. The data store only records these static fields once per vehicle record, and hashes these attributes by their pertaining vehicle ID, serving as a look-up table for retrieving vehicle-related attributes. Two additional trigonometric attributes (driving direction and distance driven on a link) are also calculated to interpolate vehicle movements within the current timestamp. As an example, a CSV file that stores the output of a SUMO simulation was converted into the JSON-based data structure. The original file was 43 MB (including both the vehicle trajectory and static files), and the file size of the proposed data standard is 41 MB.
Metadata Standard
A metadata standard serves as a high-level requirement that establishes a common structure for understanding data, and ensures proper use, discovery, and interpretation of the data by its owners and users ( 29 ). In the proposed application, the metadata standard is developed based on the minimum requirement imposed by the ISO 19115 geospatial metadata standard ( 30 ), with the addition of a list of controlled vocabulary specific to the traffic simulation domain. The ISO 19115-derived section in the metadata standard aims to provide basic descriptions for geospatial data in a traffic simulation scenario. These descriptions include the simulation’s identification, spatial and temporal aspects (e.g., bounding box, simulation start and end times), and spatial reference (both its native geocentric projection systems and the WGS84 after the data standardization).
Many similar attributes in simulation outputs from different simulation models are described using different terminologies (e.g.,
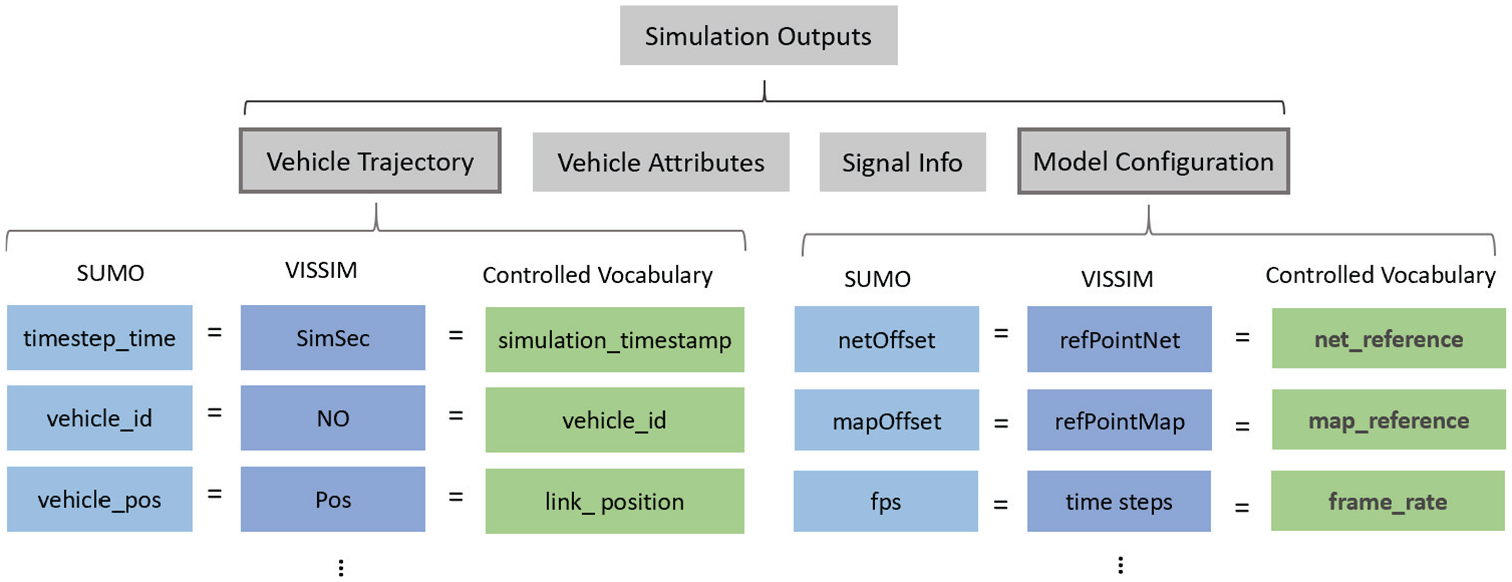
Examples of controlled vocabularies for standardizing simulation metadata from SUMO and VISSIM outputs.
System Design
The web-based application comprises both client-side and a server-side components (the term client-side represents the browser on the user’s smart device, while server-side indicates the server backing the web applications). As is common in most modern web-based platform development, the web application adopts a three-tier architecture with the following layers: (i) presentation; (ii) application; and (iii) data. Figure 4 illustrates the overall architecture, along with the web, informatics, and web visualization technologies that are associated with each layer.
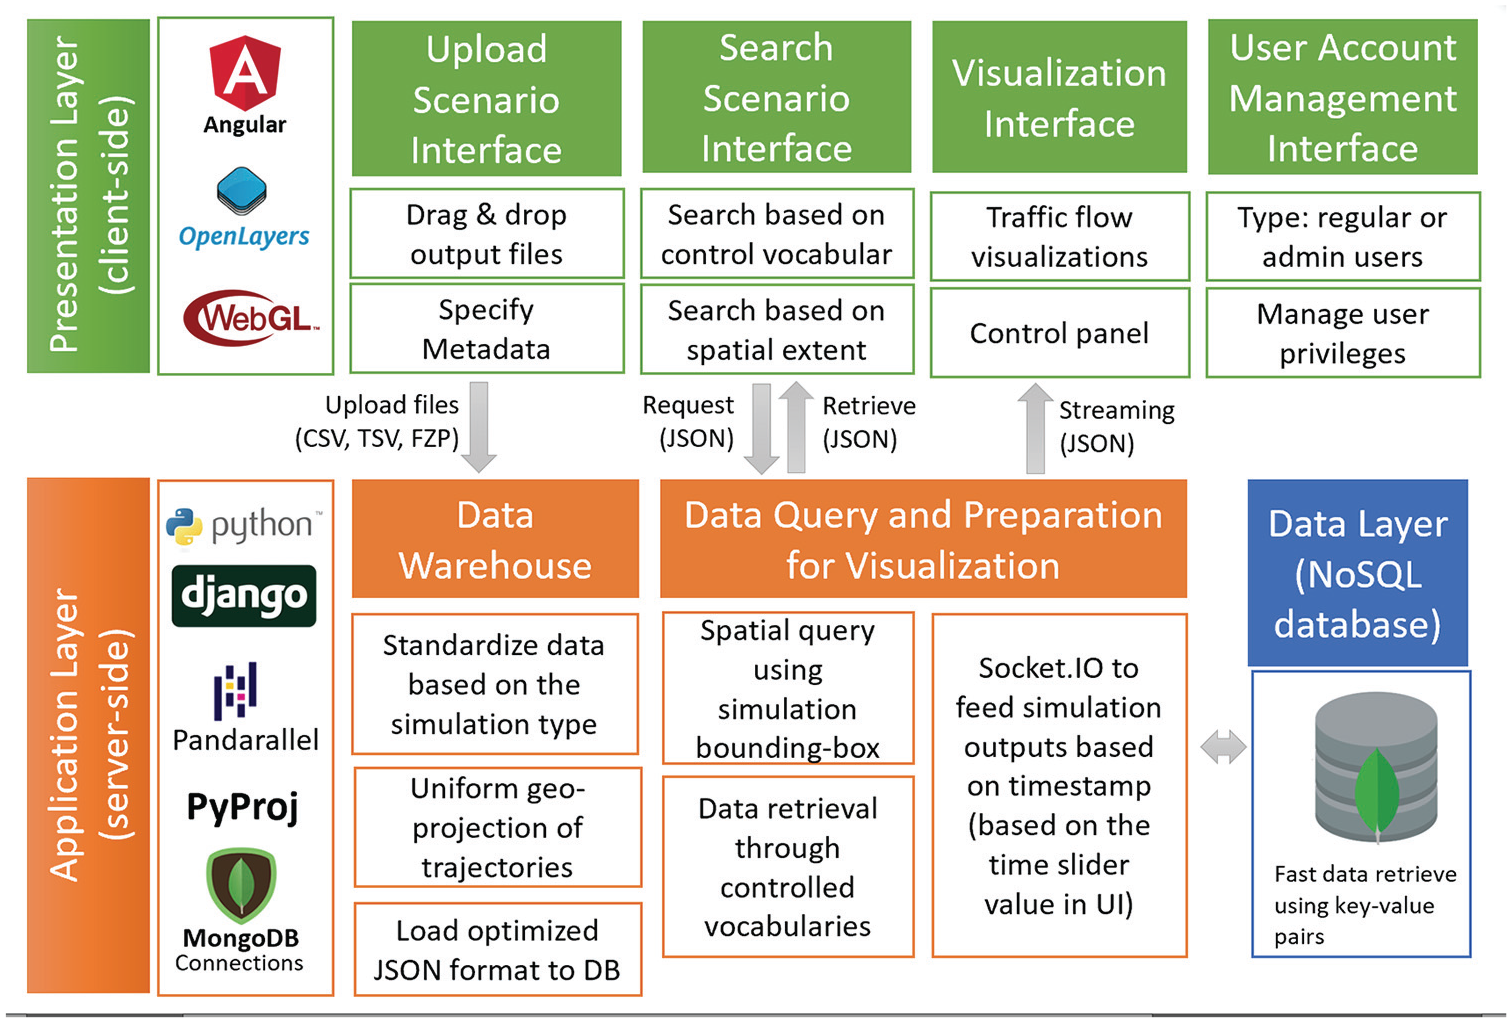
System architecture: the server-side foundation consists of the application and data layers. The application layer performs all data parsing, transformations, and queries. The data layer consists of a NoSQL database which provides efficient access to attribute-value pairs. On the client-side, the presentation layer uses a combination of Angular, OpenLayers, and WebGL to provide a fast and interactive user interface.
Presentation Layer
The presentation layer is primarily rendered in a user’s web or mobile browser on the client-side. It entails platform elements, such as graphic user interfaces (GUIs), web map engine, and data visualizations, that a user can see and interact with. This layer consists of four interface components that are designed to facilitate essential functionalities for (i) uploading new traffic simulation output files; (ii) searching previous scenarios; (iii) visualizing a selected traffic simulation scenario; and (iv) managing user accounts and privileges. These functionalities are grouped into different user workflows, which can be navigated and accessed through the web application’s landing page (as shown in Figure 5).
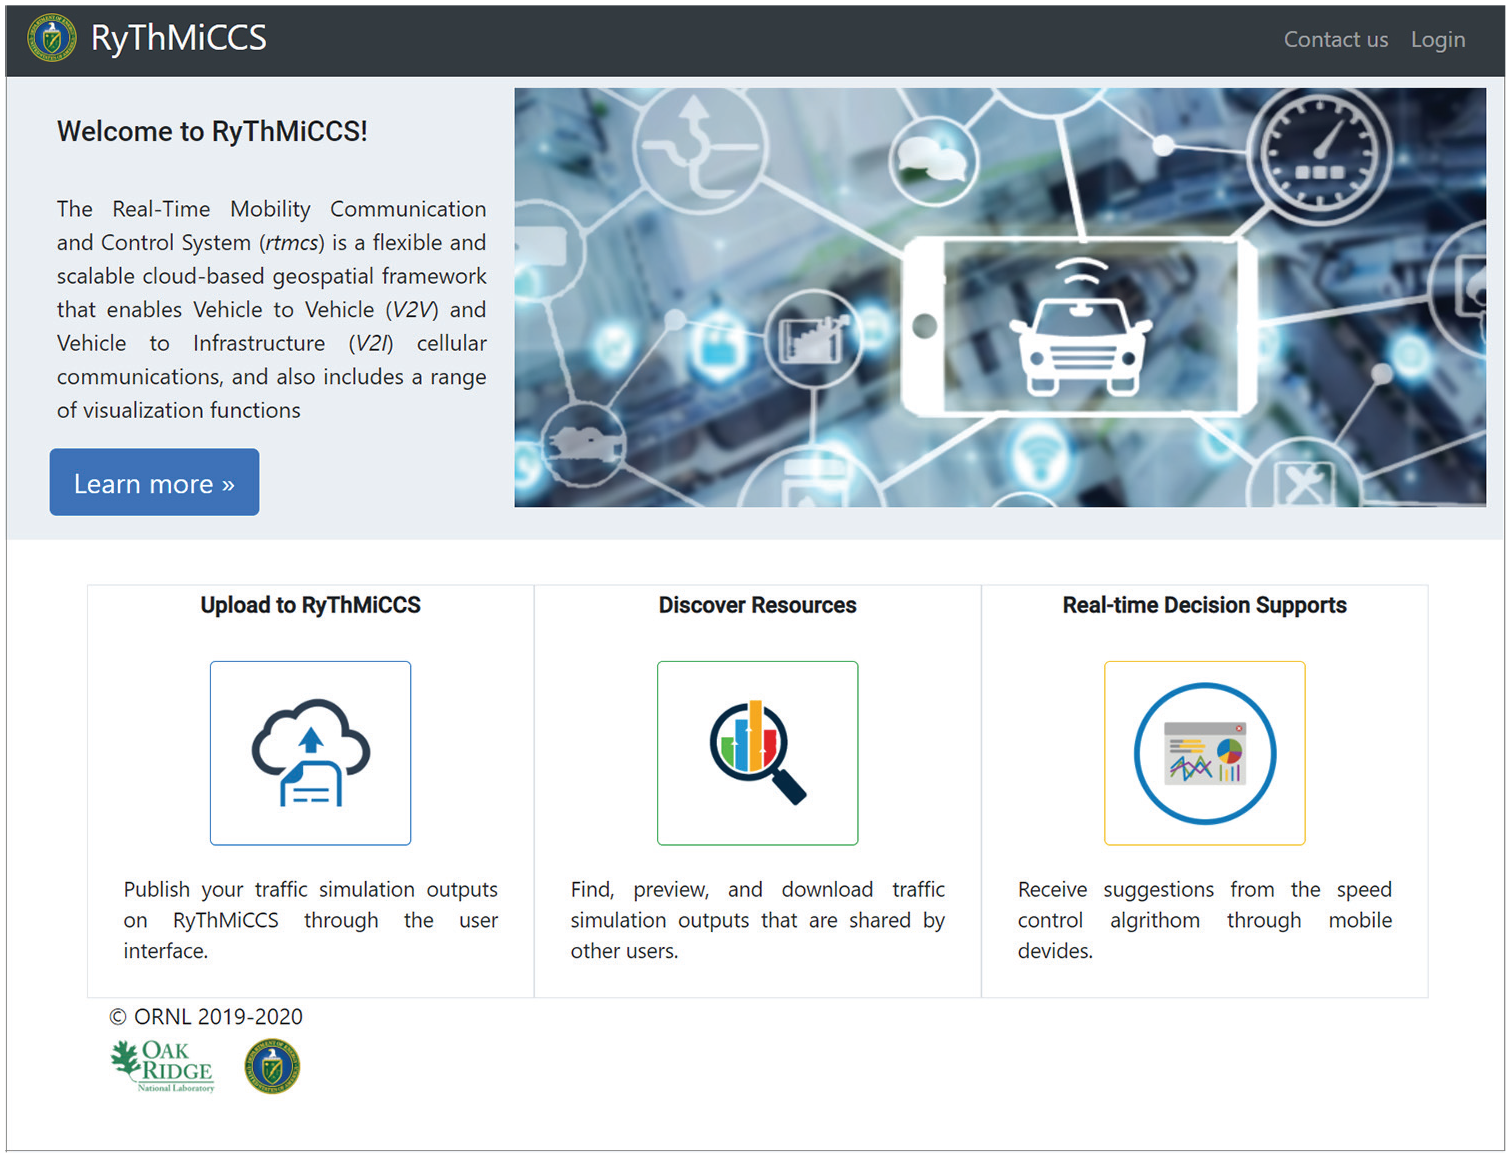
RyThMiCCS landing page. Three major tabs provide access to the application’s user workflows, which allow users to upload simulation outputs to RyThMiCCS, discover simulation resources that are shared by other users, and access real-time decision supports for optimizing the driving speed of individual vehicles.
Interface and User Workflows
This paper primarily describes the user workflow in Figure 5, a and b , which focus on the sharing, discovery, and visualization of simulation outputs and are detailed in the “User Workflow Demonstration” section. The GUIs and logical organization of different user workflows are developed using Angular, a web framework implemented with the Model-View-Viewmodel (MVVM) design pattern ( 31 ). The style of the interface is developed using Bootstrap libraries ( 32 ).
Traffic Flow Visualization
The traffic flow visualization embedded in the application consists of a web map and a control interface. The web map is developed using the OpenLayers JavaScript (JS) library and its extensions. The GUI is created using Bootstrap (providing arrangement and styling for the user interfaces) and typeahead.js (offering auto-complete search capability via a search box for querying existing simulation scenarios), which guarantees both user interactivity and compatibility for multi-screen sizes. The traffic flow visualization tool is developed using WebGL, a JavaScript application programming interface (API) that can render high-performance interactive two- and three-dimensional graphics within any compatible web browser. WebGL is later integrated with the OpenLayers map engine to visualize vehicle trajectories and attributes stored in the traffic simulation outputs that are archived in the application.
WebGL generates a continuous traffic flow visualization by interpolating individual vehicle movements between two geographic coordinates that describe the vehicle position between two simulation timestamps. A simple linear interpolation technique is adopted which was developed to generate continuous traffic flow animations using discrete vehicle GPS coordinates by Gomes et al. ( 33 ). In this setting, the frame rate of the traffic flow visualization is not limited to the frame rate of the simulation output but is controlled by the interpolation frequency of the vehicle movements. This frequency’s default value is 100 frames per second and it can be modified by the user through a visualization configuration interface.
It is challenging to maximize the performance of the traffic flow visualization for large-scale, long-duration traffic simulation, which involves a tremendous amount of vehicles at every simulation timestamp. To address this challenge, an optimized data streaming technique is developed that recursively and selectively sends a subset of vehicle trajectory information whose simulation timestamp is closest to the animation’s playing timestamp. The proposed data stream takes advantage of the attribute-value pairs that hash individual vehicle trajectory information using its simulation timestamp for fast retrieval of the data. This implementation avoids a one-time transfer of the entire vehicle trajectory information in the simulation output file, whose large size may cause the client-side application to crash. Mode details of this data streaming strategy are provided in the “Real-Time Data Streaming” section below.
Application Layer
Unlike the presentation layer, the application layer is deployed on the server-side and is designed to provide various web services for data standardization, ingestion, queries, and retrieval. As the core component of the data standardization and ingestion process, the Extract, Transform, Load (ETL) procedure (illustrated in Figure 6) consists of the following steps: (i) extract data from user-uploaded traffic simulation output files (including vehicle trajectories, simulation configuration parameters, traffic signal timing, etc.) as plain text; (ii) transform extracted contents (as plain text) into the proposed data format and convert vehicle coordinates from simulation-native geocentric projection systems to the WGS84 World Geodetic System; and (iii) load the transformed data and metadata into a NoSQL database deployed in the data layer as a new traffic simulation scenario. Subsequently, the ETL procedure requires the development of the following components in the application layer: (i) web services to build a two-way data exchange bridge between the client-side presentation layer to the server-side data layer; (ii) data serializers that validate user-uploaded files; and (iii) web API that are connected with data processing libraries to standardize user-uploaded outputs.
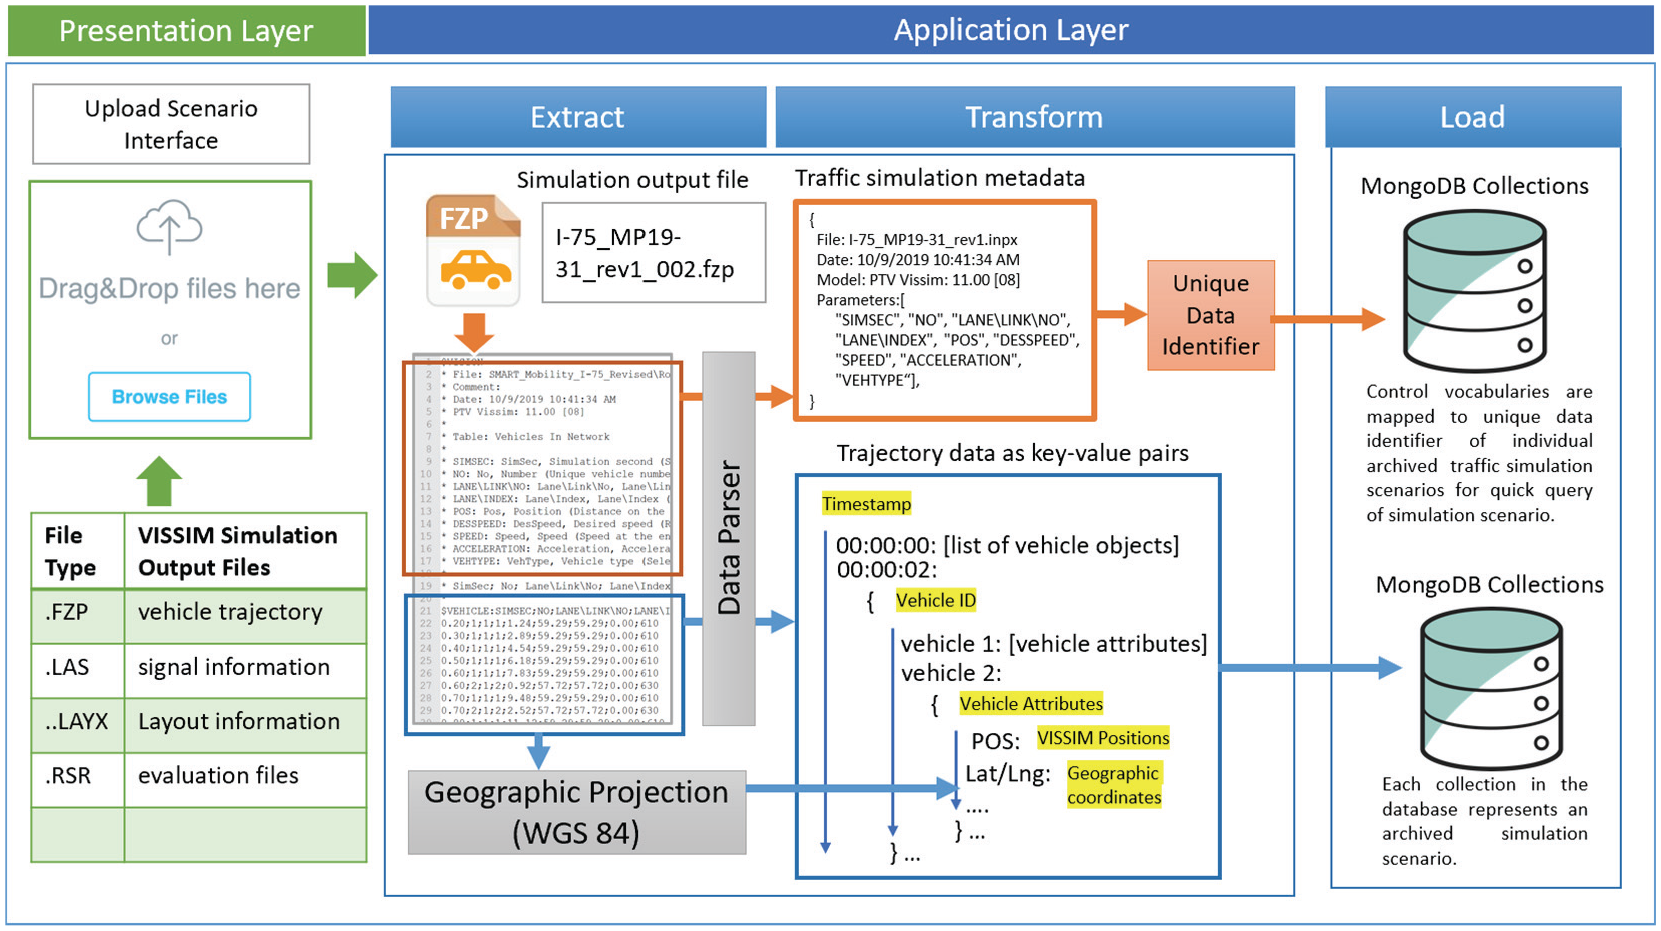
Data workflow for ingestion and transformation of simulation results. Users upload simulation outputs via the web interface. On the server-side, the data are extracted and transformed into the required formats: metadata and simulation outputs are parsed and transformed into the required JavaScript Object Notation (JSON) format. In addition, the simulation coordinates are projected into the World Geodetic System 1984 (WGS84) for geospatial visualization. Finally, the data are added to the database.
Web services that enable the two-way data exchange bridge are primarily used for (i) uploading user-defined data from the presentation layer to the data layer; (ii) performing data query and retrieval of existing simulation scenarios archived in the data layer; and (iii) allowing the user to conduct “create, read, update, and delete” (CRUD) operations in the data layer. In addition to the data query, the application layer also provides a web service to generate a list of available simulation scenarios. It displays each scenario’s unique ID and search metadata, which can be used to retrieve the full record of the scenario through the attribute-value pairs.
Implementation and Performance
In an early prototype, server-side JavaScript frameworks (NodeJS and Express JS) was used to develop the application layer, aiming to set up a “Socket.IO, Angular, and Node.js” web stack that allows real-time data streaming between the application and the presentation layers. Despite its powerful data streaming and two-way data binding capabilities, NodeJS runs single-threadedly and is not suitable for performing the ETL procedure on large simulation outputs. Therefore, the application layer was redesigned using Django, a popular Python web framework ( 34 ), to enhance the application layer’s performance for processing and handling large simulation files. It was decided to use Django for the following reasons: (i) As a Python framework, Django supports the integration of advanced Python data analysis libraries, such as Pandarallel ( 35 ) and Koalas ( 36 , 37 ), which enables parallel computing (through multi-threaded codes) to speed up the ETL procedure; (ii) the framework adopts a model-view-controller (MVC) software architectural pattern, which promotes the maintainability, flexibility, and modularity of the code during a web application development; (iii) Django is a well-developed framework that provides robust packages (e.g., data serializers, API views, and concurrency management of CRUD operations) for building reliable web services; (iv) the framework can incorporate many Python-based geo-processing libraries (e.g., PyProj, GDAL, and ArcPy) to perform spatial analyses and geocentric-geodetic coordinate conversions dynamically through web APIs; and (v) the Django framework is compatible with the WebSocket internet protocol, which allows full duplex communication between the server and clients. This communication provides a solid foundation for fast and timely retrieval of large simulation outputs from the database for smooth traffic flow visualization at the front-end.
Experiments were conducted using four combinations of data analysis and spatial projection libraries and their processing speeds for standardizing and ingesting large simulation outputs files were compared. Three VISSIM simulation outputs with file size of 158 MB were processed in these experiments on a Linux machine with 32 VCPUs, and 32 GB random-access memory (RAM). Based on the quantitative testing results (summarized in Table 1), the combination of Pandarallel library and a homegrown Python projection function was selected for the application. A combination of Pandas and Pandarallel is responsible for transforming the raw outputs into the proposed data standard. The lightweight homegrown Python projection function, which was developed using equations in Snyder ( 38 ), out-performed the PyProj projection library in converting native geocentric vehicle coordinates into WGS84.
Running Times for Data Standardization and Ingestion
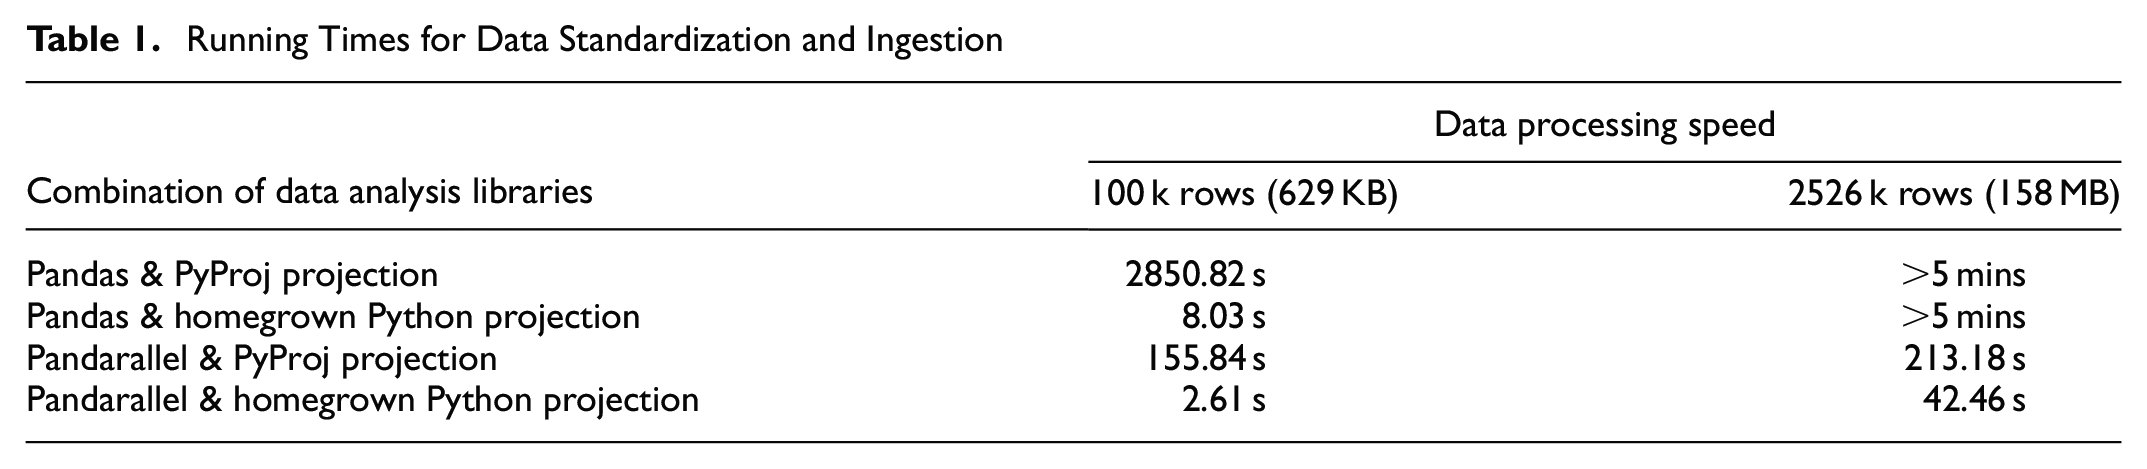
In case of ingesting a large simulation output, such as a 20 GB SUMO simulation file (in CSV format) that contains a full day of traffic simulation for the whole of Chattanooga in Tennessee, the data layer would partition the original output files into multiple files of 150 MB and perform the data standardization separately. With the existing server hardware specification, it takes around 6.2 h to standardize a 20 GB CSV file exported from a SUMO simulation. As the system is currently used by ORNL researchers and their collaborators, it is not expected that many loads would exceed this level. In the future, the authors plan to package the Django back-end using Docker and NGINX, which provide load-balancing capability, and migrate the platform to a cloud service provider.
Software and Hardware Requirements
The back-end of the application was developed using open-source web technologies and did not require any licensed software or a specific operating system for deploying the application on a physical server. The application does not have any specific requirement for hardware and can be readily deployed on any modern server. A recommended minimum requirement for a decent system performance is based on the hardware specification of the prototype server environment, which is a Windows machine with 8-thread Intel core i7 8665u processors and 16 GB of RAM. This gave a decent performance for data standardization and ingestion using the Pandarallel library and homegrown Python projection function bundle, which took about 303 s to process 158 MB of data.
Data Layer
Data layer was deployed on the server-side, and it employed MongoDB, an open-source NoSQL database with flexible schemas ( 39 ), to store and archive traffic simulation output files that were uploaded by users and converted into JSON format.
Data Storage
NoSQL was chosen for data storage because the proposed data standard is based on the JSON data structure, which is a standard data model in NoSQL databases. Furthermore, data queries in the current application do not involve complex logic and relationships. Instead, most query and retrieval is performed in the fashion of attribute-value pairs using the controlled vocabularies (e.g., finding all simulation outputs that are produced by VISSIM and uploaded by a specific platform user), which is well suited for NoSQL. The application also requires fast data retrieval by simulation timestamp for visualizing large simulation outputs, which can be achieved through the attribute-value pairs in a NoSQL data structure. MongoDB is a type of NoSQL database that is proven to be scalable ( 40 ). It allows each data record to carry different attributes, which can be beneficial for storing simulation outputs from several different traffic simulators (e.g., SUMO and VISSIM) with different sets of parameters. Finally, MongoDB supports spatial query by performing spherical surface calculations on legacy coordinate pairs via a two-dimensional sphere spatial index. The index is created by converting the spatial coordinate to the GeoJSON Point type ( 39 ), which is a JSON-based standard for geographic data.
In addition, a file system is employed on the server to store supplementary files that are associated with each simulation output. Unlike the vehicle records and signal change files, these supplementary files are not intended to be visualized through the traffic flow visualization. Examples of these files include INPX files, which store model and network setting parameters (e.g., driving behaviors, vehicle compositions, network reference, and link behavior types), and A00 and ERR files for describing model evaluation information ( 41 ). These files are stored in their original formats with their file path documented in their pertaining simulation scenario’s metadata. Other users are able to download these files from the application’s interface.
Data Query
For searching for a specific simulation scenario, the main query is performed on the metadata collection that describes the uploaded simulation outputs within the MongoDB. The query is automatically generated in the data layer within the model component of the Django framework through its object-relational mapping technique. It uses search criteria defined by the user through the resource discovery page. Currently, the options for defining search criteria are developed based on the pre-defined controlled vocabularies. Many vocabularies are used to index archived simulation scenarios in the database. The control vocabulary-based indices are stored in the MongoDB collection for managing simulation metadata in the data layer, and these control vocabularies are individually mapped to an array of unique identifiers that point to existing simulation outputs archived in the system.
Big data visualization platforms, such as Kibana and Grafaba, allow users to search for data based on customized queries. A similar feature can be implemented in the proposed application by taking advantage of the objective-relation mapping feature provided by the Django framework, which allows the application layer to interpret customized queries defined by users and perform corresponding data query and retrieval actions. The execution time of a query to list available simulation outputs based on controlled vocabularies (e.g., outputs of SUMO uploaded by a specific user), and retrieving a specific record using its primary key is between 23 and 58 ms. Fifty tests were performed using the .explain(executionStats) command after each MongoDB query.
Real-Time Data Streaming
Data streaming is implemented using both the standard HTTP request, which allows a one-time data transfer for simulation scenarios with short duration, as well as the Socket.IO protocol, which is able to emit the timestamp-specific simulation data based on the visualization progress (the animation timestamp displayed in the time-slider next to the web map) every 3 to 10 s. Although the animation of vehicle trajectories and movements is rendered on the client-side through WebGL, it is relying on and optimized by the real-time data streaming strategy. This strategy takes advantage of the JSON-based data standard and enables fast retrieval of the vehicle position information with a specific range of simulation timestamps. In this regard, the WebGL-based visualization component on the front-end would recursively require the vehicle trajectory information, whose simulation timestamps are close to the current animation timestamp. For example, if the animation timestamp on the client-side is at 208 s, the visualization component stores the previously requested trajectory information that covers the animation from 205 to 210 s and will request the data layer to send vehicle trajectory coordinates of consecutive simulation timestamps ranging from 210 to 215 s (5 s ahead of the current simulation progress). Once these coordinates are received by the client-side, the visualization component will merge these coordinates with information of previous timestamps (205–210 s) and apply the linear interpolation technique (described in the “Traffic Flow Visualization” section, above) to render continuous vehicle movements. The 2 s difference between 208 and 210 s accounts for the possibility of latency caused by the data transfer process.
User Workflow Demonstration
This section mainly presents the user workflows to (i) upload simulation outputs to the RyThMiCCS and (ii) discover simulation resources that are shared by other users. At the end of these workflows, users can trigger the traffic flow visualization feature to preview and visually examine the simulation outputs that they uploaded to the web application or retrieved through the resource discovery functionality.
Data Upload and Resource Discovery
By clicking the “Upload to RyThMiCCS” icon on the landing page (shown in Figure 5), the user will be navigated to a file-uploading interface (as shown in Figure 7), where users can publish a simulation scenario and upload all the scenario-related files to the data layer of the web application. Figure 7 provides an example showing that the user is uploading both the FZP (vehicle trajectories) and LSA (signal information) files of a VISSIM simulation, named Shallowford Rd AM NetworkREV_PR20 to the application. The network and map reference fields on the right side of the interface, displayed in the textbox next to the “upload file” button, are automatically generated by a client-side script that extracts information from the output files’ metadata. Many of the metadata fields applied by the application were automatically extracted from different types of simulation output files uploaded by the user. Metadata that cannot be found from the uploaded files will be labeled as Null in the metadata record of the defined simulation scenario.
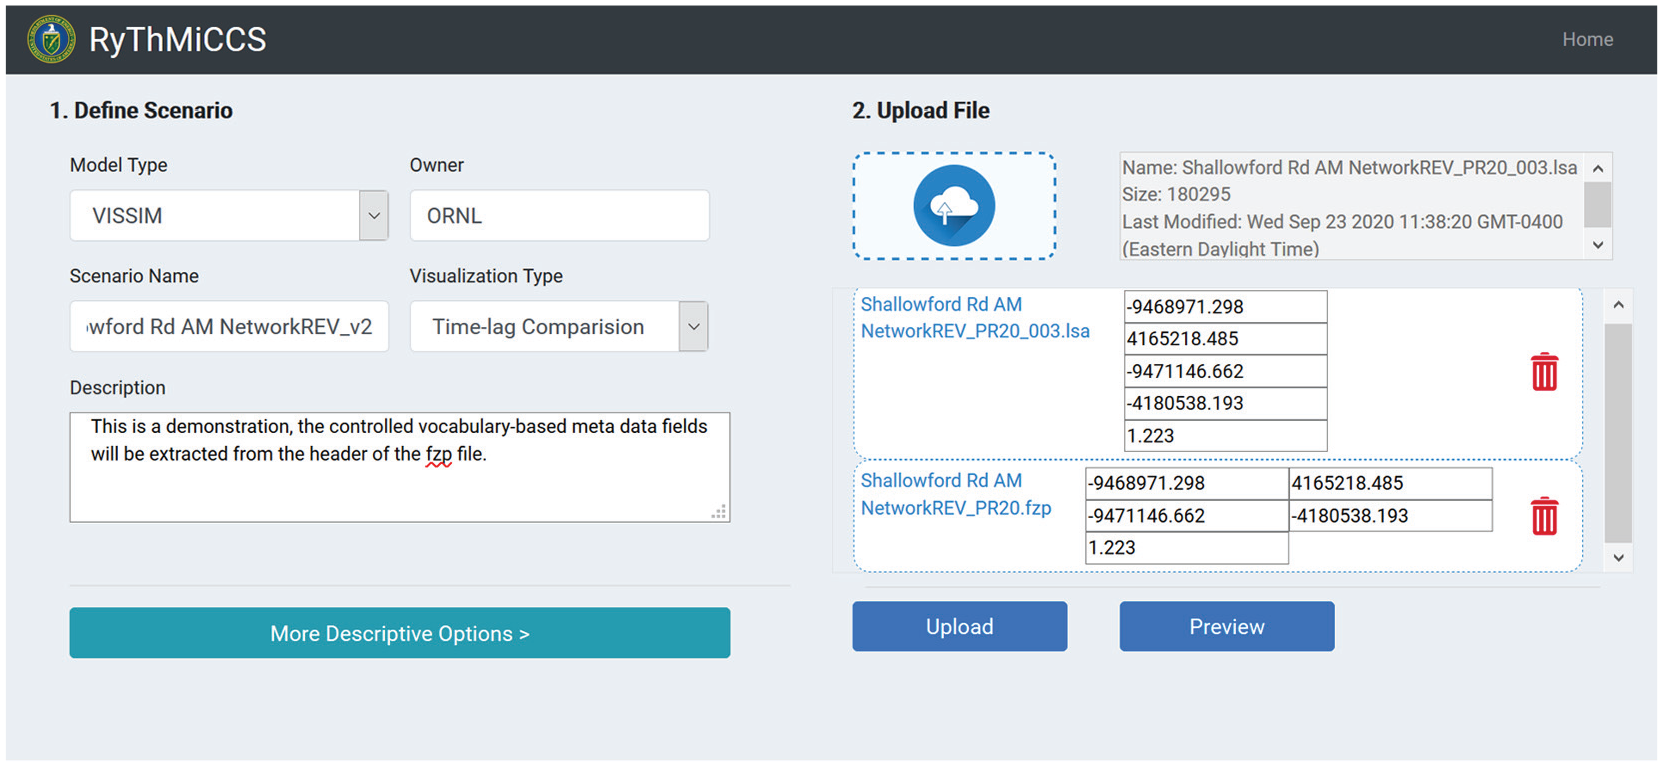
The simulation upload interface allows a user to drag-and-drop multiple files into our application, manage the uploaded files, and define customized metadata fields for describing the uploaded simulation scenario. In this example, a vehicle records and a signal changes file are being uploaded to the system.
After the output files are dragged and dropped into the interface, the user can click the blue “preview” button to visualize the traffic flow through the platform’s visualization capability, which is detailed in the “Basic Traffic Flow Visualization” section below.
The resource discovery interface can be accessed through the “Discover Resources” icon on the landing page (Figure 5). This interface (as shown in Figure 8) allows users to identify available simulation outputs based on both the spatial query and various search criteria listed on the left side of the interface. The spatial query is performed using the area of interest defined by the user through a data upload interface. The interface allows users to define a spatial boundary by adjusting the map extent of an interactive web map or creating a buffer area around a specific address through a geo-coding enabled search bar. In this setting, the user is able to zoom and pan the web map to a specific road or corridor and query all previous simulation scenarios that were conducted within the extent of the map view. The actual spatial query is performed within the MongoDB database in the data layer. Query results are then displayed in a tabular format in the interface, allowing users to select a single or multiple archive simulation records for downloading, visualizing basic traffic flow, and comparative visual analysis purposes.
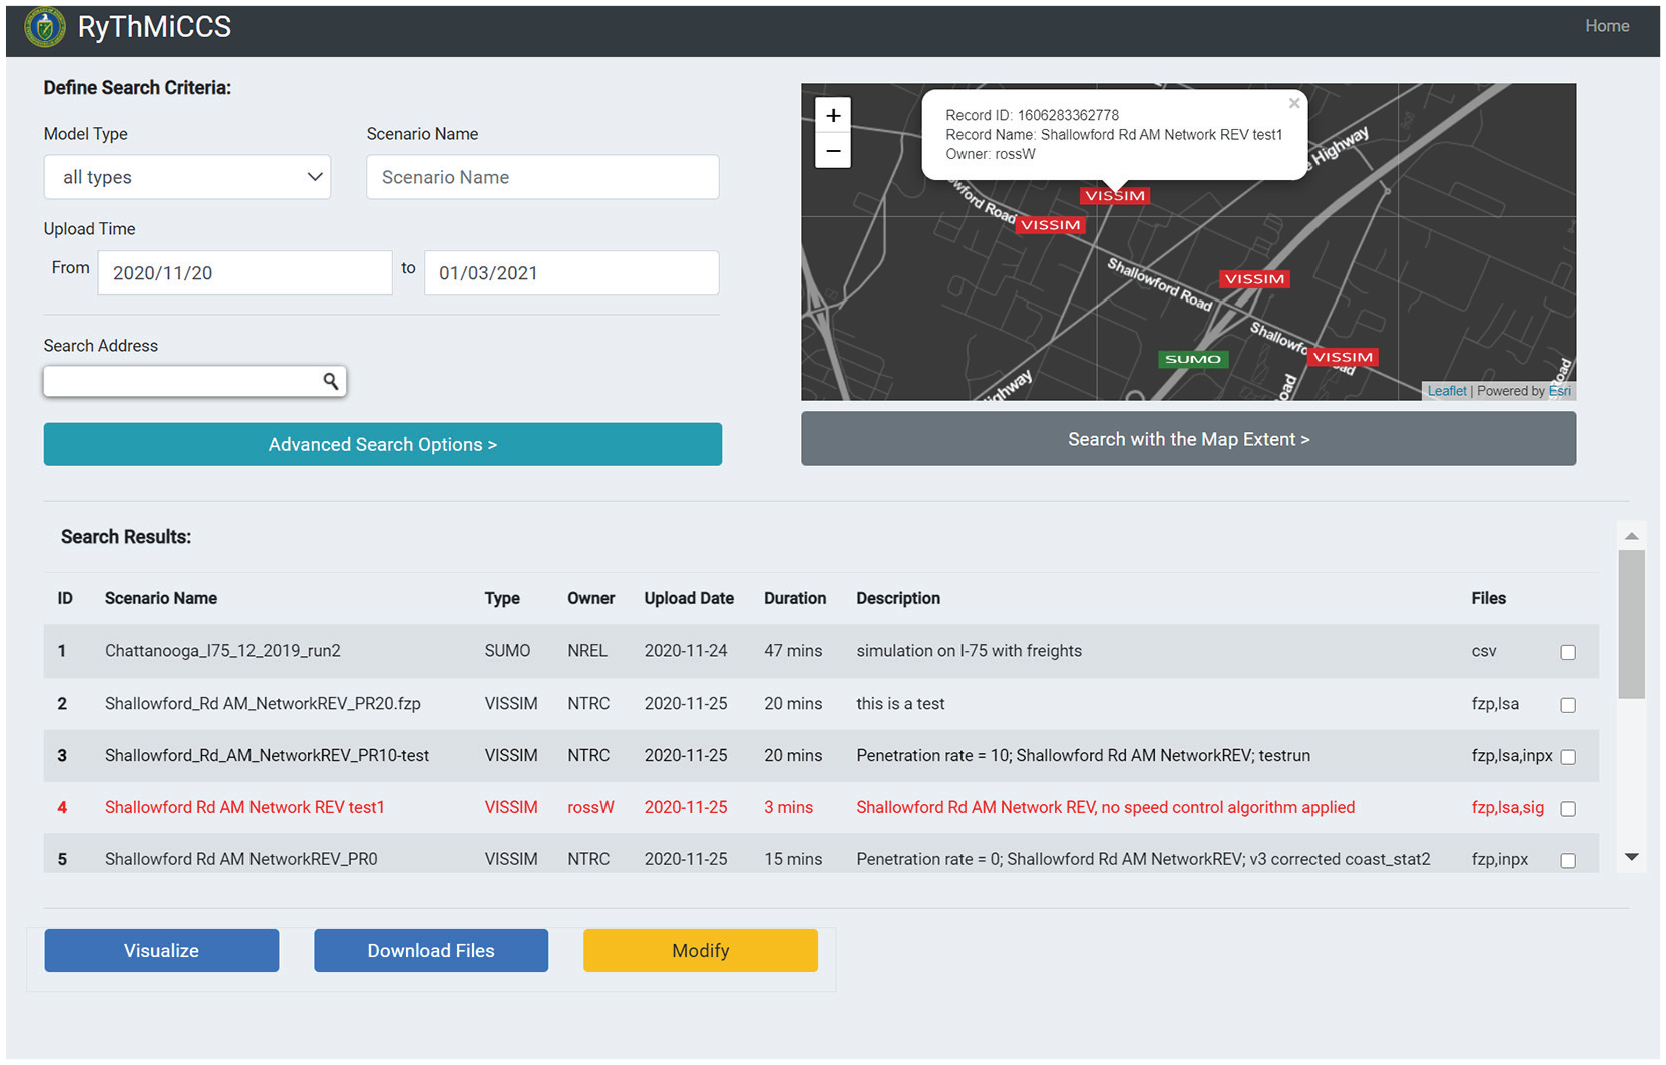
The resource discovery interface allows users to identify available simulation outputs based on both the spatial query, which is enabled using the interactive web map on the right side of the interface, and various search criteria listed on the left side of the interface.
Basic Traffic Flow Visualization
In this section, the application’s capability for visualizing selected traffic simulation results is demonstrated. After the user selects a specific simulation scenario from the query interface, the application automatically generates a visual interface that helps the user visualize vehicle trajectories and signal changes in the selected simulation output. Figure 9 provides an overview of the RyThMiCCS user interface.
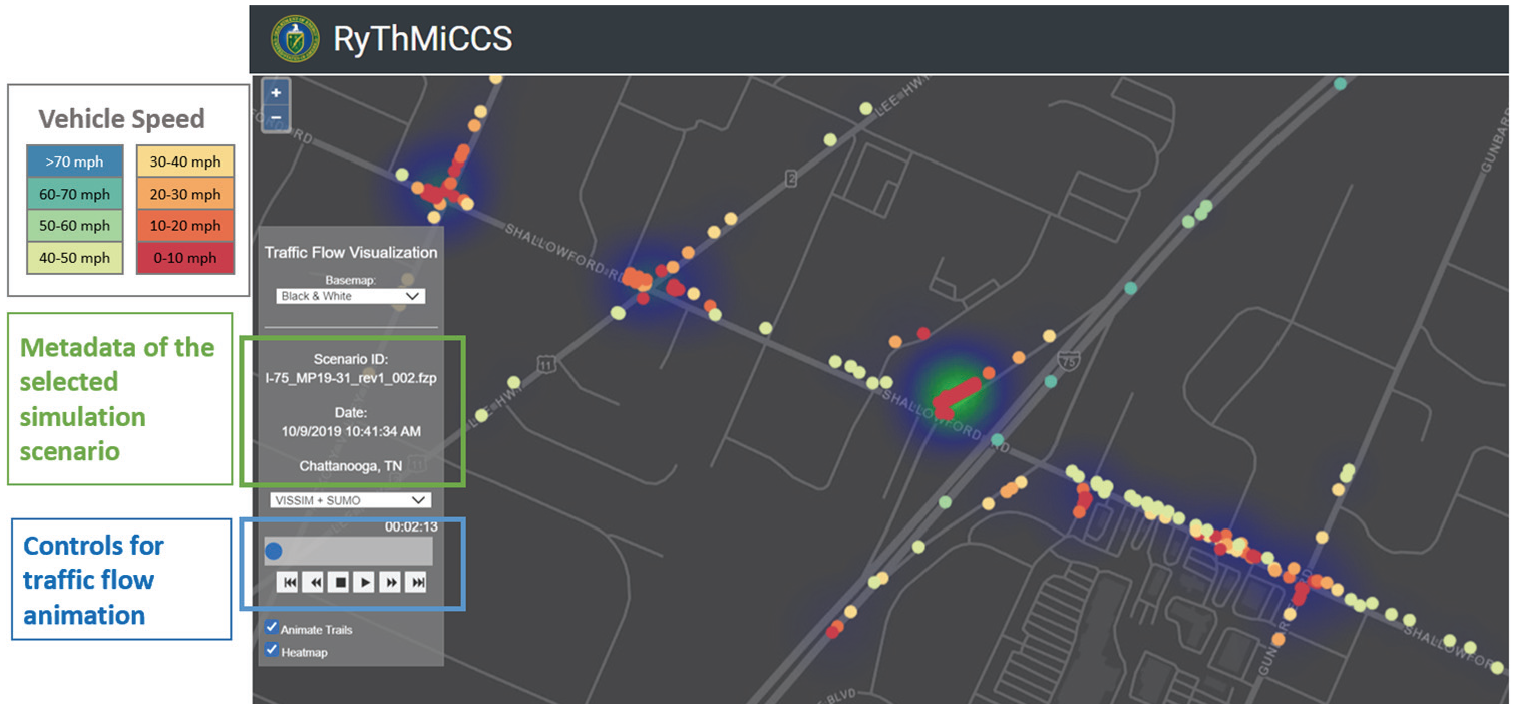
The user interface has controls to select traffic simulation scenarios based on information provided in the metadata, as well as controls to animate the traffic flow. Users can also choose to display animated trails for individual vehicles or a heatmap displaying vehicle congestion. In this example, SUMO and VISSIM simulation outputs are combined.
The animation control block (highlighted by the blue box in Figure 9) consists of play buttons and a time-slider, which allow users to view and control the progress and speed of the traffic flow visualization. In the web map, two representations of traffic flow visualization are employed in the interface, including classic animated trails and particles representation, and a modified kernel density map (as shown in Figure 10). The animated trails and particles representation ( 33 , 42 ) represents moving vehicles as color-coded dots on a map, and is applied in the visual interface to display the trajectory and movements of each vehicle, so as to reveal the individual driving behaviors at the microscopic scale (link and intersection level). The continuous movement of each vehicle is linearly interpolated through the web application using vehicle positions at two consecutive timestamps (e.g., 00:13:05 and 00:13:06). The animated trails and particles representation is color-coded based on the vehicle speed, as shown in the legend to Figure 9. The modified kernel density map can simultaneously encode the magnitude of the vehicle congestion and density at larger spatial scales (e.g., traffic corridor level). In detail, the modified kernel density map calculates the weight of individual vehicles based on their driving speed (as represented in the equation below), thus it can automatically highlight clusters of slow-moving vehicles and detect traffic jams across the corridor.

The application can also visualize traffic signal phases on the map with vehicle movements using glyphs. The visualization of traffic signal phases is conducted on an HTML canvas integrated into the web map and controlled through the animation control block.
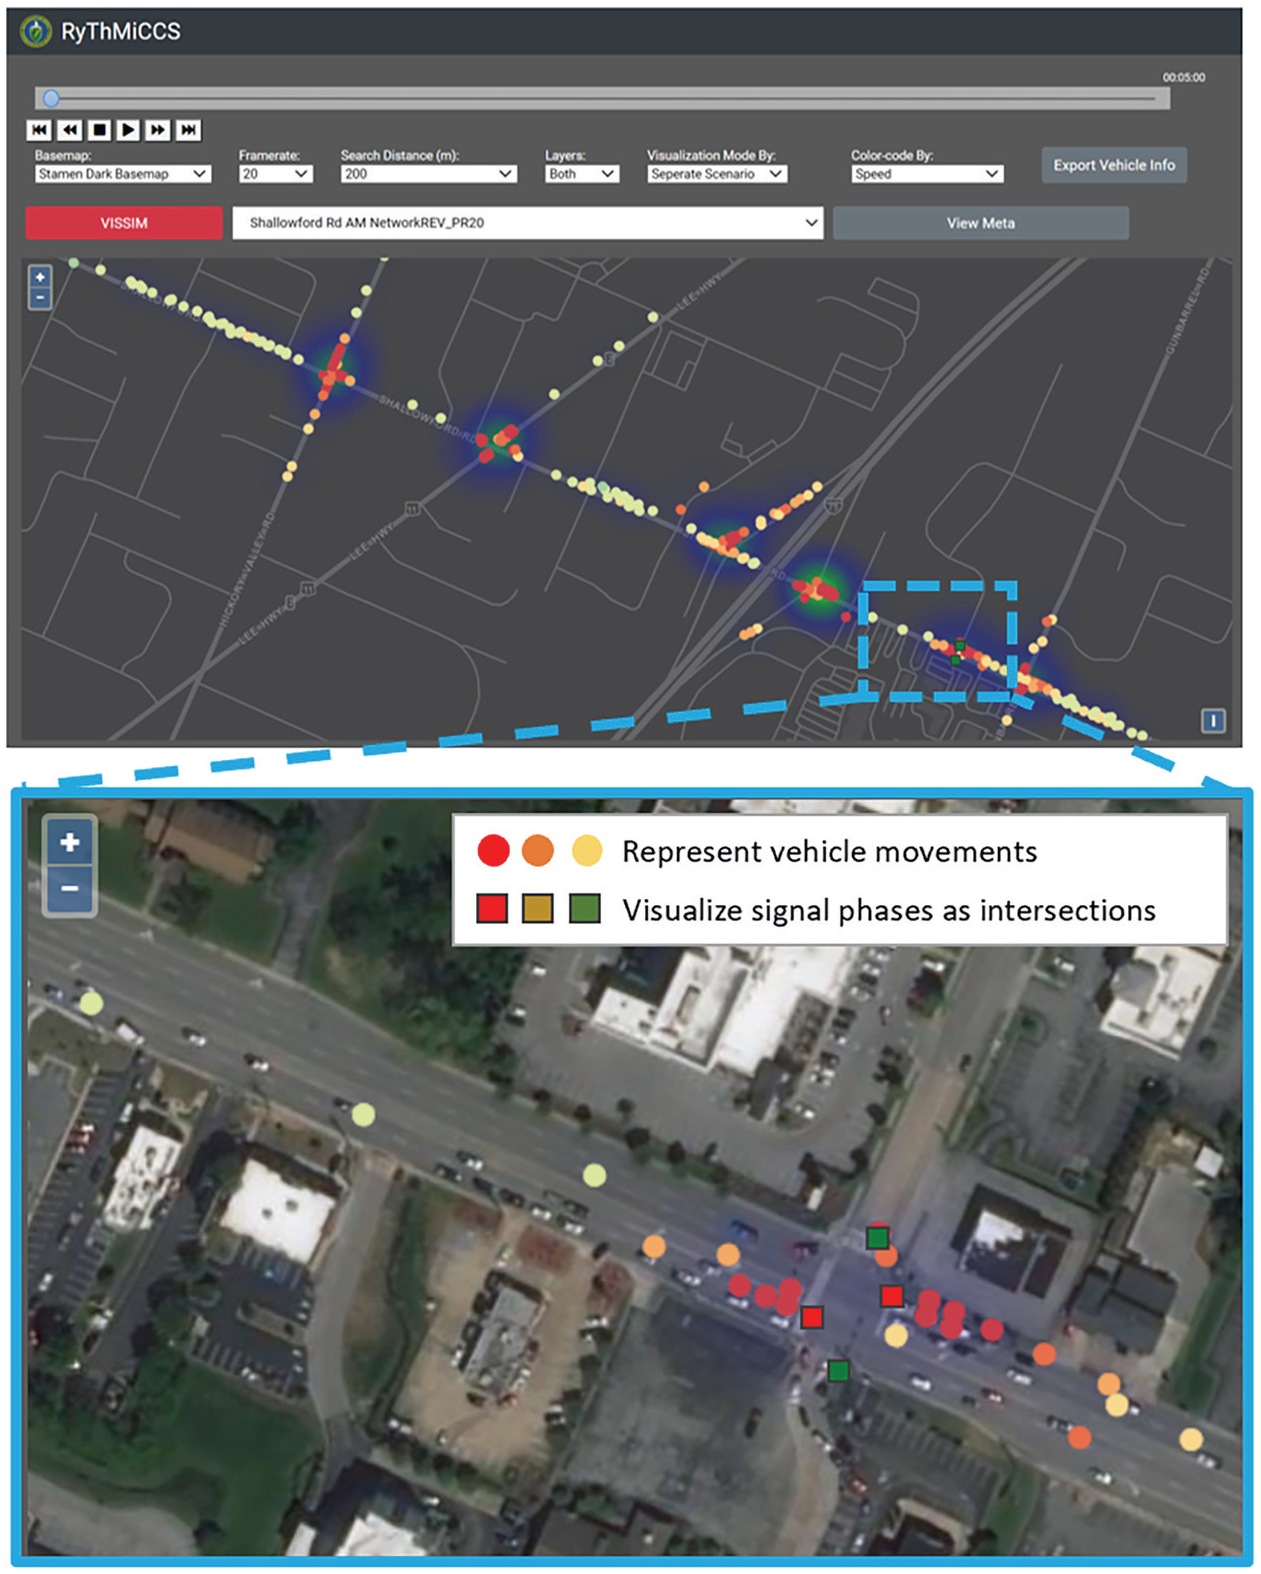
The user interface supports visual exploration of traffic flows at different zoom levels. In the close-up view, one can see which lane each vehicle occupies.
Comparative Analysis of Multiple Outputs
Since the web application is capable of addressing the issue of data format heterogeneity in various traffic simulation outputs (uploaded by users) by transforming these outputs into an optimized JSON-based web data format using a uniform data and metadata standard, the visual interface of the application is able to visualize and compare traffic flows produced from either the same simulation model but using different projection systems (depicted in Figure 11), or two different types of traffic simulation models (as shown in Figure 12).
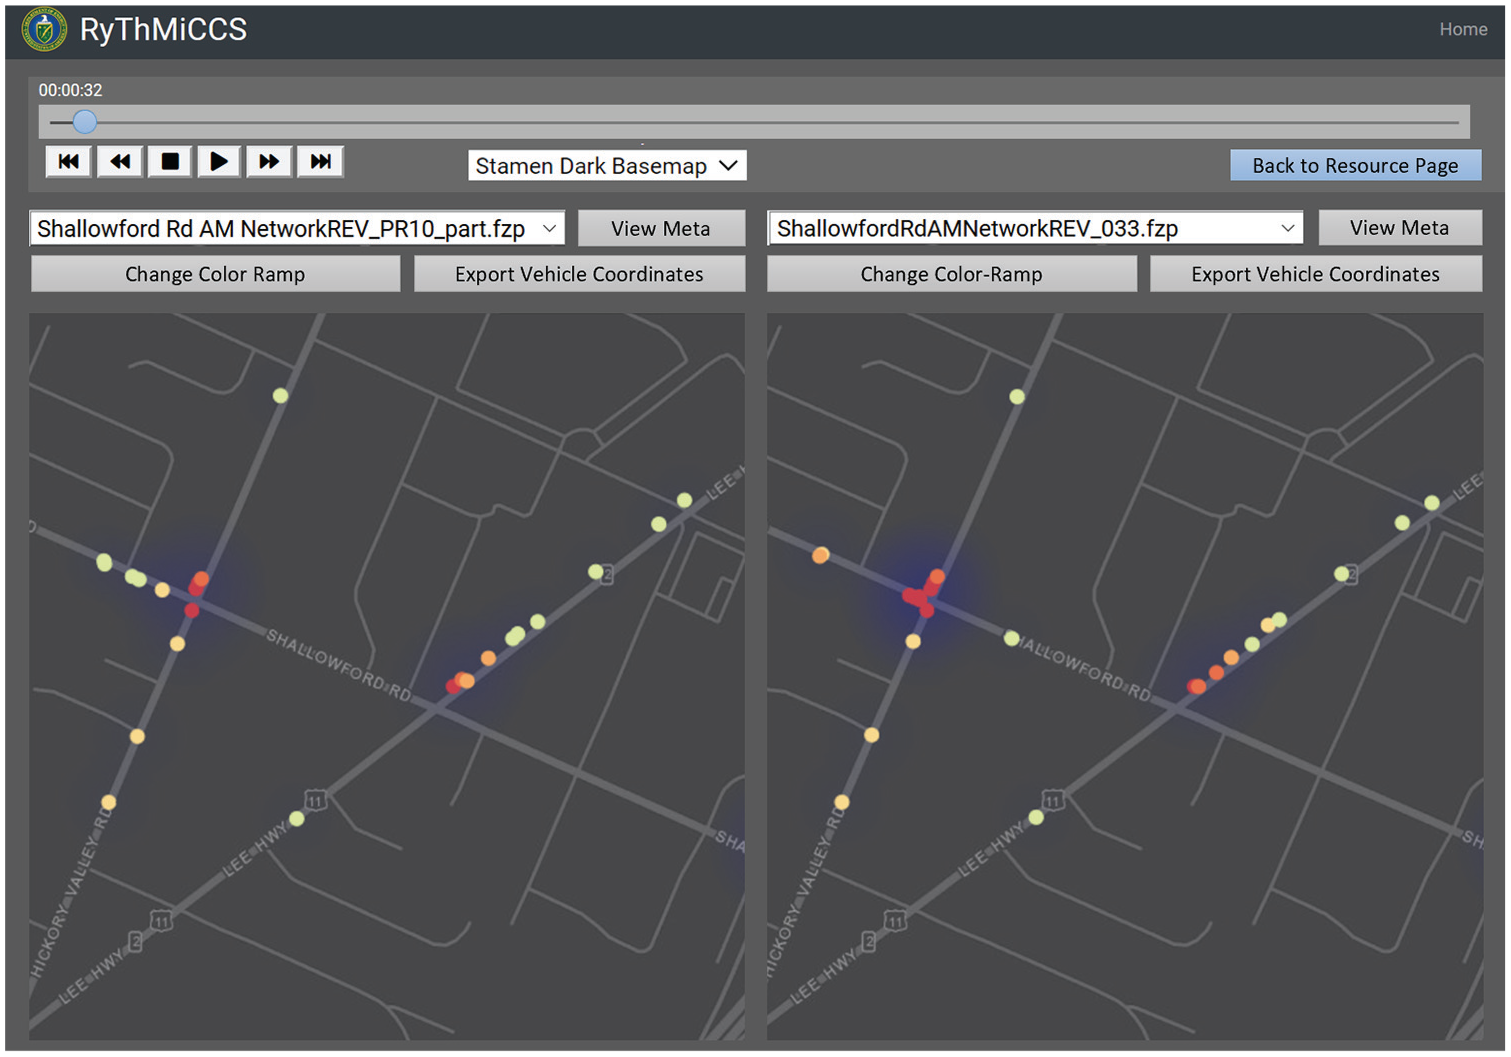
The interface allows users to compare multiple VISSIM simulation outputs side-by-side using the same animation timestamp (controlled by the same set of play buttons and time-slider) and coordinated map views. Users can also view and compare model configuration parameters of the two simulation scenarios by clicking the “View Meta” buttons.
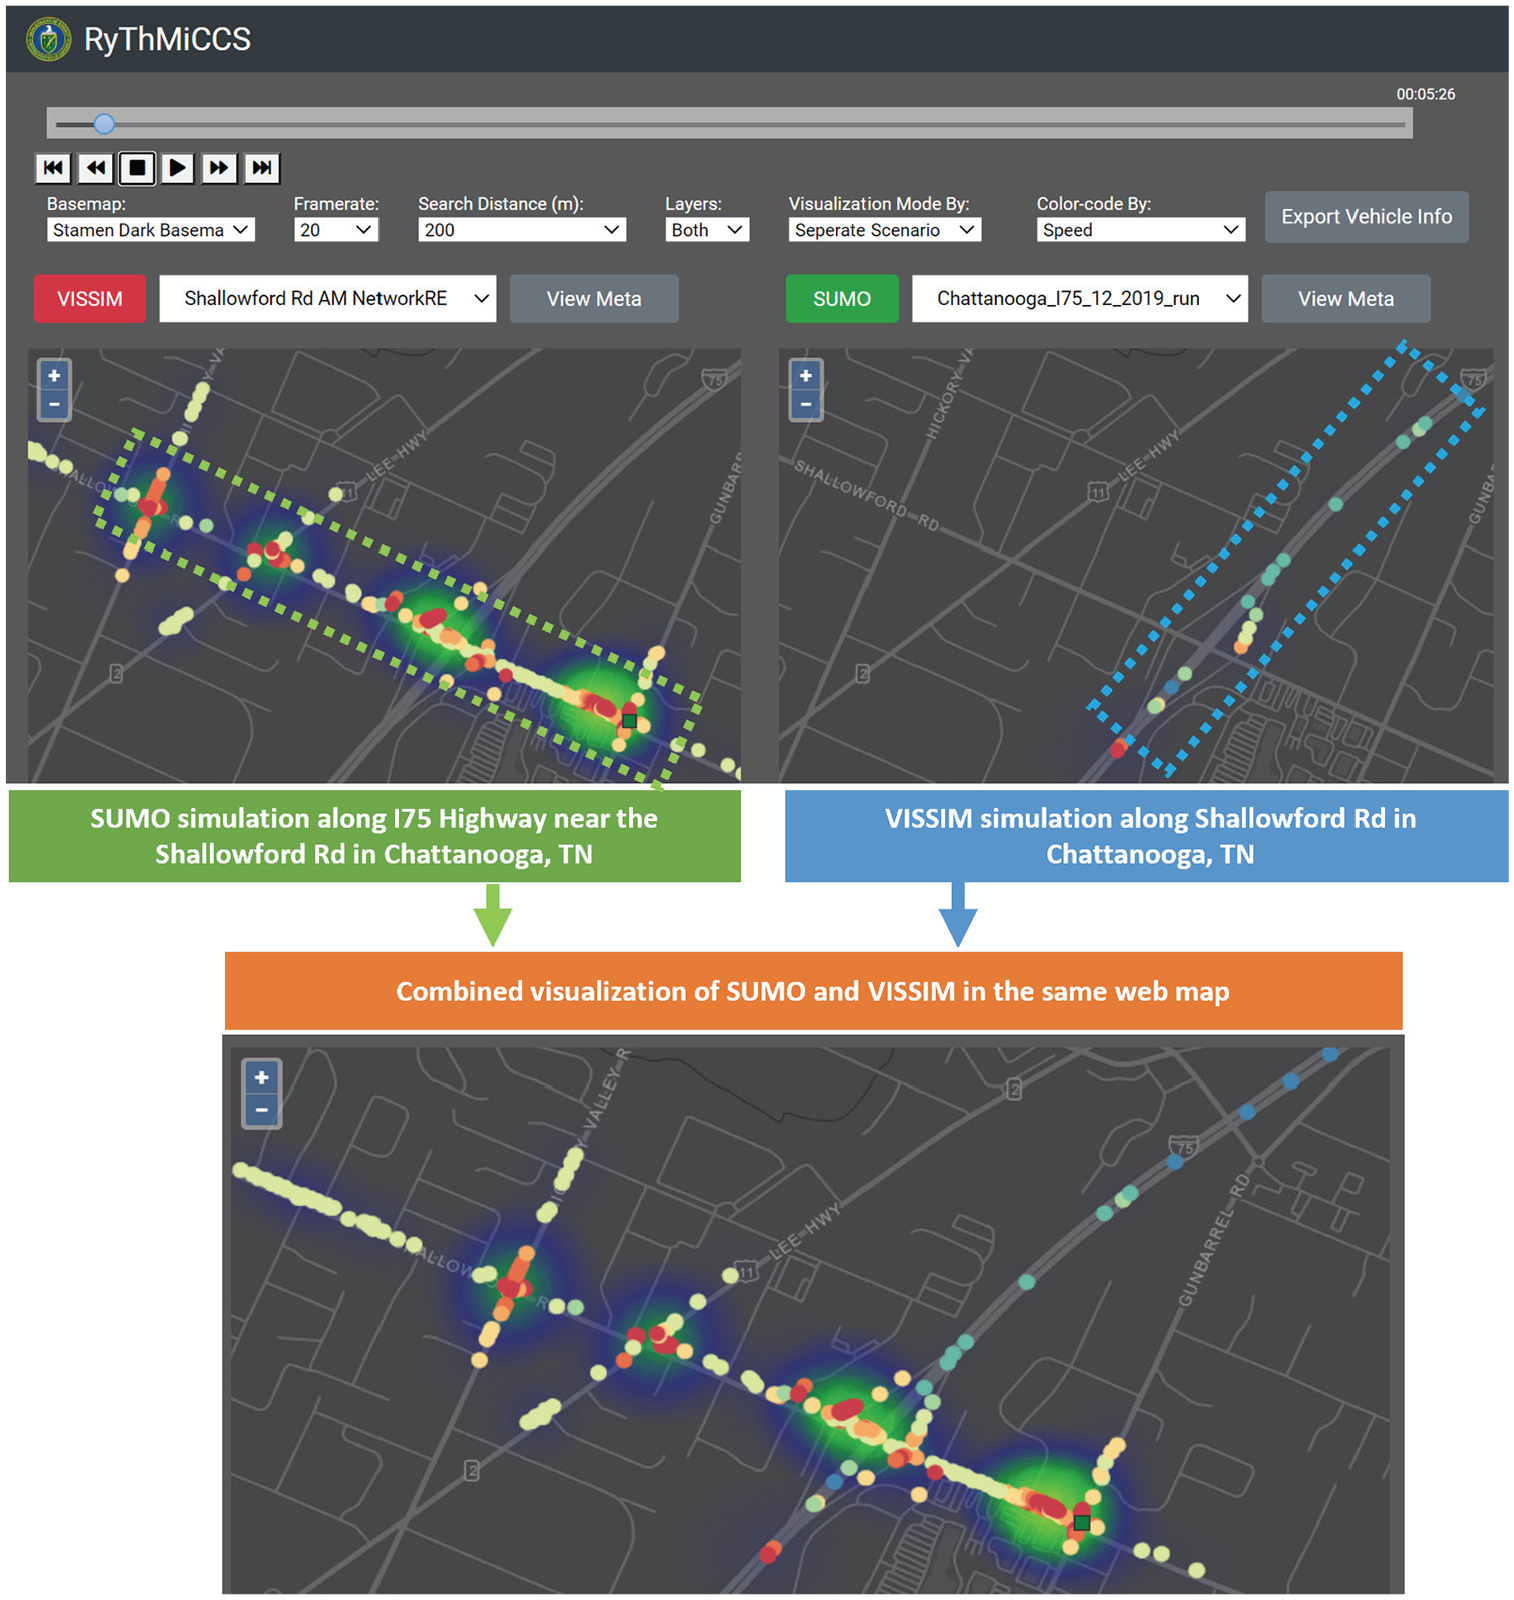
Results from multiple simulations can be combined into a joint traffic flow visualization. This example combines simulation results from a VISSIM model of Shallowford Road and a SUMO model of I-75 in Chattanooga, Tennessee.
Through the resource discovery interface, users can select multiple simulation outputs through the checkbox in the results table depicted in Figure 8 and click the “Visualize” button to compare these outputs in the comparative visual analysis interface. During the co-visualization of multiple simulation outputs, the platform allows users to select individual vehicles (represented by dots) on the web map through click and hover mouse events. The current color reflects vehicle driving speed, and users can modify the vehicle color-coding options to visualize other simulation-related parameters.
This unique comparative visual analysis feature allows the web application to compare simulation results produced from different types of models, different traffic conditions (e.g., traffic at different times of day, different market penetration rates of connected and automated vehicles, etc.) in a side-by-side fashion, or different simulations can be combined to enable visualization of simulations on different roads to be visualized simultaneously.
User Responsibility and Rights
With regard to data integrity and security, users are advised to upload authentic simulation outputs that are not personally modified and falsified through a disclaimer, which is considered as the user’s responsibility when publishing their simulation outputs. Data locality (also known as the data residency) is an important concern related to software-as-a-service and cloud-based applications. Existing laws in many states, countries, or governmental agencies, such as the United Kingdom Data Protection Law, the Swiss Federal Act on Data Protection, and the Canadian Personal Information Protection and Electronic Documents Act, mandate that sensitive or private information should not leave the physical boundaries of the country or region (residency), or should not be exposed to unauthorized parties (privacy). Similar to many content management systems developed for academic and public research purposes, access to the web application is only provided to authorized parties based on project-related needs. The authors have also specified in a disclaimer that files containing sensitive, classified, and personal information should not be uploaded to the system, and simulation files that are under export control regulations or related to classified projects should not be uploaded to the system. Since most of the traffic simulation outputs are simulated scenarios without personal or private information (e.g., a real-time GPS trajectory of a person), it is also the user’s responsibility to avoid sharing private and sensitive information while uploading their non-sensitive simulation software to the platform. From a technical aspect, in case of an international collaboration between two government agencies in two different countries with strict rules on data residency, the current platform design could be connected to a distributed store, in which sensitive information is stored on the node that is deployed within its country’s physical border and can be accessed or viewed only through the network with proper legal permissions. Data encryption or tokenization can also be applied to “obfuscate” the sensitive information (if there could be any sensitive information in a VISSIM or SUMO simulation output) by transforming the plain text information into a non-readable form, which is considered as a common solution to address the data residency concern.
Limitations
In its current form, the web application is designed to facilitate the archiving, sharing, and visualization of traffic simulation outputs from VISSIM and SUMO models. The application does not provide a high-performance computing environment that would allow users to upload network and model configuration to execute traffic simulations in real time. Before uploading and visualizing the simulation outputs through the application, users would have to run their models locally. Latency in the visualization of uploaded simulation outputs is not noticeable, however, as the data retrieval and storage is optimized with the JSON-based data standard and real-time data streaming strategy.
Another major limitation of the application is associated with the calibration and quality control aspects of the simulation outputs uploaded by different users. Currently, the application is not designed to provide decision support capability by offering judgment and evaluation on the quality of uploaded simulation outputs (e.g., to decide which simulation output is better). The motivation of the application is to offer an interactive social learning environment where users can visualize any simulation outputs uploaded to the system and view the simulation configurations to learn from others’ modeling experiences. In the context of traffic simulation, different model configurations normally reflect the modelers’ experiences and their diverse application requirements and scenarios, which are very difficult to evaluate or control using a commonly accepted standard without defining specific simulation objectives.
In addition, a technical limitation of the application is that it can only operate when users’ computers and mobile devices are connected to the internet. The maximum number of vehicles that can be visualized by the application is limited by the internet speed and simulation timestamp. Based on the optimized real-time data streaming strategy, the application can smoothly animate 21,693 vehicles per millisecond using 10 frames per second simulation outputs at an internet speed of 20 Mbps. The client-side WebGL-based visualization tool was able to animate 898,526 points per second without any issue.
Conclusion
This paper presents a web-based geospatial application that enables the archiving, sharing, and visualization of large-scale traffic simulation outputs. The publicly accessible application is later integrated into the RyThMiCCS platform designed to serve as a cyber-physical system for facilitating collaborative transportation planning among different sectors (government agencies, consulting firms, and researchers in academia), as well as for raising public awareness and involvement in urban mobility management.
The design and implementation of the web application required a rethinking of the conventional structure, interfaces, and visualization techniques typically used in online content management systems, since the traffic simulation outputs targeted in the application contain large geospatial data sets that are heterogeneous in format. In this regard, the application was designed to (i) allow users to upload their traffic simulation results (parameters and outputs), as well as to search existing scenarios using easily accessible interfaces; (ii) optimize simulation output files with heterogeneous data formats and projected coordinate systems for web-based storage and management using a scalable and searchable data/metadata standard; and (iii) provide shareable web visual interfaces to visualize multiscale traffic dynamics (e.g., regional mobility patterns and individual vehicle interactions). The web application offers easily accessible, user-friendly interfaces that can be used easily by both technical and non-technical users.
This paper demonstrates the capability of the application for archiving and visualizing traffic simulation results from VISSIM and SUMO models. Nevertheless, having been developed with adaptive design and flexible architecture, the application defines a generalizable and extendable web framework to support the sharing of the results from other traffic simulation models and software tools. In addition, the web framework can also generate research opportunities by extending customized analytical capabilities that are not available from the original traffic simulation software. Built on the framework, a visual dashboard is developed that can analyze vehicle acceleration and braking energy in relation to signal phases at controlled intersections using VISSIM simulations outputs ( 43 ). The visual dashboard takes advantage of the system architecture and data/metadata standards that are defined by the framework and are embedded in the web application as an analytical module to provide insights for reducing vehicle energy consummation through the optimization of intersection traffic controls. In this setting, the framework aims to enable a research paradigm that combines insights provided through traffic simulation outputs with the power of cyberinfrastructure for effective result dissemination, calibration, comparison, and extended analysis. In the future, the authors would envision more customized research applications and tools to be developed based on this framework.
Future Work
There are several potential directions for future works. Currently, the platform does not provide a built-in recording capability. However, the back-end cyberinfrastructure does allow users to upload screen recording files in MP4 format. Other users are able to download the archived recordings of a simulation run through the resource discovery interface. Since the dynamic visualization of traffic simulation is implemented using WebGL and HTML canvas, its graphics can be exported into a series of images using the canvas.toDataURL(“image/png”). In this setting, a built-in recording feature could be developed. Additionally, more geo-processing functions can be incorporated into the platform’s application layer through the Django framework to allow users to conduct simple spatial statistical and multivariate analysis.
Footnotes
Acknowledgements
The authors would like to thank the Chattanooga Department of Transportation for guidance on choosing an arterial road and providing intersection sensor data. The authors would also like to thank the Tennessee Department of Transportation for providing radar detection data.
Author Contributions
The authors confirm contribution to the paper as follows: study conception and design: T. LaClair, C. Wang, H. Xu, A. S. Berres, J. Sanyal; data collection: H. Xu, C. Wang; analysis and interpretation of results: H. Xu, C. Wang, A. S. Berres; draft manuscript preparation: H. Xu, C. Wang, A. S. Berres, T. LaClair. All authors reviewed the results and approved the final version of the manuscript.
Declaration of Conflicting Interests
The author(s) declared no potential conflicts of interest with respect to the research, authorship, and/or publication of this article.
Funding
The author(s) disclosed receipt of the following financial support for the research, authorship, and/or publication of this article: This research is sponsored by the Laboratory Directed Research and Development Program of Oak Ridge National Laboratory, managed by UT-Battelle, LLC for the US Department of Energy under contract DE-AC05-00OR22725. and the US Department of Energy, Vehicle Technologies Office, Energy Efficient Mobility Systems program.
This manuscript has been authored by UT-Battelle, LLC, under contract DE-AC05-00OR22725 with the US Department of Energy (DOE). The US government retains and the publisher, by accepting the article for publication, acknowledges that the US government retains a nonexclusive, paid-up, irrevocable, worldwide license to publish or reproduce the published form of this manuscript, or allow others to do so, for US government purposes. DOE will provide public access to these results of federally sponsored research in accordance with the DOE Public Access Plan (https://www.energy.gov/downloads/doe-public-access-plan).