



Abstract
In response to multiple derailments involving hazmat trains, in early February 2020 Transport Canada released ministerial order (MO) 20-02, imposing speed restrictions of 20 to 25 mph on trains transporting a sufficient quantity of hazardous material. Since much of the North American freight network is used by multiple train types, the extreme speed heterogeneity created by this mandate substantially reduced train performance. Although this order was replaced within 2 weeks by new speed restrictions that were in turn replaced in May, MO 20-02 introduced the most extreme levels of train speed heterogeneity. The research team investigated the corresponding capacity effects to better understand the effects of train speed heterogeneity at low speed and inform agencies on future speed restrictions in this range. Using Rail Traffic Controller and General Train Movement Simulator, we quantitatively investigated the capacity loss from these speed restrictions and found that MO 20-02 can double or triple average train delay and lead to mainline capacity loss in excess of 60% on a representative single-track mainline.
Keywords
In 2019 and early 2020, three major derailments on Canadian freight railways involved the release and combustion of large quantities of crude oil: St-Lazare, Manitoba in 2019, and the 2019 and 2020 derailments in Guernsey, Saskatchewan. Following these incidents, Transport Canada issued ministerial order (MO) 20-02 on February 8, 2020, imposing speed restrictions of 20 to 25 mph on “key trains” (i.e., trains carrying a significant quantity of hazardous materials) depending on their operating location within Canada. Key trains often operate over lines shared with other freight trains, such as intermodal trains transporting highway trailers and shipping containers, which generally operate at higher speeds. The difference in train speed, also referred to as train speed heterogeneity, between intermodal, bulk, and manifest freight trains under normal operating conditions before the implementation of these new speed restriction causes measurable train delay compared with a homogeneous operation where all trains have the same maximum authorized speed ( 1 ). Increases in train speed heterogeneity from these speed restrictions will lead to increases in train delay and a reduction in line capacity on corridors where key trains carrying hazardous materials (hazmat) operate. Since freight rail transportation is vital to the economy and increased train delay and reduced line capacity can degrade the ability of railroads to deliver efficient and reliable transportation meeting the transit times demanded by shippers, it is critical to quantify the effects of these speed restrictions. However, the substantial speed restrictions initially imposed by the February 8 order greatly increased the amount of train speed heterogeneity to ranges not well-documented by previous research. To fill this knowledge gap and inform future policy decisions on speed restrictions of this magnitude, this study quantified the implications of MO 20-02 and its associated substantial reduction in hazmat train operating speed on the capacity and performance of representative mainline railway corridors. This study used two different railway mainline simulation software programs to evaluate the capacity and performance of these representative corridors under hazmat train speed restrictions. Thus, a secondary objective of this study was to compare the use of these programs for mainline capacity research in an academic environment.
Ministerial Orders for Key Train Restrictions
Following a series of derailments involving hazardous material release and combustion, Minister of Transport Marc Garneau issued MO 20-02 on February 8, 2020, imposing a 25 mph speed restriction on key trains across Canada and a 20 mph speed restriction in Census Metropolitan Areas (CMA) ( 2 ). For the purpose of this order, key trains are trains transporting any quantity of toxic inhalation hazard commodities, or at least 20 hazmat carrying railcars ( 2 ).
Following a review of the risk factors leading to key train derailments, on February 16, 2020, MO 20-02 was rescinded and replaced with MO 20-03, which relaxed the speed restrictions and defined higher-risk key trains ( 3 ). This new category applies primarily to unit trains in which all loaded tank cars, besides buffer cars, are transporting a “dangerous good” (i.e., hazmat), or any train with 80 or more tank cars transporting hazmat. Order 20-03 imposed speed restrictions of 25 to 30 mph for higher-risk key trains operating in dark territory (without wayside block signals and track circuits) or CMAs, respectively. Other key trains must not exceed 40 mph when operating in dark territory or 35 mph in CMAs.
MO 20-03 was in turn replaced with MO 20-05, which provided differing speed restrictions depending on ambient temperature and time of year ( 4 ). Under this new directive, higher-risk key trains were redefined as those containing at least 20 loaded tank cars in a continuous block, or 35 throughout the train, transporting crude oil or liquefied petroleum gases.
From March 15 to November 14, higher-risk key trains are not to exceed 30 mph in CMAs, and 50 mph elsewhere. From November 15 to March 14, higher-risk key trains are subject to speed restrictions from 25 to 40 mph depending on location, temperature, and the presence of signals. Other key trains are not to exceed 35 mph in populated areas or 50 mph elsewhere. MO 20-05 also implemented new requirements for rail replacement and maintenance.
Although MO 20-02 with 20 and 25 mph speed restrictions on hazmat key trains was in place for less than 2 weeks, it introduced the most extreme levels of train speed heterogeneity of all three orders. Thus, the research team elected to use these initial speed restrictions as the basis of the study even though the current Canadian regulations under MO 20-05 are less restrictive. Using these extreme vales will help to extend knowledge of train speed heterogeneity within this low speed regime and better inform agencies who may wish to consider future speed restrictions in this range.
Previous Studies and Research Questions
Significant research has been conducted to quantify the impact of train speed heterogeneity on railway capacity. Krueger stated line capacity could be approximated by plant parameters and transit time, and that higher train speed raised capacity ( 5 ). Lai et al. proposed a methodology for finding base train equivalent units to analyze capacity use per train in a heterogeneous traffic environment ( 6 ). Dingler et al. found that lost capacity because of traffic volume and heterogeneity can be recovered by adding sidings and equalizing train priority ( 7 ). None of these studies examined the particular combination of train speeds imposed by MO 20-02, instead focusing on combinations of freight train speeds in the range of 40 to 70 mph.
Shih et al. investigated the effect of passenger train level of service (LOS) on freight train performance with multiple freight train types, considering a slowest train speed of 35 mph ( 8 ). Dingler et al. simulated multiple types of heterogenous traffic to investigate the relationship between train characteristics and delay, with train speeds ranging from 50 to 79 mph ( 1 ). Sogin et al. found that speed differentials owing to 50 mph freight and 79 to 110 mph passenger trains have a greater effect on the performance of double track- than single track mainlines ( 9 ). None of these previous studies quantify the impacts of restricting certain freight trains to 20 mph on 40 mph mainlines or to 25 mph on 60 mph mainlines.
This research makes a novel contribution by expanding on existing research to analyze capacity in a heterogeneous traffic environment with high priority normal trains operating at 40 to 60 mph and low priority key trains operating at 20 to 25 mph. These latter speeds of 20 to 25 mph are substantially slower than those previously studied, potentially resulting in more extreme train speed heterogeneity impacts on performance and capacity than previously published.
Research Questions
The objective of this research was to examine the effects of train speed heterogeneity involving slow trains, traveling at less than 25 mph, on line capacity. The authors also aimed to examine the use of two simulation tools in academic research. To these ends, the paper addresses the following research questions:
What are the effects on line capacity of the hazmat speed restrictions specified in MO 20-02, depending on location, traffic composition, and traffic volume?
How well do General Train Movement Simulator and Rail Traffic Controller function as tools for academic mainline capacity research?
Methodology
To investigate the impact of the Transport Canada hazmat train speed restrictions on mainline operations in a general manner, simulations were conducted of a representative mainline corridor, with a full factorial combination of traffic levels, speed limits, and train makeup. These simulations were conducted using two simulation tools: Rail Traffic Controller simulation software (RTC) and General Train Movement Simulator (GTMS). The input parameters were designed to be as close as possible between the two tools. However, owing to differences between the software, there were some dissimilarities in inputs and results. The average train delay from RTC and average train velocity from GTMS were both used to independently quantify the mainline capacity lost from the hazmat train speed restrictions.
Rail Traffic Controller
Developed by Berkeley Simulation Software, LLC., RTC is a de facto industry standard mainline railway simulation software tool commonly used by freight, passenger, and commuter railways in the United States and Canada, along with many railway operations consultants and academic researchers ( 10 ). RTC uses track layout, grades, curves, speed limits, signals, and train inputs to simulate train movements with a dispatching algorithm that emulates the actions of a human train dispatcher in resolving train conflicts in real time based on priority and accumulated delay. The RTC dispatching algorithm does not prevent deadlocks (in which two or more opposing trains become involved in an irreconcilable train conflict) or detect them in advance during the simulation. Instead, when RTC detects a deadlock, the simulation “rewinds” to an earlier point at which a different dispatching decision can be made to avoid the future conflict and deadlock. If no set of dispatching decisions to avoid the deadlock can be found, the simulation run may fail and terminate before all of the planned trains reach their destination.
General Train Movement Simulator
GTMS is a mainline simulation tool developed and supported by Decisiontek for evaluating railroad safety and operational efficiency. Originally developed for quantitatively evaluating risks and benefits of traffic control technologies such as positive train control (PTC) ( 11 ), GTMS also has capabilities to quantifiably study line capacity under various operational and infrastructural settings. Like RTC, GTMS has various infrastructure and train inputs that it uses to simulate train movements. The central dispatching logic uses the Node Network Clear Operations algorithm (NNCO) to prevent deadlock regardless of traffic volume or complexity ( 12 ). This algorithm is based on the process described by Lu et al. ( 13 ). The NNCO is a greedy algorithm that resolves conflicts such that all trains in the system will be able to progress to their terminus. The use of a deadlock prevention algorithm by GTMS compared with the deadlock avoidance technique used by RTC is a key difference between these two mainline capacity simulation tools.
Simulation Parameters and Train Characteristics
To best represent a typical North American Class 1 freight rail corridor, the authors created a hypothetical corridor with track plan and control system (Table 1) designed to be representative of the network a hazmat train might operate over. The straight and flat 242-mi single-track network has 2-mi passing sidings every 10 mi, with Number 20 powered turnouts at each end of the passing sidings. The corridor uses a three-aspect centralized traffic control (CTC) system with PTC to ensure realistic and safe separation of trains.
General Simulation Parameters

Note: RTC = Rail Traffic Controller; GTMS = General Train Movement Simulator; CTC = centralized traffic control.
Since North American freight traffic is typically unscheduled, and subject to significant origination and route delays that can influence line capacity ( 14 , 15 ), train departures were subject to randomization. In the RTC simulations, trains departed up to 60 min early or late from their scheduled origination time according to a uniform distribution. The GTMS simulations used a lognormal distribution with a mean of 30 min and a standard deviation of 30 min to determine early and delayed departure.
Train traffic consisted of a single train type representative of typical bulk commodity trains (Table 2), with a varying proportion designated as hazmat trains to which speed restrictions and lower priority were applied according to the experimental design. Train departures from either end of the route were evenly distributed throughout each simulated day. Trains were assumed to enter the network with a fresh crew being able to complete 12 h of work before needing replacement. In RTC, crew changes for expired crews were specified to take 30 min to complete. Since GTMS only checks for crew hours of service limits at station stops, it was decided to omit crew expirations and changes for the GTMS simulations. It was felt this compromise on crew time was preferred compared with significantly reducing dispatching flexibility and train velocity by requiring all freight trains to make station stops on given sections of track just to check crew hours of service.
Train Parameters and Characteristics
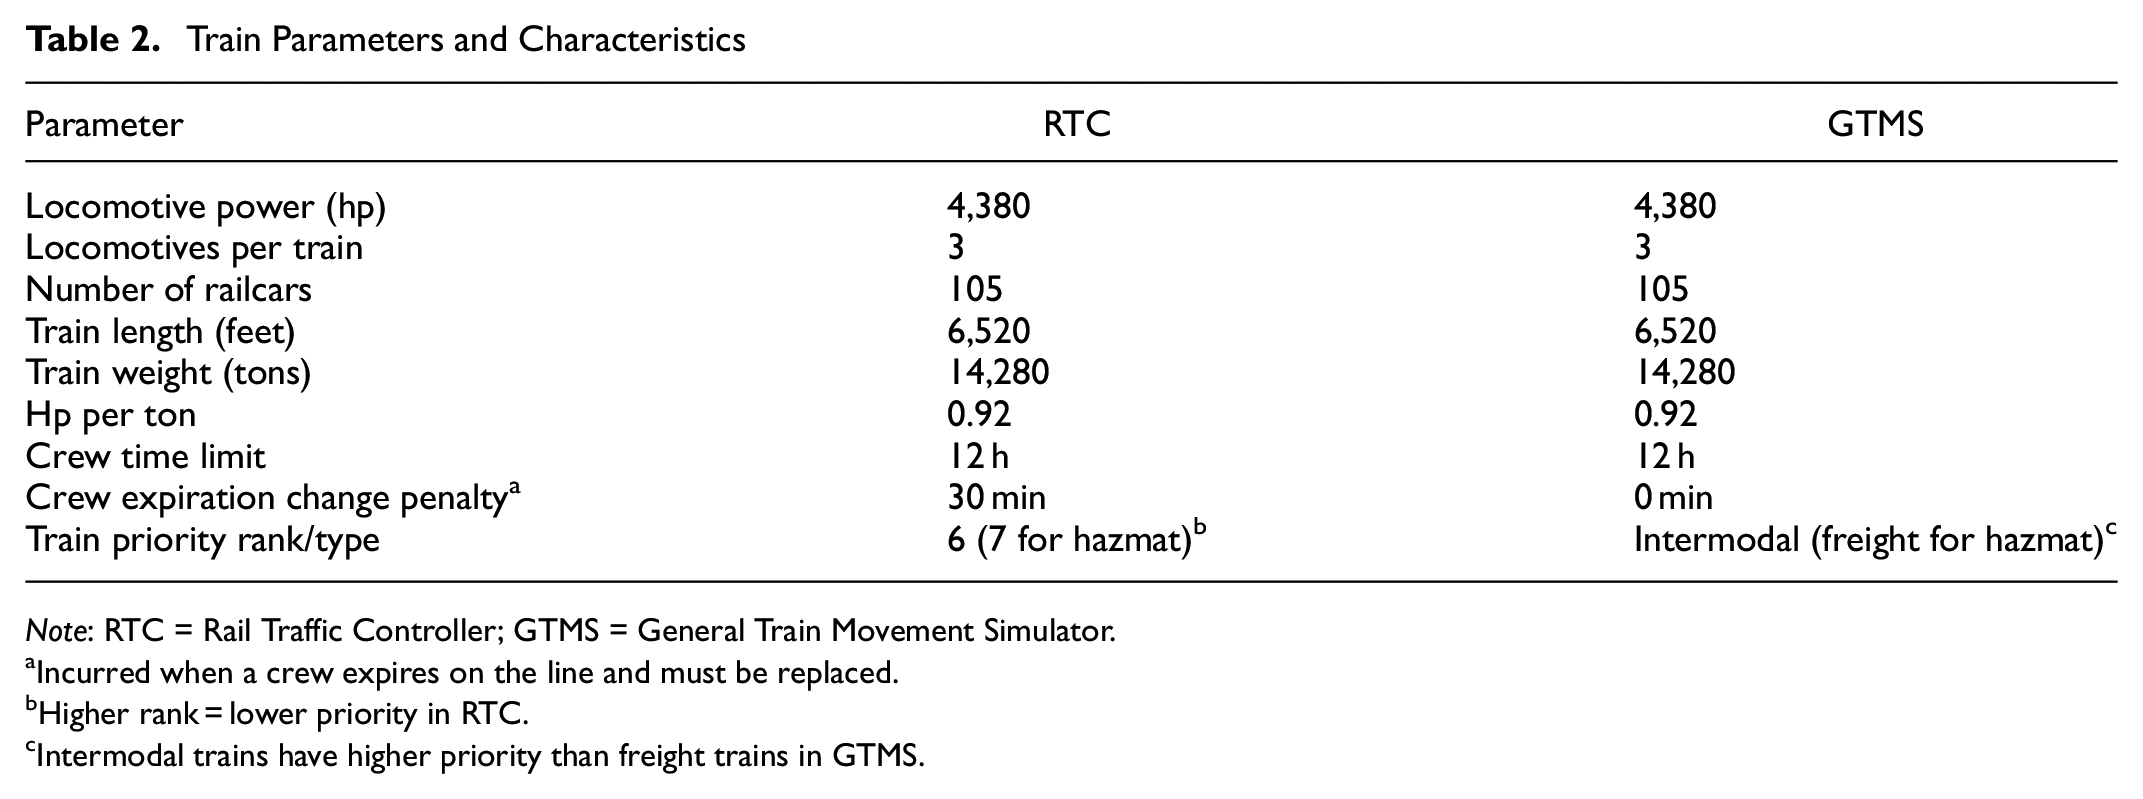
Note: RTC = Rail Traffic Controller; GTMS = General Train Movement Simulator.
Incurred when a crew expires on the line and must be replaced.
Higher rank = lower priority in RTC.
Intermodal trains have higher priority than freight trains in GTMS.
Experimental Design
The experimental design (Table 3) specified different factorial combinations of three experimental variables: traffic volume, percent hazmat (key) trains, and normal and restricted maximum authorized train speeds. To provide a range of train delay and facilitate evaluation of line capacity, traffic volumes of 16, 32, and 48 trains per day were simulated on the single-track corridor.
Experimental Design and Factor Levels

Since the proportion of trains on a given corridor that are hazmat trains subject to the speed restrictions may vary widely across the actual rail network, the percentage of hazmat trains was simulated at four different levels. For the 0% hazmat trains level, no trains were subject to the newly imposed speed restrictions so all trains operated at the normal speed with no train speed heterogeneity. The other factor levels represented the fractions of daily traffic volume designated as hazmat trains. For example, for 32 trains per day and 25% hazmat trains, there would be 8 hazmat and 24 nonhazmat trains per day. Hazmat trains were balanced by direction and evenly distributed over the day.
Three combinations of normal and restricted maximum authorized speeds were studied to represent possible operating conditions under the MO 20-02 Canadian Key Train regulations:
Baseline condition in general areas with normal (nonhazmat) trains operating at 60 mph and hazmat trains subject to a preexisting 50 mph speed restriction.
Restricted condition in general areas with normal (nonhazmat) trains operating at 60 mph and hazmat trains now restricted to 25 mph.
Restricted condition in CMAs as designated by Transport Canada with normal (nonhazmat) trains operating at 40 mph and hazmat trains now restricted to 20 mph.
The baseline maximum authorized speed condition in CMAs where all trains (nonhazmat and hazmat) operated at 40 mph did not include any train speed heterogeneity and was therefore not sensitive to the percent hazmat trains factor. Thus, this baseline condition was not included as a separate factor level in the experimental design. Instead, these baseline conditions were captured by the performance of the restricted CMA condition with 0% hazmat trains (i.e., all trains with a maximum authorized speed 40 mph) across the range of simulated traffic volumes.
Conduct of Simulations
To capture the variation in train departures and meet/pass conflicts created by schedule flexibility, each simulation scenario in the experimental design was replicated 30 times with different randomization seeds. Each simulation run included one warm-up day, designed to fully populate the network with trains, and one experimental day over which data and performance metrics were collected for subsequent analysis. The RTC experiments also had a cool-down day to ensure continued network fluidity. Since GTMS does not support cool-down days, they were not used in those simulations. The data from warm-up and cool-down days were not included in the analysis and performance metrics compiled for this study.
For the two simulation tools, some seeds were considered invalid and their results omitted. In RTC, if the dispatch algorithm failed to find a solution for a given seed, that seed was omitted from the data and the results from the remaining seeds were used to calculate average performance. The cases listed below were infeasible in RTC as it could not complete a full dispatch for any seeds. To account for these extremely congested conditions, a high value of delay was substituted:
48 trains per day, 13% hazmat, 40 mph speed limit with 20 mph restriction;
48 trains per day, 25% hazmat, 60 mph speed limit with 25 mph restriction;
48 trains per day, 25% hazmat, 40 mph speed limit with 20 mph restriction;
48 trains per day, 50% hazmat, 60 mph speed limit with 25 mph restriction; and
48 trains per day, 50% hazmat, 40 mph speed limit with 20 mph restriction.
In GTMS, if either the software returned an error message reading “Error in Simulation,” or the dispatching algorithm failed to grant further authorities for a train en route in the corridor, the seed was omitted from the data and the results from the remaining seeds were used in the analysis. GTMS was able to complete at least 18 seeds for every scenario.
Performance Metrics and Data Collection
Train performance was measured by average delay per 100 train miles. Whereas RTC calculates this metric for each seed, GTMS produces an average train velocity for each train type involved in the simulation. GTMS simulations were conducted with each train type defined to group hazmat and nonhazmat trains to calculate maximum average velocity for trains subject to the different maximum authorized speeds. The average velocity and maximum authorized speed for a given train type was used to calculate average train delay (Equation 1),

where
The mean average and 95% confidence intervals for average train delay for each scenario were calculated and included as a single data point in the results. Traffic capacity for each LOS was calculated using linear interpolation for a factorial combination of train speed and traffic makeup.
Results and Discussion
The simulations yielded two sets of results, one for the RTC- and one for the GTMS simulations. To answer the main research question about the performance and capacity impact of the hazmat speed restrictions, general trends in the train delay data and calculated line capacity common to both simulations are first discussed. This is followed by a discussion of the differences between the RTC and GTMS simulation results and general comments on the use of each for academic research on line capacity.
Average Train Delay
The average train delay for each scenario in the experimental design was used to develop delay–volume curves for each factorial combination of maximum authorized speeds and percent hazmat trains (Figures 1–3). Each figure presents two sets of train delay data, one for the RTC simulations (solid lines) and one for the GTMS simulations (dashed lines). All experimental conditions show the expected trend of increasing train delay with increasing traffic volume. Within each figure it can be observed that increasing the percentage of hazmat trains leads to increases in train delay, exhibiting the expected trend as traffic mixtures with equal numbers of fast and slow trains typically exhibit the greatest speed heterogeneity effects for a given combination of maximum authorized speeds.

Train performance under 40 mph freight speed and 20 mph hazmat speed restriction as specified in MO 20-02 for Census Metropolitan Areas (CMA).
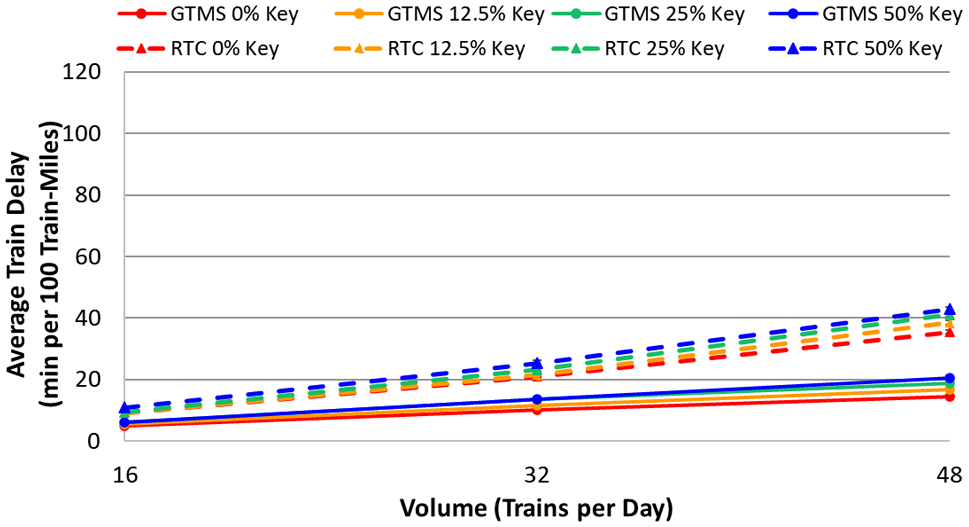
Baseline train performance for nonCMA areas operating under 60 mph freight speed and 50 mph key train speed restriction.

Train performance under 60 mph freight speed and 25 mph hazmat speed restriction as specified for nonCMA areas in MO 20-02.
The train delay effects of implementing the MO 20-02 speed restrictions reducing maximum hazmat train speed from 40 to 20 mph in CMA locations is illustrated in Figure 1 by comparing the baseline 0% hazmat results with the data with a higher percentage of hazmat. For a given traffic volume, introducing increasing numbers of 20 mph hazmat trains caused a dramatic decrease in train performance. Even with a low traffic volume and a small proportion of hazmat trains, train delay more than doubled. Increases in train delay were magnified at higher traffic volumes as a greater number of trains had to traverse the network at 20 mph.
The train delay effects of implementing the MO 20-02 speed restrictions, reducing maximum hazmat train speed from 50 to 25 mph in nonCMA locations while normal trains continue at maximum 60 mph are illustrated by comparing corresponding series in Figures 2 and 3. For the baseline case with a 10 mph speed differential between the nonhazmat and hazmat trains (Figure 2), train delay showed less sensitivity to increases in the proportion of hazmat trains, reaching a 25% increase for the severe combination of 48 trains per day and 50% hazmat trains. For the restricted case with a 35-mph difference in maximum authorized speeds (Figure 3), train delay was more sensitive to the percentage of hazmat trains. Comparing the train delay results between the baseline (Figure 2) and restricted (Figure 3) cases, even when hazmat trains only comprised a small proportion of overall traffic that normally operates at 60 mph, the presence of 25 mph hazmat trains doubled or tripled average train delays.
Line Capacity
By defining a required LOS in relation to a maximum allowable train delay, the performance relationships between train delay and traffic volume can be transformed into measures of line capacity (i.e., maximum throughout volume of trains per day that provides the required LOS) ( 5 ). For example, if LOS is set to 60 min per 100 train miles (LOS 60), the volume on each percent hazmat trains curve corresponding to 60 min of average train delay is the capacity in trains per day for that scenario (i.e., combination of maximum authorized speeds and percent hazmat trains). This maximum traffic volume is obtained by interpolation or extrapolation from the train delay data points corresponding to the scenarios simulated in RTC or GTMS (Figures 1–3).
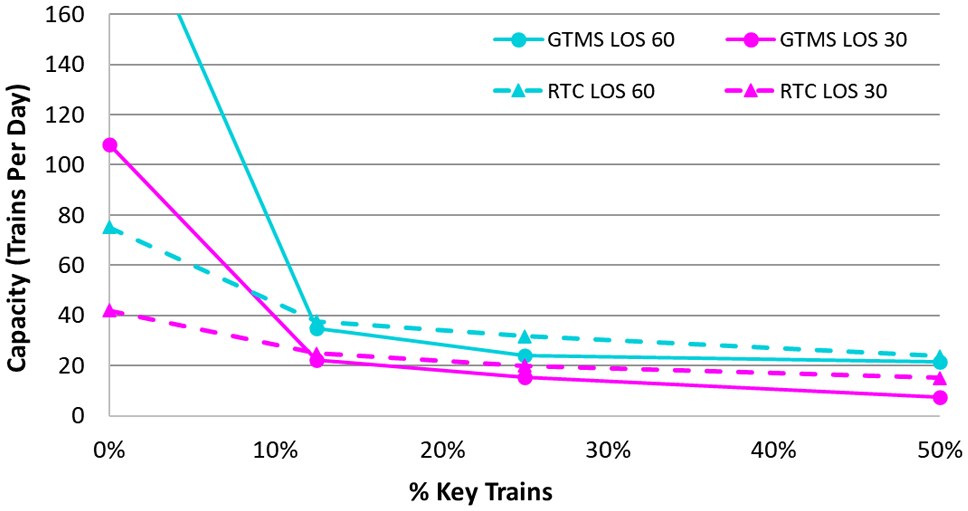
Based on Figures 1 to 3, calculated line capacity in trains per day was plotted as a function of the percent hazmat trains and required LOS (maximum allowable train delay) for each of the three maximum authorized speed conditions (Figures 4–6). Each figure plots four sets of data, with one pair for the RTC simulations (solid lines) and one pair for the GTMS simulations (dashed lines). For each simulation software, line capacity was calculated with two different LOS: 60 and 30 min of maximum allowable train delay per 100 train miles. The 60-min LOS is used by many railroads to define practical line capacity, whereas the 30-min LOS represents a stricter standard that may be implemented on some corridors with time-sensitive traffic and passenger operations. The inclusion of both LOS capacity values illustrated the sensitivity of the capacity calculation to the LOS standard selected by a railroad practitioner for a given corridor.
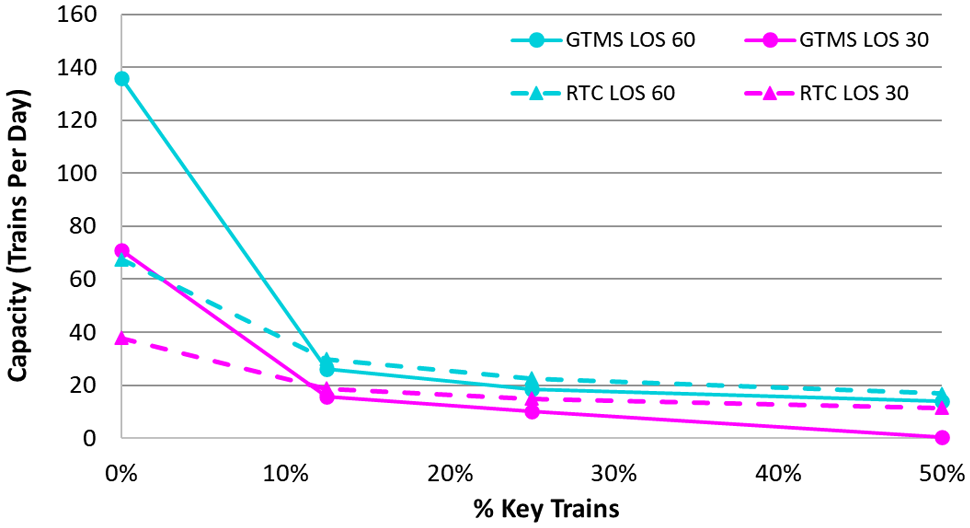
Line capacity under 40 mph freight speed and 20 mph hazmat speed restriction as specified in MO 20-02 for Census Metropolitan Areas (CMA).
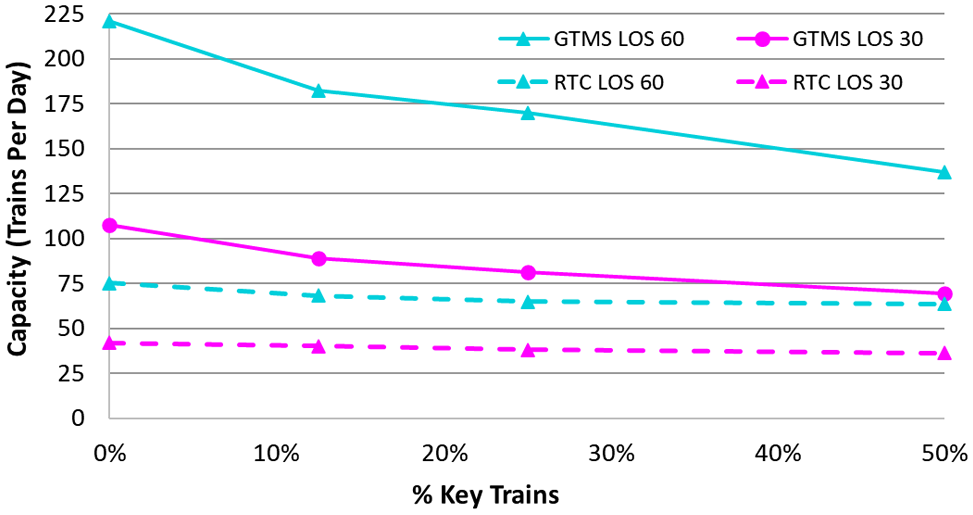
Baseline line capacity for nonCMA areas operating under 60 mph freight speed and 50 mph hazmat speed restriction.
Line capacity under 60 mph freight speed and 25 mph hazmat speed restriction as specified for nonCMA areas in MO 20-02.
In general, for all cases, since average train delay increased with increasing percent hazmat trains, line capacity decreased as the proportion of trains subject to the speed restrictions increased. For the baseline conditions with less train speed heterogeneity, the selected LOS had a considerable impact on line capacity; for the 60/50 mph case (Figure 5), shifting from LOS 60 to LOS 30 reduced capacity by approximately half.
To compare mainline capacity before (baseline) and after the 25 and 20 mph speed restrictions were imposed for a range of percent hazmat trains (Figures 7 and 8), the percent capacity lost was calculated for corresponding baseline and restricted scenarios. Percent capacity lost for a given factorial combination of percent hazmat trains and maximum authorized speeds (CMA and nonCMA) was calculated using Equation 2,
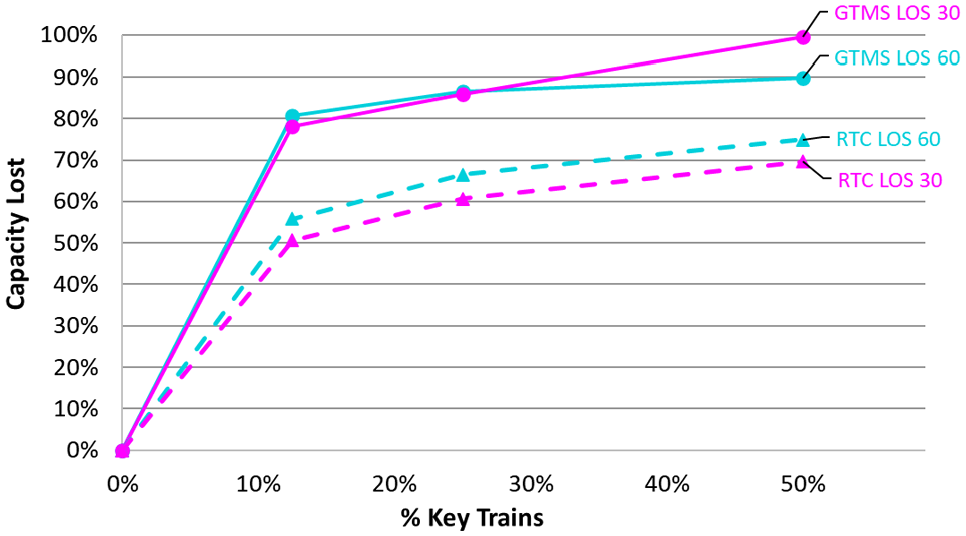
Capacity lost in Census Metropolitan Areas (CMA) from the 20 mph restriction as specified in MO 20-02, assuming a 40 mph freight speed.
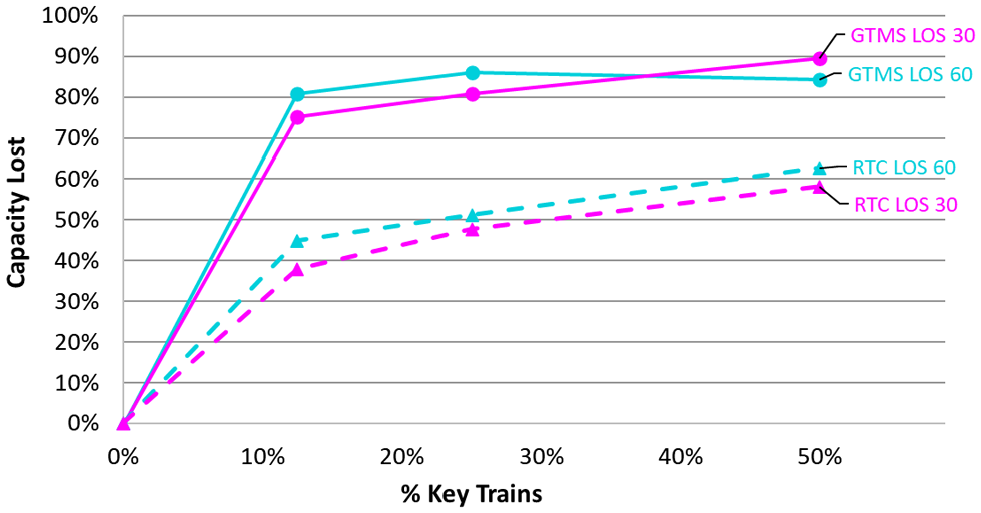
Capacity lost in nonCMA areas from the 25 mph restriction as specified in MO 20-02, assuming a 60 mph freight speed.

where
To calculate capacity loss for the CMA case with a 20 mph speed restriction (Figure 7), the capacity of the 0% hazmat scenario in Figure 4 was the baseline for comparison with the scenarios with the same LOS but different percent hazmat trains. For the general (nonCMA) case, the capacity loss was calculated by comparing the capacity of 60/50 mph scenarios (Figure 5) to equivalent 60/25 mph scenarios (Figure 6) with the same percent hazmat trains and maximum allowable LOS.
Because the simulations did not include activities such as track maintenance, which also consume line capacity, this relative capacity comparison in Figures 7 and 8 was more important than the actual values of line capacity in trains per day included in Figures 4 to 6. When defining capacity of the representative corridor by a maximum allowable train delay LOS, the increase in train delay from even one or two pairs of 25 mph trains could conservatively reduce line capacity by 40% (Figure 8). Corridors with a greater proportion of hazmat traffic could conservatively lose 50% to 60% of current line capacity.
In developed areas subject to the 20 mph speed restriction (Figure 7), for scenarios in which normal trains operate at 40 mph, the representative single-track corridor could lose 50% to 70% of the current capacity (when all trains operate at 40 mph).
In both cases, the amount of line capacity lost was influenced by the particular LOS standard in average minutes of train delay per 100 train miles. However, the LOS effect was much smaller than the effect of increasing the proportion of hazmat trains in the daily traffic volume. Thus selecting a different maximum allowable train delay did not change the overall trend and range of the capacity loss observed in the simulation results.
Comparison of RTC and GTMS
Under baseline conditions with low train speed heterogeneity (Figure 2), GTMS consistently showed lower delay than RTC, most likely from the differences in dispatching algorithms and a longer minimum runtime in the former tool. In low volume simulations, the GTMS experimental scenarios had consistently higher delay than the corresponding RTC scenarios owing to the relative lack of overtaking in GTMS. When a higher rank train approaches a lower rank train, RTC will almost always dispatch an overtaking, whereas GTMS will rarely do so. Although this bias toward overtaking in RTC was beneficial to train delay at low traffic volumes when there were few opposing trains, it was not advantageous at high volumes with several opposing trains, partially contributing to more failed seeds and greater train delay.
The GTMS dispatching algorithm is designed to prevent deadlock, which it does effectively, and is able to resolve even extremely difficult cases. The GTMS data showed the counterintuitive result that at high volumes, having a higher portion of hazmat trains led to a lower average delay. At these traffic levels, once even small levels of speed restricted traffic were introduced, train velocity remained roughly the same, owing to the lack of overtaking opportunities and executions. As shown in Equation 1, average train delay is the sum of the inverse of the average train velocity and the negative inverse of the maximum train velocity. Assuming similar average velocities, the average train delay will be lower for hazmat trains with a lower maximum velocity than normal trains. Consequently, increasing the proportion of hazmat trains at high volumes will decrease the average train delay.
The different probability distributions for departure randomization may also contribute to differences in the data. The lognormal delay and early departure distribution with a 30-min mean and 30-min standard deviation in GTMS, for example, may not cause equivalent randomization to the 60-min uniform distribution in RTC when compared with strictly scheduled departure times.
Although GTMS tended to have much higher capacities for baseline scenarios, it was in agreement with RTC for most experimental scenarios. For LOS 30, GTMS had a significantly lower capacity at 50% hazmat than the equivalent RTC scenario, which is most likely a result of the comparative lack of overtaking in this software.
The GTMS simulations tended to have lost more capacity than the corresponding RTC simulations owing to the combined effects of a higher baseline capacity and the very low LOS 30 capacity at high levels of train type heterogeneity.
The two simulation tools have varying designs and functionalities. Since RTC is hosted locally, the speed of dispatch is dependent on the capabilities of the computer in use. By contrast, GTMS is a web-based interface, which is dependent on Internet and server capabilities, but is much more forgiving on computer capabilities and can be accessed from any Internet-enabled location. The workflow in GTMS is more user intuitive, with simple commands, tools, and a track chart application used to create infrastructure. The GTMS route-editing interface emulates a track chart, and can import I-ETMS subdivision files, decreasing the required build time before simulation. RTC can create more detailed and customizable networks and trains, but requires a higher level of competence, and typically more time overall to produce a rigorous simulation.
Conclusions and Future Work
This research extends knowledge of train speed heterogeneity effects, previously concerned with higher-speed passenger trains and premium intermodal trains, down to ranges involving slow train speeds as low as 20 mph. As stated in the introduction, although MO 20-02 imposing 20 and 25 mph speed restrictions on hazmat key trains was in place for less than 2 weeks, it introduced the most extreme levels of train speed heterogeneity of all three orders. Thus, the conditions of MO 20-02 were selected for analysis to quantify the full potential impacts of these hazmat train speed restrictions even though the subsequent MO 20-03 and 20-05 imposed less stringent requirements. Although not representative of the final operating conditions, train performance, or line capacity under MO 20-05, the analysis of the original MO 20-02 conditions served to bound the magnitude of potential hazmat train speed restriction impacts and inform potential future rule-making proceedings that may consider imposing similar speed restrictions.
The extreme speed restrictions put forth in MO 20-02 to reduce the risk of train derailments and subsequent release and combustion of crude oil and petroleum gas substantially reduced train performance and line capacity on the simulated representative corridor. Although increases in allowable delay would still allow a substantial amount of traffic to cross the network, these trains would progress at very slow speeds, leading to increased crew costs. Slow speeds and increased cycle time would require additional motive power and railcars to transport a given volume of traffic, further increasing costs ( 16 ). The higher cost of running these trains under such significant speed restrictions could alter the economics of transporting these commodities by rail.
Depending on the LOS, location, and simulation tool, the original hazmat speed restrictions under MO 20-02 doubled or tripled the average train delay and led to a loss of mainline capacity in excess of 60% on the representative single-track mainline. This level of capacity loss could be problematic for maintaining rail service for all shippers on critical rail corridors currently operating at or near capacity. Since the cost of constructing railroad track infrastructure provides freight railroads with a strong economic incentive to carefully match track infrastructure and line capacity to traffic demand, most mainline corridors do not have substantial excess line capacity. Losing over half the existing mainline capacity on corridors with key trains may necessitate either a limit on shipments or substantial track and/or advanced control system investments to continue to support the LOS demanded by customers. Limiting shipments is undesirable because transferring freight to other modes has implications for the congestion of those modes, and potentially disruptive to industrial activity with possible widespread economic and employment consequences. Since these other modes are not without their own safety risks, future hazmat train speed regulations should consider the safety and environmental effects of modal shifts, and the economic ramifications of the proposed restrictions.
The track expansion investments required to maintain capacity and LOS under these magnitudes of hazmat train speed restrictions would be substantial. Track expansion may not be feasible in congested urban areas with narrow right-of-way; in remote areas with difficult terrain, bridges, and tunnels; or in areas with particular environmental concerns. Such investments are also long term and not fungible, making them high-risk since crude oil hazmat traffic in particular has proven to be volatile in relation to overall volume and origin–destination routing subject to global pricing and market pressures. A detailed risk analysis should be conducted to determine whether the equivalent investment in track infrastructure required to maintain capacity under hazmat speed restrictions could more effectively reduce risk if applied to other mitigation strategies such as increased frequency of track and rail flaw inspection ( 17 ), and additional wayside inspection and monitoring of rolling stock for defects, which could reduce the derailment risk for all trains, not just those subject to the hazmat key train restrictions.
Disparities between the results of the two tools can be explained by the different functionality of the algorithms. RTC will almost always use overtaking when a high priority train is trailing behind a low priority train, even to the point that it endangers network fluidity. In contrast, the dispatching algorithm in GTMS, which is based on the NNCO, will rarely perform overtaking, but will all but guarantee that traffic continues flowing in the network. In practice, this leads to traffic composition and heterogeneity playing a larger role in GTMS train performance than RTC, whereas GTMS has a lower train performance cost for additional traffic volume than RTC. In addition, GTMS produces lower unit train delay in homogeneous traffic resolution than RTC, as shown in the baseline scenarios. GTMS is easier to access than RTC, and takes less time to produce a simulation, whereas RTC can produce more detailed and customizable simulations.
Future work should be conducted to examine and quantify the specific impact of the final and less stringent MO 20-05 speed restrictions on line capacity, which impose speed restrictions of 25 to 50 mph depending on location, temperature, time of year, and quantity of tank cars with crude oil or petroleum gas. The combination of seasonal speed restrictions and seasonal traffic flows and traffic demands for certain commodities may lead the capacity and performance impacts of MO 20-05 to be rather line specific and better investigated through specific case studies of actual corridors instead of representative mainline simulations. Furthermore, since much of the North American rail network contains more than just two train types and single track, future research should examine the effects of these speed restrictions on networks with several train types and on multi-track mainlines, with a sensitivity analysis to compare the importance of these different route factors. Finally, additional train delay and capacity loss mitigation strategies should be investigated, such as fleeting groups of the restricted speed hazmat trains ( 18 , 19 ), or implementing advanced train control systems that incorporate virtual and moving blocks ( 20 ), to determine their effectiveness at reducing the impact of hazmat train speed restrictions. International approaches to managing hazmat shipments by rail could also be researched to help inform future policy decisions in relation to hazmat train speed restrictions.
Footnotes
Acknowledgements
The authors thank Daniel Brod of Decisiontek for the use and continued technical support of General Train Movement Simulator, and Eric Wilson of Berkley Simulation Software, LLC for the use and continued technical support of Rail Traffic Controller simulation software.
Author Contributions
The authors confirm contribution to the paper as follows: study conception and design: M. Parkes, C.T. Dick, A. Diaz de Rivera; data collection: M. Parkes, A. Diaz de Rivera; analysis and interpretation of results: M. Parkes, C.T. Dick, A. Diaz de Rivera; draft manuscript preparation: M. Parkes, C.T. Dick. All authors reviewed the results and approved the final version of the manuscript.
Declaration of Conflicting Interests
The authors declared no potential conflicts of interest with respect to the research, authorship, and/or publication of this article.
Funding
The authors disclosed receipt of the following financial support for the research, authorship, and/or publication of this article: This research was supported by the Association of American Railroads and the University of Illinois Department of Civil and Environmental Engineering Research Experience for Undergraduates Program. The third author was supported by the CN Research Fellowship in Railroad Engineering.
