



Abstract
The capacity to resist flooding is one of the critical challenges of pavement resiliency in locations subject to inundation. Flooding increases moisture contents, which weakens most pavement materials. Although the effect of moisture on the mechanical properties of most pavement materials is reversible, the structural damage caused by trafficking applied on the weakened pavement structure is not. The critical time for structural damage is typically after the flood and before “life-line” pavements have dried back when trucks are bringing in relief supplies and hauling out demolition. This fact, together with the increased occurrence of extreme weather events and sea level rise resulting from climate change, emphasizes the need to better understand the impacts of flooding on identified life-line pavements. This paper evaluates the flooding resiliency of thin concrete overlay on asphalt (COA) pavements by studying the effects that water saturation produces on the pavement structure. The research is based on the structural response and distresses measured in five thin COA sections that were instrumented with sensors and tested with a heavy vehicle simulator (HVS) under flooded conditions. The research shows that the flooding did not produce a noticeable change in the structural capacity of the COA, based on the structural response measured under the loading of the HVS wheel and the falling weight deflectometer, but did result in some structural damage to the asphalt base in some of the sections.
Keywords
The capacity to resist flooding is regarded as one of the critical challenges of pavement resiliency ( 1 ). Flooding is typically the result of heavy rainstorms, but it may also be connected to sea level rise, and it can be aggravated by a poor drainage system ( 2 ). The increased recurrence of extreme weather events and sea level rise can both be attributed to climate change, and have prompted the need to better understand the impacts of flooding on pavements ( 3 – 5 ). California alone has 78 centerline miles of pavements in its state highway system and many more miles of local roads in the coastal areas that would be exposed to a 100-year storm surge, and this figure is projected to increase considerably as sea level continues to increase ( 6 ). (Note: a storm surge is defined as a rise of sea level resulting from wind and atmospheric pressure changes associated with a storm.) Other states, particularly along the eastern U.S. seaboard and Gulf coast, will experience large increases in critical storm intensities and are flatter and more vulnerable to storm surges.
The excess water introduced by flooding can dramatically increase the moisture content of materials in pavements to the point of saturation, which is known to weaken the mechanical properties of most paving materials. For unbound materials, such as subgrade soils, aggregate base and subbase, and full-depth reclaimed materials without stabilization, the stiffness decreases while the susceptibility to rutting increases as moisture content increases ( 7 ). The stiffness of asphalt mixes is also known to decrease as moisture content increases, and the same loading applied under wet condition can result in considerably more damage compared with when applied under dry condition ( 8 ). Water can also weaken the bond between pavement layers which can considerably weaken the pavement structure ( 9 , 10 ). Portland cement concrete and concrete made with other hydraulic cements are not susceptible to weakening as a result of moisture increase ( 11 ). Nonetheless, rigid pavements are susceptible to flooding damage because of weakened underlying structure. Erosion of pavement materials as a result of flooding runoff is another major concern ( 1 ).
Although the effect of moisture on the mechanical properties of most pavement materials is mostly reversible, the increased structural damage caused by trafficking during flooding is not ( 7 , 8 ). Although many roads can be closed after a rainfall or storm surge causing flooding, “life-line” roads must be kept open. These often are subjected to temporarily increased numbers of axle loads and heavier axle loads while in a weakened state after an event because traffic is concentrated on them if other roads are closed, and because these roads need to carry relief supplies in and demolition out of the affected area as soon as flood waters begin to recede. Examples of structural damage include microcracking and discrete cracking of asphaltic and cement-treated materials, rutting of asphaltic and unbound materials, loss of bonding between layers, and concrete slab and asphalt surface settlement, among others. Unfortunately, there is very little research about the structural damage that a pavement structure accumulates under flooded conditions. The lack of research is in part because of the novelty of flooding as a major concern, until recently, but also because of the complexity of the research topic. While studying the moisture effect on a specific material in the laboratory is relatively standard and has been done in the past, studying the effects of flooding on a real pavement structure requires complicated experiments and is relatively uncommon.
The research presented in this paper attempts to fill the knowledge gap mentioned in the previous paragraph based on the experimental data collected from five full-scale thin concrete overlay on asphalt (COA) pavement sections that were flooded and tested under flooded conditions with repeated loading applied by a heavy vehicle simulator (HVS).
Objective
The goal of the research presented in this paper is to evaluate the flood resiliency of thin COA pavements by studying the effects that water saturation produces on the pavement structure. The research is based on the structural response and distresses measured in five thin COA sections that were instrumented with sensors and tested with a HVS under flooded conditions. The research was structured to answer the following questions:
Did the structure of the COA soften because of the flooding? How long did the softening last?
What was the damage produced by traffic loading applied under flooded conditions, compared with the damage produced by the traffic loading applied under normal conditions?
Scope
Thin COA, also known as thin whitetopping, is a pavement rehabilitation technique that consists of 100 mm (4 in.) to 175 mm (7 in.) thick concrete overlay on an existing asphalt pavement. While the research is based on thin COA data, some of the conclusions can be extrapolated to standard jointed plain concrete pavements.
The flooding of the thin COA sections was achieved by ponding water on the sections, while no water runoff was simulated. Consequently, the negative effects of the flooding related to the runoff, including washing away of pavement materials, were not being studied.
The flooding considered in this research is characterized by two main factors: (1) pavement materials reach saturation, and (2) saturation conditions are maintained for a relatively long period of time while the road is opened to traffic, such that traffic loading—under those unfavorable conditions—may produce cumulative damage. Coastal, river, flash, groundwater, and sewage floods may potentially result in this scenario.
Full-Scale Experiment
The five sections studied in this research are part of a wider experiment that focused on the implementation of COA in California, U.S. The experiment was conducted for the California Department of Transportation (Caltrans) between 2014 and 2017 ( 12 , 13 ). As part of this wider experiment, 11 COA sections were tested with the HVS. Five of the sections—the five sections studied in this research—were subjected to flooding and then tested with the HVS under flooded conditions. The five COA sections are presented in Figure 1.
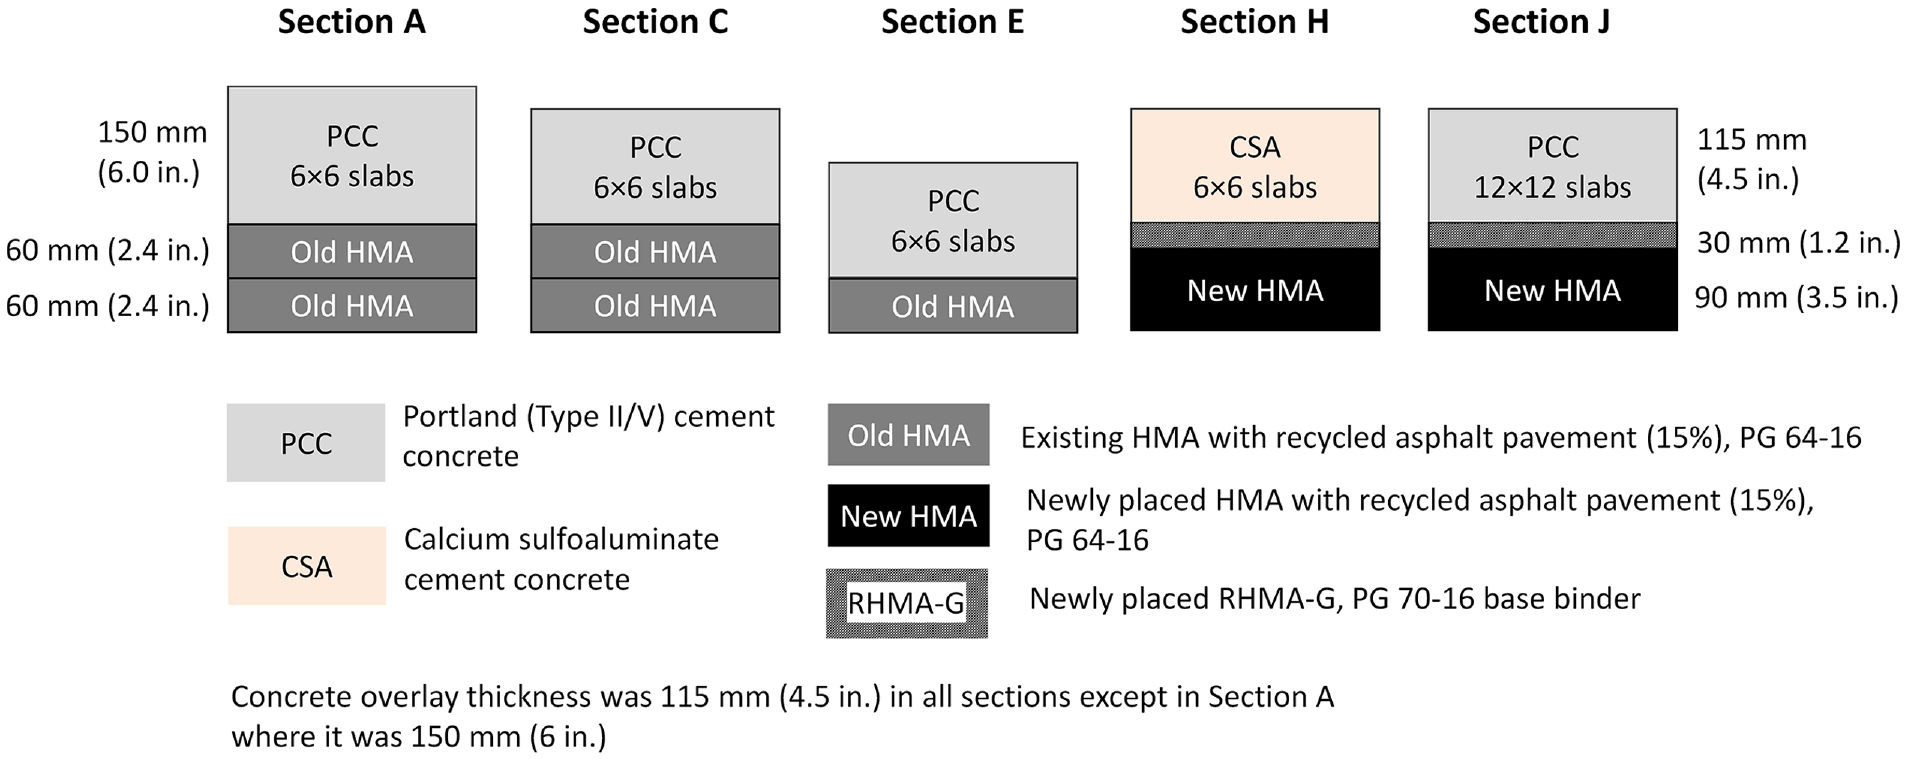
Full-scale sections.
The five tested sections include two rapid strength concrete mixes, one made with Type II/V portland cement and another made with calcium sulfoaluminate cement. The design opening time of these two mixes was 10 h and 4 h, respectively, based on a 2.8 MPa (400 pounds per square inch) flexural strength requirement. The asphalt base included an old hot mix asphalt (HMA) that had been built and tested with the HVS for a previous research project on full-depth reclamation, and a newly placed HMA base that included a thin rubberized hot mix asphalt gap-graded (RHMA-G). The old HMA surface was either milled or micromilled to remove surface distresses and to create a uniform surface for the overlay construction. Two slab sizes were used: 1.8 × 1.8 m (6 × 6 ft) and 3.6 × 3.6 m (12 × 12 ft); these two slab sizes are referred to as 6 × 6 and 12 × 12, respectively, in this paper. The thickness of the concrete overlay was 115 mm (4.5 in.) in all sections except in Section A, where it was 150 mm (6 in.). The structure below the asphalt base was the same for all sections. It included a 250 mm (10 in.) thick unstabilized full-depth reclamation layer resting on 320 mm (12.6 in.) of crushed aggregate base on top of a prepared subgrade.
The five sections were subjected to a “dry” HVS loading sequence under ambient conditions, including precipitation that could run off the pavement. Then they were subjected to a 10-day flooding during which water was ponded on the pavement surface (Figure 2, left). After the 10-day ponding, the HVS testing proceeded while water was continuously supplied on the pavement surface (Figure 2, right). The goal of the flooding approach was to ensure that the asphalt base and the concrete-asphalt interphase remained close to saturation during the HVS testing. The water supplied during the HVS testing resulted in a water pond that continuously and permanently covered the asphalt base. The HVS testing conducted under such conditions is referred as “flooded” HVS testing in this paper. The dry and flooded HVS testing loading sequences included increasing wheel loads up to 100 kN (22.5 kip), that is, more than twice the legal load limit in California, applied with 70,000 wheel passes each as shown in Figure 3.
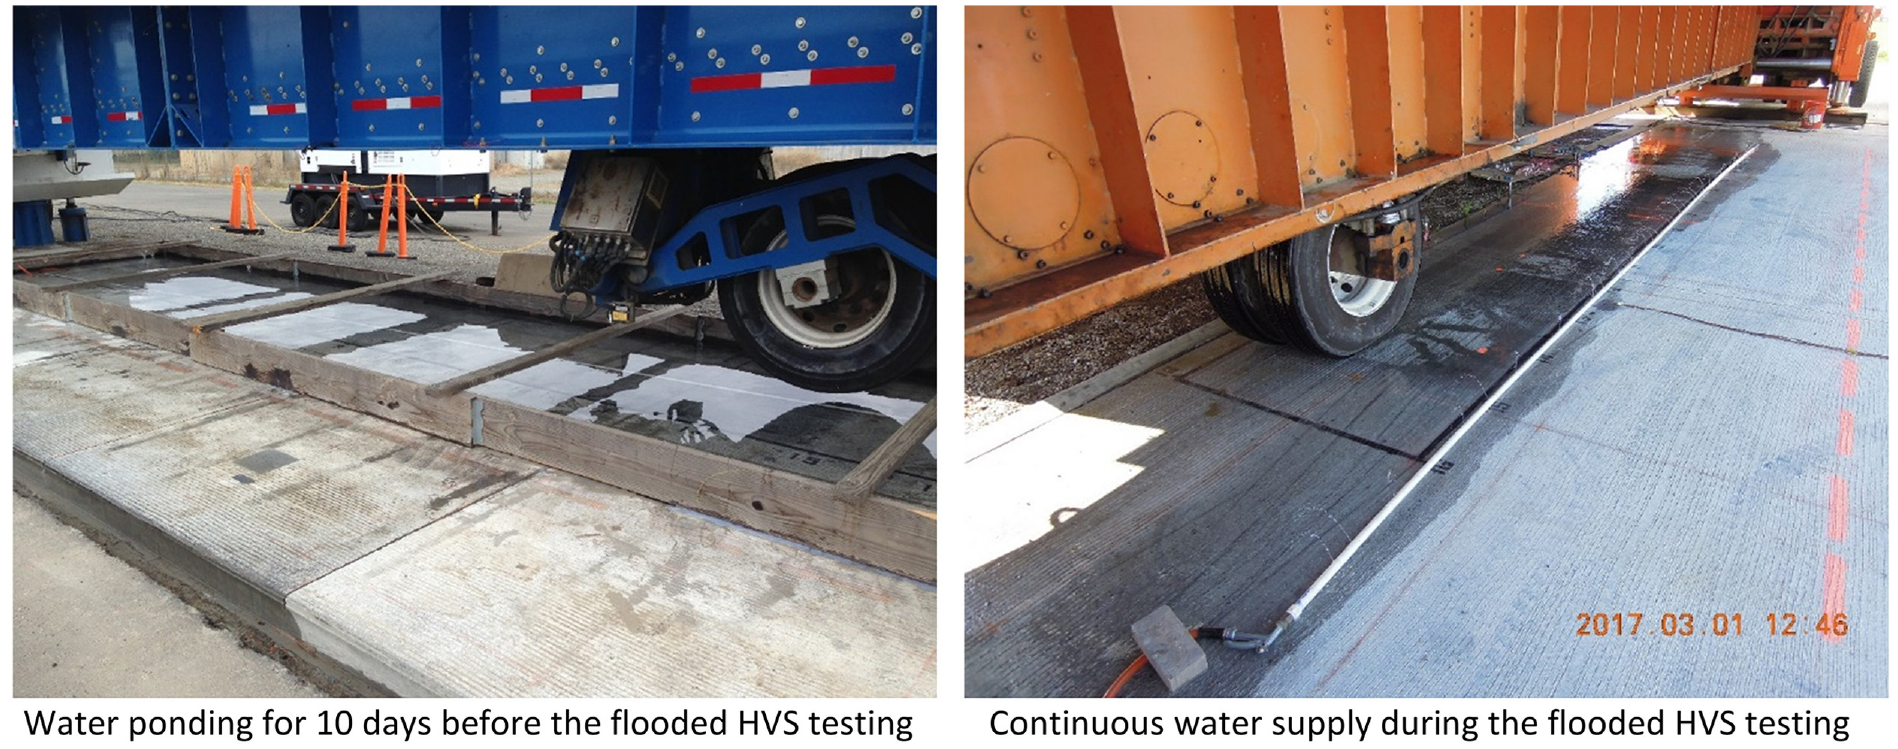
Flooding of the sections.
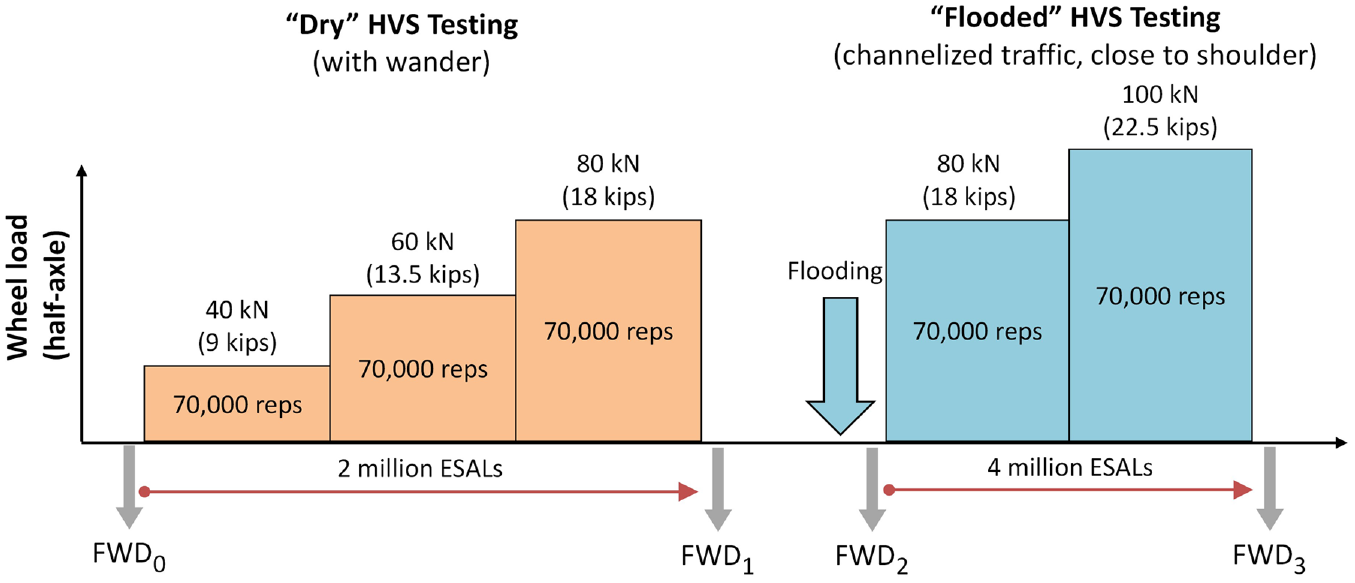
Testing protocol.
During the dry HVS testing, a 1.3 m (4.3 ft) wander pattern was applied, approximately centered in the slab, that was intended to reproduce the wander of real traffic. During the flooded HVS testing, the HVS traffic was channelized (no wander) with the HVS wheel running close to the shoulder edge of the slabs—the outer edge of the HVS dual wheel was at 200 mm (8 in.) distance from the edge of the slabs. Bidirectional traffic was applied in both the dry and the flooded HVS tests.
No temperature control was conducted during the HVS testing, so slab and asphalt temperatures changed daily and seasonally.
The COA sections were instrumented with thermocouples, dynamic strain gages (resistive type), and joint displacement measuring devices (JDMD), as shown in Figure 4. The dynamic strain gages were used to measure concrete and asphalt transient strain under the pass of the HVS wheel and under the falling weight deflectometer (FWD) pulse loading. The JDMDs include linear variable differential transformer (LVDT) sensors to measure corner settlement and transient corner deflection under the pass of the HVS wheel. The structural response of the sections under the HVS wheel was periodically collected during the HVS tests. Also, the sections were evaluated with the FWD before and after each HVS test, as shown in Figure 3:
Evaluation FWD0: Before the dry HVS testing
Evaluation FWD1: After the dry HVS testing, before flooding
Evaluation FWD2: After flooding, before the flooded HVS testing
Evaluation FWD3: After the flooded HVS testing
In each FWD evaluation, the COA section was tested at multiple locations multiples times during the same day.
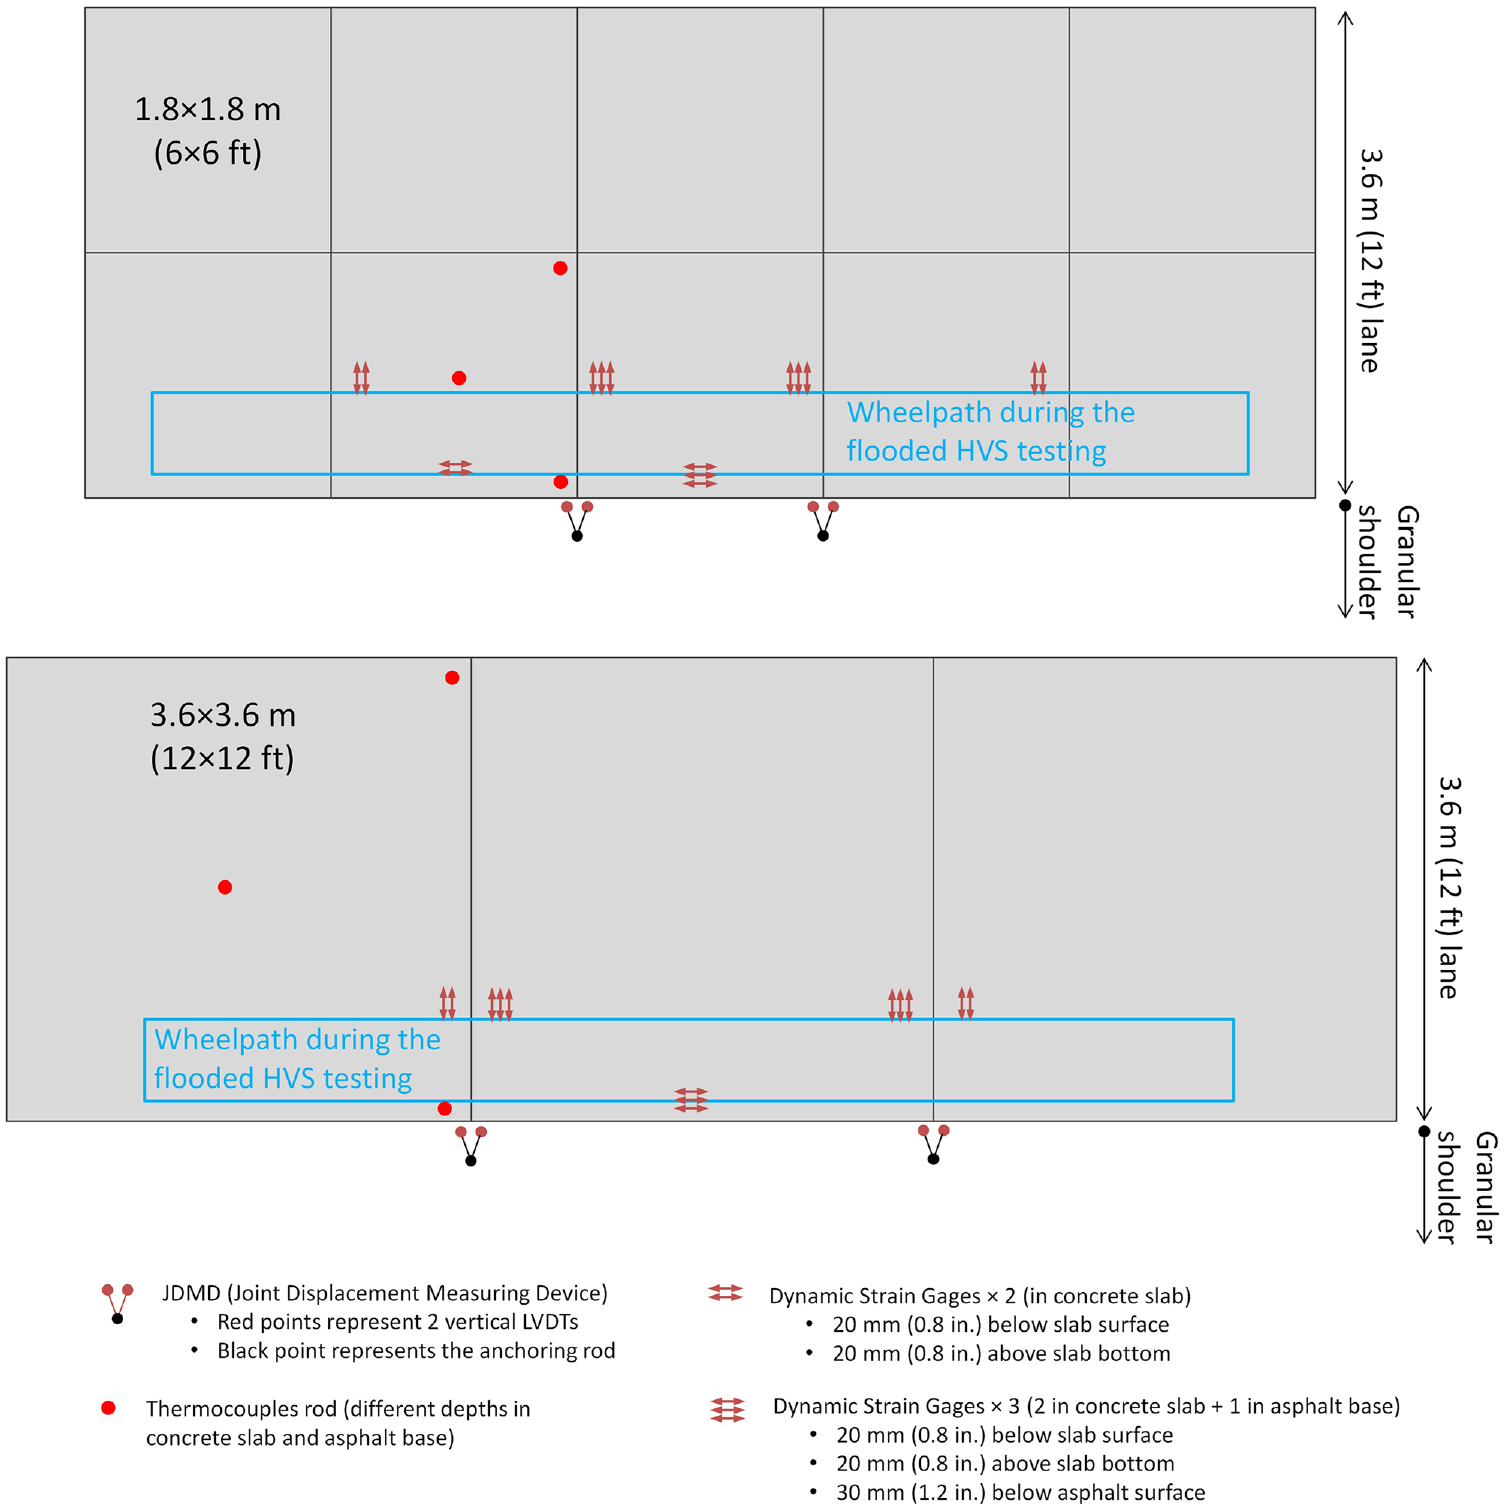
Instrumentation of the sections.
In practice, up to 6 months (depending on the section) passed between the FWD1 evaluation, conducted right after concluding the dry HVS testing, and the FWD2 evaluation, conducted right after the 10-day ponding. This is because of the experiment set-up: the flooding of the sections began when all sections had been tested with the HVS in dry conditions. Otherwise, since the sections were close to one another, the flooding of one section would have affected the dry HVS testing of the other sections.
Neither the dry nor the flooded HVS testing produced any slab crack in any of the sections. For this reason, one of the sections (Section J) was subjected to an extended HVS testing under flooded conditions, including 100 kN (22.5 kip) wheel load and channelized traffic at the shoulder edge of the slabs. Corner cracking occurred in Section J after 120,000 additional repetitions. Using AASHTO load equivalency factors, Section J supported 12 million equivalent single axle loads before it cracked.
Analysis of Experimental Data
Did the Structure of the COA Soften as a Consequence of the Flooding?
The comparison between the structural response measured under the FWD loading before (FWD1) and after (FWD2) the flooding of the sections contributes to providing an answer to the first question that was formulated in the introduction: Did the structure of the COA soften as a consequence of the flooding?
The evaluation FWD1 was conducted after the dry HVS testing, before the sections were flooded. The evaluation FWD2 was conducted after the 10-day ponding, before the flooded HVS testing began. Consequently, the main difference between the condition of the sections in those two evaluations was expected to be the flooding. The temperature of the asphalt base also differed between FWD1 and FWD2 evaluations. The comparison between FWD1 and FWD2 evaluations is presented in relation to deflection in Figure 5 and in relation to concrete strain in Figure 6, in the two cases measured under FWD loading applied at the transverse joints (the loading was applied on top of the strain gages located at the transverse joints). The deflection was measured with the FWD geophone located at the FWD loading plate, while the concrete strain was measured with the strain gages embedded in the concrete at the top and bottom of the slabs.
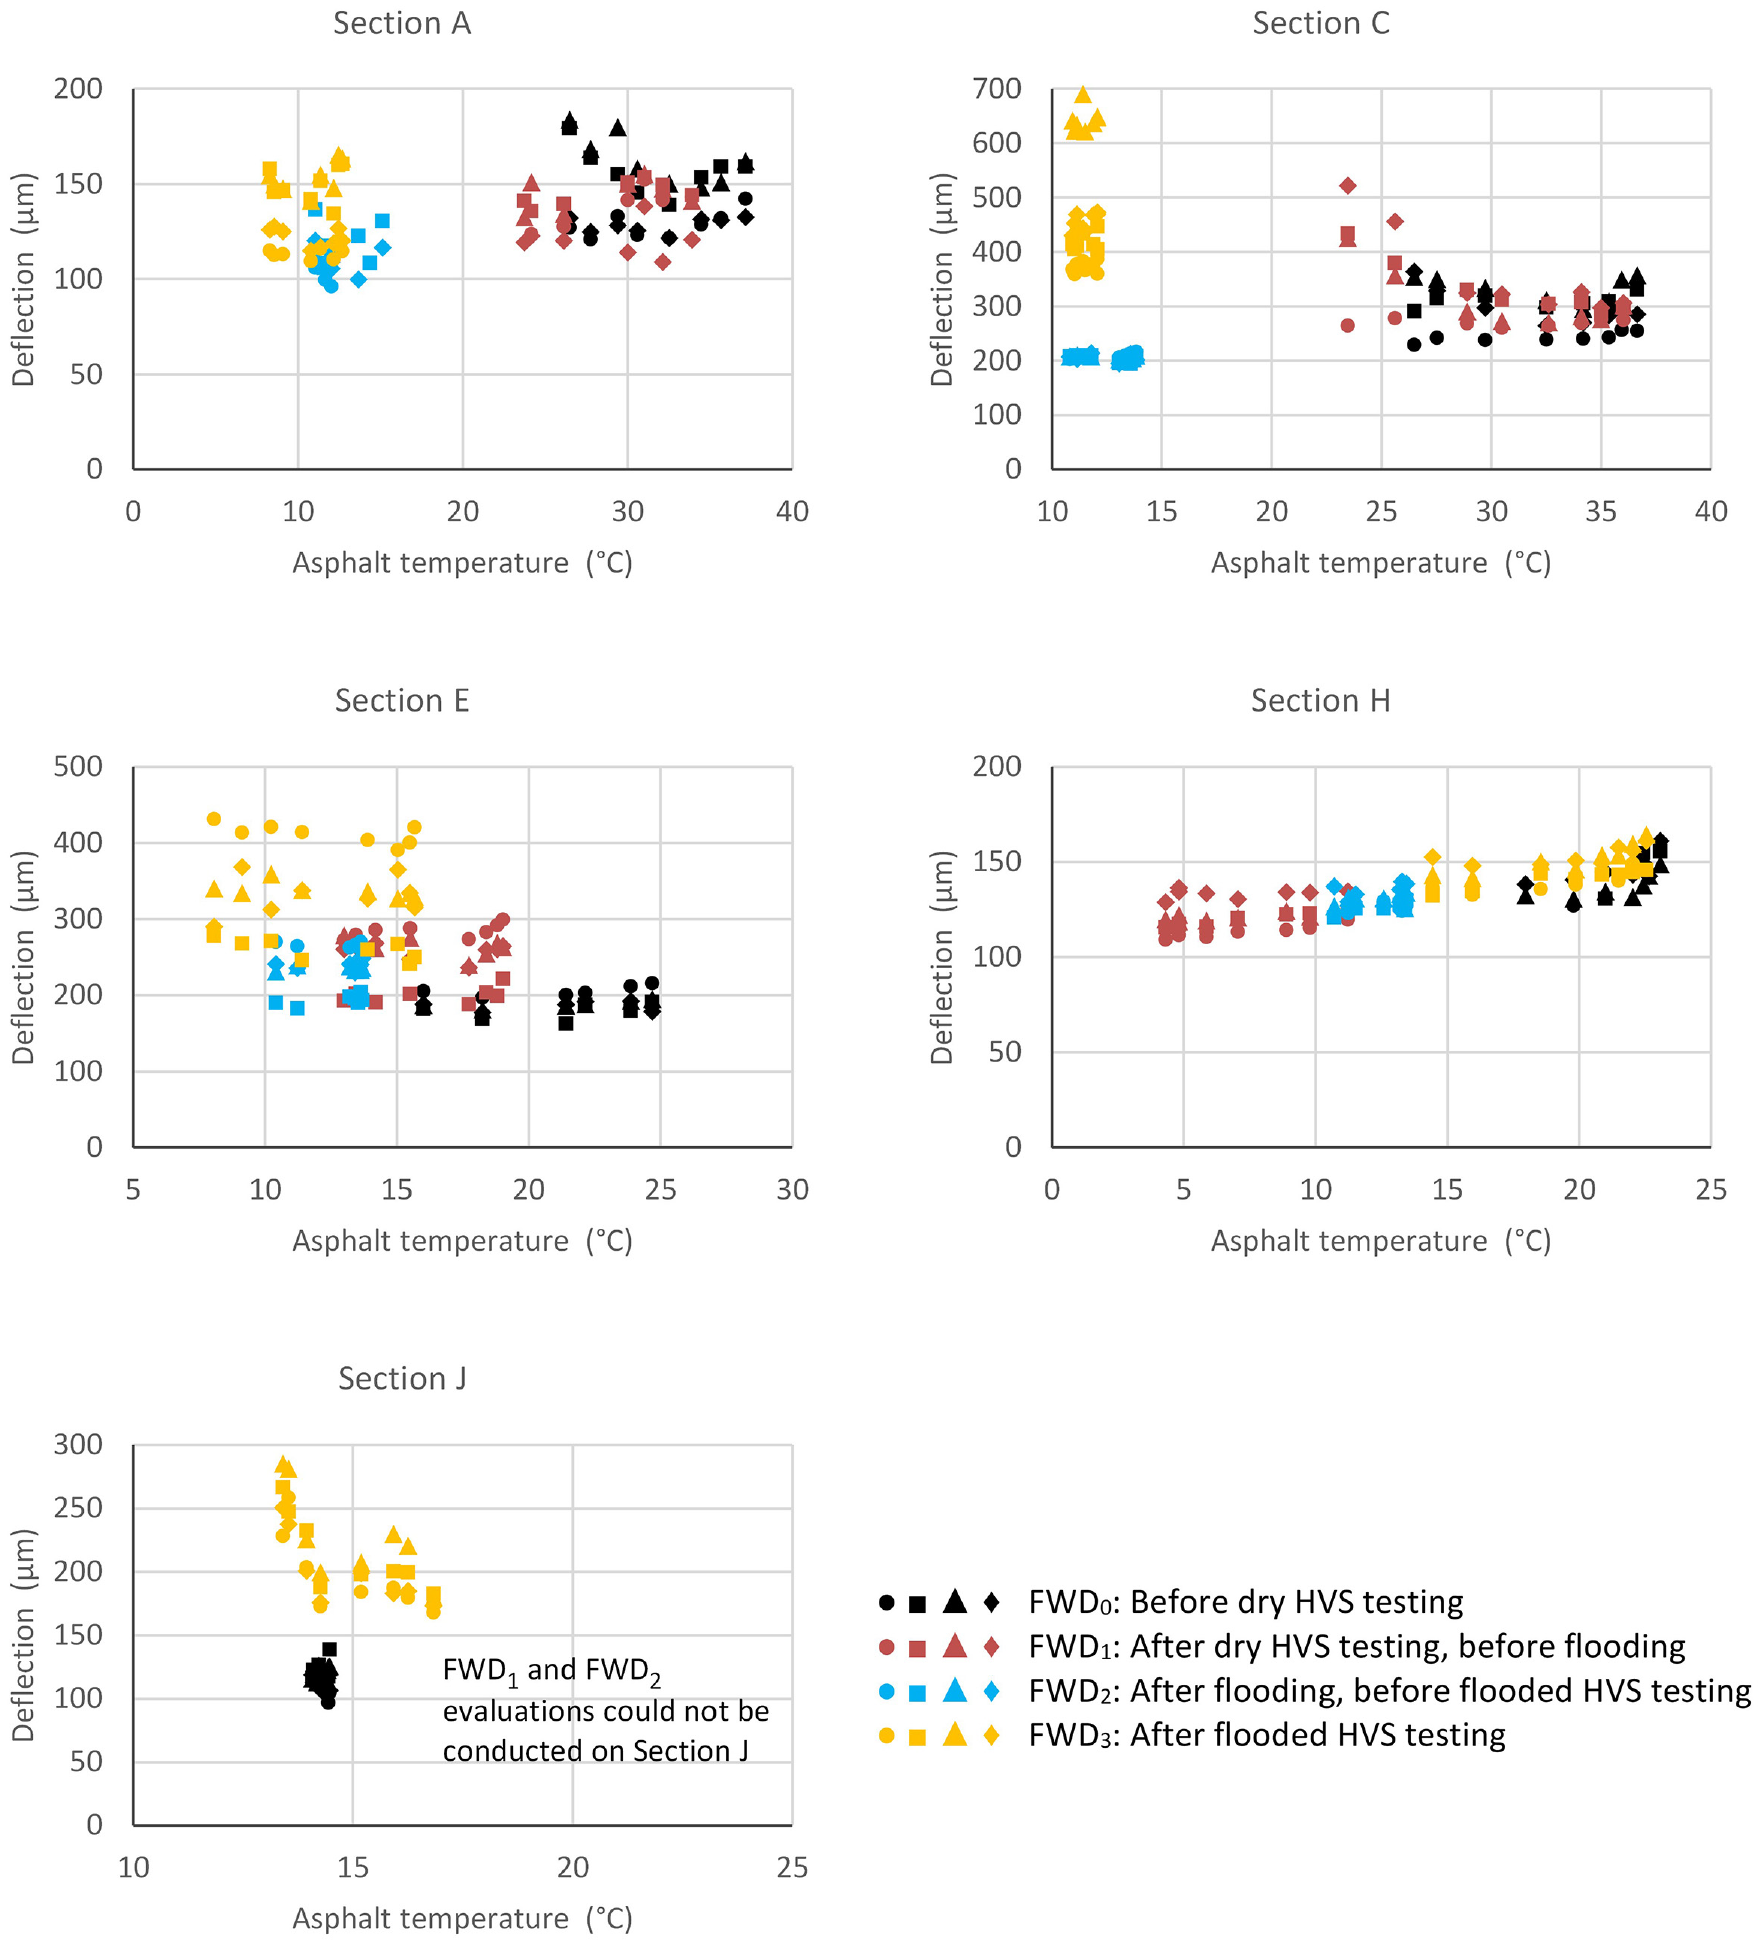
Evolution of deflection under 60 kN (13.5 kip) falling weight deflectometer (FWD) loading (measured at transverse joints).
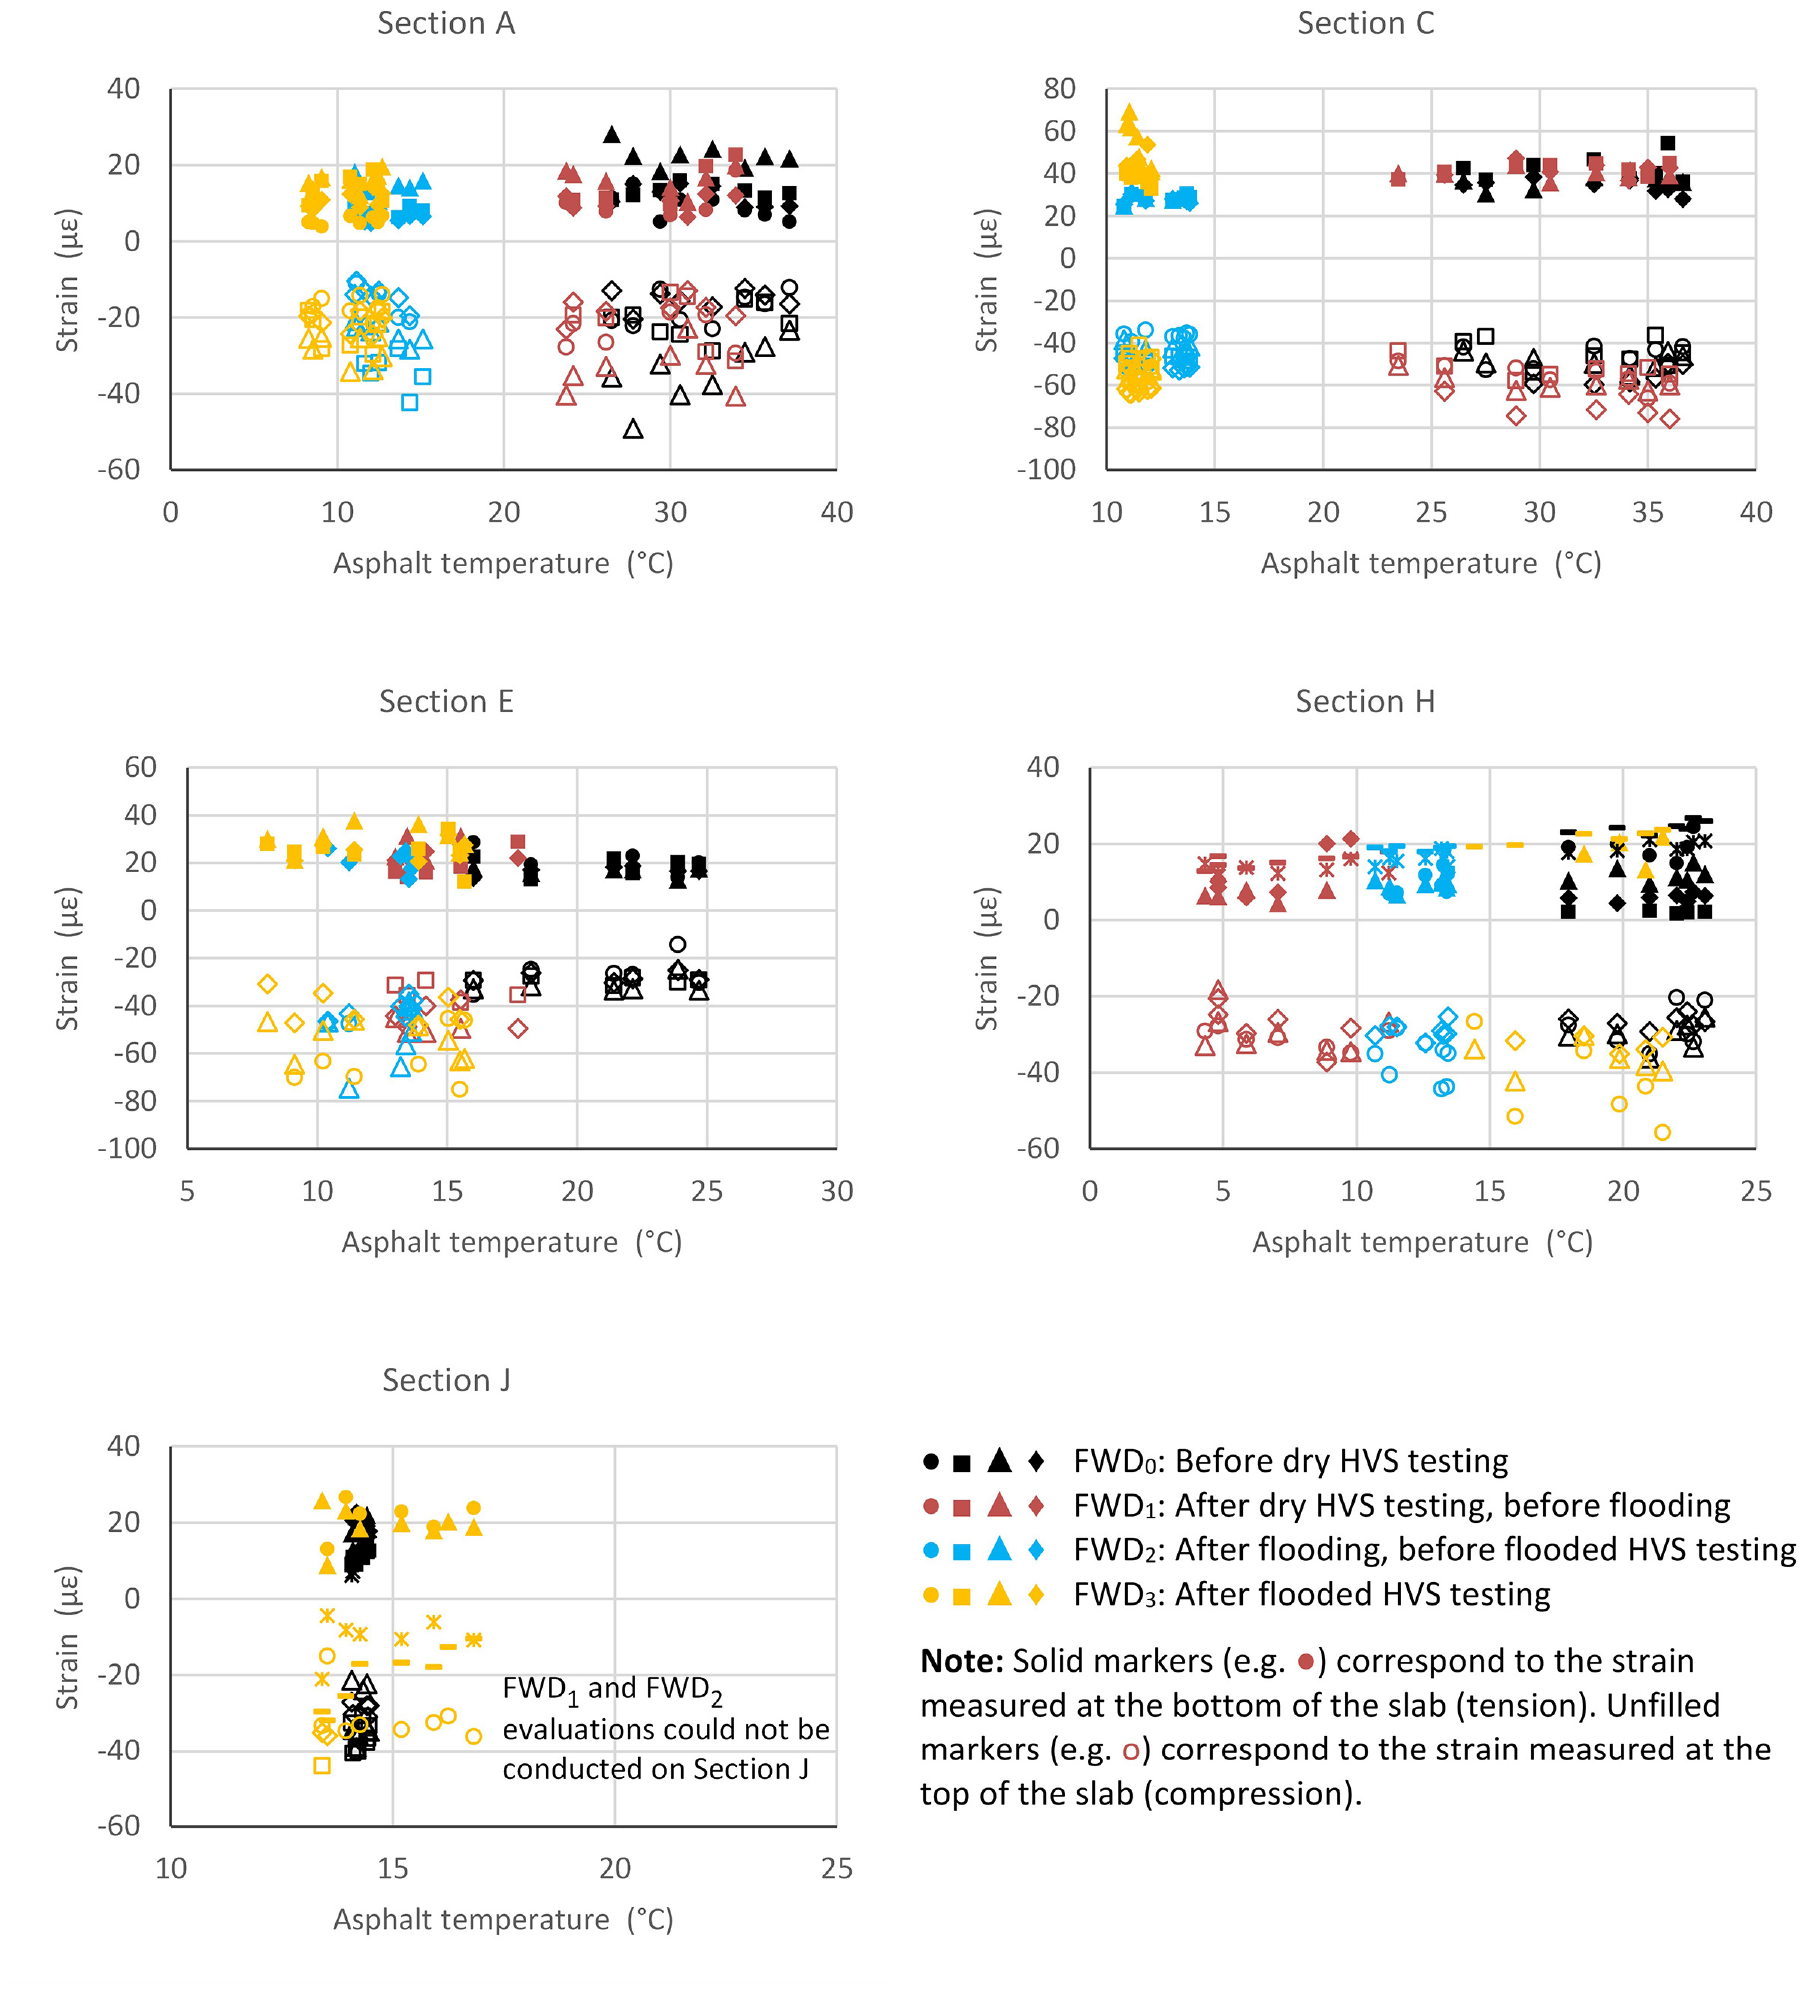
Evolution of strain under 60 kN (13.5 kip) falling weight deflectometer (FWD) loading (measured at transverse joints).
Based on the comparison between the structural response measured in FWD1 and FWD2 evaluations, presented in Figures 5 and 6, the 10-day flooding did not seem to produce any weakening of the COA structure. While there are some differences between the deflections and strains measured in the two evaluations, the differences can be explained by the changes in the temperature of the asphalt base (i.e., changes in asphalt base stiffness). Further, the differences between the response measured in FWD1 and FWD2 evaluations are comparable to the variability from one test location to another (within the same section).
The flooding had also a negligible impact on the transverse joints load transfer efficiency (LTE) measured with the FWD, as shown in Figure 7 (compare LTE at FWD2 versus FWD1 evaluations in this figure). Note that Section E had suffered a considerable structural damage (in relation to LTE) during the dry HVS testing, likely related to the thinness of its asphalt base, despite which the flooding did not produce further damage.
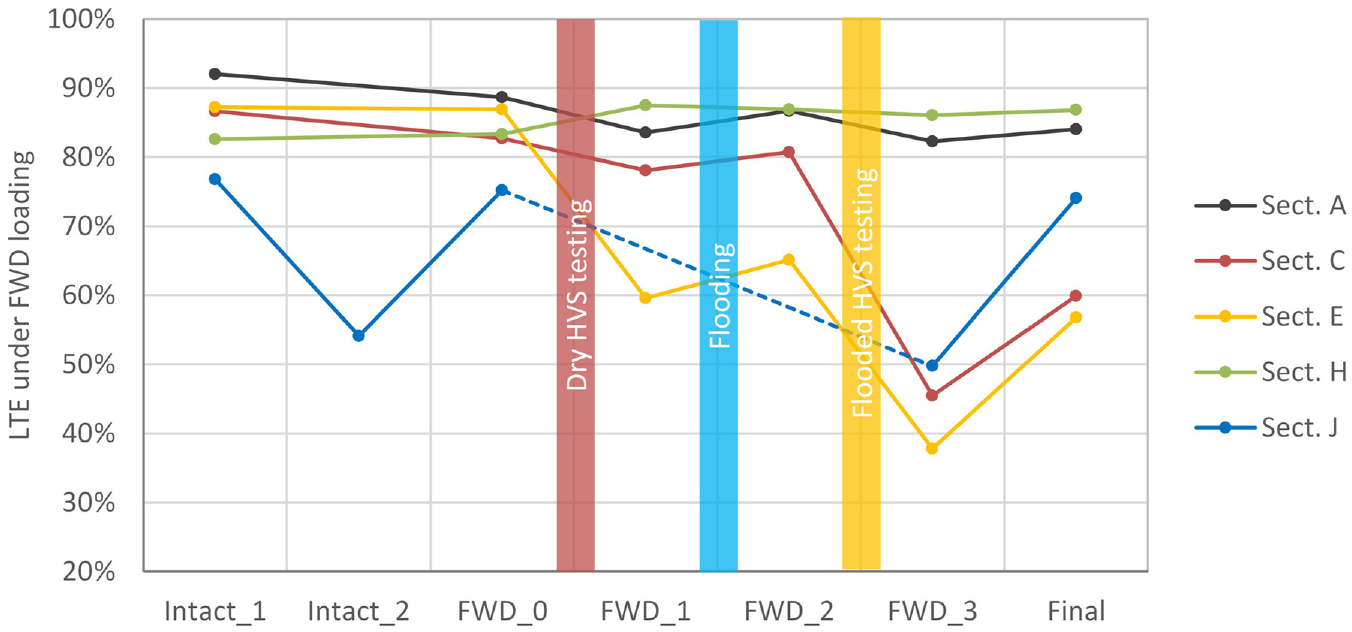
Evolution of load transfer efficiency (LTE) measured with falling weight deflectometer (FWD).
The relatively small impact of the flooding on the overall stiffness of the COA structure can be also deduced based on the corner deflection measured with JDMD sensors under the pass of the HVS wheel, shown in Figure 8. As shown in the figure, the corner deflection measured at the beginning of the flooded HVS testing (after cycle 210,000) was not higher than the corner deflection measured at the end of the dry HVS testing (before cycle 210,000). In fact, for three of the five sections the corner deflection was smaller at the beginning of the flooded HVS testing than at the end of the dry HVS testing. This outcome was attributed to the higher asphalt temperature (lower stiffness) and the higher drying shrinkage warping during the dry HVS testing of these sections compared with the flooded HVS testing. The dry HVS testing of these sections was conducted during the warm-dry season while the flooded HVS testing was conducted during the cold-wet season. In other words, the effect of the flooding on the corner deflection was surpassed by the effect of the seasonal variation of asphalt temperature and slab warping.
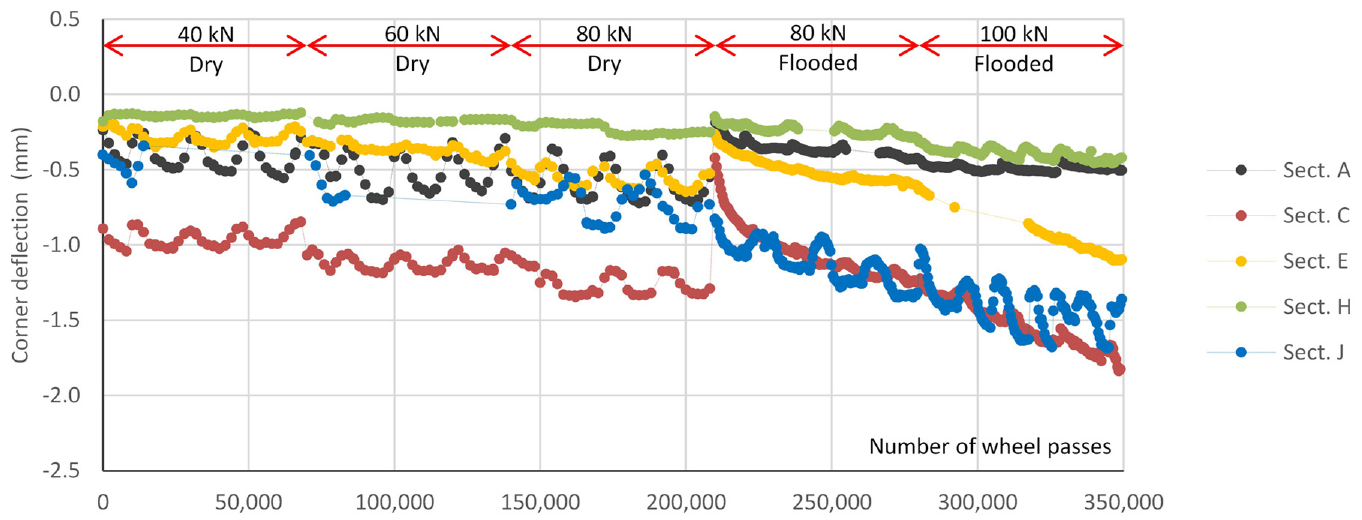
Evolution of corner deflection under the heavy vehicle simulator (HVS) wheel (wheel running at shoulder edge).
The small impact that the flooding produced on the structure of the COA was not expected, since the increase in moisture content is known to result in the softening of soils, unbound aggregates, and asphalt mixtures. It is very likely that the relatively low air void content of the HMA (around 4%) and the high binder content of the RHMA-G (around 7% by weigh of the aggregates) contributed to reduce the susceptibility of these materials to weakening associated with the water ingress under flooding conditions. Laboratory testing of the HMA used in the COA sections indicated that its stiffness would reduce around 50% under saturated conditions, although the saturation in the laboratory required the application of vacuum to the asphalt specimens ( 9 ). Very likely, prolonged flooding periods (longer the 10-day period used in this research) might have resulted in some weakening of the structure of the COA. The high quality of the subbase layers, made of full-depth reclaimed asphalt and crushed aggregates, was also believed to contribute to the small impact that flooding produced on the structure of the COA.
What was the Damage Produced by Traffic Loading Applied under Flooded Conditions?
The structural damage produced during the flooded HVS testing varied from section to section. Two of the sections (A and H) did not experience any notable damage. In these two sections, deflection and concrete strain measured under the FWD loading at the transverse joints (Figures 5 and 6), transverse joints LTE measured with FWD (Figure 7), and corner deflection measured with JDMDs under the passing of the HVS wheel (Figure 8) do not suggest the onset of any structural damage. The excellent condition of these sections was verified by a forensic evaluation conducted after the flooded HVS testing. The forensic evaluation included extensive coring of the sections at different locations, including slab center, transverse joints, and shoulder edge of the slabs. The coring revealed that concrete and asphalt and its bonding were in perfect condition ( 14 , 15 ).
In two of the sections (C and E), the corner deflection measured with JDMDs under the passing of the HVS wheel (Figure 8) suggests that the HVS testing under flooded conditions produced some structural damage. As shown in Figure 8, the rate of increase in deflection versus number of cycles (slope) speeds up at the beginning of the flooded HVS testing compared with the end of the dry HVS testing (80 kN wheel loading, cycle 210,000). Nonetheless, the increase in slope may not only be related to the introduction of the flooding but to the use of channelized traffic during the flooded HVS testing (while realistic wander was applied during the dry HVS testing).
The forensic evaluation revealed that Sections C and E transverse joints had propagated through the asphalt base, which did not occur in Sections A and H. The joint propagation through the asphalt base would explain the drop in transverse joints LTE that Sections C and E experienced during the flooded HVS testing (Figure 7). The forensic evaluation also evidenced that concrete and asphalt were debonded in most cores extracted from Section C.
It should be mentioned that the structural condition of Section C asphalt base was poor, mainly because of the presence of alligator cracking and the debonding between asphalt lifts that occurred during the milling operation. Thin COA is typically disregarded as a rehabilitation alternative when the structural condition of the asphalt base is poor. Concerning Section E, its asphalt base thickness is below the minimum value of 75 mm (3 in.) that the practice of thin COA recommends ( 16 ). Neither of these two sections would be typically considered as a candidate to thin COA rehabilitation, based on current practice ( 16 ).
Section J particularity was its slab size, 3.6 × 3.6 m (12 × 12 ft), which is bigger than the half-lane width slabs, 1.8 × 1.8 m (6 × 6 ft), typically used with thin COA. Because of the slab size, Section J transverse joints’ LTE was poor and it was highly affected by the ambient environmental conditions even before the HVS testing of the section (see Intact1, Intact2, and FWD0 LTE in Figure 7) ( 15 ). The forensic evaluation of this section revealed that concrete and asphalt were debonded at the perimeter of the slabs. This debonding, which occurred before the section was tested with the HVS, was a result of slab warping and curling under the drying shrinkage and thermal actions ( 14 ).
The increase in Section J corner deflection versus the number of cycles speeded up when the flooded HVS testing began (Figure 8), although not as much as in the previous two sections (C and E). In Section J, the effect of the flooding can be better observed in Figure 9, which shows the strain measured at the transverse joints as the HVS wheel was running along the shoulder edge of the slabs. Note that, under such loading configuration, the corner of the slab tends to work in cantilever and so the strain at the top is tensile while the strain at the bottom is compressive. As shown in Figure 9, the strain at the top and bottom locations started to increase (in absolute value) at the beginning of the flooded HVS testing. Again, it is not clear what part of this outcome is because of the flooding and what part is a result of the channelized traffic applied during the flooded HVS testing. In any case, the strain evolution pattern shown in Figure 9 suggests the loss of support under the slab corner.
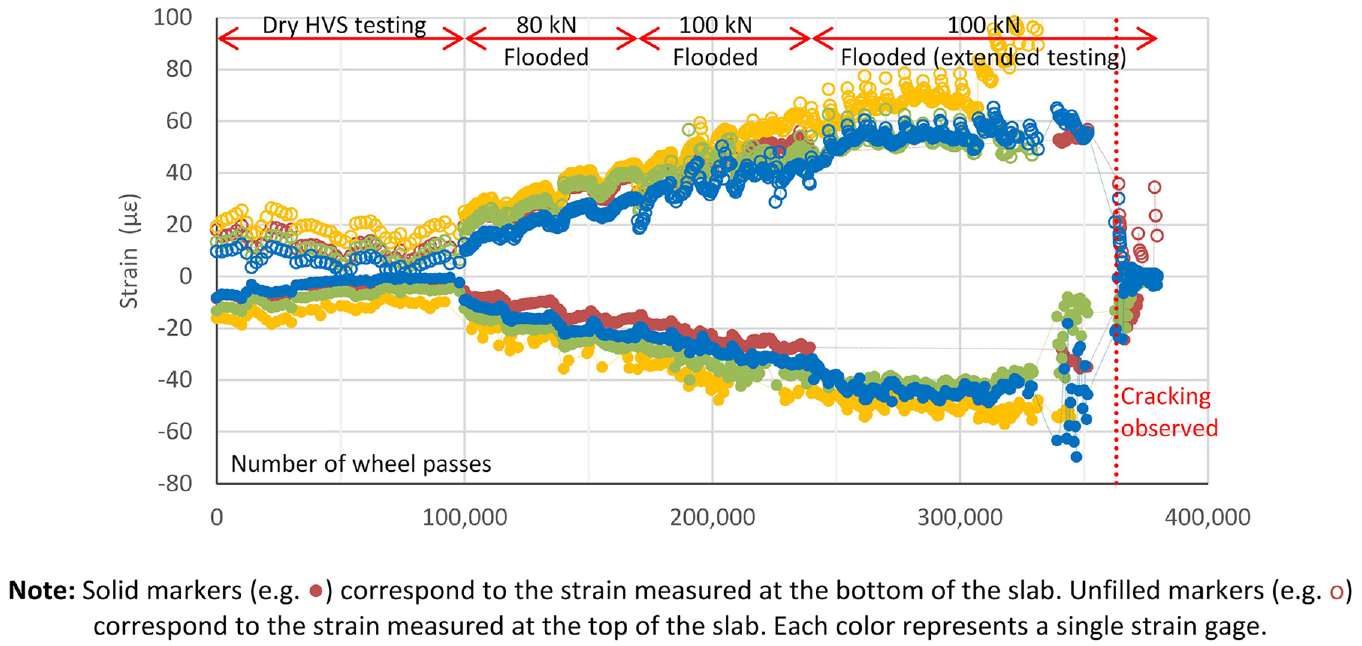
Evolution strain measured at Section J transverse joints under the heavy vehicle simulator (HVS) wheel (wheel running at shoulder edge).
Modeling with the finite element method (FEM) was conducted to determine the reason behind the strain evolution pattern described in the previous paragraph. The FEM modeling, summarized in Figure 10, indicates that the strain evolution pattern is compatible with a loss of support below the shoulder corners of the slabs. It also suggests that the loss of support gradually increased during the flooded HVS testing until the corners cracked. The loss of support also explains the increase in corner deflection during the flooded HVS testing (Figure 8). The forensic evaluation indicated that the loss of support was because of the creation of a gap between the slabs and the top of the asphalt base. The gap can be seen in Figure 11.
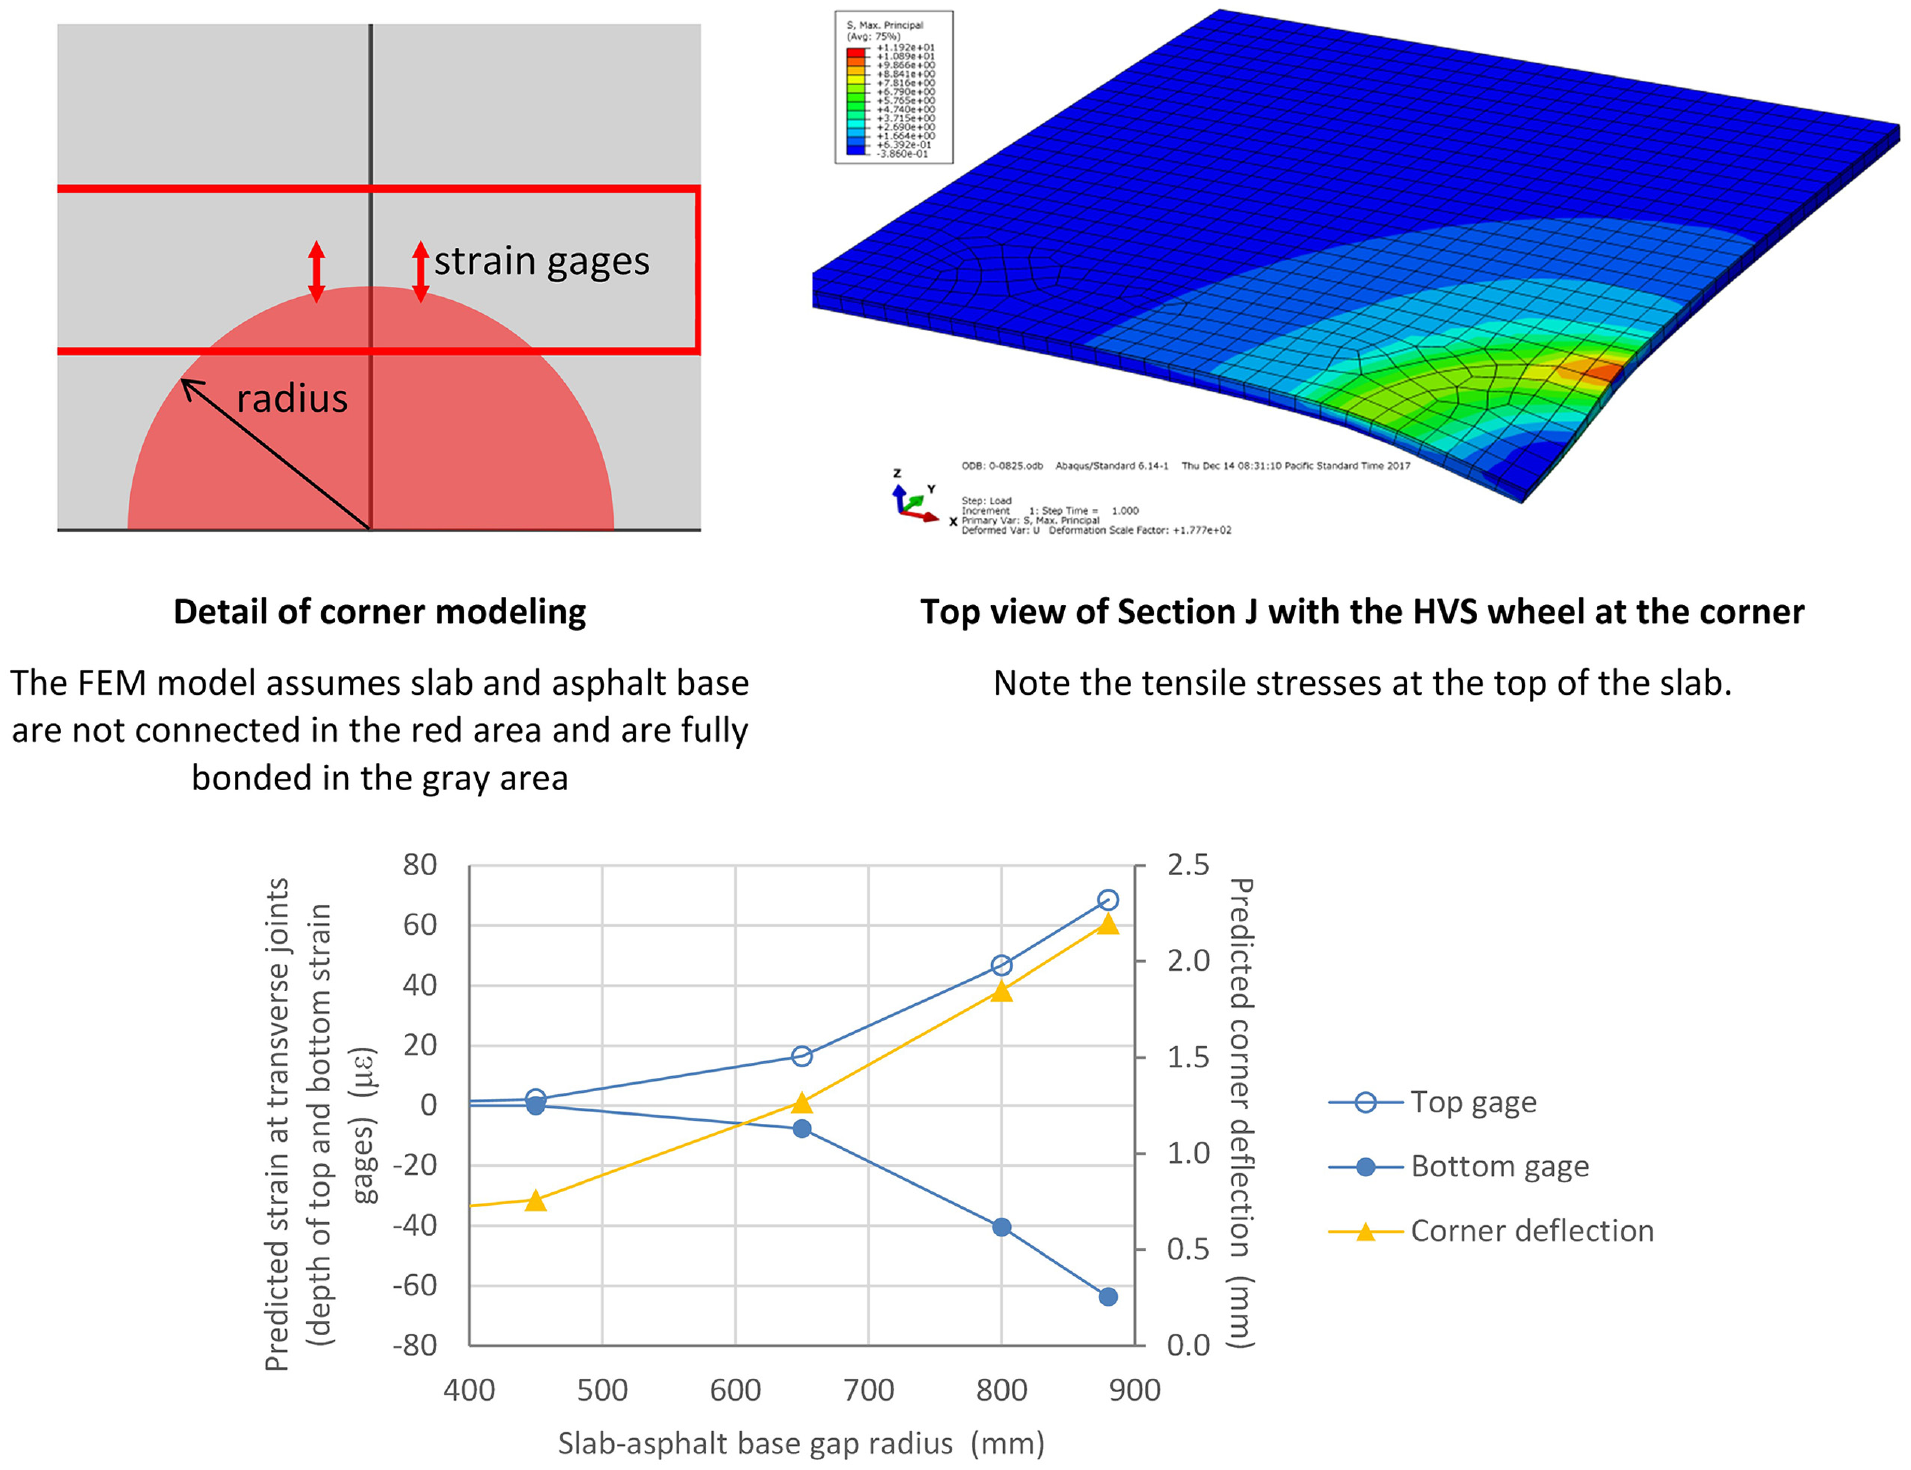
Modeling loss of support below the corner in Section J.
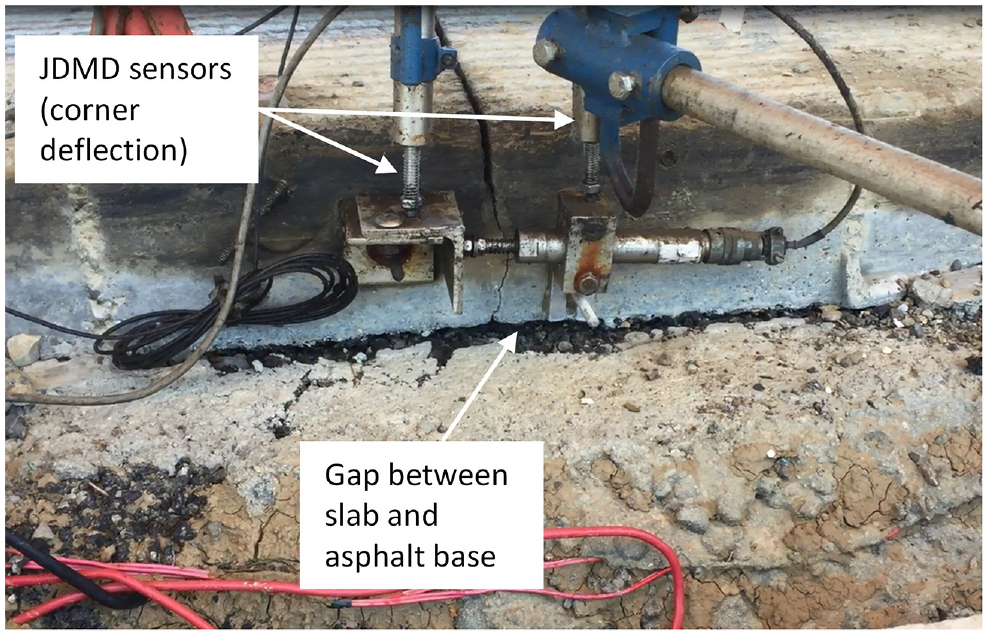
Gap between slab and asphalt base in Section J.
It should be indicated that the 12 × 12 slab size is not recommended for thin COA in the dry-warm climate present in most of California ( 17 ).
Summary, Conclusions, and Recommendations
The research presented in this paper evaluates the flooding resiliency of thin COA pavements by studying the effects that water saturation produces on the pavement structure. The research is based on the structural response and distresses measured in five thin COA sections that were instrumented with sensors and tested with an HVS under flooded conditions. The flooded conditions included a 10-day period during which water was ponded on the pavement surface, followed by continuous water supplied on the pavement surface during the HVS testing. The HVS testing included loading sequences with increasing wheel loads up to 100 kN (22.5 kip), that is, more than twice the legal load limit in California. The structural response of the sections measured under the loading of the HVS wheel and the FWD served to determine how the flooding affected the structural capacity of the COA and its capacity to resist traffic loading.
The flooding did not produce a noticeable change in the structural capacity of the COA. Deflection and concrete strain measured under the FWD loading did not indicate any sign of weakening of the COA structure of any of the sections. Deflection measured at the shoulder corner of the slabs under the HVS wheel did not indicate any sign of weakening of the COA structure of any of the sections.
The small impact that the flooding produced on the structure of the COA was believed to be in part related to the high quality of the unbound subbase layers, the relatively low air void content of the HMA (around 4%) making it relatively impermeable, and the high binder content (around 7% by weight of the aggregates) of the rubberized asphalt mix used in two of the sections.
The repeated HVS loading under flooded conditions with channelized traffic resulted in some structural damage to the asphalt base in three of the sections. The damage associated with the flooding could not be separated from the damage associated with the channelized traffic.
The damage that the asphalt base underwent during the flooded HVS testing with channelized traffic included the following: Loss of concrete-asphalt bonding Propagation of the transverse joints into the asphalt base and the consequent drop in LTE Permanent deformation of the asphalt base that resulted in the loss of support under the corner of the slab, which at the end resulted in corner cracking in the section with 3.6 × 3.6 m (12 × 12 ft) slabs
Two of the sections, the two with 1.8 × 1.8 m (6 × 6 ft) slabs and a sound asphalt base, did not experience any notable damage during the flooded HVS testing, despite the flooded conditions, the high load level, and the channelized traffic.
This research suggests that a COA with 1.8 × 1.8 m (6 × 6 ft) slabs should be able to provide excellent flooding resiliency as soon as it is provided with a sound asphalt base.
The following recommendations are proposed from the research presented in this paper:
It is recommended that further research be conducted to determine if the conclusions from this research can be extrapolated to standard jointed plain concrete pavements.
The design of the asphalt mixes has traditionally focused on several properties, including rutting and cracking resistance, that are required for the asphalt mix to perform properly as part of an asphalt pavement. It is recommended that research be conducted to develop an asphalt mix design approach to optimize its performance as a base for concrete pavement. Such a specification has been previously developed for the section of I-15 at Devore, California. The specification optimized good moisture resistance and low permeability.
Footnotes
Acknowledgements
This paper describes research activities that were requested and sponsored by the California Department of Transportation (Caltrans). Caltrans sponsorship is gratefully acknowledged. The technical review by Caltrans, led by Deepak Maskey and Dulce Rufino Feldman from the Office of Concrete Pavement, and oversight by Joe Holland, of the Division of Research, Innovation and System Information, is appreciated.
Author Contributions
The authors confirm contribution to the paper as follows: study conception and design: J. Harvey, A. Mateos, R. Wu; data collection: F. Paniagua, Julio Paniagua; analysis and interpretation of results: A. Mateos, M. Millan, R. Wu, J. Harvey, F. Paniagua, J. Paniagua; draft manuscript preparation: A. Mateos, J. Harvey, M. Millan, R. Wu, F. Paniagua, J. Paniagua. All authors reviewed the results and approved the final version of the manuscript.
Declaration of Conflicting Interests
The author(s) declared no potential conflicts of interest with respect to the research, authorship, and/or publication of this article.
Funding
The author(s) disclosed receipt of the following financial support for the research, authorship, and/or publication of this article: This paper describes research activities that were requested and sponsored by the California Department of Transportation (Caltrans). Contract number 65A0628.

The contents of this paper reflect the views of the authors and do not necessarily reflect the official views or policies of the State of California, or the Federal Highway Administration. This paper does not represent any standard or specification.