



Abstract
Unbonded concrete overlays (UBOL) are a preferred rehabilitation solution for distressed concrete pavements because the remaining pavement can be used as a strong support layer while an interlayer between the UBOL and the existing pavement mitigates potential distress reflections. Nevertheless, UBOL, as other types of jointed concrete pavements, experiences fatigue cracking as a major distress because of critical stress inflicted by traffic and environmental loading. Therefore, for proper UBOL performance, a cracking model that considers the specific UBOL characteristics is necessary. The AASHTO Mechanistic–Empirical Pavement Design (AASHTO M-E) cracking model, although the most advanced model for UBOL design currently available, still presents significant limitations. The model considers only transverse cracking, ignoring longitudinal cracking which has been reported by Departments of Transportation. Additionally, UBOL unique design features such as the effect of temperature variation throughout the existing concrete slab thickness and different interlayer properties are overlooked, resulting in crack predictions with unreliable trends. To address these issues, this paper proposes a modified UBOL cracking model. The proposed model was developed with a new approach for stress analysis and damage calculation considering different positions in the UBOL as well as modifications of the temperature data processing, and built-in curl analysis. The model was calibrated and validated using Long-Term Pavement Performance UBOL sections, and two sensitivity analysis are presented with a modified reliability analysis.
Keywords
Unbonded concrete overlays (UBOL) are a rehabilitation solution composed of Portland cement concrete (PCC) slabs placed on an existing concrete or composite pavement ( 1 ). When properly designed, UBOL provides cost-effective extension of useful life of a distressed pavement by concurrently using the existing concrete pavement as a strong support layer while mitigating distress reflection with an interlayer between the UBOL and the existing pavement (1, 2). However, despite several examples of satisfactory performance (1, 3, 4), several agencies refrain from using UBOL construction because of a lack of reliable, standardized, and cost-effective design procedures.
Despite major structural differences in relation to slab thickness, geometry and, especially, the presence of an interlayer, cracking is a significant deterioration mechanism for both conventional jointed concrete pavements and UBOL. In the past, various models were proposed for predicting cracking in UBOL. The AASHTO Mechanistic–Empirical Pavement Design (AASHTO M-E) cracking model is the most advanced and sophisticated model available today (5–7). It considers bottom-up and top-down transverse cracking, which are assumed to be caused by repeated application of excessive longitudinal stresses resulting from a combined effect of heavy axle loading and overlay curling.
The AASHTO M-E cracking model for UBOL has many attractive features. The structural model accounts for key design features, such as UBOL thickness, flexural strength, elastic modulus, existing pavement thickness and stiffness as well as traffic loadings, climatic conditions, and subgrade support. In addition, the incremental damage approach makes the design procedure flexible and robust, as material properties, traffic levels, seasonal climatic conditions, and joint load transfer can vary throughout the pavement’s life.
Nevertheless, the AASHTO M-E model also presents significant limitations. As only transverse cracking is considered, longitudinal cracking, which has been reported in the field ( 8 ), is currently ignored in UBOL design. Additionally, the effect of temperature variation throughout the existing concrete slab thickness is overlooked, as well as different interlayer properties effects ( 9 ). The UBOL and the existing slab are assumed to have the same deflection profile. In this way, the effect of separation of the UBOL from the existing pavement is also ignored.
Using the AASHTO M-E cracking model for UBOL may also exhibit counterintuitive trends. Figure 1 shows a cracking prediction analysis performed using the AASHTO M-E Design software. The prediction was performed considering an initial annual average daily truck traffic (AADTT) of 8,000 with an 8 in.-thick existing pavement (modulus of elasticity set at 4,000,000 pounds per square inch [psi]). The interlayer thickness was 1 in. and the overlay joint spacing was set at 15 ft.
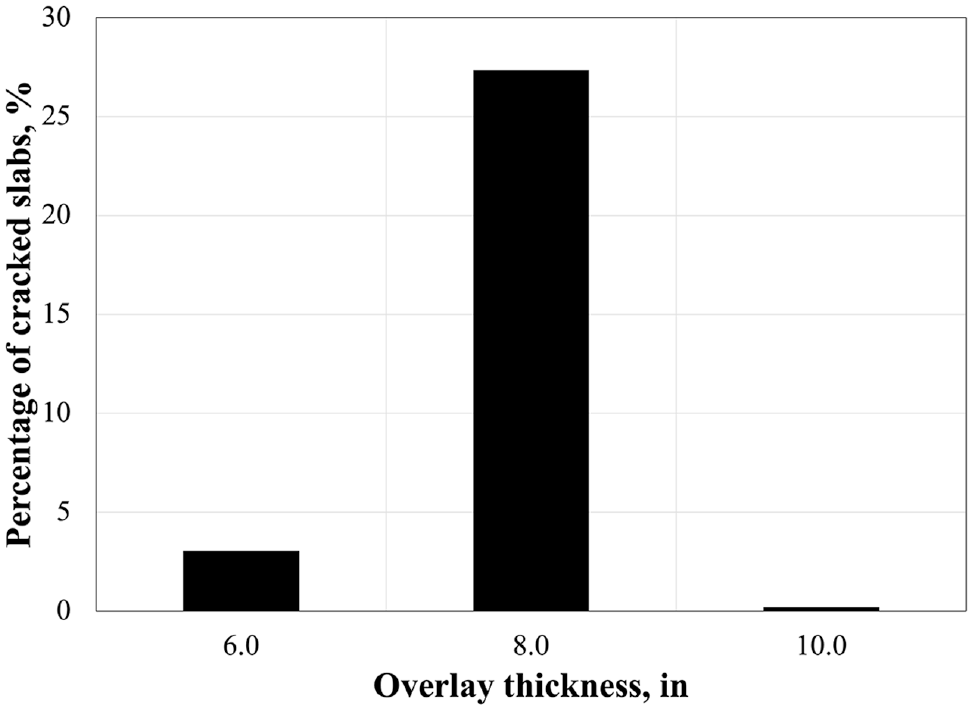
Predicted AASHTO mechanistic–empirical pavement design (AASHTO M-E) cracking for various thicknesses of unbonded concrete overlay.
AASHTO M-E predicts unrealistically low cracking for a 6 in.-thick overlay. An increase in overlay thickness from 6 in. to 8 in. leads to an increase in cracking from 3% to 27%. Further increase in overlay thickness to 10 in. leads to a decrease in predicted cracking to 0.22%. As a result, overlays with thicknesses of 6 and 10 in. meet the cracking performance requirement of 15% cracking at 90% reliability, whereas the 8 in.-thick overlay fails it. This example illustrates the need for revisiting the AASHTO M-E cracking model for UBOL.
This paper describes the development of a modified cracking model for UBOLs addressing some of the limitations of the AASHTO-ME model. It includes modification of the stress analysis, the temperature data processing, built-in curl analysis, damage calculation procedure, and reliability analysis.
Development of Alternative Cracking Model for UBOL
The modified UBOL fatigue damage calculation and cracking performance prediction is based on the AASHTO M-E cracking model framework ( 5 ) with several enhancements. The development of the modified procedure for UBOL cracking involved major revisions of the structural model, thermal loading characterization, built-in curling characterization, and overall cracking prediction.
Structural Model
Cracking in UBOL placed on existing concrete and composite pavements is caused by repeated application of excessive stresses in the overlay resulting from a combined effect of heavy axle loading and overlay curling. Accurate prediction of overlay stresses is a key element of any mechanistic–empirical design procedure. The AASHTO M-E procedure for UBOL, which is based on the ISLAB2000 finite element structural model, uses a two-layered slab resting on a Winkler foundation to simulate the unbonded overlay structure. The upper layer of the slab simulates the overlay and the lower layer models the existing pavement. The layers are assumed to have an unbonded interface with the same deflection basin ignoring the effect of interlayer properties and the ability of the interlayer to separate the overlay slab from the existing pavement.
In this study, the Totski model (10–12) was adapted for structural modeling of UBOL. The model, shown in Figure 2, simulates an UBOL and a slab resting on a spring interlayer supported by a slab resting on the Winkler subgrade. The advantage of this model is that it is capable of explicitly modeling the “cushioning” property of the interlayer. The adapted Totski model was developed specifically for the modeling of UBOL but has not been widely used because of the lack of data needed to verify the selection of accurate spring interlayer stiffness. Recently, laboratory and field-testing data have been used to established recommendations for interlayer stiffness selection for asphalt and fabric interlayers ( 8 ).

(a) Unbonded concrete overlay system and (b) Totski model for layer interface.
Several ISLAB2000 models were developed in this study to account for the effect of the overlay slab size and axle load positions. Figure 3, a and b, show the models for the conventional (12 ft) width overlay slabs with the axle load located at the mid-slab and transverse joint, respectively. Figure 3, c and d, show examples of structural models for unbonded overlays with short (6 ft) width overlay slabs. Two cases of interlayer conditions were considered:
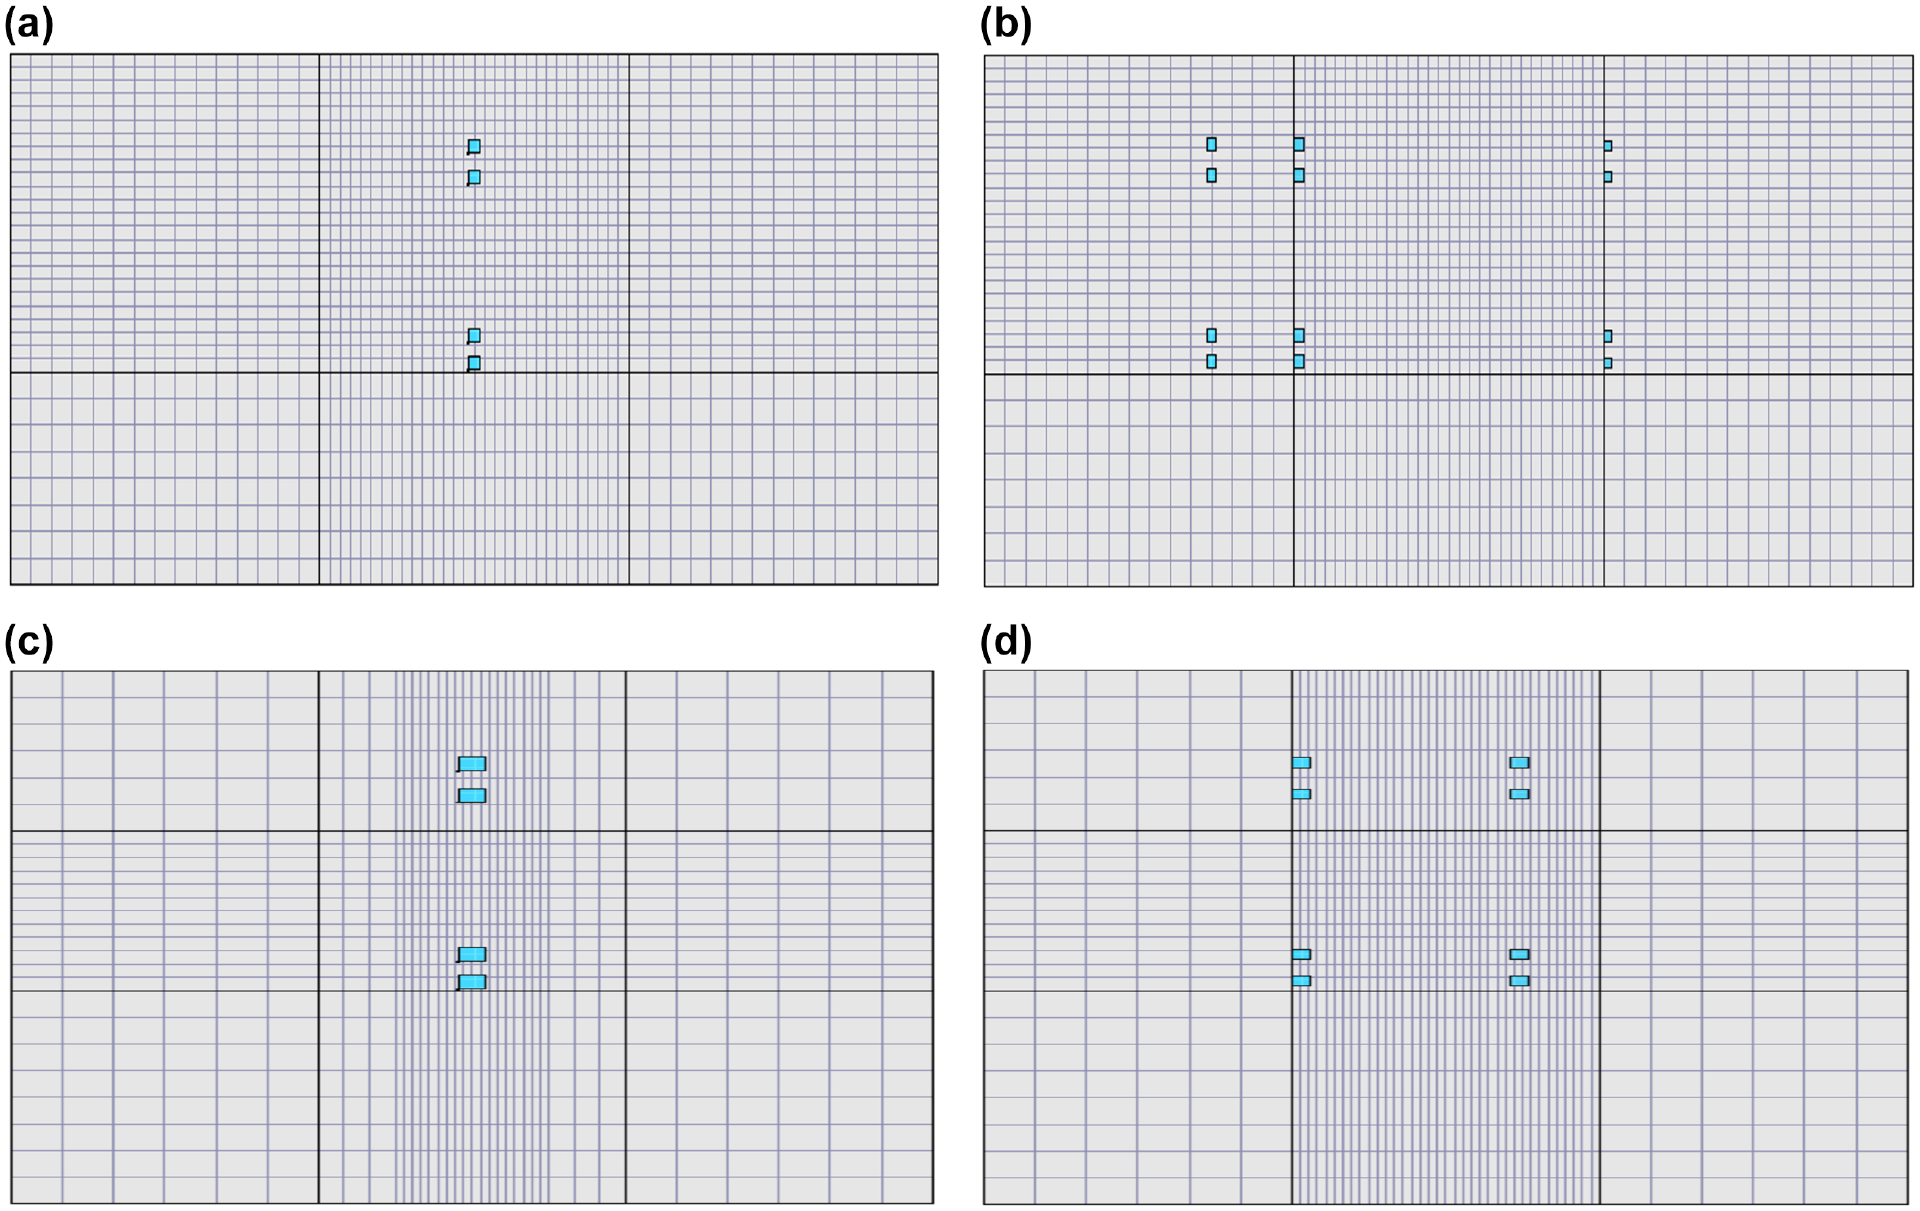
ISLAB2000 models for conventional width overlay with (a) mid-slab loading and (b) transverse joint loading; and short slab overlay with (c) mid-slab loading and (d) transverse joint loading.
No interlayer deterioration, meaning that the Totski interlayer stiffness is constant for the entire layer.
A void under the transverse joint extending throughout the entire lane width in the transverse direction. The Totski interlayer stiffness for the void is set to 1 psi/in. The void would extend 6 in. on the approach side of the joint and 12 or 24 in. on the leave side of the joint in the longitudinal direction for short and conventional width slabs, respectively, as illustrated in Figure 4.
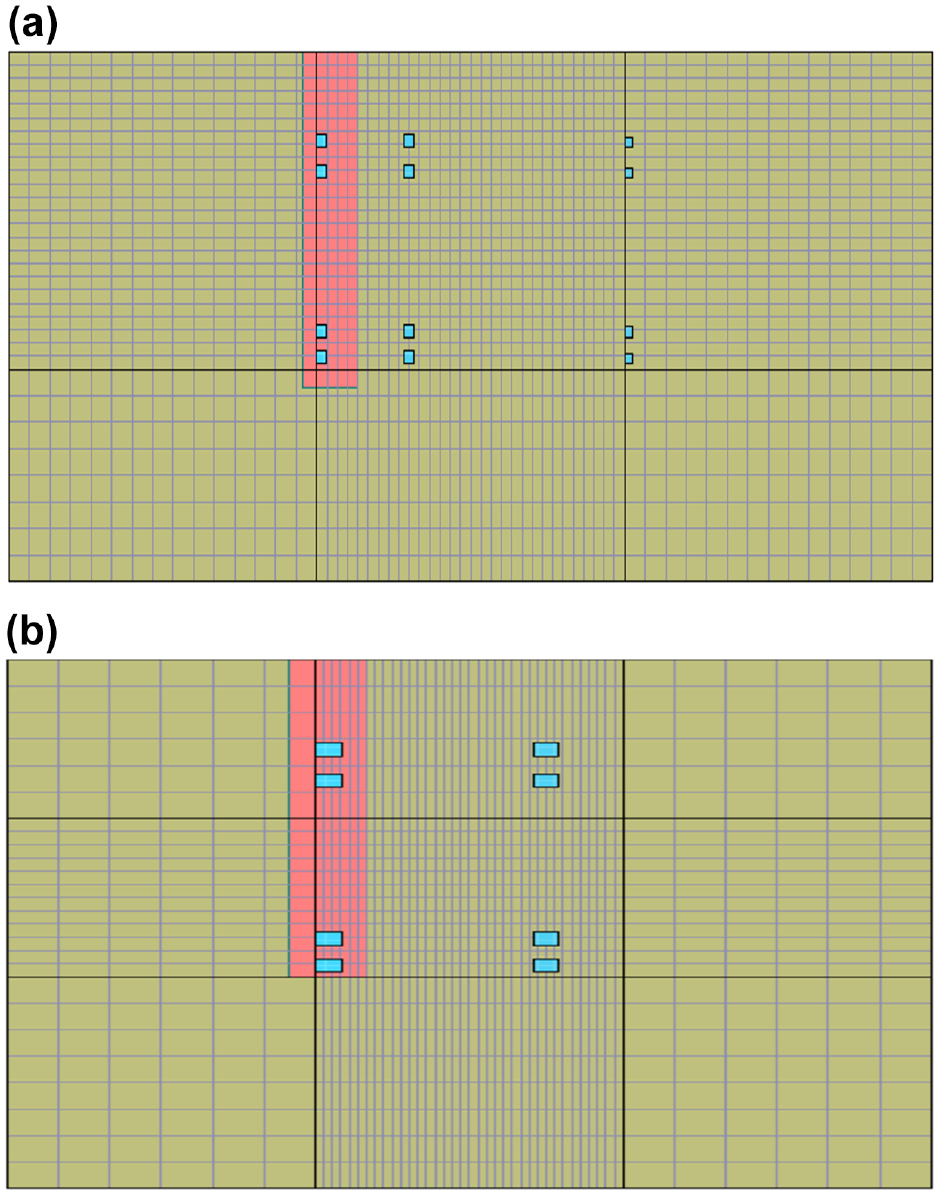
ISLAB2000 model of a void under the overlay slab for: (a) conventional and (b) short width slab overlay.
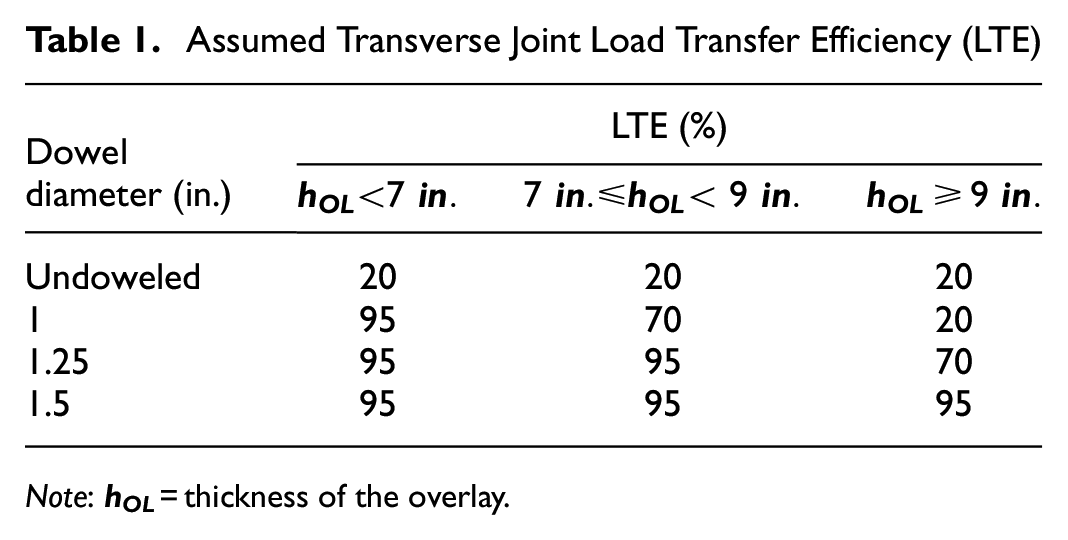
Stiffness values of the slab/shoulder joint were assigned based on the shoulder type. If the selected shoulder type is a tied PCC shoulder, a 50% load transfer efficiency of the overlay lane and shoulder is assumed. For asphalt or non-tied PCC shoulders, this value decreases to 20%. Stiffness of the transverse joint was assigned based on the dowel diameter and the overlay thickness as shown in Table 1.
Assumed Transverse Joint Load Transfer Efficiency (LTE)
Note:
The cracking model developed in this study requires computation of top and bottom critical overlay stresses at two different locations: overlay edge (longitudinal stresses) and transverse joint (transverse stresses). These stresses should be computed for many combinations of axle weights, axle types, axle positions, concrete properties, and temperature gradients throughout the overlay slab thickness. To reduce computer time for the stress prediction, neural networks (NNs) have been developed, based on a larger number of ISLAB2000 simulations. A detailed description of the NNs development can be found elsewhere ( 8 ).
Thermal Loading Characterization
Thermal gradients throughout the UBOL greatly affect critical stresses in the concrete slab, contributing to cracking. Distributions of thermal gradients are required over each month throughout the year (both day and night). The Enhanced Integrated Climatic Model (EICM) module of AASHTO M-E Design software generates the thermal profiles throughout concrete slab thickness for every hour of pavement life.
To improve computation efficiency, the AASHTO M-E procedure converts these hourly predictions into monthly distributions of probability of combinations of traffic and temperature (known as the thermal linearization process). The AASHTO M-E linearization process eliminates the need to compute the number of loads as a function of both linear and non-linear temperature differences by equating stresses caused by non-linear temperature distribution with those resulting from linear gradients (6, 13).
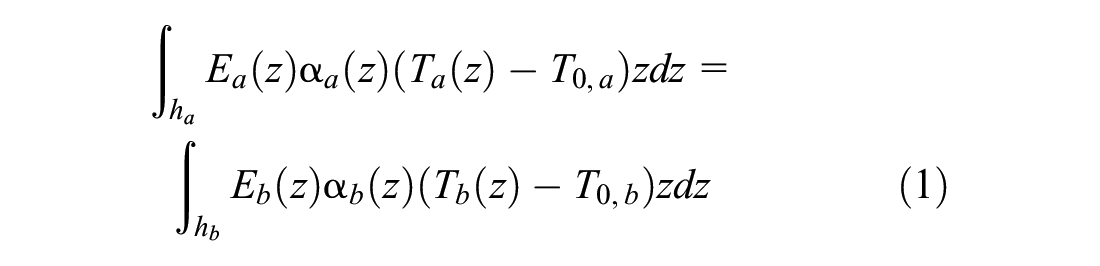
The equivalent temperature distribution concept was introduced by Thomlinson in 1940 and further developed by others (14, 15). The concept, later generalized for non-uniform slabs (11, 16), states that if two slabs have the same plane-view geometry, flexural stiffness, self-weight, boundary conditions, and applied pressure, and rest on the same foundation, then these slabs have the same deflections and bending moment distribution if the throughout-the-thickness temperature distributions satisfy the following condition:
where
a, b = subscripts denoting two slabs;
z = distance from the neutral axis;
T 0 = the temperatures at which theses slabs are assumed to be flat;
E = modulus of elasticity;
h = slab thickness.
The temperature distribution throughout the slab thickness can be split into three components, namely: the part that causes constant strain throughout the slab thickness, the part that causes linear throughout-the-slab-thickness strains, and finally the part that causes non-linear strains.
The first step in the AASHTO M-E linearization process is to compute the monthly PCC stress frequency distribution in the pavement at critical locations for linear temperature difference (ΔTL), non-linear temperature (TNL) and standard axle loading. This thermal linearization process significantly reduces the amount of computing required to estimate stresses. Nevertheless, the process is still computationally expensive and needs to be performed for each combination of concrete overlay properties. Moreover, AASHTO M-E linearization process assumes that the stress caused by the interaction between non-linear temperature and traffic is constant for all traffic loads.
In this study, an alternative approach was developed as an adaptation of solutions proposed elsewhere (17, 18). Figure 5 illustrates the adapted approach using a flowchart. The standalone EICM software simulation is performed to predict hourly distributions of the temperature throughout the UBOL pavement system. Then, each hourly temperature profile is approximated by a quadratic temperature distribution:

where
z = the distance from the mid-depth (inches).
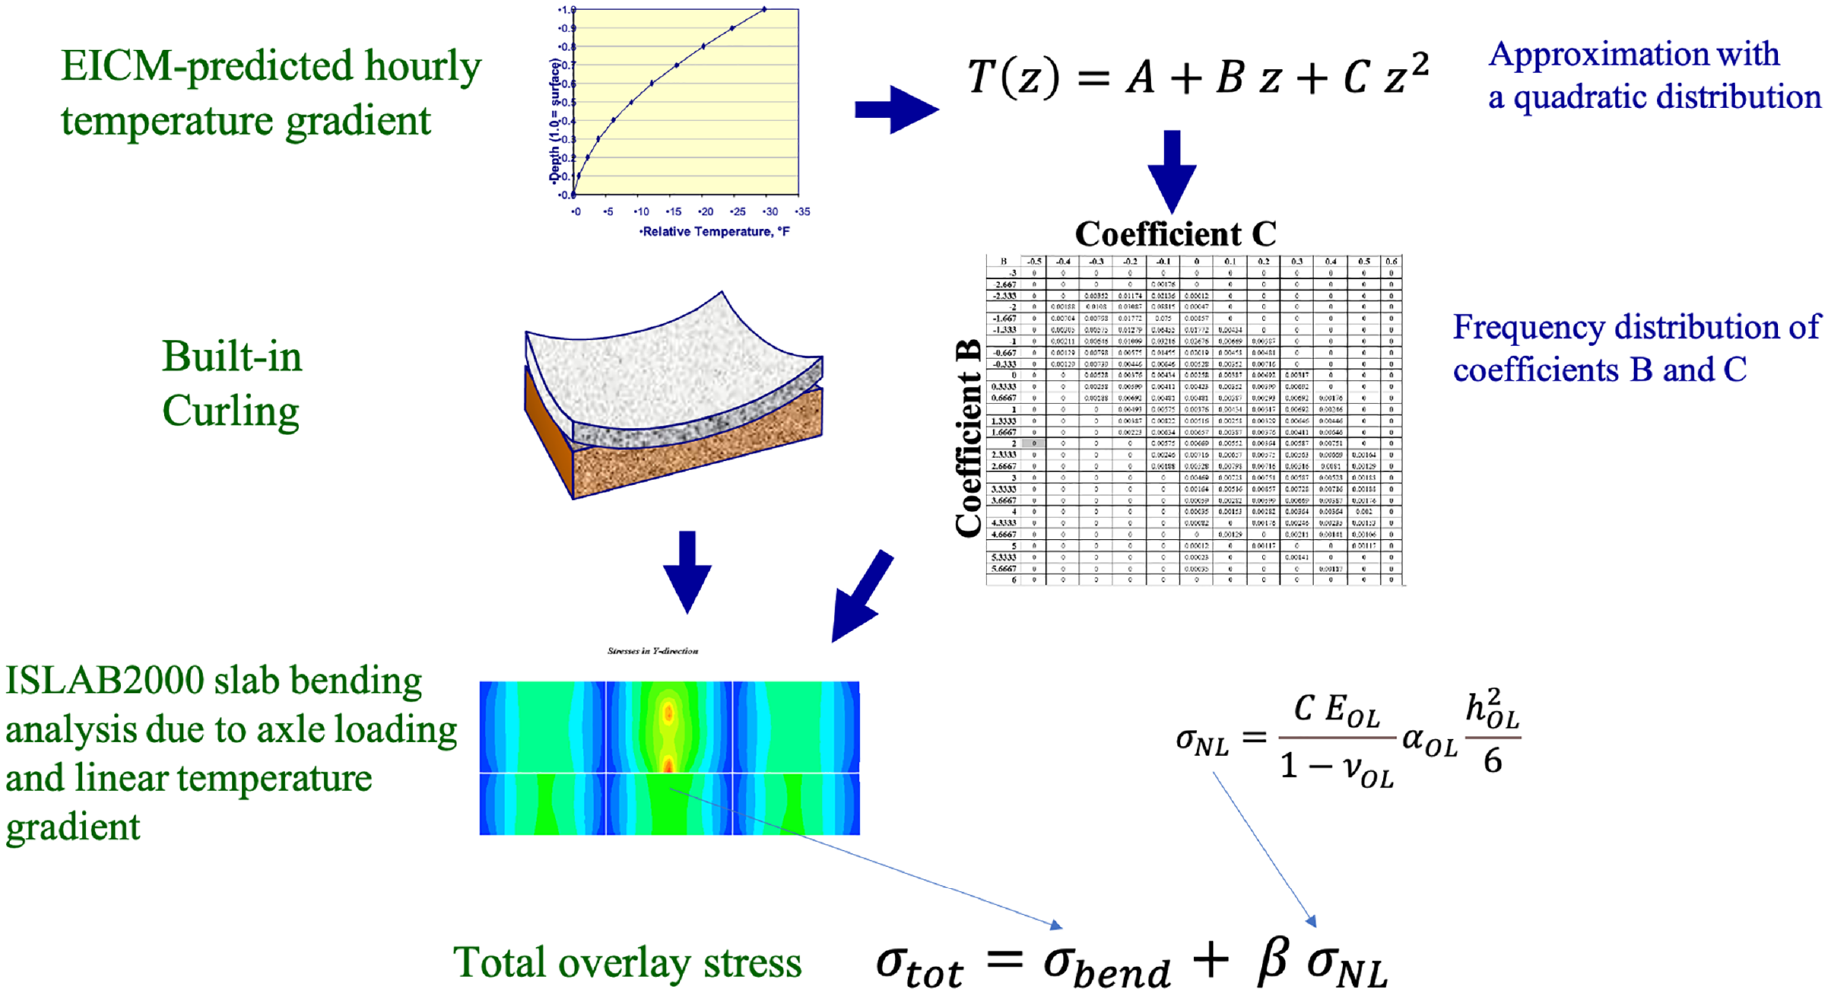
Accounting for temperature loading in the proposed procedure.
The gradients B can be used to compute the temperature difference between the top and bottom overlay surfaces,

where
The total stress for each combination of the non-linear temperature distribution throughout the slab thickness and axle loading is determined as follows:

where
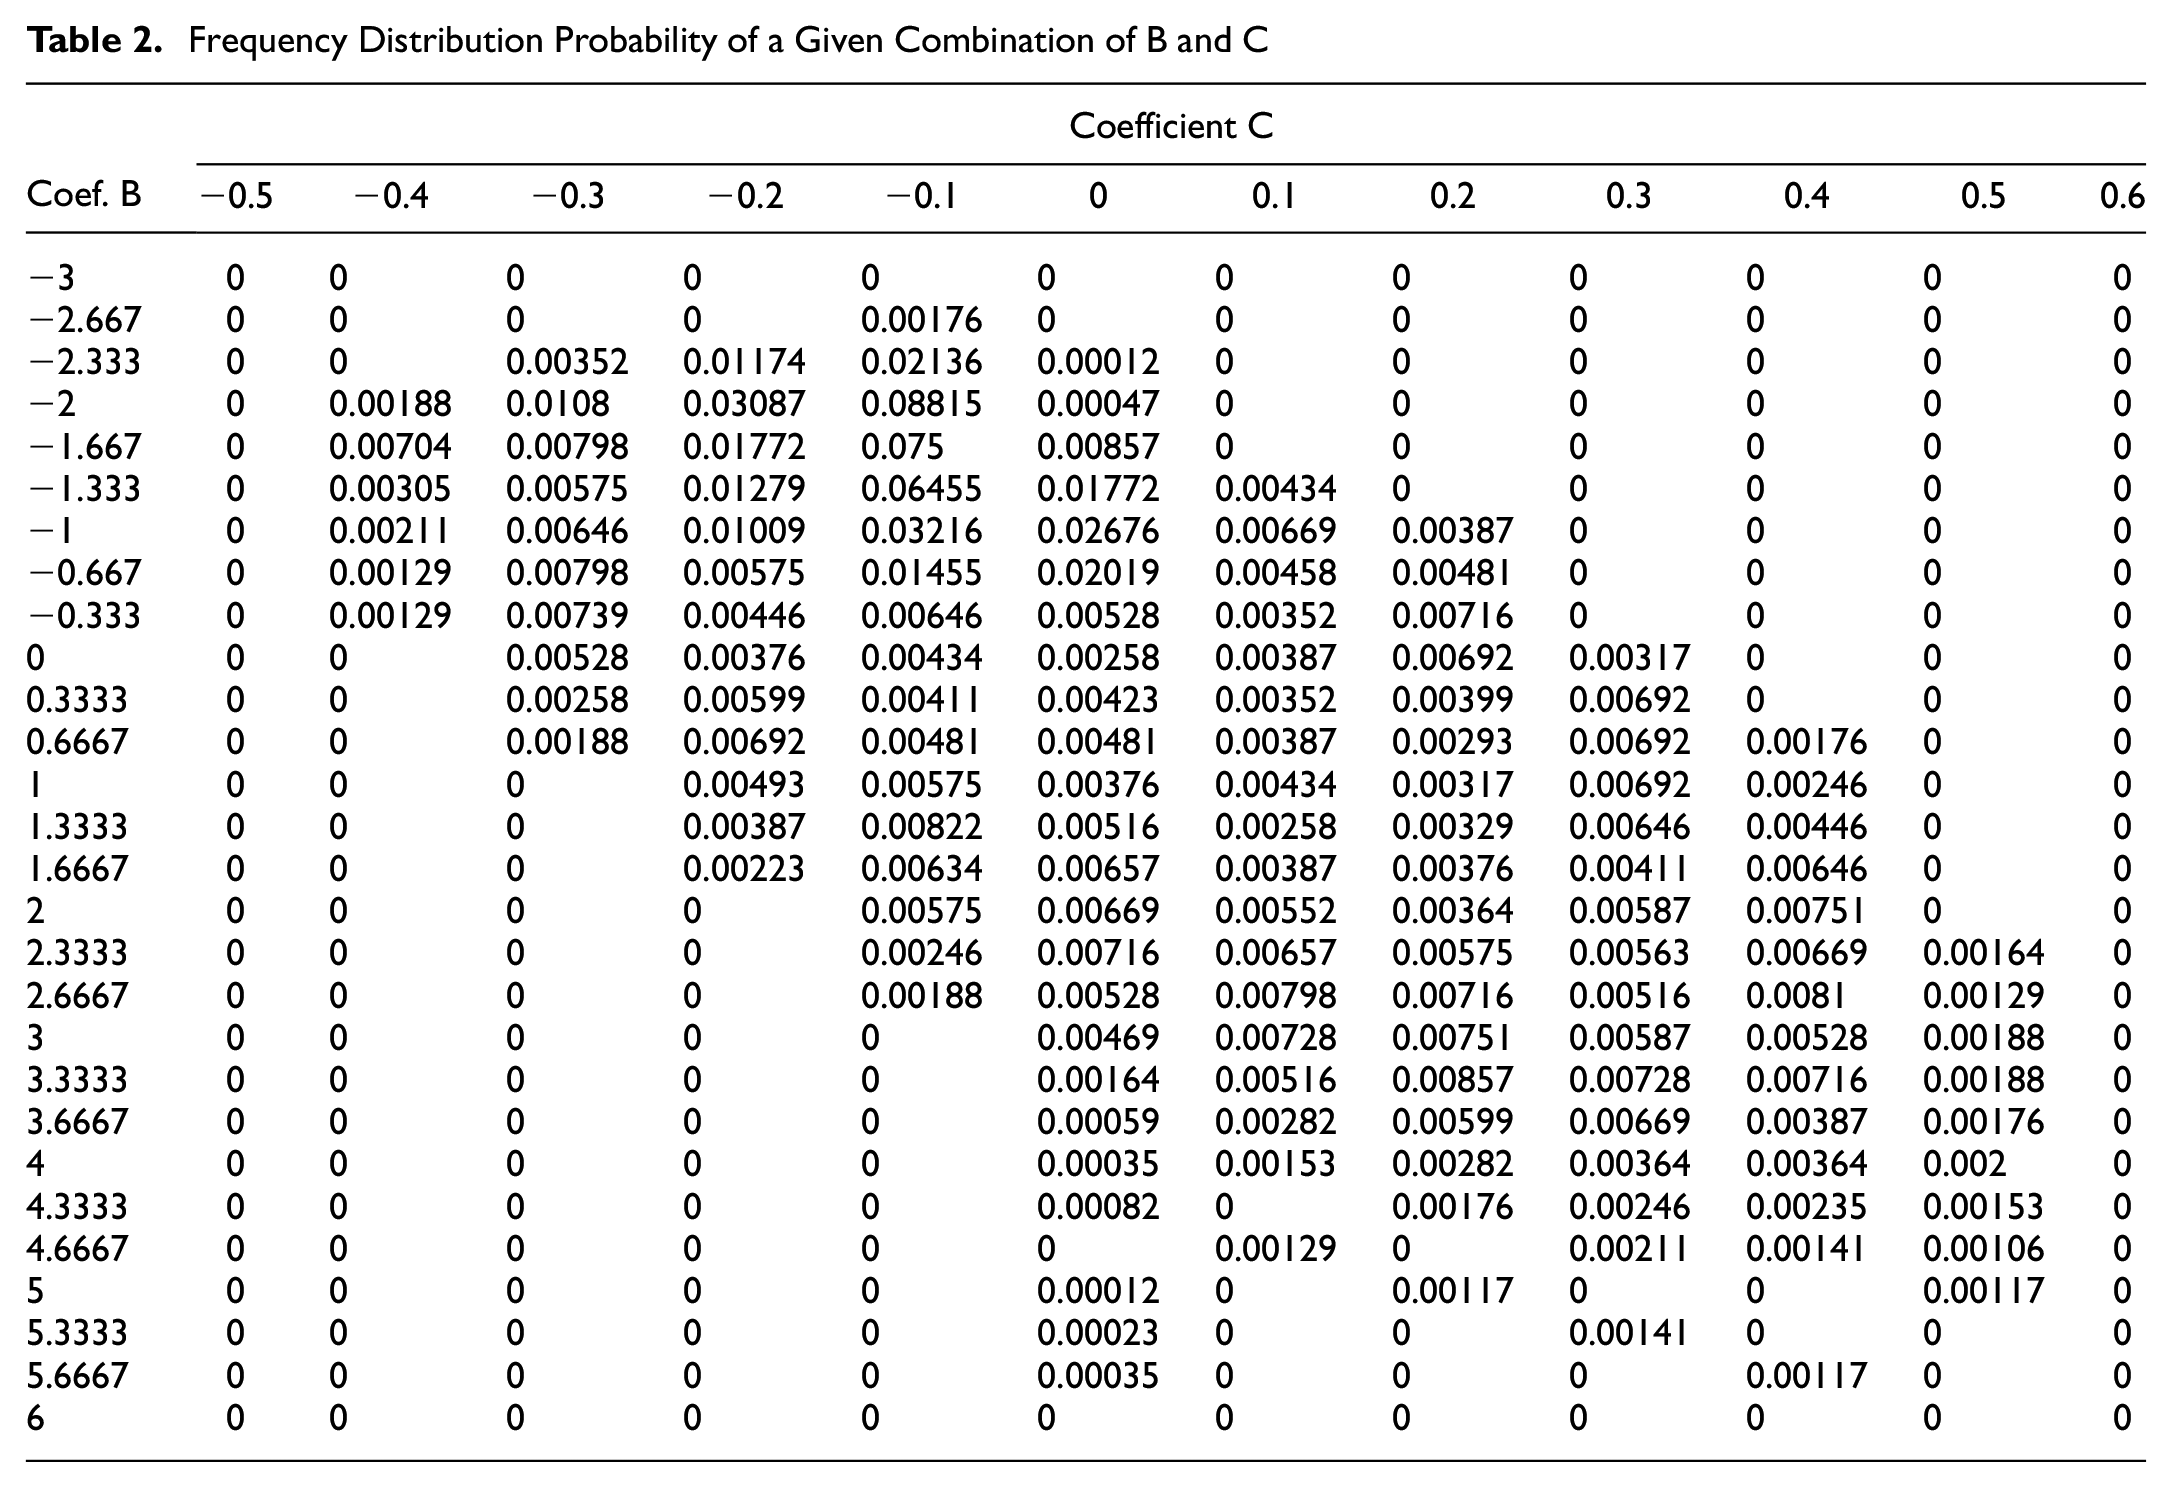
After each hourly temperature profile is approximated using Equation 2, the frequency distribution of linear and quadratic coefficients is created. In this study, the increment of the linear term B was selected to ensure 2°F for the linear temperature difference between the top and bottom PCC surfaces. The frequency distribution for the quadratic term, C, is in increments of 0.1°F/in 2 . Table 2 presents an example of the frequency distribution of a 6 in.-thick UBOL. For this example the probability of the temperature profile with the coefficients B and C equal to 2 and 0.3, respectively, is equal to 0.00587. Therefore, this portion of traffic would be applied with the corresponding equivalent temperature difference and non-linear temperature stress.
Frequency Distribution Probability of a Given Combination of B and C
As an objective of this study was to develop a standalone tool, an EICM analysis was performed for 68 weather stations located throughout the United States and the results of this analysis were used to develop a design database. The analysis was performed assuming overlay thickness of 4, 6, 8, and 10 in. The existing pavement thickness was kept equal to 10 in. The output of the EICM analysis is a temperature file that predicts hourly temperature profile in the PCC overlay system with a 1 in. interval.
Built-in Curling
A recently completed NCHRP 1-51 study ( 18 ) suggested that built-in curl modeling for pavement performance models should not be limited to a single parameter/value. Theories of slab behavior discussed in the literature review treat built-in curl as a property that depends on the paving conditions and varies throughout the service life ( 19 ). Additionally, built-in curl depends on the time of concrete placement, that is, morning versus afternoon ( 20 ). The empirical mode decomposition analysis of the Long-Term Pavement Performance (LTPP) profilometer data indicates that the slab profiles of in-situ pavements vary by base material. Furthermore, the analysis found high variance in slab profile within a given project ( 18 ).
The NCHRP 1-51 study proposed to modify the built-in curl factor in pavement performance modeling by dividing the default AASHTO parameter into two different built-in curl temperature gradients for daytime and nighttime conditions (ΔTbot and ΔTtop). Furthermore, the developed model for built-in curl should consider properties of the slabs’ thickness as well as the slab and base layers’ stiffness. This model thus ensures that projects with stiffer bases will present greater levels of built-in curl.
The existing pavement provides a much stiffer foundation to an unbonded overlay than a base layer provides to a new concrete pavement. Therefore, it was hypothesized that the amount of built-in curling depends on the stiffness of the overlay and the existing pavement, overlay joint spacing, and interlayer stiffness. The following representation for ΔTbuilt-in was proposed and implemented in the cracking model:

where
ΔTinput = the default value of the built-in curl (independent from the UBOL design parameters), °F;
L = overlay joint spacing, ft;
In this study, the same default value of


The AASHTO M-E procedure also splits the temperature distribution into a linear and non-linear component, but then converts them into an equivalent temperature differences (top minus bottom) and adjusts them for built-in curling effect. In the proposed procedure, the linear temperature differences are also adjusted for built-in curling, but the non-linear (quadratic) temperature component is accounted for in the stress analysis explicitly and the adjustment for built-in curling is performed independently for the daytime and nighttime analysis, resulting in:


Damage Accumulation Procedure
Similar to the AASHTO M-E, the procedure developed in this study used an incremental damage analysis by dividing the design analysis period into yearly time increments considering the following:
Traffic loads are divided into types of axles and axle loads. Axle load increments are 1,000 lb for single axles, 2,000 lb for tandem axles, and 3,000 lb for tridem and quad axles. The traffic inputs are first processed to determine the expected number of single, tandem, and tridem axles for each year. The AASHTO M-E procedure for conversion of each passing of an axle to an equivalent number of single and tandem axles for bottom-up damage computation was adapted in this study.
Lateral truck wander is assumed normally distributed and modeled using mean wheelpath and standard deviation of lateral traffic wander.
Equivalent temperature difference through the PCC slab (which includes permanent and transitory temperature) is accounted for in increments of 2°F for both positive (daytime) and negative (nighttime) top-to-bottom temperature differences as well as non-linear quadratic temperature component in increments of 0.1°F/in. 2 .
PCC modulus of rupture and modulus of elasticity for every year of the pavement life are predicted using the following model adapted from Rao et al. ( 21 ):

where
MR(Age) is concrete flexural strength, psi;
Age is concrete age in years;
MR28 days is concrete flexural strength at 28 days, psi.
Critical stresses at the bottom surface of the lane/shoulder joint are computed in the mid-slab location. These stresses are used to compute bottom-up fatigue damage at the overlay/shoulder joint based on Miner’s linear fatigue accumulation hypothesis:

where
Dlife = the design life, years;
nWp = the number of wheel paths;
Nbp = number of positive values of linear temperature gradients with non-zero frequencies;
Np = the number of quadratic terms corresponding to positive values of linear temperature gradients with non-zero frequencies.
The number of load applications

where
The AASHTO M-E model for allowable number of load repetitions along with the AASHTO M-E default values were adopted for this procedure.
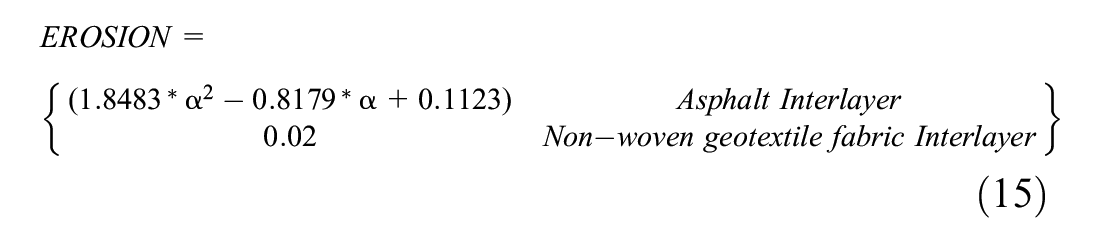
Critical stresses at the top surface of the lane/shoulder joint and at the transverse joint are computed using two assumptions: (a) there are no permanent voids under the unbonded overlay and (b) there is a 2 ft-wide permanent void under the overlay on the leave side of the transverse joint. These stresses are used to compute bottom-up fatigue damage with the following equation:
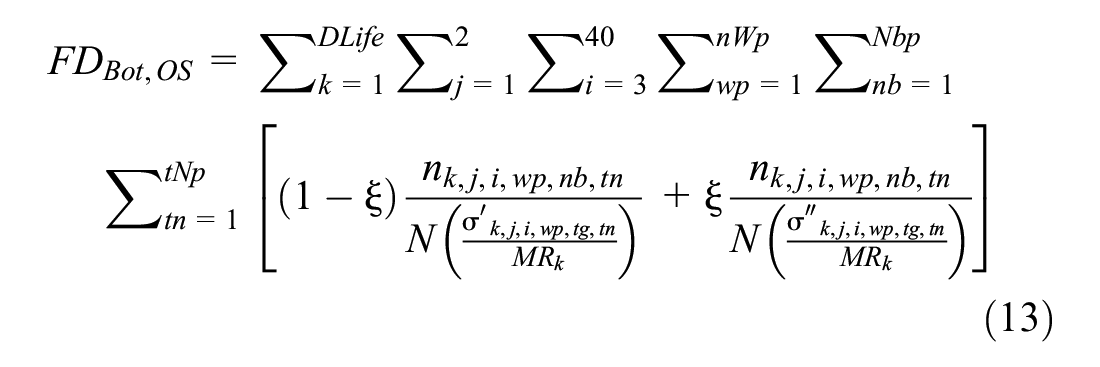
where

where
k = the overlay age;
L = joint spacing;
where

where
The process used for computing damage at the top surface of the overlay/shoulder joint was used to determine damage at the top and bottom overlay surfaces of the transverse joint.
Overlay Cracking Prediction
The AASHTO-ME approach relating fatigue damage and concrete slab cracking was adapted and generalized to predict cracking in UBOL. This cracking calculation procedure is a generalization of the procedure proposed under the NCHRP 1-37A project and currently used in AASTHO M-E. The proposed procedure implies that a slab can be cracked as a result of accumulation of damage at four critical locations (top or bottom overlay surfaces at the overlay/shoulder or transverse joint), but a slab cannot be counted as cracked more than once.
The fatigue damage computed at the slab top and bottom of the lane/shoulder joint (edge) is used to predict the top-down and bottom-up transverse cracking in the unbonded overlay, respectively. On the other hand, the damage computed at the slab top and bottom of the transverse joint is used to predict the top-down and bottom-up longitudinal cracking in the unbonded overlay, respectively. The AASHTO-ME damage–cracking relationship form was used:
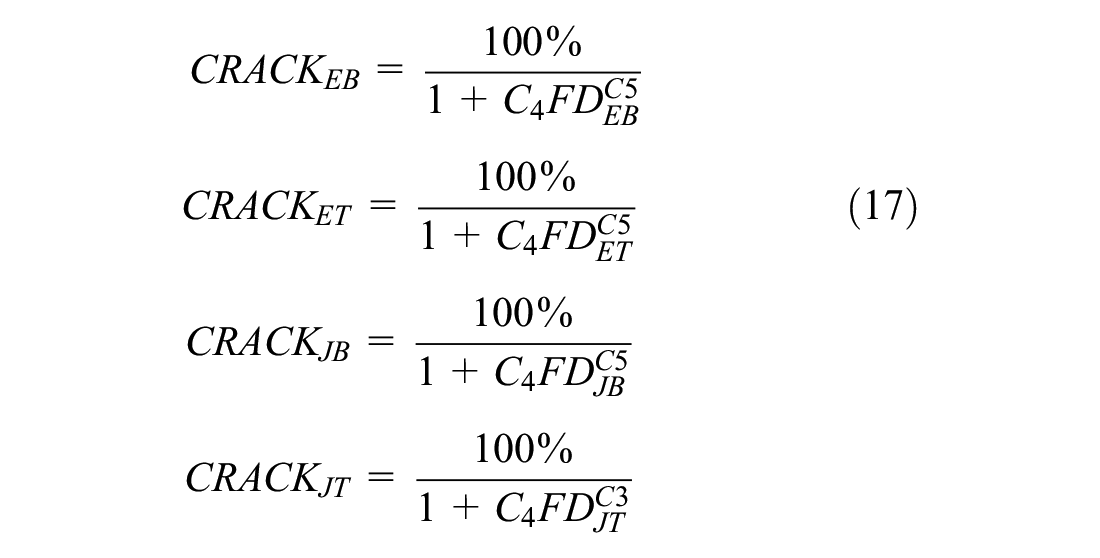
where
C 4 and C5 = calibration coefficients.
The percentages of top-down and bottom-up cracking transverse cracked slabs are converted into percentage of slabs with transverse cracking using the following AASHTO-ME equations:

Similarly, taking into account longitudinal cracking:

where
Finally, the percentage of cracked slabs is computed using the following equation:

where
Cracking Model Calibration and Validation
The unbonded overlay cracking model described above was calibrated using LTPP sections ( 22 ). Table 3 summarizes the design features for sections used in the calibration.
Calibration Sections
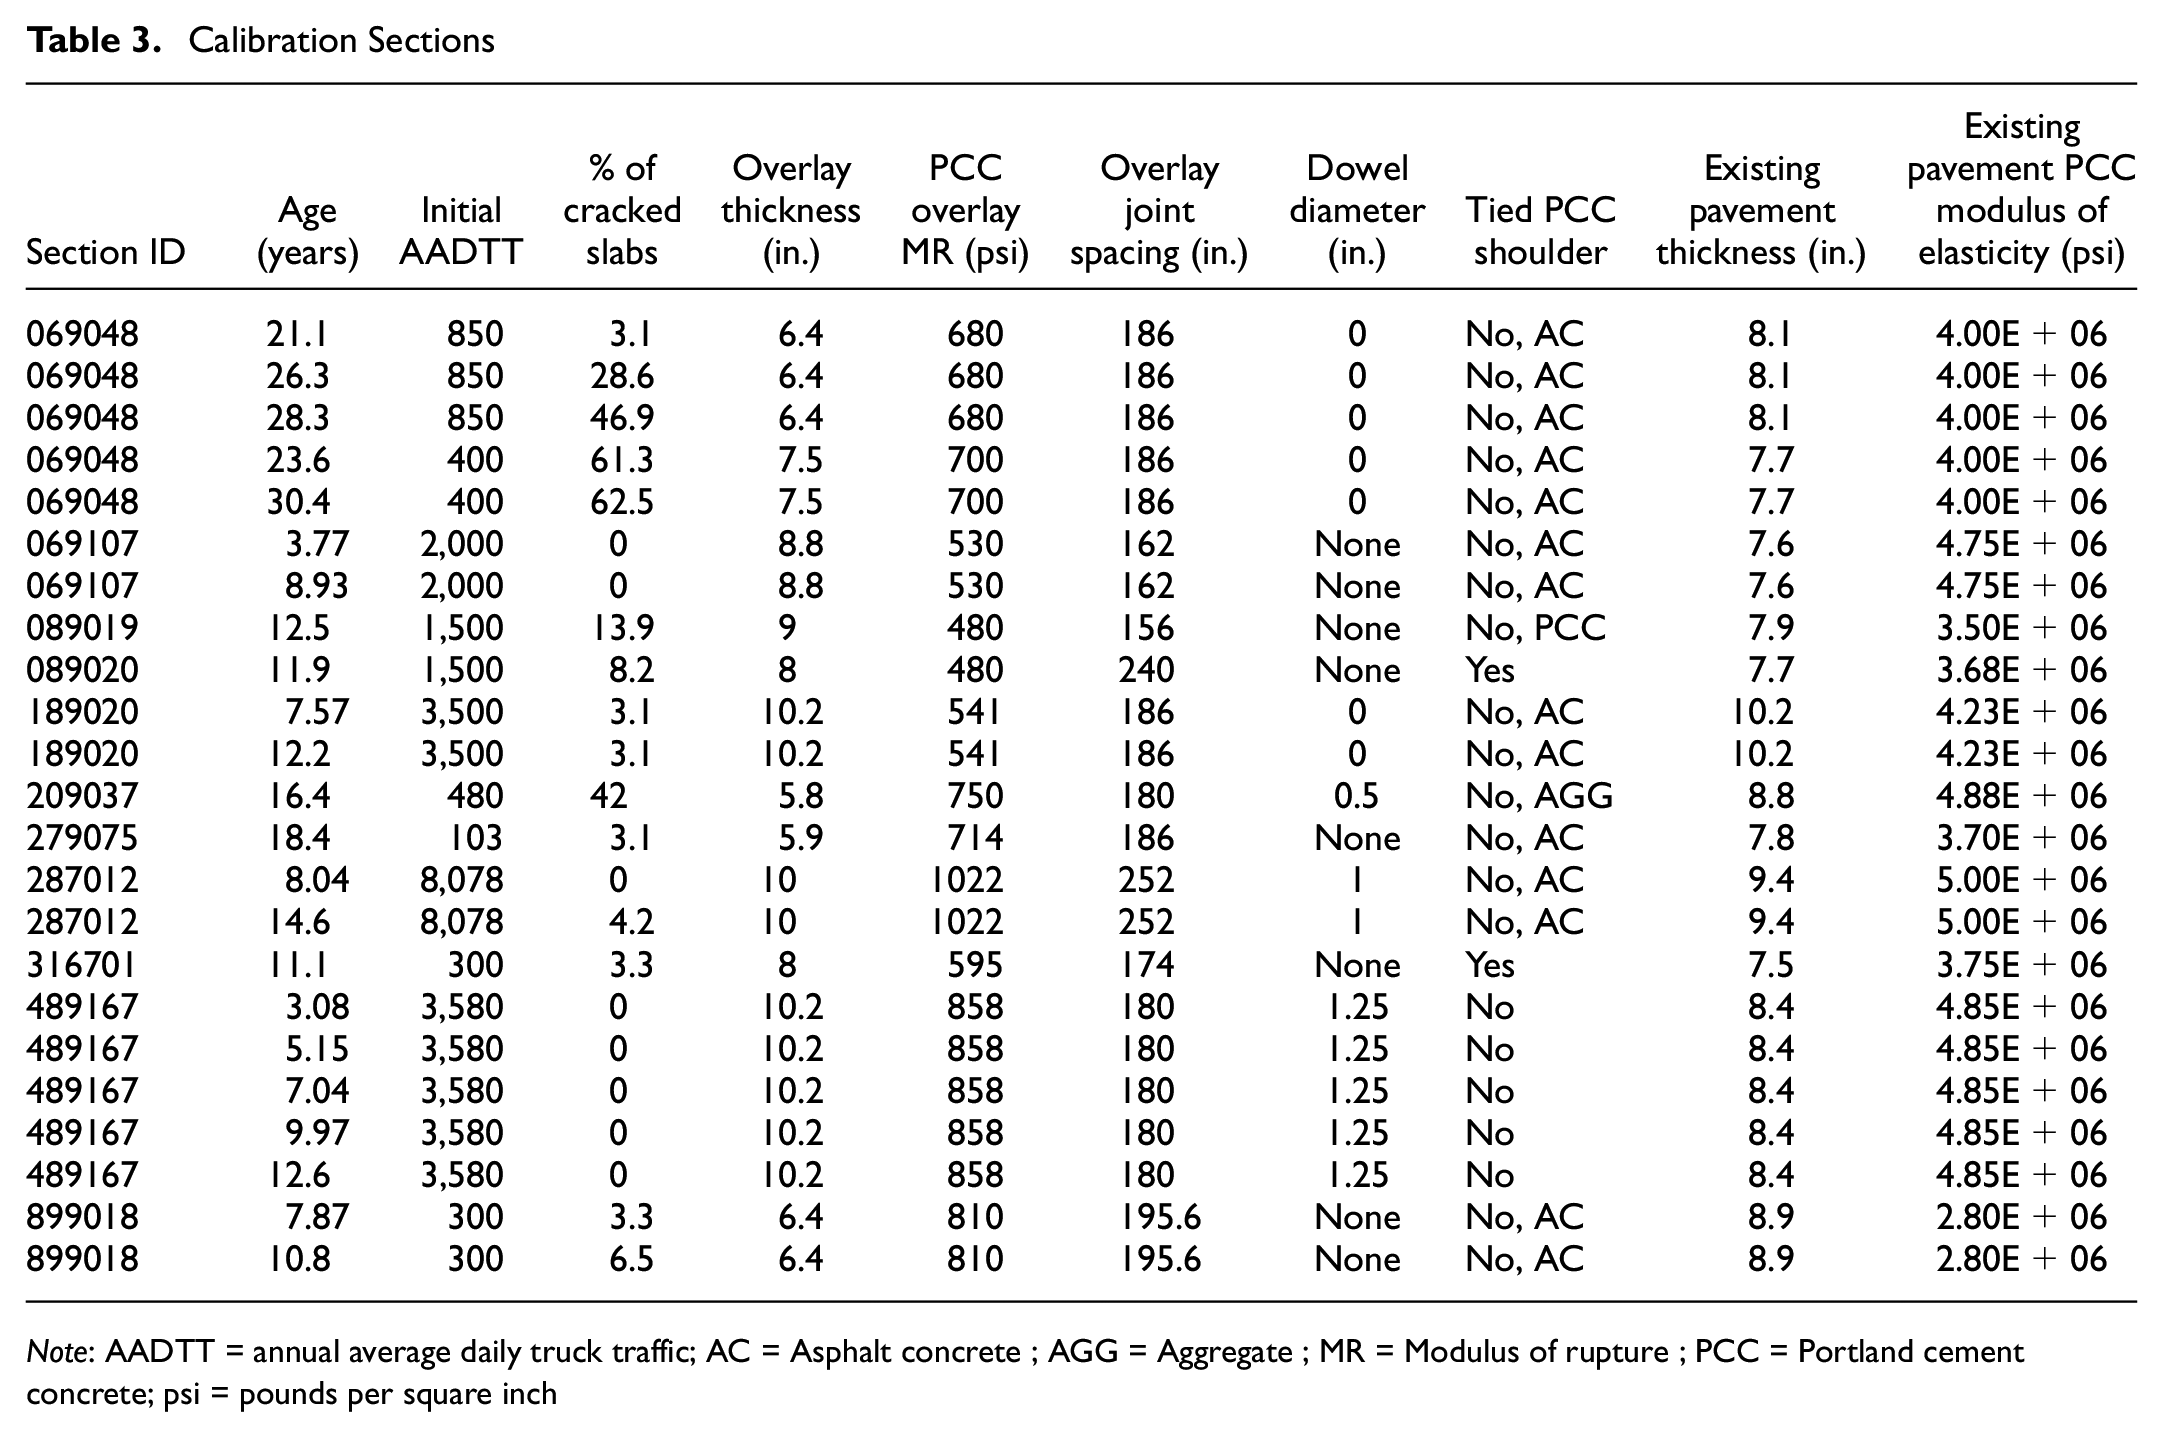
Note: AADTT = annual average daily truck traffic; AC = Asphalt concrete ; AGG = Aggregate ; MR = Modulus of rupture ; PCC = Portland cement concrete; psi = pounds per square inch
Non-linear optimization was conducted to minimize the sum of squared differences between the observed and predicted cracking. Cracking was predicted for a wide range of calibration coefficients and a set of coefficients that would minimize the discrepancy between predicted and measured values was selected. The resulting cracking model has the following form:

Figure 6 presents a comparison of the calibrated cracking model predictions with measured cracking. The model shows a reasonably good fit with field data without bias in the predictions.
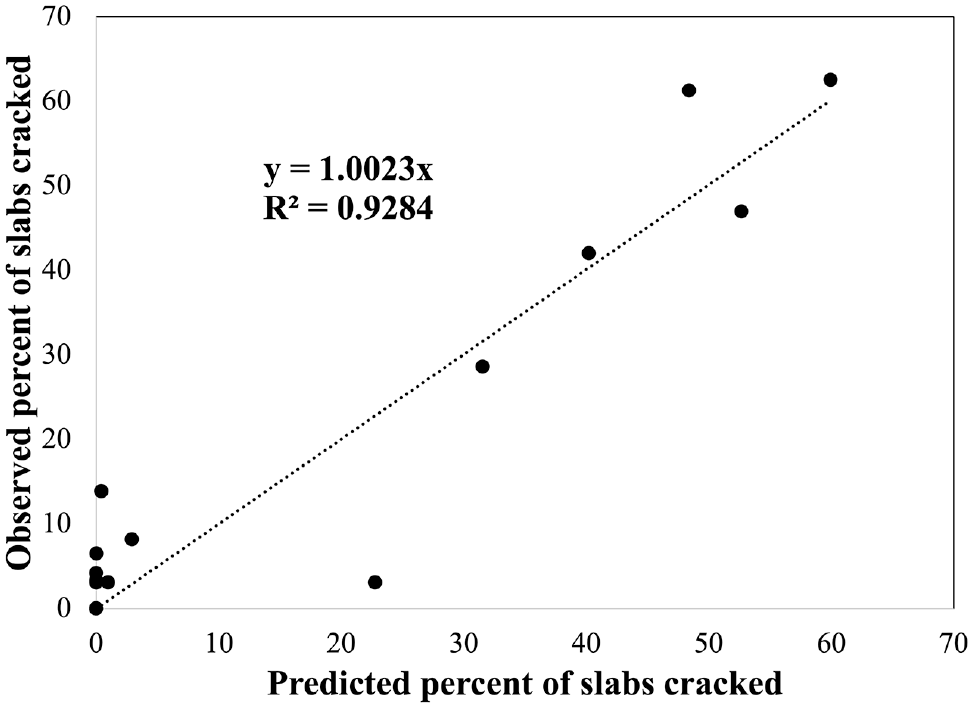
Unbonded concrete overlay cracking model predictions compared with long-term pavement performance observations.
The performance prediction model developed in this study was implemented into a Fortran program. To facilitate implementation of this program, a web-based application was developed ( 23 ).
Sensitivity Analysis
A sensitivity analysis of predicted cracking to various parameters was conducted using the web-based application to further evaluate the model. Base design parameters in this study were an 8 in.-thick undoweled PCC overlay (modulus of rupture of 650 psi) with a 1 in. dense graded asphalt interlayer over an 8 in.-thick existing PCC (elastic modulus of 4.106 psi). In addition, 15 ft joint spacing and asphalt shoulder were assumed. The UBOL was subjected to a two-way initial AADTT of 8,000.
Figure 7 shows predicted cracking for the overlay thickness of 6, 8, and 10 in computed for undoweled overlays and overlays with 1 in. dowels. Unlike AASHTO M-E, the proposed procedure predicts that using dowels will reduce cracking, because dowels reduce potential of both longitudinal and corner cracking initiated at the transverse joint. Whereas AASHTO M-E predicts a non-monotonic relationship between the overlay thickness and cracking (see Figure 1), the proposed procedure predicts that an increase in overlay thickness will reduce cracking as expected.
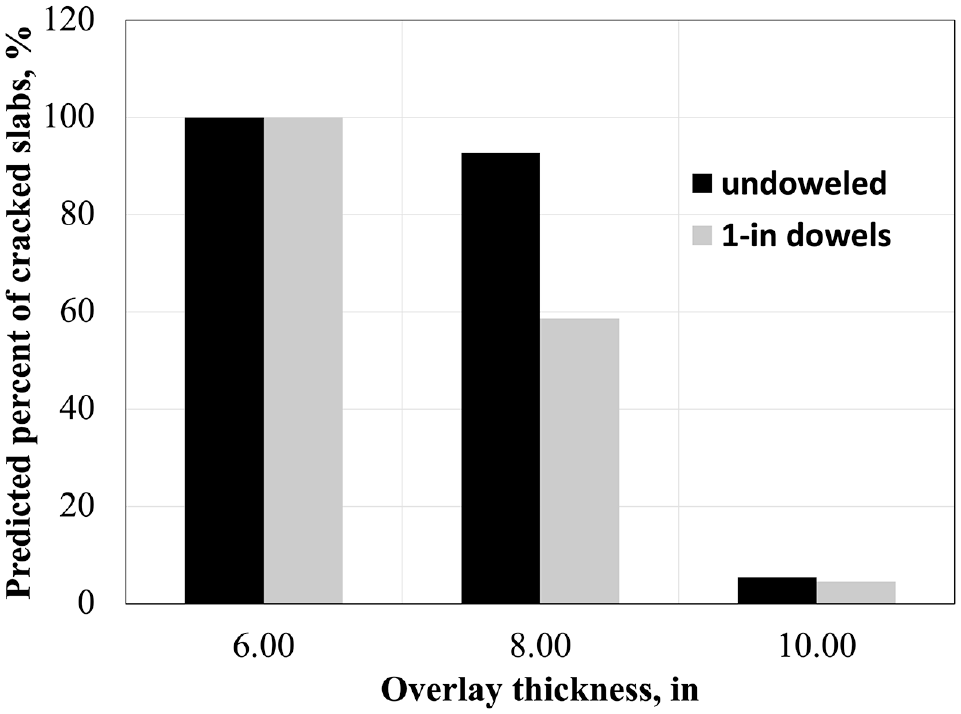
Effect of overlay thickness on predicted cracking.
The effect of traffic volume and joint spacing on cracking is illustrated in Figure 8a where an increase in traffic volume increases predicted cracking. For each traffic volume level, predictions for an overlay with 12 ft joint spacing resulted in a lower cracking than for the overlay with 15 ft joint spacing. Figure 8b shows that the use of fabric interlayer results in a slightly lower cracking level than using asphalt interlayer. From Figure 8c, an increase in dowel diameter and the presence of a tied PCC shoulder decrease cracking. Results suggest that cracking predictions present reasonable trends.
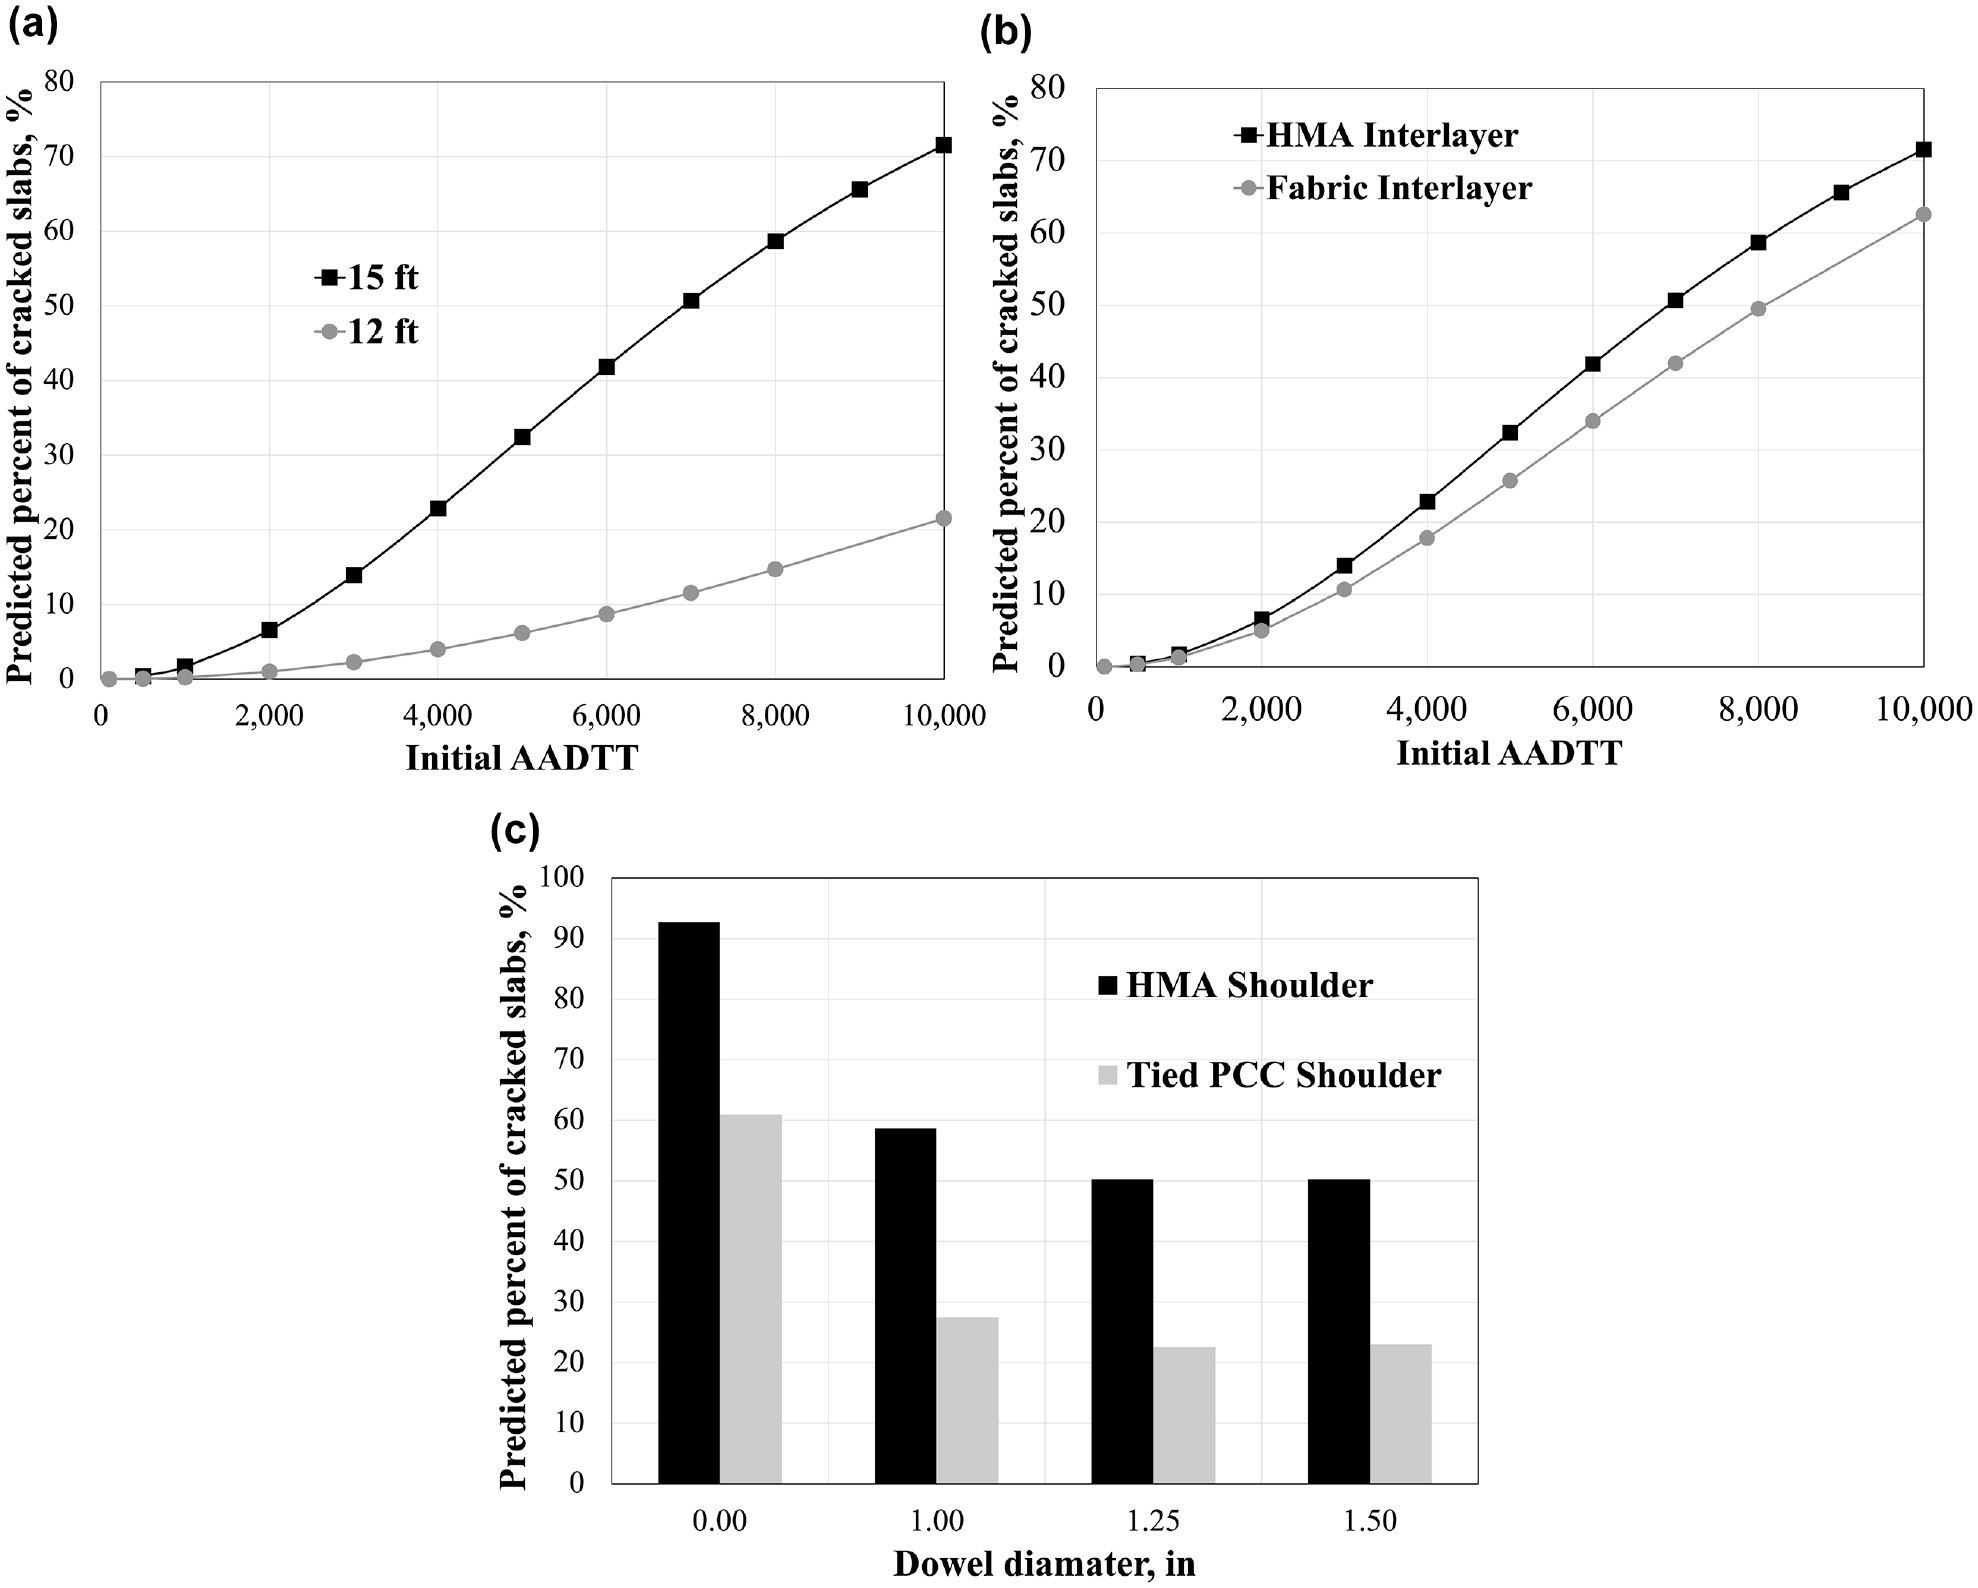
Predicted crack variation with: (a) traffic volume and joint spacing, (b) interlayer type, and (c) shoulder type and dowel diameter.
Reliability Analysis and As-Built Variation
The procedure described above allows cracking prediction for a given set of design parameters. However, Figure 6 shows that the actual data are scattered about the line representing the final calibrated–validated model. The calibration of the procedure ensured only the unbiased nature of the model; that is, some of the observation points used in the calibration were above the equality line and some were below it.
A major deficiency in the AASHTO M-E reliability analysis is that it does not relate the reliability level with variation in key design inputs (5, 6). In addition, the expression for the standard deviation for the unbonded overlays is not definitive because of a small number of the sections used in the model calibration. For these reasons, a simple Monte Carlo simulation approach that resembles the reliability analysis used by MnPAVE Rigid ( 24 ) was selected.
In the procedure implemented in this study, the controlling distress for reliability is the predicted transverse cracking and the varied parameters are concrete thickness and modulus of rupture. The recommended design thickness is the thickness that meets the performance criteria, that is, percentage of cracking at the specified reliability level. In addition to design inputs required to predict cracking (except overlay thickness), it is necessary to provide standard deviations for the flexural strength and the overlay thickness.
As an example, consider the performance prediction of a 7 in. unbonded overlay over an 8 in. existing concrete pavement located in Sioux City, IA. The system has the following parameters:
• Overlay flexural strength (modulus of rupture): 650 psi
• Overlay joint spacing: 12 ft
• Overlay joints load transfer devices: 1 in. dowels
• Overlay shoulder type: asphalt
• Existing overlay thickness: 10 in.
• Existing PCC modulus of elasticity: 4,000,000 psi
• Interlayer type: asphalt.
○ Effective binder content by volume: 5%
○ Air voids: 5%
○ Percent passing #200 sieve: 3%
• AADTT in the design lane (first year): 1,000
• Linear yearly growth of traffic volume: 3%
• Coefficient of variation of PCC overlay thickness: 3%
• Coefficient of variation of PCC flexural strength: 8.7%
The cracking model prediction for this unbonded overlay is 10.29% cracked slabs after 20 years. To evaluate the probability that this system will exhibit less than 15% of cracked slabs, the procedure developed in this study requires simulating pavement performance of the unbonded overlay for 441 cases.
The frequency distribution of percentages of cracked slabs from these simulations is shown in Figure 9a and the corresponding cumulative distribution is in Figure 9b. Some simulations resulted in the prediction of less than 2.5% cracking. These cracking levels were predicted for combinations of overlay thickness and strength greater than the corresponding mean values. At the same time, combinations of overlay thickness and strength lower than the corresponding mean values resulted in cracking as high as 50%. The median predicted cracking is 11.51%. This means that although the deterministic prediction of cracking for a 7 in.-thick overlay with flexural strength of 650 psi is 9.64%, it can be said, with 50% confidence, that the cracking will be less than 9.64%. At the same time, 127 observations resulted in predicted cracking greater than the target value of 15%. This means that the predicted reliability of cracking of less than 15% is 71% for this example case
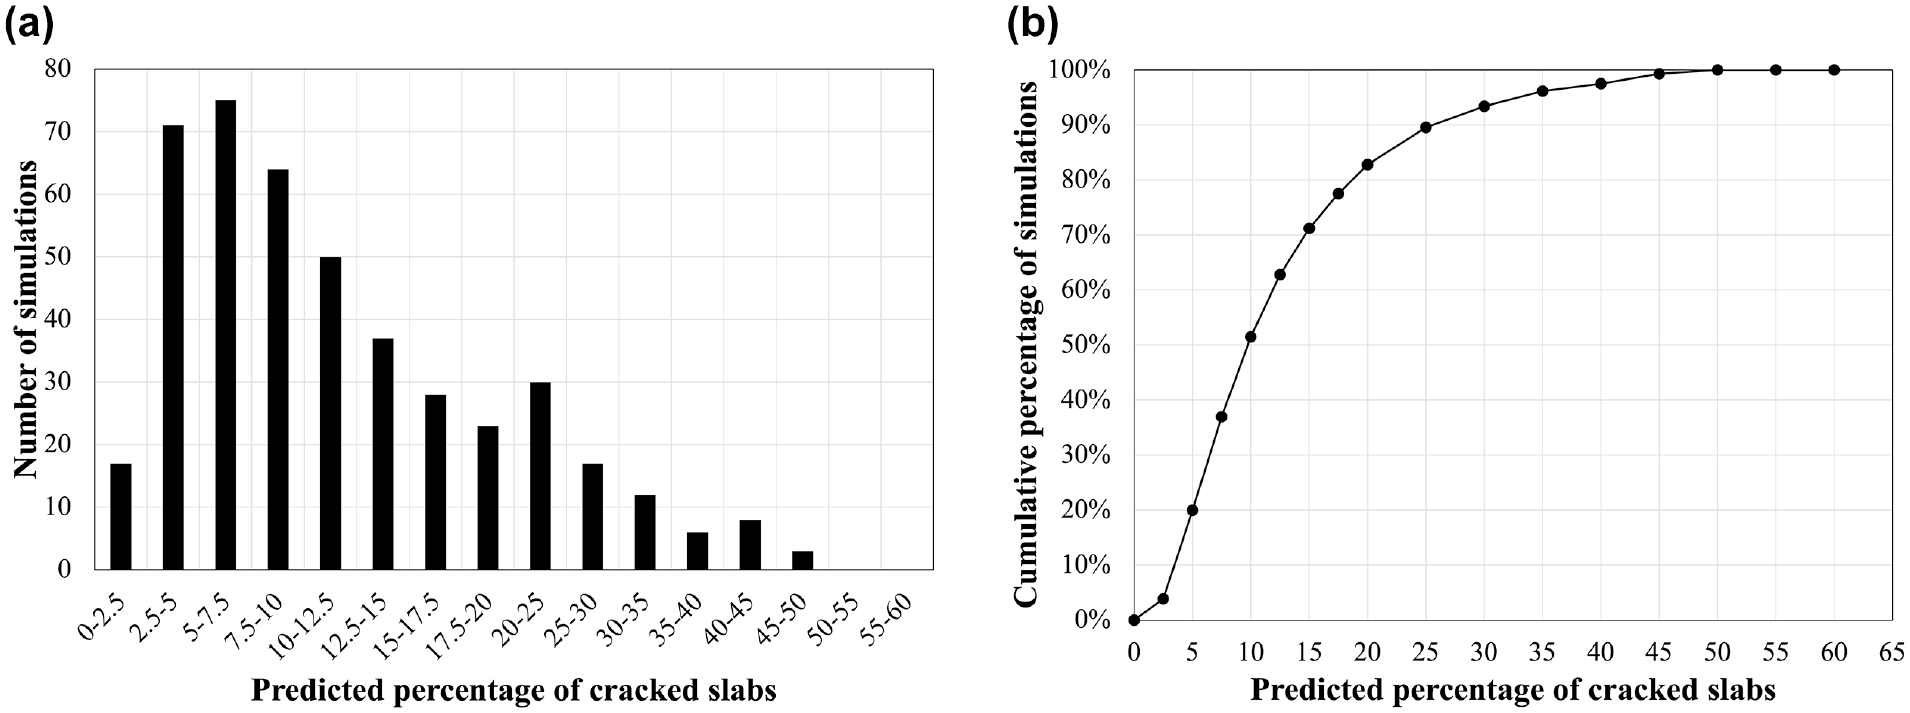
(a) Predicted frequency and (b) cumulative distribution of percentages of cracked slabs.
To determine the overlay thickness required to ensure that the predicted cracking at the end of the design life is less than 15% with an 90% reliability level, the developed procedure performs a similar analysis for each overlay thickness starting from 6 in. and increasing it with increments of 0.1 in until less than 10% of the simulations predict cracking less than 15%.
Figure 10 presents the results of this analysis for overlay thickness from 6 to 7.6 in. If the overlay thickness is 6 in., then the predicted cracking with 90% reliability is over 40%. To achieve the target 15% cracking with 90% reliability, a 7.5 in. overlay should be used.
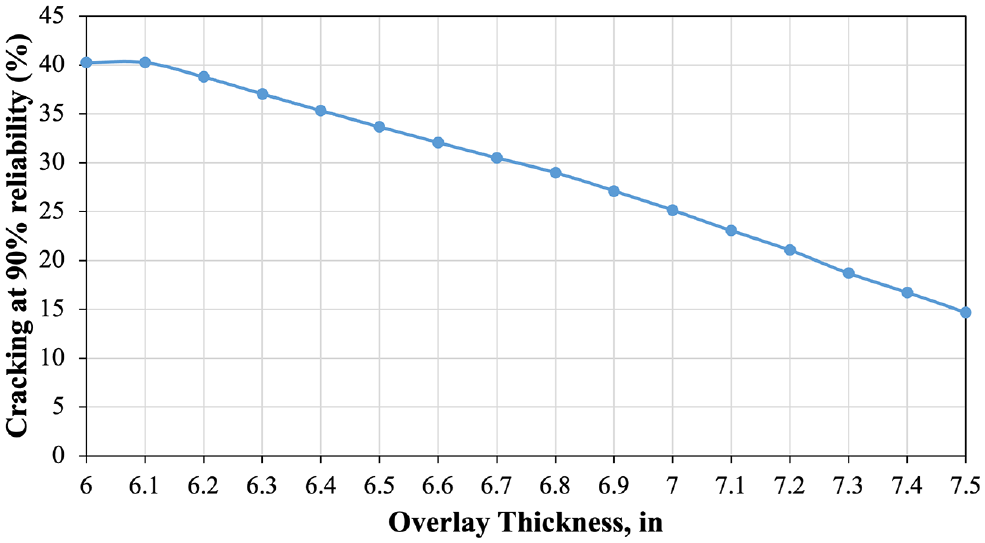
Predicted cracking at 90% reliability.
Another sensitivity analysis was conducted to further evaluate the procedure. The base design parameters in this analysis were the same as for the previous sensitivity study, save that for this case, 1 in. dowels were incorporated in the design. The 90% reliability design was adopted to ensure predicted cracking is less than 15% at the end of the design period.
Figure 11 shows required overlay thickness for various traffic volumes and reliability levels. As expected, an increase in the traffic volume or reliability level leads to an increase in the required overlay thickness. For a 90% reliability level, Figure 12a presents the effect of joint spacing on the required overlay thickness. For each traffic volume level, a 12 ft joint spacing resulted in a lower required overlay thickness than the one for the overlay with a 15 ft joint spacing. Figure 12b compares required overlay thicknesses for hot mix asphalt (HMA) and fabric interlayers. The fabric interlayer resulted in slightly higher overlay thicknesses for low-volume traffic, but in thinner overlays for high-volume traffic. Figure 12c shows that an increase in dowel diameter or the presence of a tied PCC shoulder decreases the required overlay thickness.
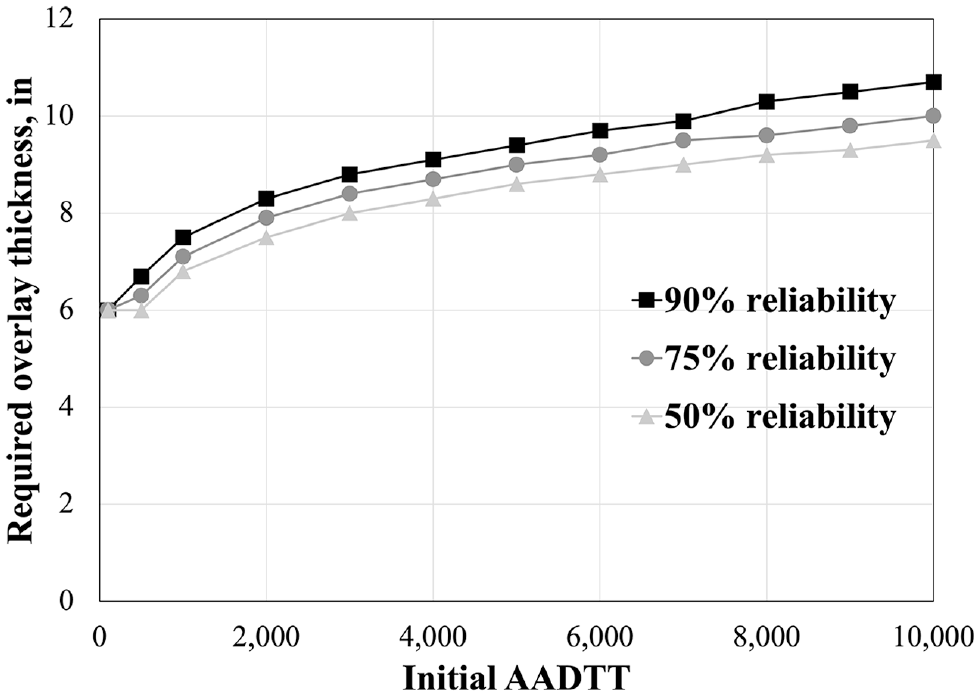
Effect of reliability revel on required overlay thickness.
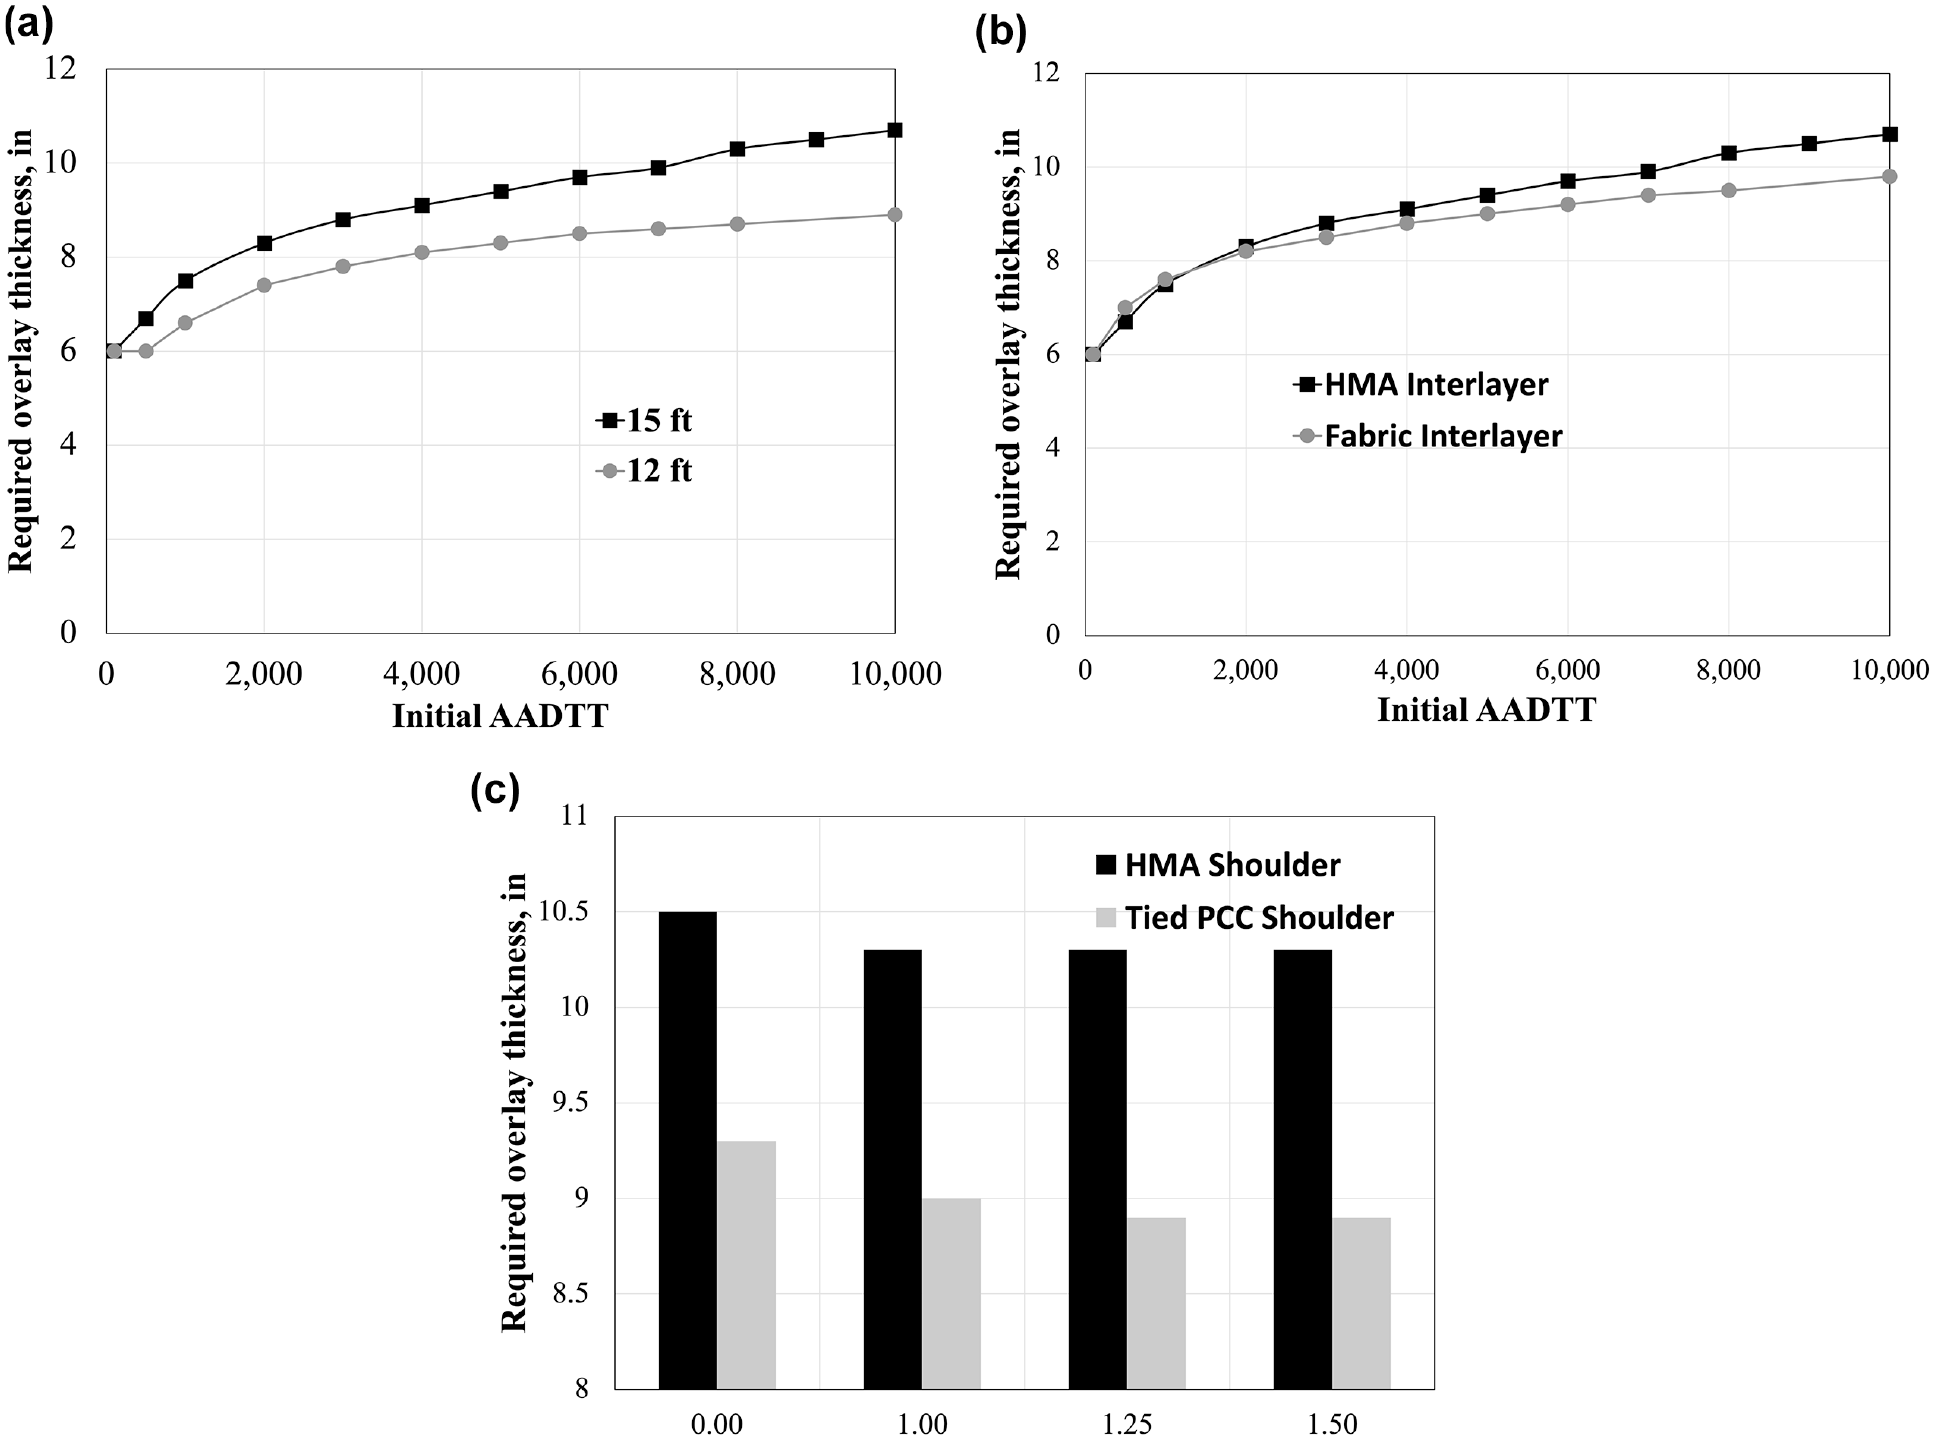
Required overlay thickness variation with: (a) traffic volume and joint spacing, (b) interlayer type, and (c) shoulder type and dowel diameter.
Again, the sensitivity plots suggest reasonable trends. The only exception is the reduction of the required overlay thickness for heavy volume traffic if a fabric interlayer is used instead of an HMA interlayer. Because of lack of long-term performance data for unbonded overlays with fabric interlayer under heavy traffic, this trend cannot be confirmed or disproved.
Summary
In view of counterintuitive trends showed by the AASTHO M-E cracking model for UBOL, this paper proposed a modified model for UBOL cracking prediction. The developed model is capable of analyzing the effect of the following design factors on the predicted cracking: traffic volume, overlay joint spacing, overlay dowel diameter, shoulder type, concrete strength and stiffness, existing pavement thickness and stiffness, interlayer type and mix design if an HMA interlayer is used. The model was calibrated with LTPP data. A sensitivity analysis of predicted cracking to various parameters suggests that exhibited predictions have reasonable trends.
As an improvement to the previous model, the proposed model takes in consideration the effect of the interlayer material and predicts bottom-up and top-down cracking in two locations for conventional and short UBOL. Unlike the current AASHTO-ME procedure, the new procedure predicts that dowels with adequate diameter may reduce overlay cracking by reducing potential of longitudinal cracking. Additionally, the procedure introduces significant modifications in the analysis of temperature data, built-in curling, and reliability.
The cracking model developed in this study was implemented into a Fortran program. To facilitate implementation of this program, a web-based application was developed. This web-based application ( 23 ) also includes the faulting model for UBOL. These performance prediction models are incorporated into a mechanistic–empirical design procedure for UBOL that has a potential to become an attractive alternative to the current AASHTO-ME procedure.
Footnotes
Author Contributions
The authors confirm contribution to the paper as follows: study conception and design: L. Khazanovich, J. Vandenbossche, T. Burnham; data collection: L. Khazanovich, J. Vandenbossche, T. Burnham; analysis and interpretation of results: L. Khazanovich, J. Vandenbossche, L. S. Salles; draft manuscript preparation: L. Khazanovich, L. S. Salles. All authors reviewed the results and approved the final version of the manuscript.
Declaration of Conflicting Interests
The author(s) declared no potential conflicts of interest with respect to the research, authorship, and/or publication of this article.
Funding
The author(s) disclosed receipt of the following financial support for the research, authorship, and/or publication of this article: This work was supported by the Pooled Fund Study TPF-5(269) Development of an Improved Design Procedure for Unbonded Concrete, MnDOT contract 1003327 (wo) 2 and by the University of Pittsburgh Anthony Gill Chair.

Data Accessibility Statement
The data used in this study may be made available on reasonable request to the corresponding author.