
Abstract
This study investigates the impact of the introduction of high-speed rail (HSR) on regional income and innovation, focusing on peripheral regions in Japan. Average income per capita (IN) and number of patent applications per employee (PA) are assumed to represent regional income and innovation, respectively. “Peripheries” are defined based on each municipality’s employment density and its accessibility, the latter is measured by effective density, an index representing interregional communication opportunities. Municipality-level panel data from Japan for a 40-year period are used. A difference-in-differences analysis of municipalities with variable treatment timings is employed to investigate the impact of HSR on the IN and PA of peripheries. The findings indicate that the introduction of HSR has been able to contribute to the mitigation of regional inequalities by positively affecting the IN and PA of peripheries. Furthermore, the results estimated with the accessibility-based peripheries show that the impacts of HSR on IN are smaller and on PA are larger in these peripheries than in core regions. These suggest the crucial role that accessibility may play in peripheries for catching up with the economic growth of core regions, particularly in a context of geographical concentration of economic activities, as in the case of Japan. It is also argued that the enhanced PA in peripheries with poor accessibility might not have been well exploited for economic gains because of their underdeveloped industrial structures and distance to large hub cities, leading to challenges in catching up.
Keywords
The development of transportation infrastructure has several effects outside of the transportation system, including regional economic growth. However, some negative externalities, including the exclusion of some population groups and regions, may also be simultaneously witnessed. Associated dimensions related to such exclusions include “exclusion from facilities” and “geographical exclusion” as they prevent access to facilities and services by spatially isolating some regions, leading to regional inequalities ( 1 ). The change in inequalities-related theory suggests an inverted U-curve relationship with economic growth from the initial rise of regional differentials in early developmental stages, followed by stabilization and diminishing with the convergence of developing regions in matured stages ( 2 ). The contrasting regional divergence phenomenon observed among developing regions could not be well explained by traditional theories, leading to the development of alternative theories, including new central place theory (CPT) and new economic geography (NEG). These spatial economic theories argue multiple perspectives of increasing returns to scale experienced in producing goods/services, their spatial organization and coordination in relation to market shapes and sizes, and behaviors of consumers and sellers, which interactively result in the clustering of economic activities or spatial agglomerations ( 3 – 5 ). The diverse types of interaction between such agglomerating forces together with changes in transportation costs can result in several types of organization and characteristics of agglomeration economies ( 6 ). Although the diverse characteristics of economic clusters/agglomerations are explained using distinct rationales and approaches in CPT and NEG, it is evident that regional inequalities will exist, as indicated by the formation of central places and their corresponding hinterlands (in CPT) and/or the core–periphery geography (in NEG) on an otherwise featureless plain (3–5, 7).
The term “periphery” (or “hinterland”) refers to a spatial attribute and regions that are located at far-distant parts from any central region ( 8 ). Often, periphery is regarded as an antonym for core ( 9 ). Labor markets in peripheries are described as “thin” based on size and density. This may also indicate lower incomes, leading to smaller consumption and production scales and a fragmented economy. The characteristics of peripheries based on the “relative absence of physical infrastructure (road, rail, and telecommunications), qualified labor, research and technological development” are also noted in the literature ( 10 ). As peripheries struggle to catch up, it is imperative to consider them equally and prevent regional disparities.
The aim of this study is to investigate the impact of high-speed rail (HSR) development on peripheries or hinterland regions in Japan empirically. It is hypothesized that HSR introduction has affected the regional economies of peripheries in Japan, thereby contributing to the mitigation of regional inequalities. Municipality-level data in Japan are used for the empirical analysis. Regional inequalities in relation to regional income and innovation are highlighted; an emphasis on the accessibility dimension of peripheries is made. Average income per capita (IN) and number of patent applications per employee (PA) are assumed to represent income and innovation levels in municipalities, respectively.
The rapid economic growth of Japan after World War II is characterized by the agglomerated character of economic activities along its famous Pacific Ocean Belt Zone, which contains large cities: Tokyo, Nagoya, and Osaka. This has resulted in severe regional inequalities in Japan. Later, Japan’s government undertook several measures to achieve balanced growth. Japan now ranks second lowest in regional income inequality among the Organization for Economic Co-operation and Development countries. Japan is unique because of its geographical concentration for high growth and balanced geography of good living standards and flattened disparities ( 11 ). This has been the result of several long-term comprehensive national development plans (CNDPs) and national spatial planning policies. These plans also envisaged the development of nationwide transportation networks, considered as a strategy to reduce regional disparities. The introduction and development of HSR in Japan has been considered an important component of spatial planning strategies and is believed to have facilitated enhanced interregional passenger transportation, thereby affecting regional economies. Large transportation projects such as HSR may also facilitate the alleviation of peripheral handicaps by reducing transportation costs and time. However, it remains unclear whether the accessibility improvements achieved through transportation development support balanced growth. Japan has been pioneer in HSR since 1964, developing the first HSR line along the Tokyo-Nagoya-Osaka economic corridor. While the effects on regional inequalities from the development of other transportation modes have been explored, the impacts of HSR have not been well studied despite its long history.
Literature Review
Regions are subjected to dispersion forces because of immobile resources/factors for producing certain types of goods, for example, in the agricultural sector, whose production may be dispersed in economic geography ( 6 ). Therefore, complex interactions of agglomeration and dispersion forces result in distinct types of agglomeration economies. It has been argued that a chain of repeated core–periphery patterns with monocentric spatial structures may emerge when agglomeration forces are dominant, whereas the development of megalopolises with multiple core cities connected through an industrial belt may emerge if agglomeration forces are relatively small ( 7 ).
The traditional CPT ( 12 ) descriptively introduced the concept of central goods (those subject to scale economies), explained the provisions of spatial coordination on geometrical principles, and illustrated the geographical properties. However, its successors ( 13 , 14 ) empirically extended the descriptive illustrations of the traditional CPT using equilibrium outcomes of spatial competition among firms. Furthermore, there was an evolution of the literature on the new CPT ( 3 ), whose distinguishing feature was to account for indivisibilities arising from optimal consumer and seller behaviors, complex structure of transportation costs, and available quantities of consumer goods.
The NEG theory provided further advancements in the spatial economic literature by incorporating certain distinct concepts that were overlooked or partly considered in the traditional location theory framework ( 4 , 5 , 15 ). First, the entire spatial economy was modeled in the NEG using a general equilibrium framework. Second, NEG considered increasing returns to scale at the level of firms or plants and created space for imperfect competition (monopolistic competition) in its framework. Third, it enabled better accounting of transportation costs in the analysis that made locations significant. Fourth, it considered the locational movements of productive factors and consumers as a prerequisite for agglomeration.
A rigorous comparison of the superiority of one spatial economic theory over another is beyond the scope of this research. Notably, models in these spatial economic studies have attempted to elucidate the sources of increasing returns at different microeconomic levels.
Empirical studies have reported mixed findings in relation to regional inequalities in the context of HSR development ( 16 ). Mostly, economic inequalities have increased ( 17 ); some studies report minimal contributions by HSR to regional disparity ( 18 ), while others have found a reduction in inequalities with the promotion of regional convergence from HSR ( 19 ). Many studies also highlight that HSR development leads to reduced disparities between mega cities and nearby second- and third-tier cities by facilitating integration. They argue that such second-tier cities, with higher populations than the third-tier cities, experience more benefits ( 17 ). Notably, the benefit a city may experience from HSR development depends on how it is linked to other cities in the network, and the situation of small cities might worsen ( 20 ). Further evidence verifies that small intermediate cities may be bypassed in favor of large metropolises with enhanced linkages ( 16 ). In relation to the measures of inequality, most of these studies have adopted the Gini coefficient, Theil index, and coefficient of variation of income to represent disparities; Cowell ( 21 ) provides an overview of several measures of inequality and their comparison. Based on Japanese HSR, although the literature seems sparse, it is highlighted that HSR has limited contributions to the growth of smaller and rural regions, even though it affects the economies of large and developed regions ( 22 ).
The contributions of this study are threefold. First, considering inequalities in forms of income and innovation, the latter is rarely studied in an HSR context. However, recent works on the impact of HSR on regional innovation from the increase in knowledge spillovers ( 23 – 25 ) project the need for its investigation in peripheries. Innovation, a crucial driver of economic growth, is also argued to affect wages and regional inequalities ( 26 ). Second, the peripheries are distinctly defined. Most previous studies defined peripheries using demographic measures, while this study uses an additional measure of accessibility: effective density (ED). It also compares the findings of this accessibility-based definition of periphery with the conventional employment density-based definition. Finally, the evidence used is at a much more granular scale of municipalities in Japan and a large set of panel data of approximately 40 years is utilized.
Development of HSR and Regional Inequalities in Japan
Development of HSR in Japan
Inter-city accessibility in Japan has been gradually enhanced through the development of all transportation modes. In Japan, HSR has a remarkable effect on passenger mobility. Currently, Japan has seven HSR lines, which are well known for their high frequency, reliability, safety, and operation on exclusive lines. This extensive network (Figure 1) was started in 1964 along the Tokyo-Nagoya-Osaka economic corridor. In 1972 and 1975, this line was extended westward to Kyushu, the southern island of Japan. This was followed by the opening of two new lines, Tohoku and Jo-estsu, in 1982, for connectivity to northern rural regions. Furthermore, a few more lines connecting other rural areas were introduced after the late 1990s. These services currently operate at 240–320 km/h, while an even faster technology, Maglev trains, is expected around 2027 along the Tokyo-Nagoya-Osaka corridor. For over 50 years, this HSR network has significantly affected Japan’s economy, ranging from economic and fiscal impacts to agglomeration and productivity impacts ( 27 ).
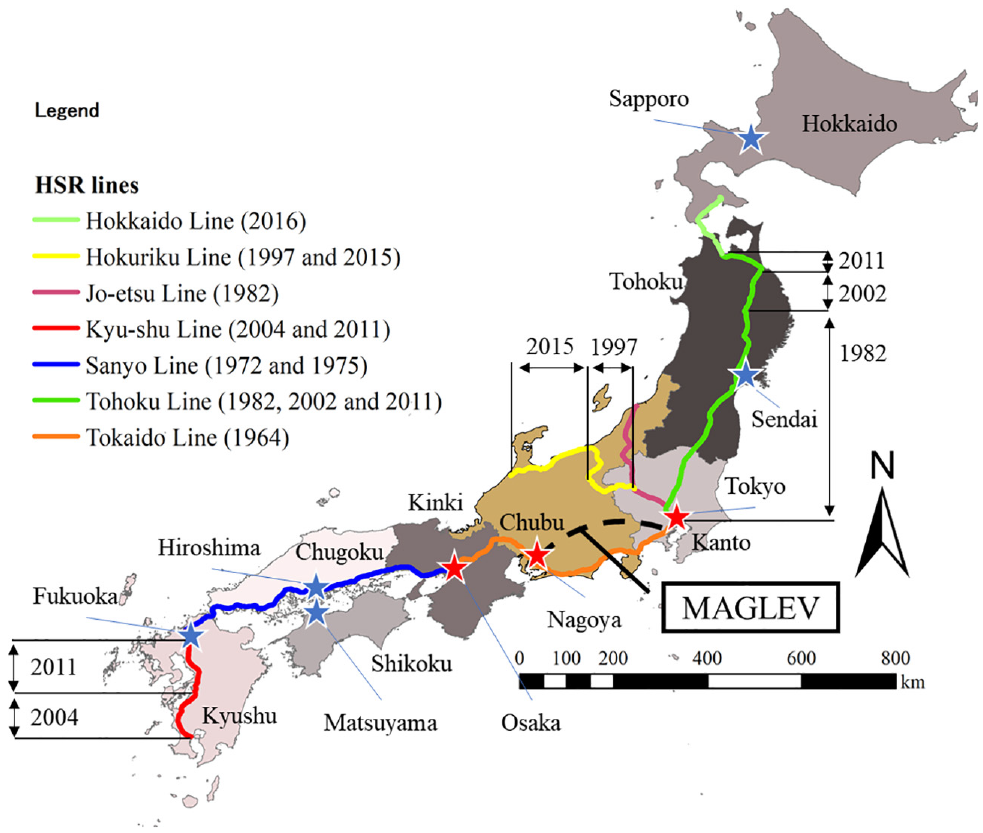
Network of high-speed rail lines in Japan.
Regional Inequalities in Japan
Japan has witnessed remarkable amounts of recovery with a rapid growth of 10% in the initial decades after World War II, followed by a stabilized growth of 3%–5%, dropping to 0%–1% around 2000. Such a rapid expansion was initially guided by several government policies, including the “Income Doubling Plan” formulated in 1960 to develop the Tokyo-Nagoya-Osaka economic corridor. This resulted in a strong agglomeration economy in Japan until the government faced criticism in relation to the increasing regional disparities. Until the 1980s, Japan’s population was found to be heavily concentrated along the Tokyo-Nagoya-Osaka corridor because of its attractiveness for jobs, education, and better quality of life ( 10 ). This characteristic can also be partly attributed to the historic and long-lasting features of Japan’s macroeconomy. These include major issues, for example, the continuously observed decrease of interest rates in the earlier periods of growth, leading Japan’s macroeconomy to enter a “liquidity trap” state. This has also been argued to be a major cause of bursting real estate and stock market bubbles and the long-lasting recessions that followed for Japan’s economy. This, together with other deeper structural problems and the aging population, has caused problems of decline in consumption, deflation, loss of property values, and large wage differences between the exporting sector and domestic sector companies. Such macroeconomic characteristics and environments that have defined the sluggish economic growth in the past few decades would have also caused an increase in regional inequalities in Japan ( 28 ).
Figure 2 shows the trend of the nationwide coefficient of variation (CoV) of IN and PA from 1976 to 2016. CoV is an index for regional disparity, and defined as follows:

where
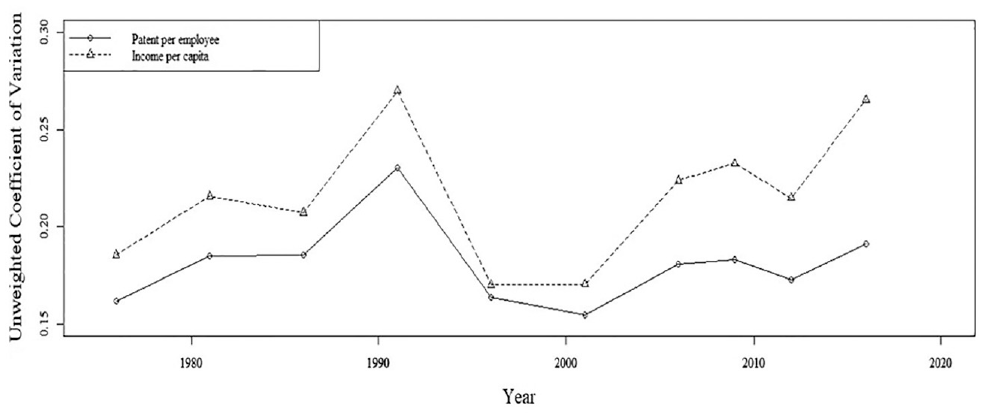
Coefficient of variation (CoV) of nationwide income per capita and patents per employee.
Figure 3 shows the distributions of IN and PA in 1981 and 2016 for different Japanese municipalities. There are 1,741 Japanese municipalities, indicating that the majority of municipalities with higher IN and PA values are (or around) large cities in the eight regions of Japan. Note that in Figure 3 only the three largest metropolises, which have historically experienced large concentrations, are marked along the Tokyo-Nagoya-Osaka corridor. This reflects Japan’s prevalent and strong agglomeration characteristics. However, an exception is the northernmost region, Hokkaido, which has a distinct character of high income despite its low population concentration because of its large-scale agricultural industry. From a temporal perspective, it is observed that this agglomerative character has strengthened, as mentioned earlier.
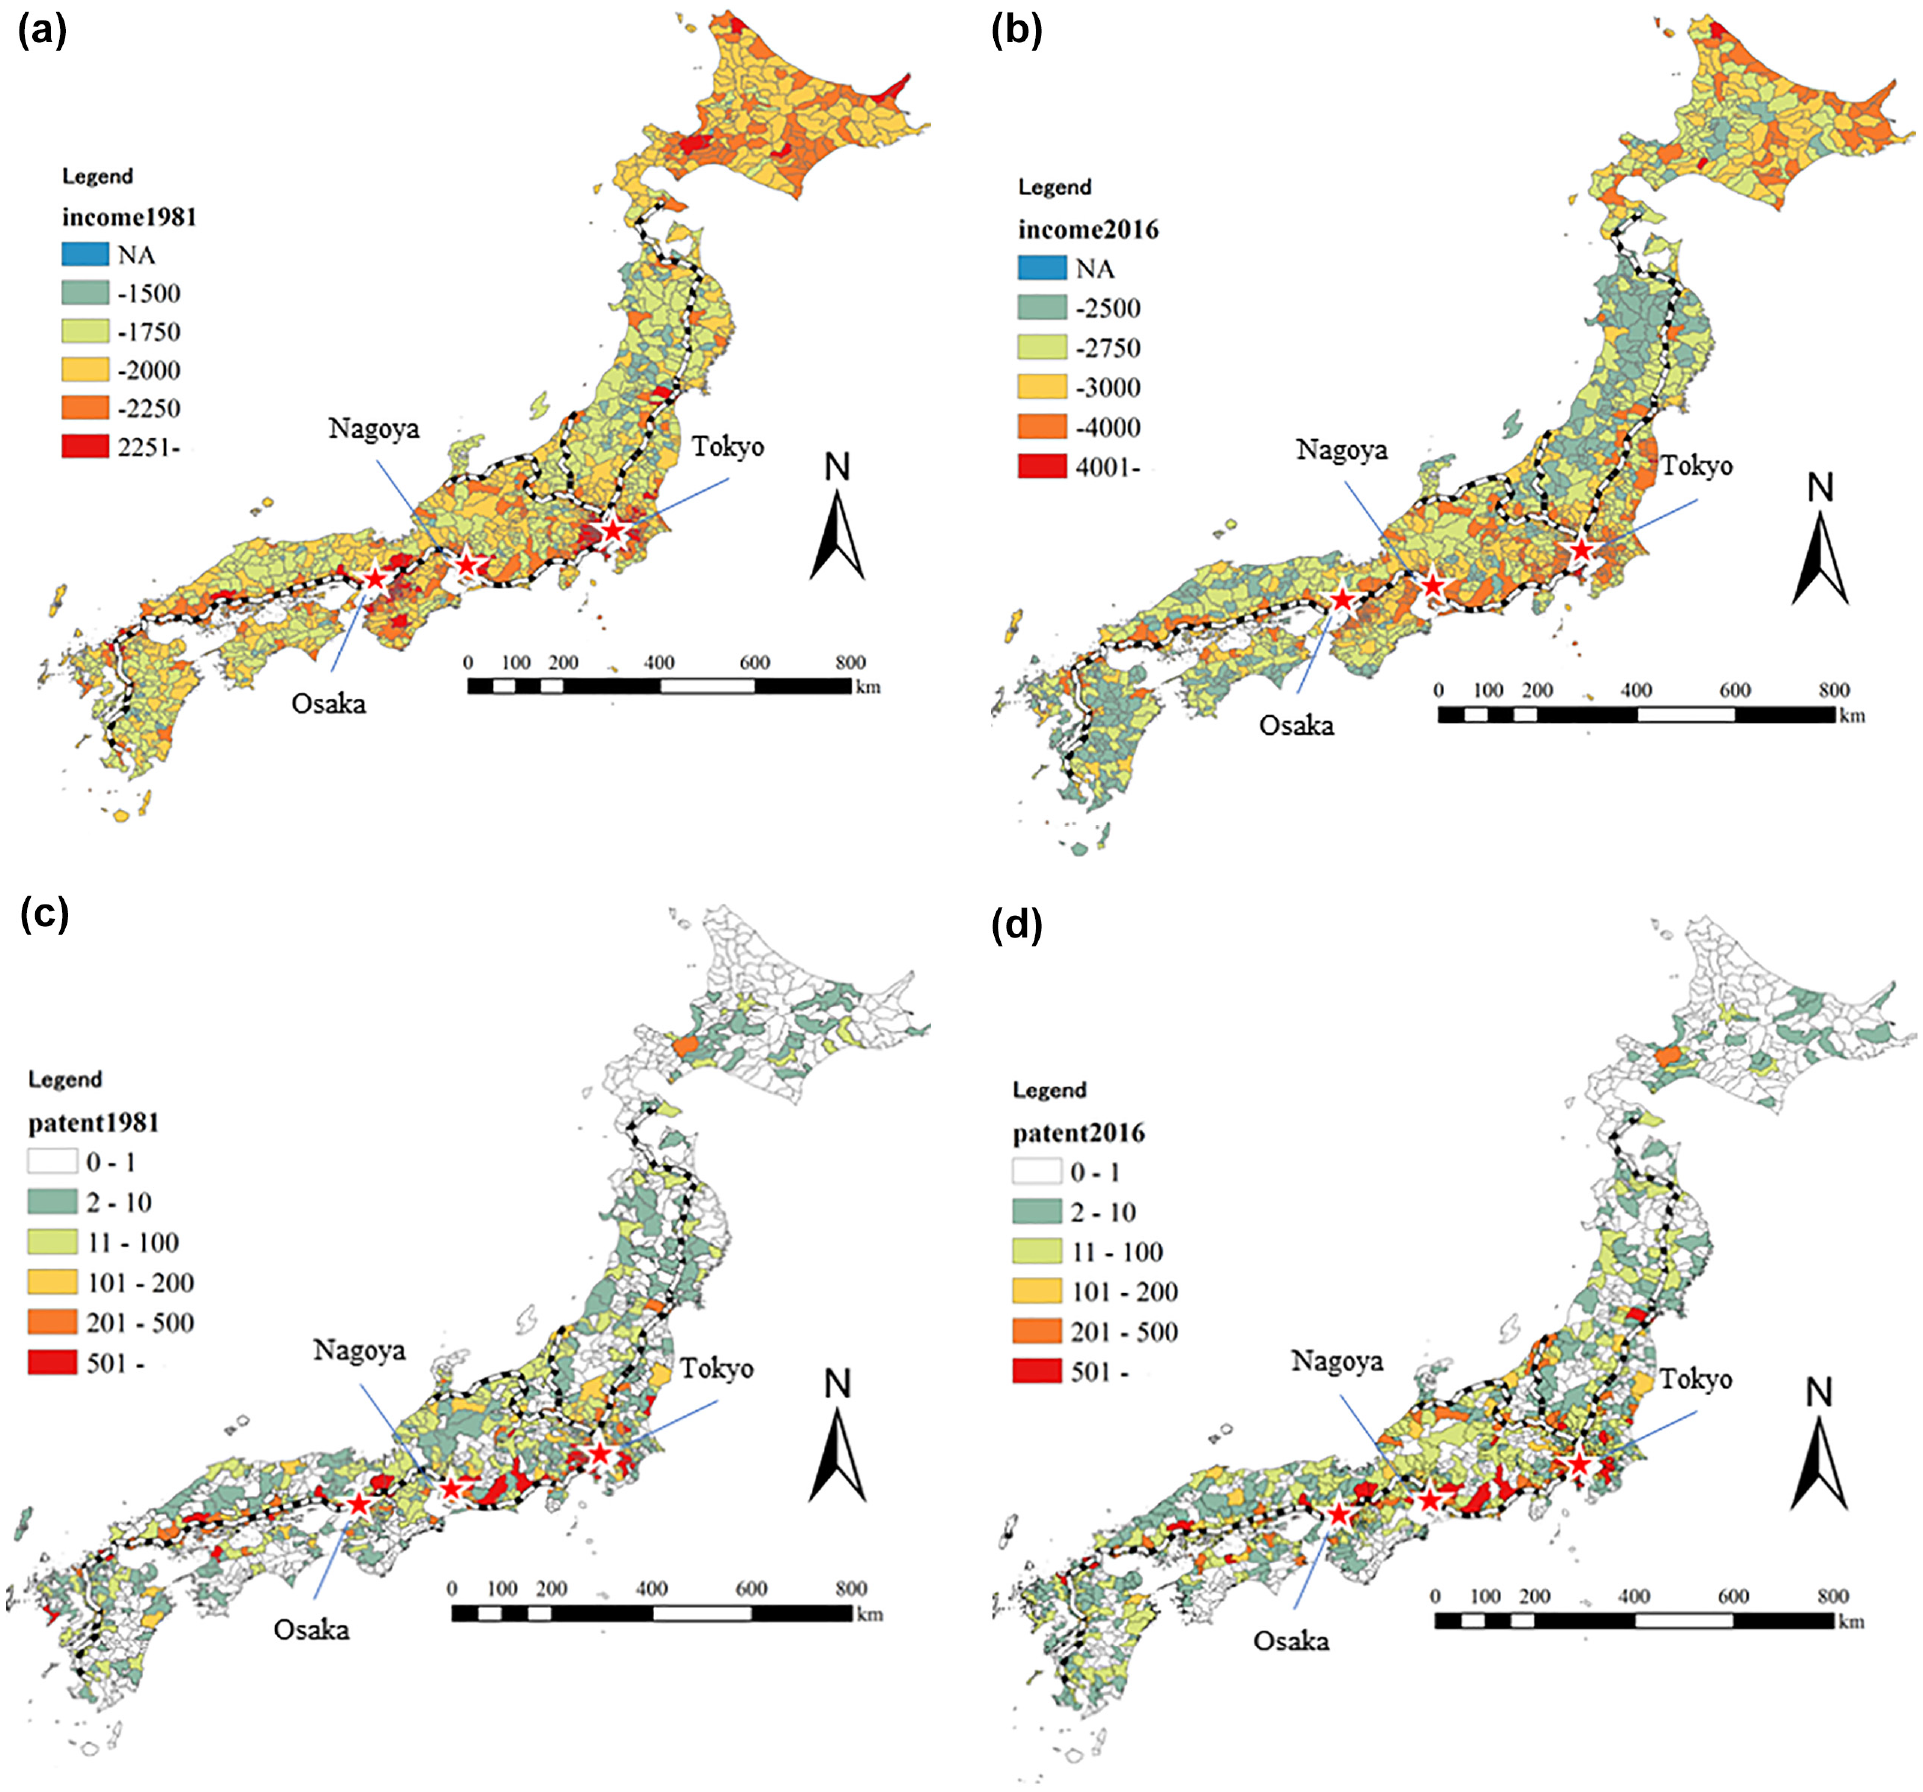
Distributions of income per capita and patents per employee in Japan in 1981 and 2016: (a) income distribution of municipalities in 1981, (b) income distribution of municipalities in 2016, (c) patents distribution of municipalities in 1981, and (d) patents distribution of municipalities in 2016.
Methodology
Model
Travel is a “derived” demand on a microeconomic scale, being the outcome of desires of and activities undertaken by people in origin regions traveling to destination regions. The supply of HSR service, in a theoretical sense, may therefore attract/generate passenger trips between peripheral and core regions because of the saving in generalized travel costs for various travel purposes, such as education, employment, accessing central goods, larger markets, knowledge sharing, and adaption for innovation. This derived demand, although dynamic and complex at the microeconomic level, may affect the economic well-being of regions. It can facilitate opportunities for peripheral regions to interact with larger core regions and vice versa, which subsequently affects the regional economy of peripheries positively. Such an improvement in interregional accessibility through the changes in HSR supply may also allow the residents in the connected regions to find better avenues of learning new skills or being matched with a suitable employer. This can eventually lead to income gains and social welfare for people in peripheral regions and reduce regional income inequalities. Furthermore, in the context of knowledge spillover and regional innovation, it is well accepted that knowledge transfer occurs with the movement of inventors. Therefore, HSR connections between core and peripheral regions, by facilitating improved interregional accessibility, may increase the exposure of human capital in peripheries to the already existing knowledge in core regions and/or allow them to find avenues to develop new knowledge for the local problems that were earlier unattended. In both cases, regional innovation in peripheries may be boosted through the introduction of HSR, which may also lead to long-term economic growth, as per the literature on endogenous growth theories ( 29 , 30 ). This study attempts to observe changes in IN and PA empirically at the macro-level of municipal regions in Japan. This approach is consistent with the traditional production function approach for measuring economic and knowledge productivities in the macroeconomic literature ( 31 – 33 ), where accessibility improvements through transportation infrastructure are a constituent of technological progress of the function, which facilitates smooth interaction among agents in different regions.
A quasi-experimental method of difference-in-differences (DID) is employed to investigate the average treatment effect (ATE) of HSR development on the IN and PA of municipalities with variable treatment timings in Japan. The treatment effect of HSR on peripheries in Japan is particularly analyzed to unveil the impact of HSR development on regional inequalities. The use of experimental approaches in empirical economics has gained popularity as it helps to answer a variety of questions that involve “what-if statements” and are relevant for policy and decision-makers ( 34 , 35 ). These methods are superior in unveiling the impacts and causal relationships of policy shocks/interventions on variables of interest compared with mere identification of correlations through various regression techniques. The identification of the underlying causal relationships is at the heart of the experimental approaches and requires comparison of counterfactual units to unveil the impacts of manipulation/change of a causal variable of interest on a particular outcome. Defining a good counterfactual is, however, the biggest practical challenge in the application of experimental methods. Randomized trials or randomization of treatment assignment to units arguably generate the best counterfactuals for a treatment group, however, their successful application is constrained to only some fields (like medical science) and their use in empirical economics is limited for numerous practical reasons. Therefore, reliance on observational studies and quasi-experimental or natural experimental designs by keeping the objective the same as that of an experimental study has become a popular strategy for studying treatment effects of an intervention. Such settings naturally create randomized treatment assignments from an exogenous change in a policy variable for only some observed units but not all. The quasi-experimental approaches incorporate (a combination of) strategies such as controlling for observable differences between treatment and control groups, regressions, matching techniques, pre–post/before–after comparisons and instrumental variables in the analyses and aim to estimate the ATE. A comparison of the estimates obtained with different identification strategies in a quasi-experimental setup is summarized in the past literature from labor economics, where their application has become a popular method to study important policy questions ( 34 ). The method of DID consists of simple panel-data regressions applied in cases where some groups are exposed to the treatment under study and others are not by research design. The comparison of mean outcomes of these treatment and control groups after controlling for observable differences, under a certain set of assumptions (parallel trends, exogeneity of treatment, etc.) is the fundamental element of DID. The simplicity of interpreting estimation results of ATE and checking of the major underlying assumptions such as assumption of parallel trends are the biggest advantages of using this quasi-experimental technique. In this paper, DID is adopted for multiple treatment timings to study the impact of HSR development on IN and PA of municipalities in Japan. The introduction of HSR is considered an exogenous treatment to some municipalities.
Data for 10 periods from 1976 to 2016, covering most Japanese municipalities, are used for the analysis. Two definitions for categorizing peripheries based on demographic features and accessibility are applied. The former definition, defined by employment density, may be commonly used in the core–periphery context, while the latter is a novel way to define peripheries corresponding to the unique development geography of Japan, where connectivity to large cities has been crucial, as discussed earlier. The accessibility-based categorization of peripheries is based on ED, a measure representing the potential interregional communication opportunities among employees. It is defined as the (minimum) inverse travel time-weighted sum of opportunities for interregional communication among employees ( 36 ) and is expressed as:

where
Two dummy variables,
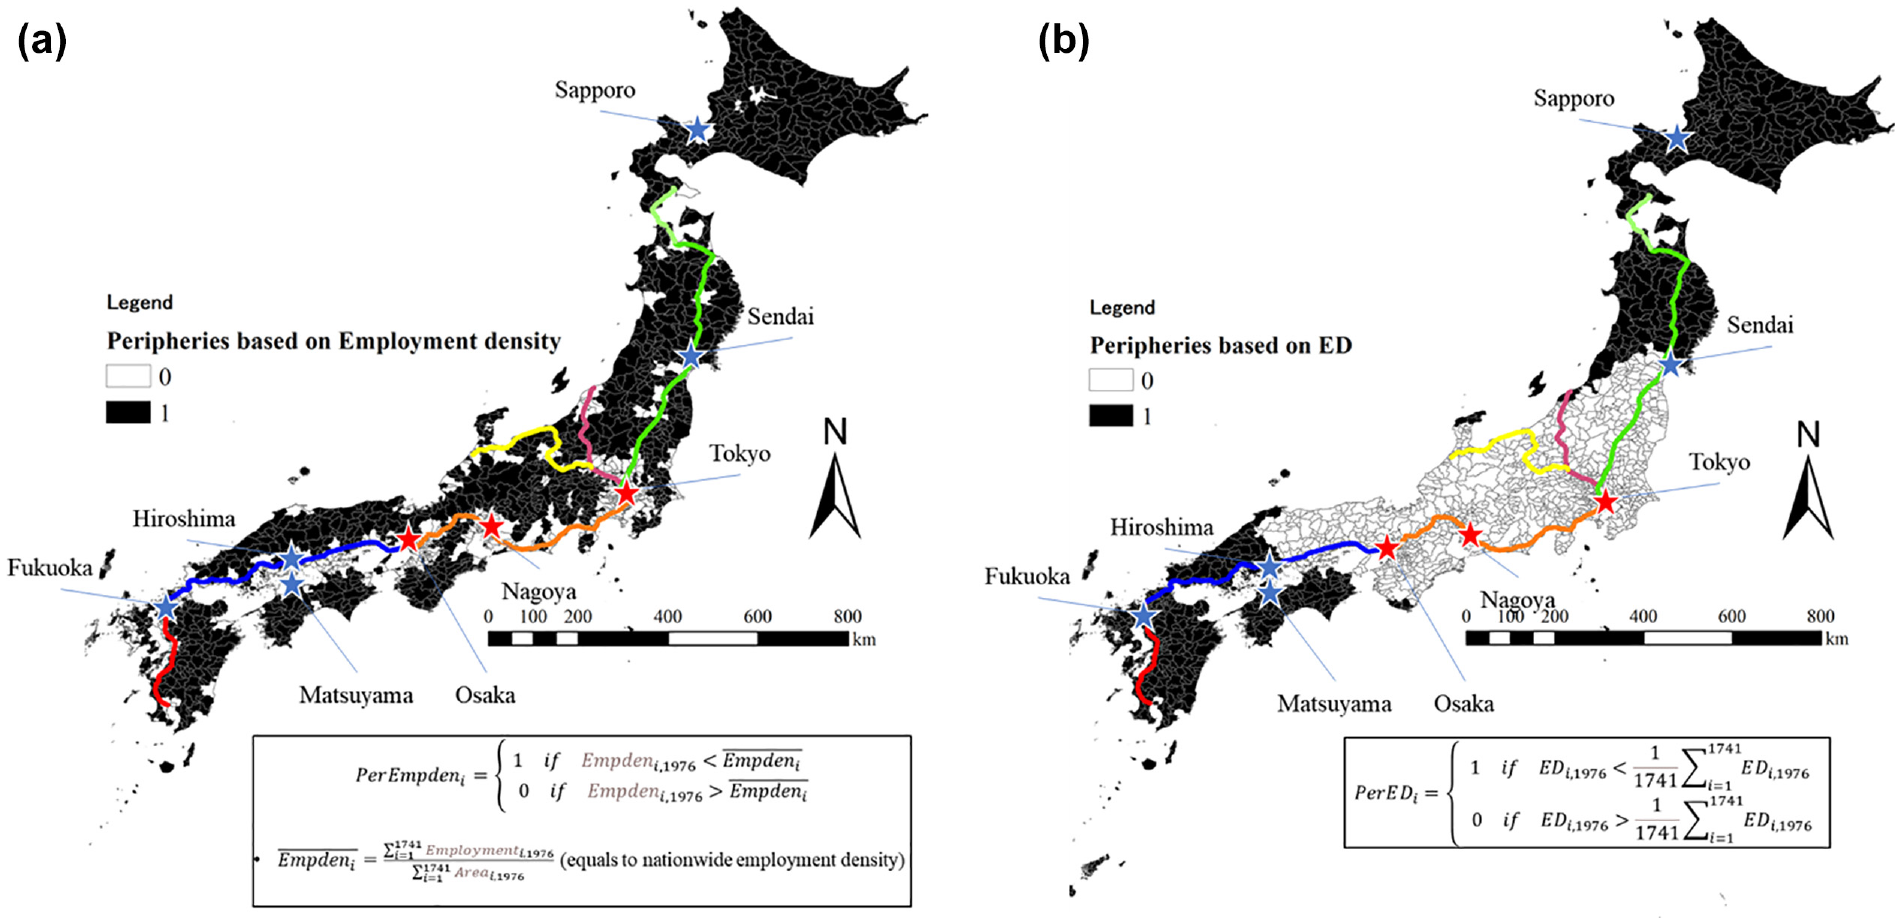
Peripheral regions in Japan based on two definitions: (a) peripheral municipalities based on employment density and (b) peripheral municipalities based on effective density (ED).
The estimation model for IN is given according to a log-linear specification defined as follows:
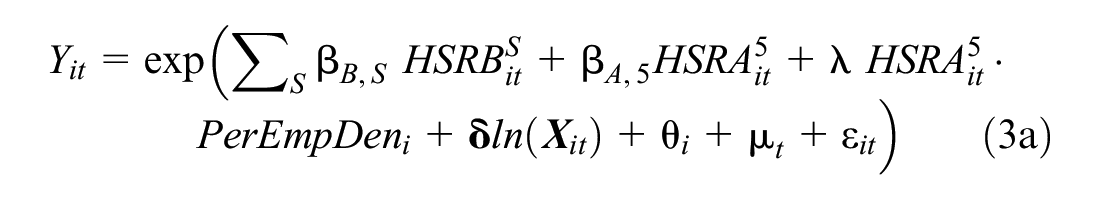
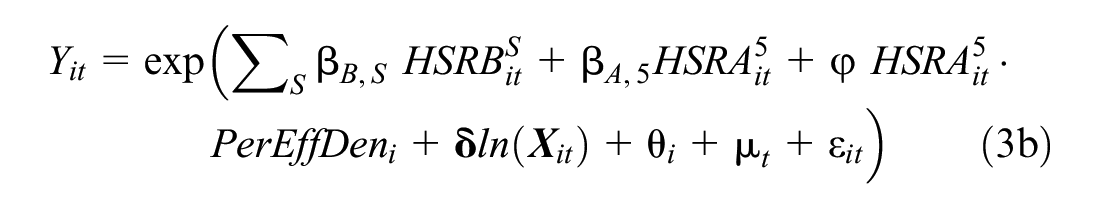
where
Subsequently, for the estimation of PA, this study assumes that the PA data follow a negative binomial distribution (NBD) because of overdispersion and the presence of several zeros. The offset modeling technique is also employed to handle the PA data (which might not always be integers); the population


where
Definitions of Control and Treatment Groups
To conduct the DID analysis, the municipalities in the neighborhood of HSR stations are defined as the treatment group, and the remaining municipalities as the control group. Moreover, this study spans from 1976 to 2016, when the Tohoku, Jo-etsu, Hokuriku, Kyushu, and Hokkaido HSR lines had been introduced. However, as the Hokkaido line and a part of the Hokuriku line opened in 2016 and 2015, respectively, they were excluded from the analysis. The areas along the Tokaido line, where HSR had already been introduced (in 1964) at the beginning of the study period, were classified into the control group, as there had been no change in the treatment status. Three types of definitions in relation to the neighborhood have been applied to understand the effects of distance from the HSR station on treatment effect: (i) municipalities with HSR station (defined as a buffer zone of 0 km), (ii) a buffer zone of 10 km from the HSR station, and (iii) a buffer zone of 20 km from the HSR station. These resulted in treatment groups of 53, 196, and 320 municipalities, respectively. Figure 5 illustrates the geographical locations of the three cases.
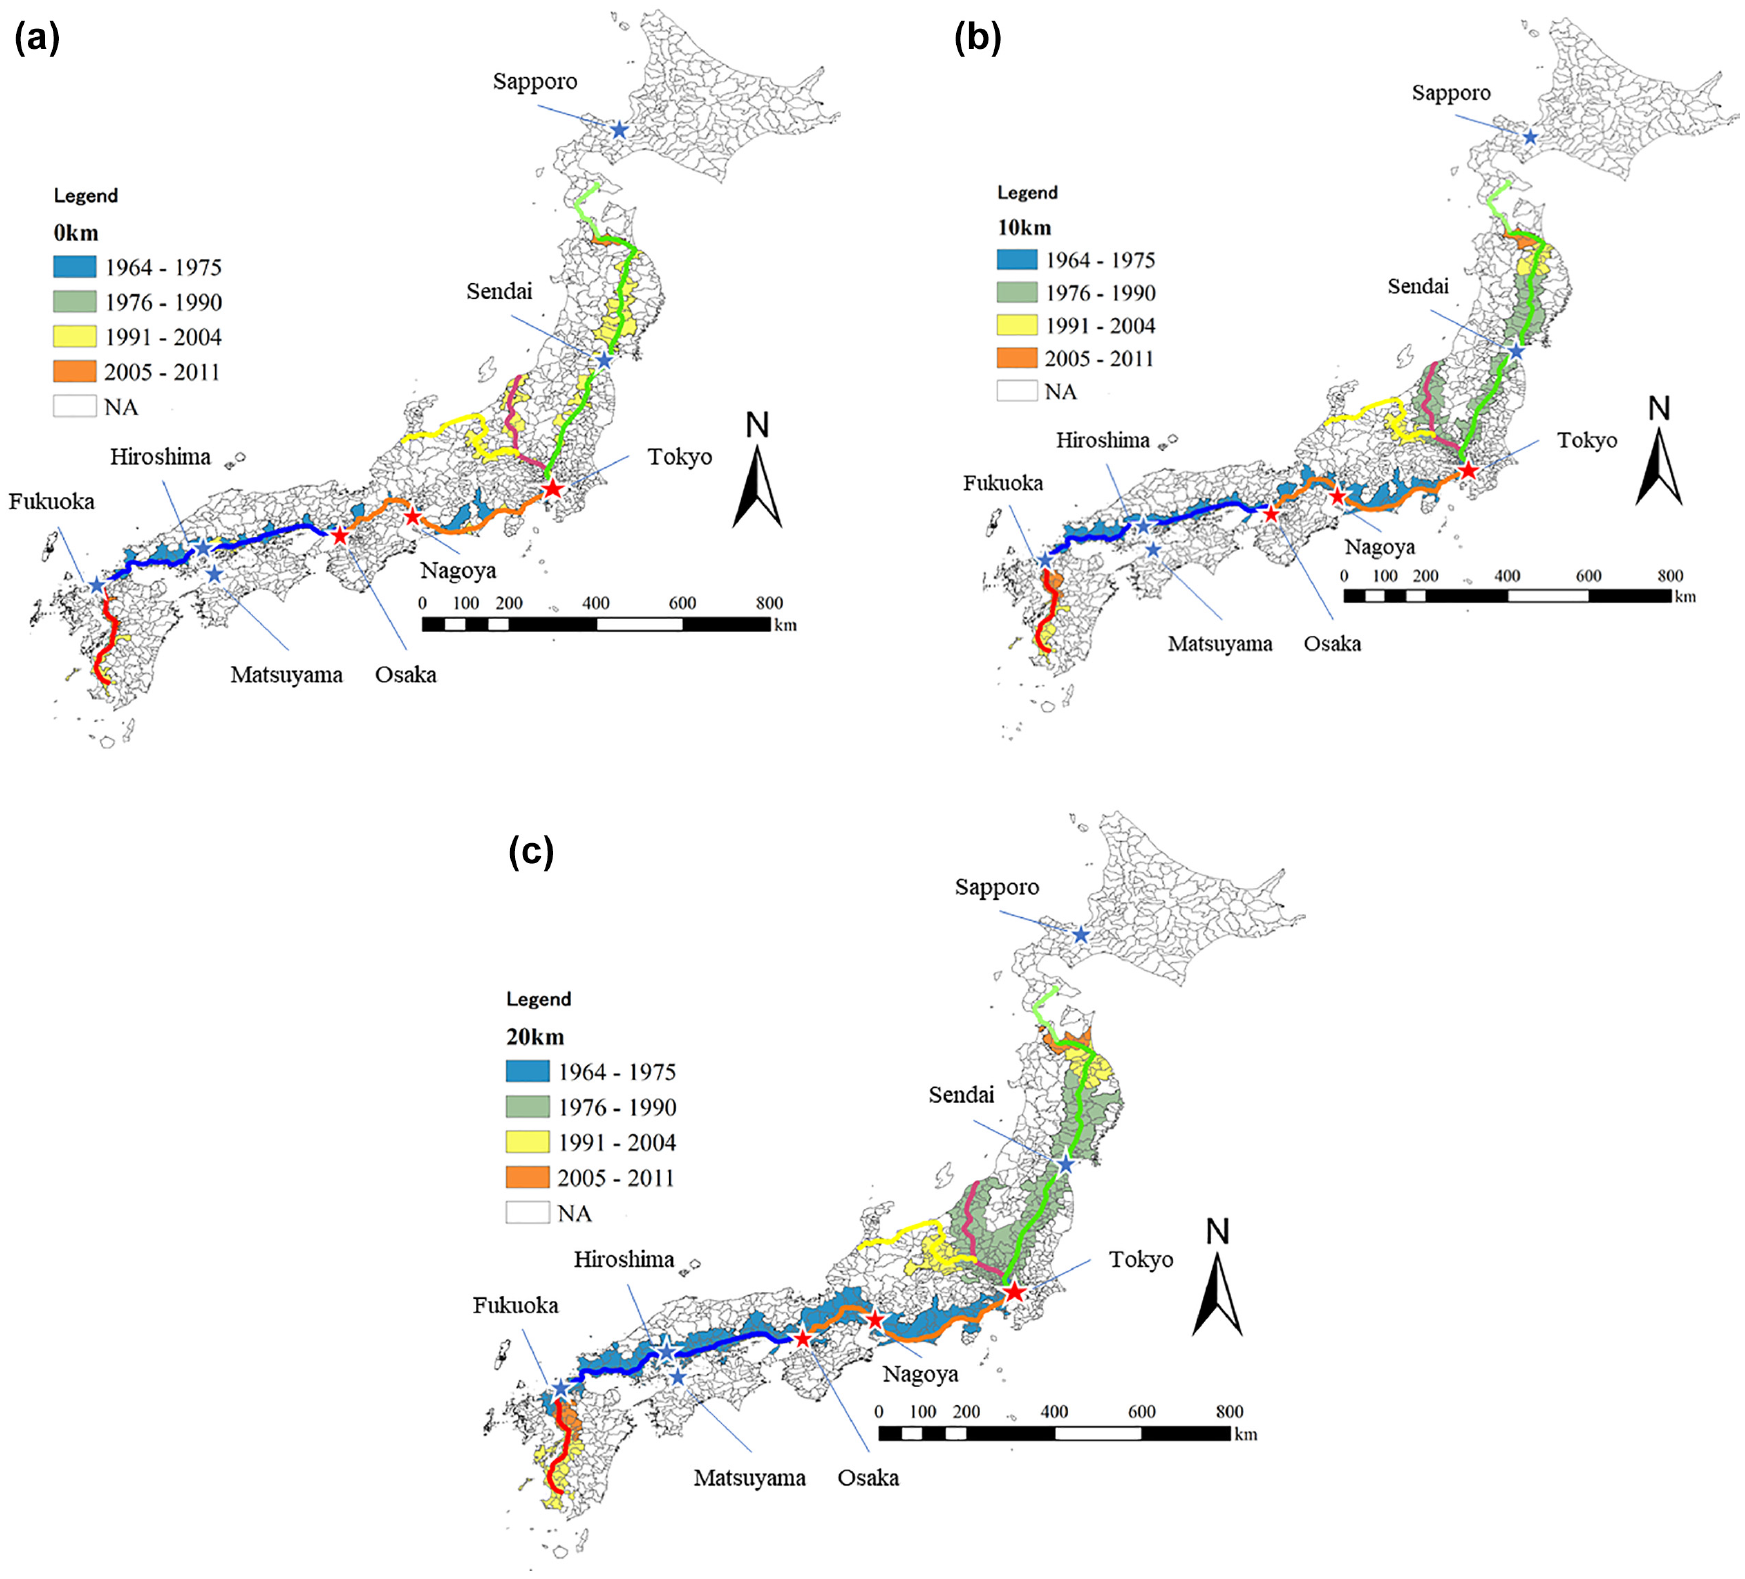
Municipalities in the treatment group based on distance thresholds from high-speed rail stations: (a) within 0 km, (b) within 10 km, and (c) within 20 km.
Data
Data for four categories of socioeconomic, sociodemographic, innovation, and transportation variables were collected. All data were prepared for the 1,741 Japanese municipalities and were aggregated at periods of 1976, 1981, 1986, 1991, 1996, 2001, 2006, 2009, 2012, and 2016. For IN, 1976 was excluded because of data unavailability of covariates. First, the sociodemographic and socioeconomic data of municipalities were collected from various Japanese government websites ( 38 – 40 ). These data aided the calculation of the variable IN. Note that IN data are in real terms (the reference year/place of which is 2015/Tokyo), deflated by the consumer price index of the prefecture to which each municipality belongs. Furthermore, these data were used to introduce control variables that may affect the estimation of both IN and PA. For IN, the rates of elderly population (aged over 65) and employment in tertiary industry were added. To estimate the PA, the innovation data were collected at the municipality level from the Institute of Intellectual Property Patent Database ( 41 ). To track the time and precise locations of innovation, the date of patent application and inventor address information were used. Table 1 summarizes the descriptive statistics of all the variables; IN has a mean value of 2.66, and a standard deviation of 0.76 million JPY/person. The minimum and maximum values are 0.88 and 11.12, respectively. Furthermore, the PA across Japanese municipalities is heavily over-dispersed with a mean and standard deviation of 20.97 and 96.5%, respectively. The minimum and maximum values of PA are 0 and 2448.1, respectively. This highlights the need to address overdispersion while estimating PA in the proposed model; for this reason NBD is suitable. Notably, data for the variables of elderly population rate and employment in the tertiary sector were unavailable before 1981. The number of elderly people was also approximated with the data at the nearest available census year, as it was not directly available for the exact periods in this study.
Descriptive Statistics of the Dataset
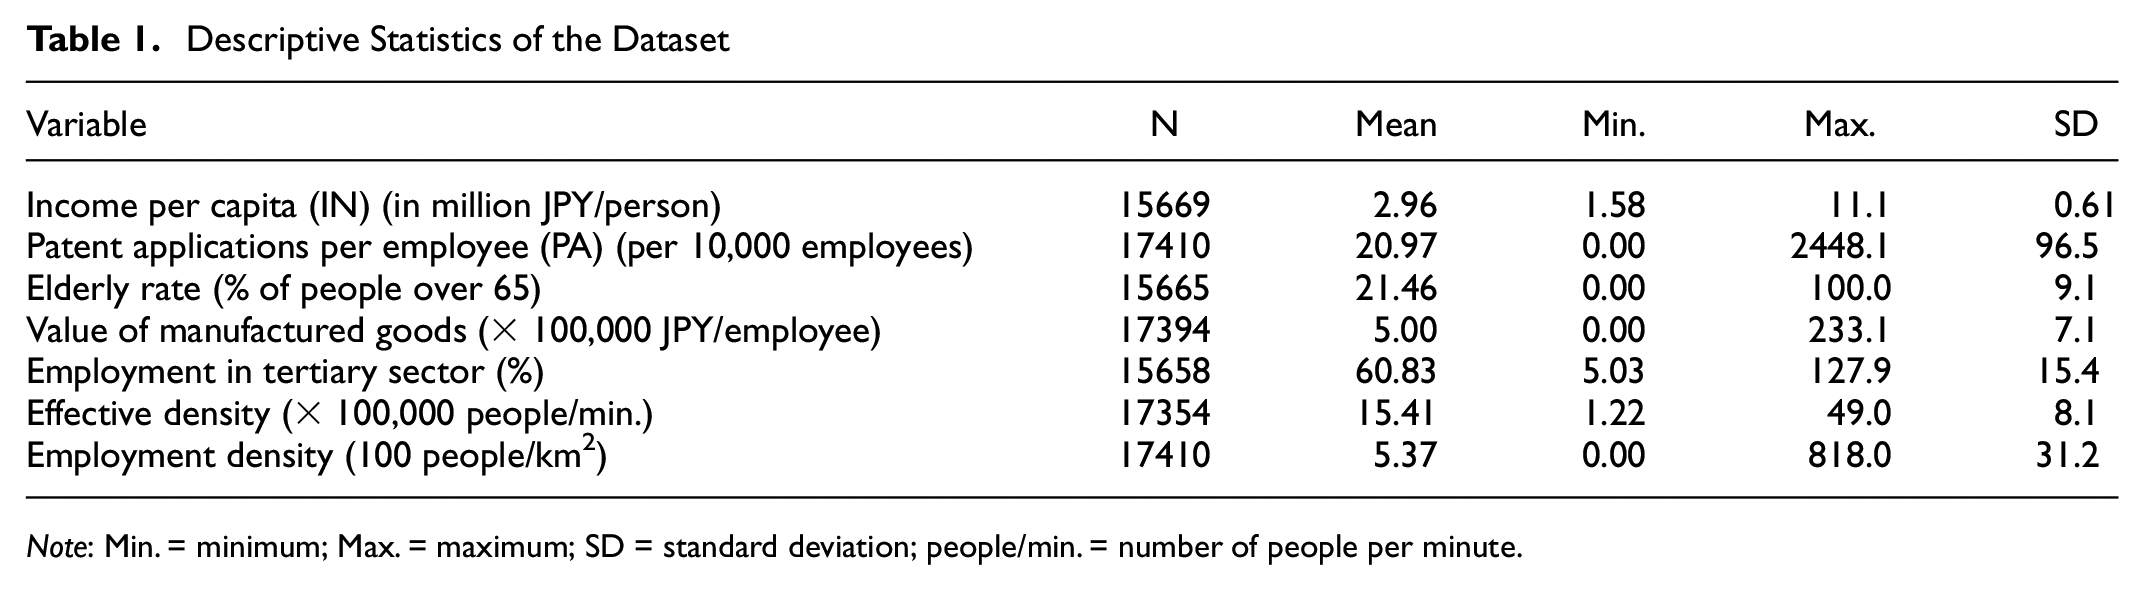
Note: Min. = minimum; Max. = maximum; SD = standard deviation; people/min. = number of people per minute.
Another concern about the data may be whether the municipalities in the control group and peripheral municipalities were sufficiently distinct to ensure that there was no great overlap between the two. Otherwise, the estimations may be biased. Therefore, the correlation between the peripheral municipalities and control group municipalities was calculated. The results show low phi-coefficients (0.02 for the employment-density-based definition and 0.05 for accessibility-based definition in the 10 km case, for instance), suggesting that the two groups are adequately distinct.
To verify that the specification is appropriate, a unit root test ( 42 ) was conducted to check if the relationship is not spurious. The results of the unit root test show that the null hypothesis that “there are unit roots in our dataset” can be rejected at significant levels of confidence. Therefore, it was ascertained that there were no unit roots in any of the variables used in the present study. Additionally, the Breusch-Pagan Lagrange multiplier test ( 43 ) and Hausman test ( 44 ) were applied to compare whether fixed effects, random effects, or ordinary least squares (OLS) should be adopted. For the case of modeling variable IN, as per Equation 3, the null hypotheses that “the use of OLS is better” and “the use of random effects technique is better” is rejected in both tests, implying that the use of fixed effect techniques is the most suitable for modeling IN. To model the variable PA as per Equation 4, despite similar attempts, its nonlinearity has restricted this study to conducting the Breusch-Pagan and Hausman tests. Therefore, the fixed effects technique, similar to that of the IN models, is arbitrarily applied.
Results
Verification of Parallel Trend Assumption of DID Method
As the DID method assumes a parallel trend for the outcome variable between the treatment and control groups, its validity should be examined. This is done in two ways in this study. First, the average trends for both IN and PA are visualized for control and treatment groups along the HSR corridors introduced in 1982 (Jo-etsu and Tohoku lines), as shown in Figures 6 and 7, respectively. Figure 6 shows that the average IN levels for both groups are almost parallel, which suggests preliminary evidence for the validity of the parallel trend assumption for IN. Meanwhile, Figure 7 may not show a clear verification of the average PA levels being parallel between groups, possibly because of the heterogeneities in PA levels between the analyzed municipalities. Consequently, a second method is adopted to check the parallel trends for both the IN and PA cases. This is done by analyzing the estimated coefficients for the dummies,
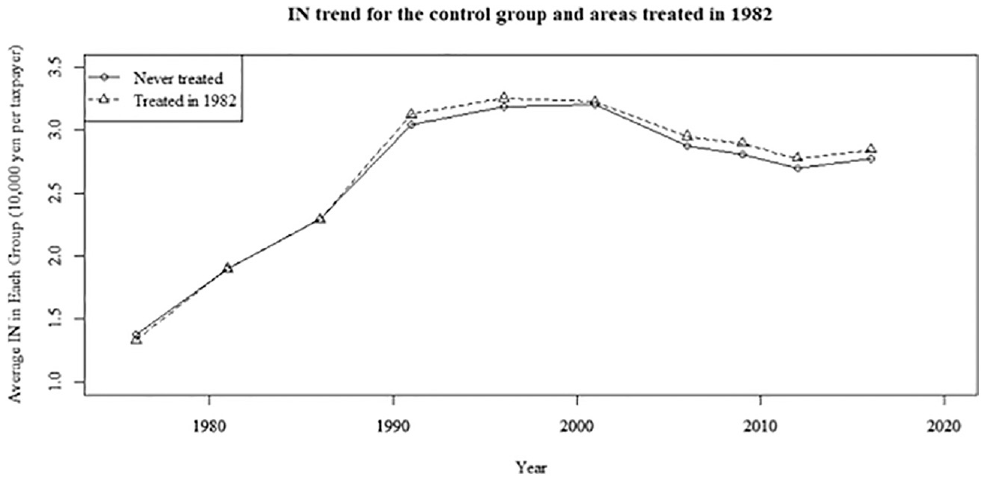
Trend of average income per capita for the treatment and control groups from 1976 to 2016.
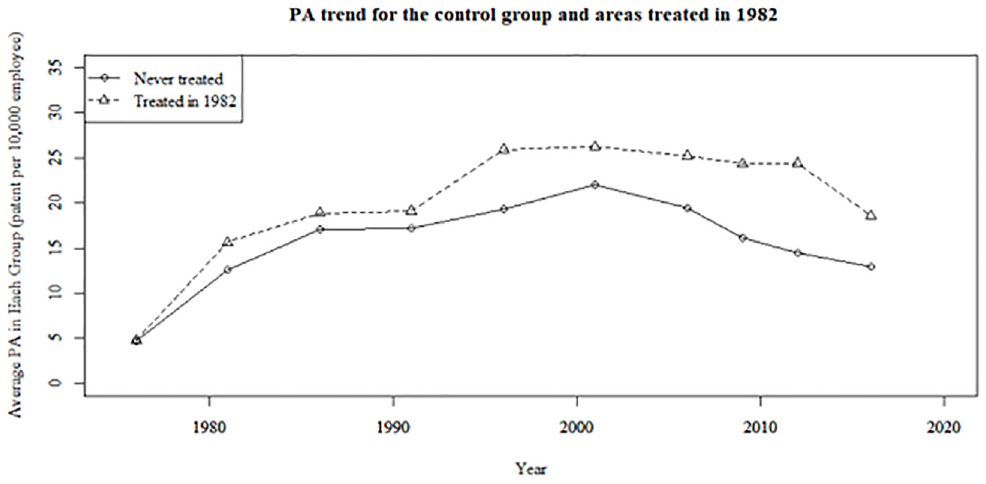
Trend of patent applications per employee for the treatment and control groups from 1976 to 2016.
Following Equations 3 and 4, the DID analyses are performed. Three models are estimated for both IN and PA to study the ATE of HSR introduction. Tables 2 to 5 show these estimation results, wherein Models 1-1 to 1-3 are estimated for IN and Models 2-1 to 2-3 for PA. Models 1-1 and 2-1 estimate the baseline cases without introducing dummies for the periphery. Models 1-2 and 2-2 introduce the dummy variables for peripheries based on employment density while Models 1-3 and 2-3 introduce those based on accessibility. The statistical significance levels of these
Results of Difference-in-Differences Analysis for Impact of High-Speed Rail on Income per Capita

Note: All regressions control for employment density, production per employee in manufacturing industry, elderly population rate, employment in the tertiary sector, and existence of expressways, which is another interregional transportation infrastructure that may stimulate growth. The expressway dummy is defined as 1 if a municipality is located in the neighborhood (10 km buffer zone from the nearest interchange of an expressway) of an expressway, otherwise 0. An additional dummy for Hokkaido is introduced to account for its unique characteristics, as pointed out earlier. This region, despite its low density, is observed to have high income and low innovation levels, which can potentially lead to biases if not accounted for. The variables employment density, elderly population rate, and employment in the tertiary sector are statistically significant for estimating income per capita (IN). Among these control variables, the elderly population rate has a negative association with IN, which is likely. The variable value of manufactured goods is found to have a weakly positive association with IN, which is typically not expected. This may be because of the inclusion of municipalities in some large regions that are dominated by the non-manufacturing characteristics of its industry. Coeff. = coefficient; SE = clustered standard errors (clustered by municipality); na = not applicable..
Significance codes: ***p < 0.001; **p < 0.01; *p < 0.05; p < 0.1.
Results of Difference-in-Differences Analysis for Impact of High-Speed Rail on Income per Capita (continued)

Note: All regressions control for employment density, production per employee in manufacturing industry, elderly population rate, employment in the tertiary sector, and existence of expressways, which is another interregional transportation infrastructure that may stimulate growth. The expressway dummy is defined as 1 if a municipality is located in the neighborhood (10 km buffer zone from the nearest interchange of an expressway) of an expressway, otherwise 0. An additional dummy for Hokkaido is introduced to account for its unique characteristics, as pointed out earlier. This region, despite its low density, is observed to have high income and low innovation levels, which can potentially lead to biases if not accounted for. The variables employment density, elderly population rate, and employment in the tertiary sector are statistically significant for estimating income per capita (IN). Among these control variables, the elderly population rate has a negative association with IN, which is likely. The variable value of manufactured goods is found to have a weakly positive association with IN, which is typically not expected. This may be because of the inclusion of municipalities in some large regions that are dominated by the non-manufacturing characteristics of its industry. Coeff. = coefficient; SE = clustered standard errors (clustered by municipality); na = not applicable.
Significance codes: ***p < 0.001; **p < 0.01; *p < 0.05; p < 0.1.
Results of Difference-in-Differences Analysis for Impact of High-Speed Rail on Patent Applications per Employee
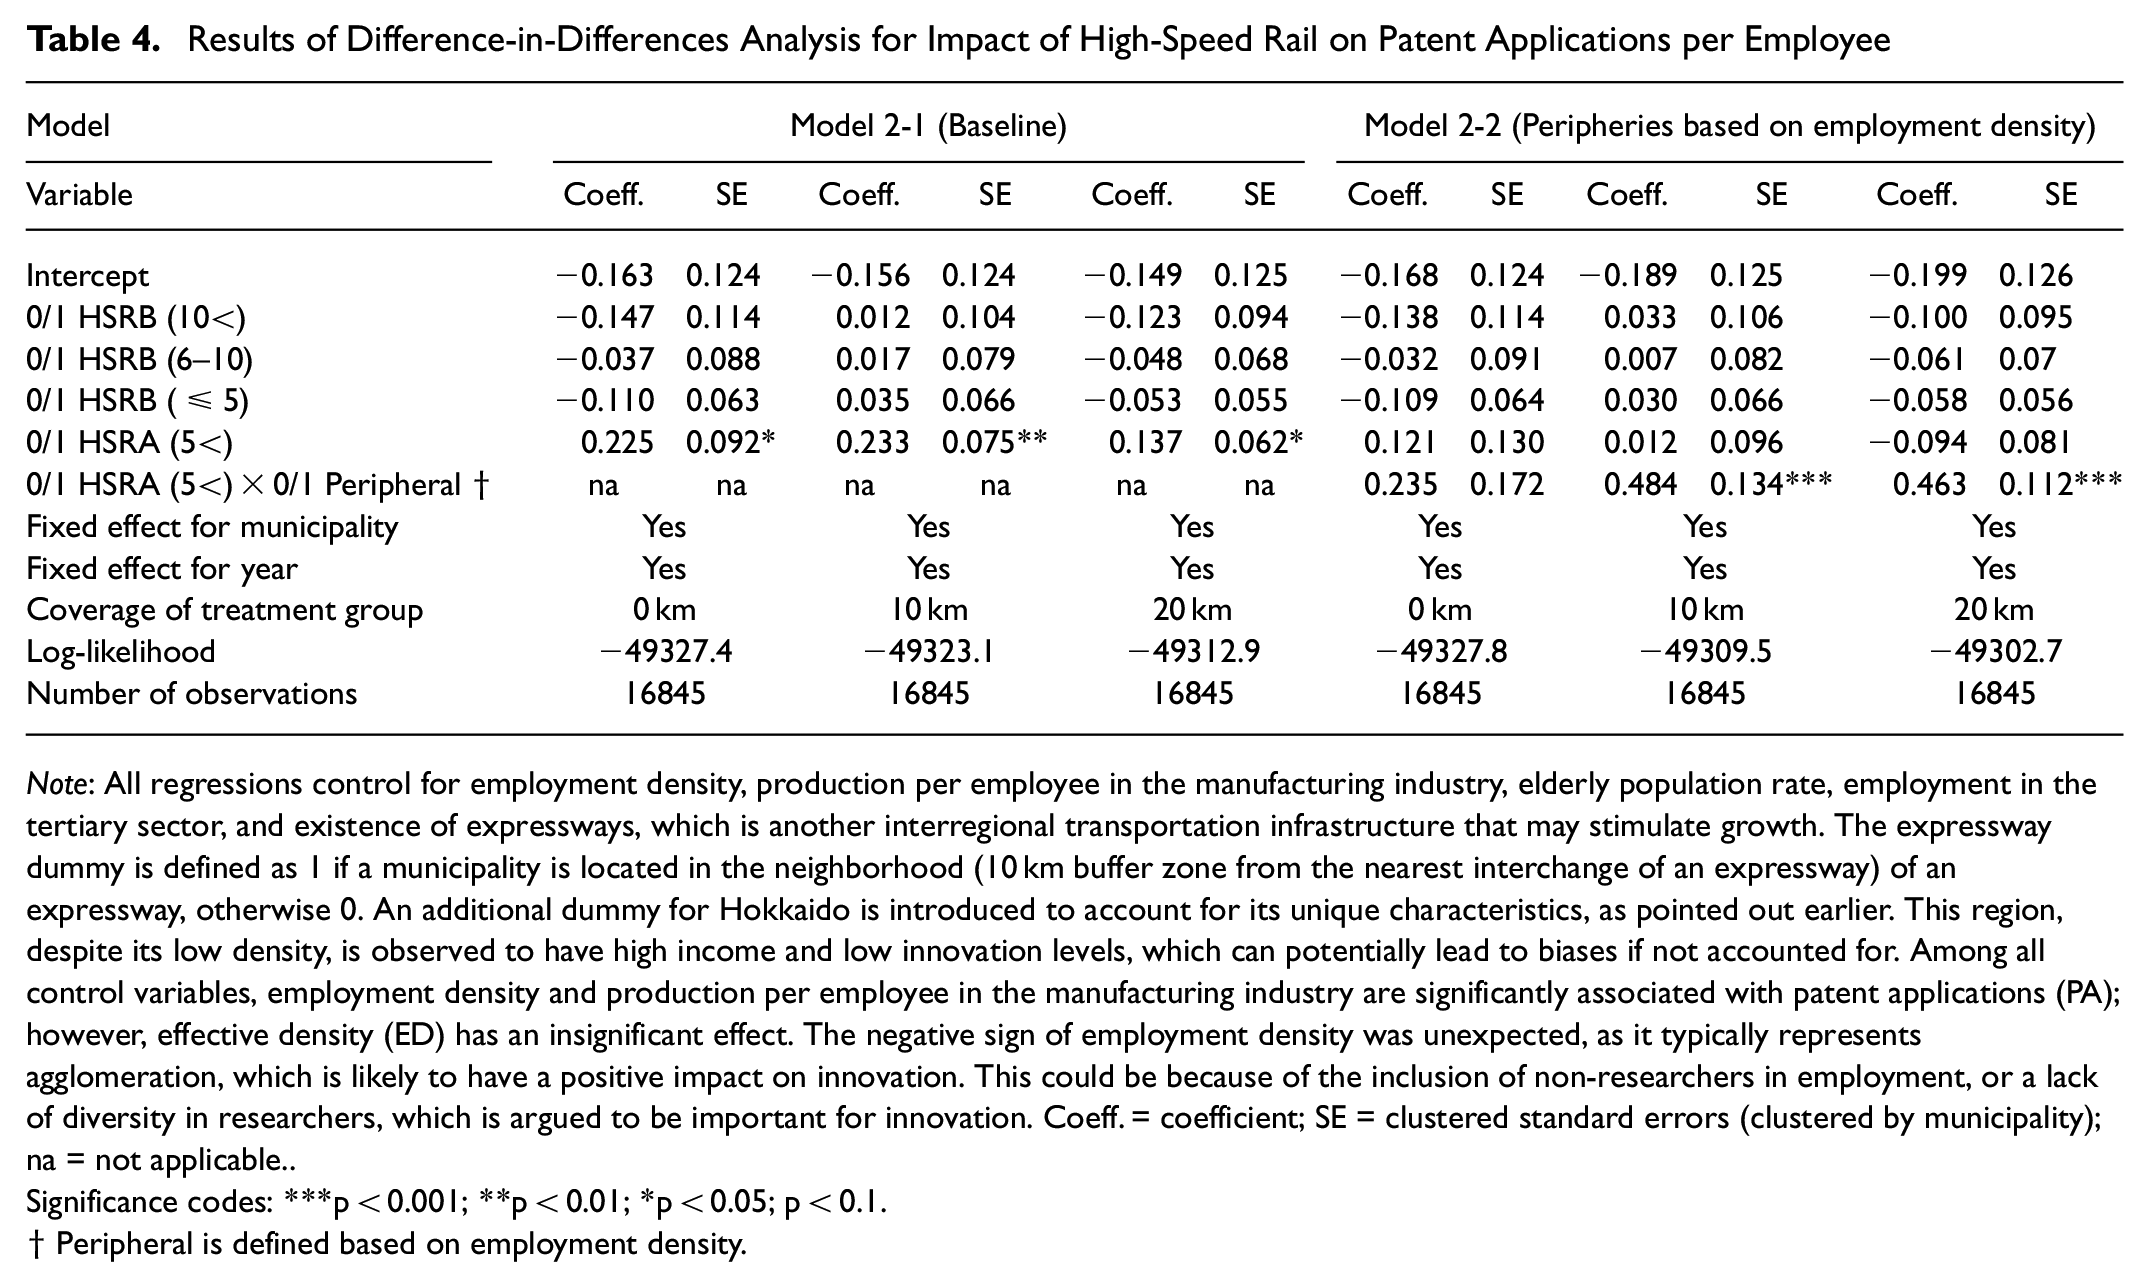
Note: All regressions control for employment density, production per employee in the manufacturing industry, elderly population rate, employment in the tertiary sector, and existence of expressways, which is another interregional transportation infrastructure that may stimulate growth. The expressway dummy is defined as 1 if a municipality is located in the neighborhood (10 km buffer zone from the nearest interchange of an expressway) of an expressway, otherwise 0. An additional dummy for Hokkaido is introduced to account for its unique characteristics, as pointed out earlier. This region, despite its low density, is observed to have high income and low innovation levels, which can potentially lead to biases if not accounted for. Among all control variables, employment density and production per employee in the manufacturing industry are significantly associated with patent applications (PA); however, effective density (ED) has an insignificant effect. The negative sign of employment density was unexpected, as it typically represents agglomeration, which is likely to have a positive impact on innovation. This could be because of the inclusion of non-researchers in employment, or a lack of diversity in researchers, which is argued to be important for innovation. Coeff. = coefficient; SE = clustered standard errors (clustered by municipality); na = not applicable..
Significance codes: ***p < 0.001; **p < 0.01; *p < 0.05; p < 0.1.
Results of Difference-in-Differences Analysis for Impact of High-Speed Rail on Patent Applications per Employee (continued)
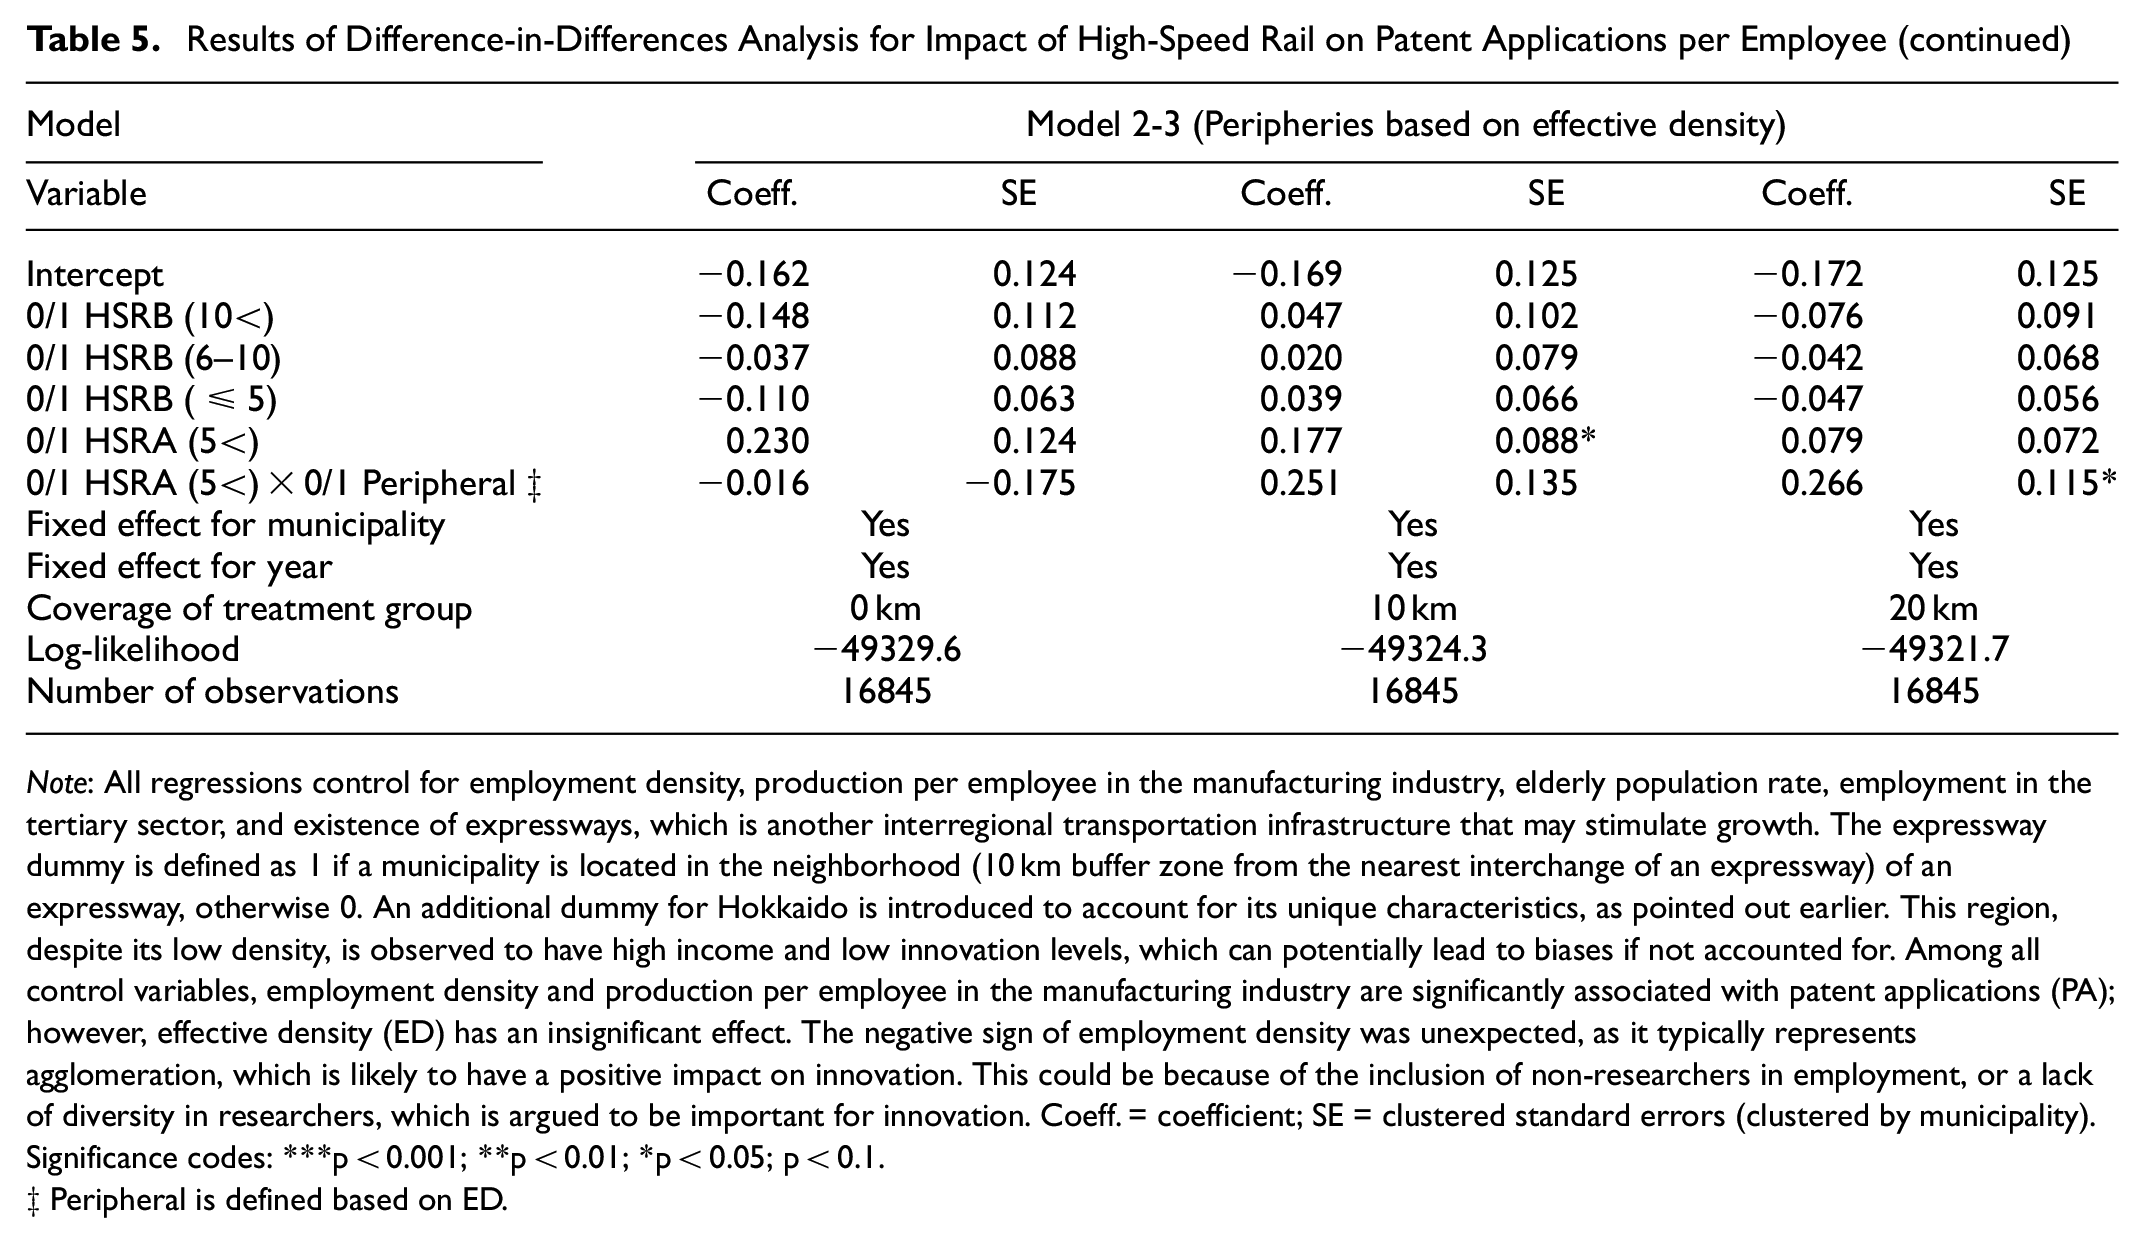
Note: All regressions control for employment density, production per employee in the manufacturing industry, elderly population rate, employment in the tertiary sector, and existence of expressways, which is another interregional transportation infrastructure that may stimulate growth. The expressway dummy is defined as 1 if a municipality is located in the neighborhood (10 km buffer zone from the nearest interchange of an expressway) of an expressway, otherwise 0. An additional dummy for Hokkaido is introduced to account for its unique characteristics, as pointed out earlier. This region, despite its low density, is observed to have high income and low innovation levels, which can potentially lead to biases if not accounted for. Among all control variables, employment density and production per employee in the manufacturing industry are significantly associated with patent applications (PA); however, effective density (ED) has an insignificant effect. The negative sign of employment density was unexpected, as it typically represents agglomeration, which is likely to have a positive impact on innovation. This could be because of the inclusion of non-researchers in employment, or a lack of diversity in researchers, which is argued to be important for innovation. Coeff. = coefficient; SE = clustered standard errors (clustered by municipality).
Significance codes: ***p < 0.001; **p < 0.01; *p < 0.05; p < 0.1.
Impacts of Introduction of HSR on IN
First, the baseline results in Model 1-1 (Table 2) indicate that the ATE of HSR introduction on IN, represented by the coefficients of
Overall, these results suggest that the impact of HSR introduction on the IN of peripheral municipalities can be variable (yet positive in most cases) depending on the definition of peripheries. The IN of accessibility-based peripheries may be less affected by HSR introduction than their core counterparts. Meanwhile, the IN of employment density-based peripheries is found to be more affected than the corresponding core municipalities.
Impacts of HSR Introduction on PA
Tables 4 and 5 show that the ATE of HSR introduction on PA, represented by the coefficients of
The above-mentioned results suggest that HSR development is likely to affect PA in cores and peripheries positively, thereby contributing to the mitigation of regional inequalities in relation to innovation. The same results are consistently found in both definitions of peripheries. These positive impacts on PA in both definitions of peripheries imply that HSR introduction stimulates knowledge spillover in peripheries, leading to increased innovation.
Check for Causal Relationship Between HSR, IN, and PA
Although the quasi-experimental method of DID is widely applied in the recent literature in economics to infer causal relationships, it is considered insufficient in many contexts for defining causality. There may be a need to apply additional checks to test whether the aforementioned results of HSR introduction on IN and PA of various regions imply any causal relationship or are merely associations. For this reason, checks for causal relationship between the three variables of HSR introduction, IN, and PA were performed following the DID version of Granger causality tests (
35
,
45
,
46
). These tests incorporate several lagged and lead terms instead of the simple treatment effect terms,
Discussion
The results of the first analysis suggest that HSR introduction has contributed to the mitigation of overall regional economic inequalities in Japan; however, it has widened the income gap between poorly accessible peripheries and cores. This impact might also be understood as the supporting role of HSR in realizing/executing several other government policies in CNDPs, NSSs, and regional plans that targeted balanced growth throughout Japan. Some examples of such policies are the growth pole strategy, strengthening of “hub-satellite relationship” between cities, industrial cluster policy, and various provisions for firms and human capital to gain financial benefits in rural areas (e.g., subsidization, preferential treatment in financial services, tax breaks, etc.). Additionally, with the planned depopulation of large cities in the Tokyo-Nagoya-Osaka corridor, the existence of HSR might have led to the relocation of some firms to (or opening of their branches in) municipalities that are outside this corridor. This would have enabled them to enjoy the benefits of industrial relocation policies in CNDPs, while remaining well connected to large cities along the Tokyo-Nagoya-Osaka corridor. Lastly, the smaller impacts on IN in accessibility-based peripheries may be interpreted based on their biased industrial characteristics or dependence on primary industries, which make these locations relatively less attractive for human capital and firms.
The results of the second analysis suggest that HSR has led to an increase in knowledge spillovers to peripheries, thereby contributing to the mitigation of inequalities in relation to innovation. This may be understood as the support that HSR introduction may provide to other government policies in spatial planning, such as the formulation of “technopolis” and “intelligent locations,” which promote university-industry collaborations, and the creation of research parks in rural regions to decentralize the research activities, and so forth. This evidence in relation to the enhancement of the PA of peripheries might also reflect their potential to innovate and suggest that the peripheries need not be considered as the antonym of cores, as suggested in the literature ( 47 ). Such knowledge spillover potential may be the outcome of labor migration to agglomerated regions that originally belonged to these peripheries. They might continue to return to these peripheries frequently because of the development of HSR, thereby leading them to transfer the knowledge they gained in cores and the consequent increase in knowledge spillovers of these peripheries.
The results of the Granger causality test may imply that the findings of this study on the estimated impacts of HSR introduction are causal in nature for the case of PA in Japanese municipalities; however, they should be interpreted as mere associations for the case of IN in Japanese municipalities. Further investigation may be necessary to determine the causality from introduction HSR in relation to IN. However, it is noteworthy that in the case of the latter test for IN, the coefficients of lagged terms representing larger lags (i.e., more than 20 years) were found to be positive and statistically significant. Therefore, it may be possible that the impacts of HSR introduction on IN may be realized in a longer term, and indirectly the coefficients of lagged terms representing larger lags (i.e., more than 20 years) were found to be positive and statistically significant. Therefore, it may be possible that the impacts of HSR introduction on IN may be realized in a longer term and indirectly through the development of other phenomena, including regional innovation, which is represented by PA in this study.
Considering the lesser impacts on IN in poorly accessible municipalities, as found in the first analysis, however, it may be interpreted that the agglomerated character of Japan remains prevalent and may be a result of policies that harness this character, especially in the Greater Tokyo region, as adopted since its fourth CNDP. Moreover, another potential explanation of the lesser impact found on accessibility-based peripheries may be the poor effectiveness of several spatial planning policies ( 48 ), which have only attracted low-productivity firms to the target locations. This, when complemented with the remoteness of the regions, could inhibit the access to large markets that would increase returns for firms. This further suggests the need for poorly accessible peripheries to be better integrated into the nation’s industrial and innovation policy framework to mitigate their struggle to catch up with economic growth. In such a context, accessibility to larger hub regions may be crucial for peripheries to experience a balanced level of economic growth.
Finally, in relation to the definition of peripheries, this study reveals that peripheries defined with traditional demographic indicators have different results from those defined with accessibility, notably in relation to IN. This reflects the insufficiency of traditional demographic-based definitions of peripheries and highlights an additional dimension of accessibility, which has been overlooked in the past but may play a crucial role in contexts where the concentration in a limited number of large cities has been historically high or increasing, as in the case of Japan. Examples of such countries may include Brazil, Indonesia, Italy, Mexico, Sweden, and Thailand, such that because of the geographically stretched/elongated shape or the increasing ratio of urban population to total population, accessibility to major hub cities would be critical for a balanced regional economy.
Conclusion
This paper presents comprehensive evidence of the impacts of HSR development on regional income and innovation in peripheral regions in Japan. These findings suggest that the introduction of HSR has contributed to the reduction of IN and PA inequalities. However, the poorly accessible peripheries might have struggled to catch up with the core regions with better accessibility, particularly in relation to economic development. In relation to innovation, HSR introduction has supported the growth of innovation through knowledge spillovers, especially in peripheral municipalities. This paper’s contribution to the literature is to unveil the accessibility dimension of peripheries, which has been overlooked in typical demographic-based peripheral definitions. It illustrates a comparison of these two definitions of peripheries through the analysis and presents important evidence on the impact of introduction of HSR on both types of peripheries. Such a comparison reveals the need for better accessibility for peripheries to experience good levels of economic growth.
Finally, this study has some limitations. First, the simultaneity between IN and PA could not be well accounted for in the estimations, although endogeneity is highly expected. Second, the theoretical relationships between HSR development, IN, and PA may need further investigation to unveil the underlying microeconomic mechanisms. With the lack of a theoretical relationship between these variables there may exist concerns of possible oscillations in the empirical results that are found. This remains an agenda for future research. Furthermore, developments in other transport modes (air, roads, conventional rails, etc.) and communications (e.g., teleconferencing, information technologies, etc.) might also require detailed investigation in relation to their impacts on IN and PA. The one-way causality between HSR development and IN may require further careful investigation, as this could not be concluded in this study. Thus, PA, as an indicator of innovation, might not be perfect for representing innovation in peripheries, as these regions might consist of large amounts of small and medium enterprises (SMEs), for which patenting could be costly and unrewarding. Such SMEs in peripheral regions might innovate in ways other than patents; however, owing to the limitations of availability of data for other indicators, this could not be accounted for. Next, from a methodological perspective, the definition of ED is based only on road networks and may be extended to capture the effects of other forms of transportation enhancements. Furthermore, while calculating ED, because of the computational limitations, the number of O-D pairs used for calculating minimum travel times was limited to 1,741 municipalities (as origins), 46 prefectures (as destination), and 10 time periods. However, ideally, the O-D matrix size should be 1,741 municipalities (as origins), 1,740 municipalities (as destinations), and 10 periods to maintain uniformity in the aggregation scale. As the estimation of minimum travel times for such large O-D pairs was not possible within the available computational facilities and time period of this study, its size was reduced by using prefectures in Japan as destinations. Moreover, although the authors have attempted to discuss the difference in impacts for various treatment buffer zones (defined by the distance from the new HSR stations), the results were not interpretable, so additional investigation would be required. Lastly, the mechanisms through which the studied impact may be experienced have not been investigated. Addressing these issues will be considered in the future scope of this study.
Footnotes
Author Contributions
The authors confirm contributions to the paper as follows: study conception and design: N. Miwa, A. Bhatt; data collection: N. Miwa; analysis and interpretation of results: N. Miwa, A. Bhatt, H. Kato; draft manuscript preparation: A. Bhatt, H. Kato. All authors reviewed the results and approved the final version of the manuscript.
Declaration of Conflicting Interests
The author(s) declared no potential conflicts of interest with respect to the research, authorship, and/or publication of this article.
Funding
The author(s) disclosed receipt of the following financial support for the research, authorship, and/or publication of this article: This work was supported by the Japan Society for the Promotion of Science KAKENHI (Grant Number JP20K04717).