
Abstract
Road extent compared with the number of automobiles registered in South Korea is the lowest among OECD (Organization for Economic Cooperation and Development) countries. Currently, traffic information is provided based on nodes and links using the centerlines of the roads. However, detailed speed information is unavailable. This study presents an optimization method for space to represent a dynamic speed-homogeneous space. Vehicle directions were separated by route using azimuth data based on global navigation satellite system (GNSS) location information, and the time mean speed and space mean speed were used to determine the homogeneous space of vehicle speed through the gradual separation of space. The processing speed of large-capacity data was increased by using Geohash, which applied a quaternary basis segmentation method that split data into two directions of longitude and latitude. The numbers of homogeneous speed spaces along the two directions of the Gyeongbu Expressway were determined to be 127 and 170, respectively, by the 12-step segmentation method. Spaces not included in the range of homogeneous speed spaces amounted to 5.19% and 7.51%, respectively, along the northbound and southbound roadways of the Gyeongbu Expressway. These non-convergence spaces were analyzed by the influence of vehicles entering or exiting slowly from the merging and diverging areas of the freeway junctions and interchanges. In other words, these were analyzed by the difference of speed by lane and not the driving direction.
Keywords
The number of national automobiles registered in South Korea as of 2020 is approximately 42.5 million, of which 19.2 million are sedans and 3.6 million are freight vehicles, and the annual mileage is 329 billion kilometers. Thus, there is considerable traffic on the roads of South Korea. However, with a road extent of 111,314 km, which corresponds to 4.7 km per 1,000 vehicles, South Korea ranks lowest among Organization for Economic Cooperation and Development (OECD) countries. This leads to a reduction in the road service level, which can result in an increase in traffic accidents.
The number of traffic accidents recorded in 2020 was approximately 0.23 million. Car-to-car accidents are caused by collisions classified as frontal, broadside, and rear-end collisions. Broadside collisions are primarily caused by lane changes resulting from interference with other vehicles at diverging/merging areas of expressways, while rear-end collisions occur as a result of sudden stops caused by traffic jams or accidents in the diverging/merging areas. In the non-congestion state at the diverging/merging area of an expressway, a temporary change in the traffic flow increases the accident risk, while in the congestion state, a change in the degree of congestion increases the accident risk ( 1 ).
In current autonomous vehicles, the surrounding circumstances are analyzed and utilized for autonomous driving using traffic information in conjunction with sensing systems, such as light detection and ranging (LiDAR), radar, global navigation satellite systems (GNSS), and cameras. GNSS signals have been utilized to conduct various studies on the analysis of road microclimates, traffic density, and interval speeds. The events occurring on the road can thus be visualized in real time and can be effectively used in the analysis of important traffic information. Furthermore, with the recent introduction of mobility as a service (MaaS), there has been a convergence of mobile vehicles and communication services, which has led to the generation of big data through the use of sensors and detectors. Currently, the high costs of various sensors for intelligent transport systems (ITS) operations make them difficult to maintain and operate. Mobile sensors can facilitate more accurate and fast generation of traffic information at low or no cost, enabling the utilization of the generated data.
Currently, traffic information is collected using roadside equipment (RSE), loop detectors, closed-circuit televisions (CCTV), and probe cars, and is provided based on nodes and links, using the centerlines of the roads. The nodes and links are generated at the road intersections, beginning and end points, traffic control points, structural change points, converging points of administrative zones, road operation change points, and traffic entry and exit points. Because of these static links, they do not match with the actual speed change segments or are not expressed as speed-homogeneous segments representing the speed characteristics.
This study proposes a space optimization method for presenting a dynamic homogeneous space for speed, whatever the generation points of the nodes and links of the road. Using the azimuth data based on the GNSS location information generated in real time, the upstream and downstream data for each route of the space are separated, and the speed-homogeneous space is optimized through the gradual separation of the space using the relationship between the time mean speed (TMS) and space mean speed (SMS). In this study, the condition in which the difference between TMS and SMS is within a specific range in a space that is divided into certain road segments and areas, that is, the case in which the speed of all the vehicles is similar within one designated space, is defined as the speed-homogeneous space.
The expressway represented the spatial range, and the freight vehicle digital tachograph (DTG) data, which included the speed information based on the GNSS, were distributed in the expressway segment at all times. It is assumed that the speed was not affected by the passenger(s) and road conditions.
The location information indexing and spatial partitioning proposed in this study are gradually divided into a grid shape based on the road map of South Korea. Although the results of this study do not accurately match the road conditions, they can predict the cases in which one point of one road segment is divided into more than two points. Through such an overlapping presentation of road links using the space boundary, the visualization of the service is performed.
Literature Review
Speed Distribution and Representative Values
The mean travel speed and mean running speed are the speeds commonly used in the traffic engineering field, and the corresponding values are expressed as the SMS. The difference between the TMS and SMS increases with decreasing speed and increasing lane numbers ( 2 ).
According to comparative research on the SMS and TMS under different traffic flow conditions ( 3 ), the relationship between the two mean speeds showed different characteristics in the cases of the unstable yet uninterrupted flow and the interrupted flow along a three-lane road. The SMS was estimated using the speed information for the analysis of the traffic characteristics at the urban expressway on-ramp. As such, the SMS can be utilized in the analysis of traffic characteristics within a certain segment.
GNSS-Based Traffic Information Analysis
For traffic information analysis using GNSS, related research cases were investigated, including the generation, investigation, and analysis of the traffic information in conjunction with the map matching of the GNSS data based on geographic applications.
In a separate traffic survey using a global positioning system (GPS) sensor ( 4 ), the moving routes of the individual vehicles were tracked, and the travel propensity was analyzed using the inference model based on the decision-making tree utilizing the GPS data collected by 65 people over 10 months.
In research on the prediction of truck speeds under unlagged conditions ( 5 ), to map the GPS data, grids with a constant size of 60 m, including roads, were generated, and the driving directions of the vehicles were brought to match with the road direction by expanding out to the surrounding grids.
In research on the generation of regional model data for traffic flow and speed using internet GPS vehicle records ( 6 ), link mapping was performed using 124 million GPS data points collected from web pages, aggregated speed and missing traffic lines were generated, and these were utilized in traffic-related air quality analysis by mapping them into a constant grid.
In an analysis of the urban traffic congestion space pattern using grid mapping ( 7 ), taxi GPS data were divided into constant grids, and the insufficient node capacity, bottleneck phenomenon at the link segment, and congestion pattern generated at the interchange of the expressway were analyzed.
Research using the route guidance service ( 8 – 11 ) and GPS data that involves the collection of distribution traffic data from location-based services is being utilized at the macro level for traffic planning and urban planning support ( 12 ), at the meso level for obtaining reflections of the travel speeds along road networks ( 13 ), and at the micro level for updating network structures and properties along with the drive path navigation ( 14 ). Although there are numerous studies on GNSS-based traffic information analysis at the micro level, which is one of the subjects of this study, they are different from the analysis of road network information at the macro, meso, and micro levels using large-capacity GNSS-based data, that is, the complete scope of this study. Furthermore, previous studies have utilized pre-designated grid-based GNSS data and grids of specific sizes. Therefore, they are different from this study.
Moving Object Indexing Technique
Geohash is a technique for converting geographic coordinates, that is, global longitude and latitude, into one number to increase the spatial information search speed in space big data. It is a public domain geocode system invented in 2008 by Gustavo Niemeyer ( 15 ) and (similar work in 1966) G.M. Morton ( 16 ), which encodes a geographic location into a short string of letters and digits. Various modified versions, including the geocoding methods expressed in 32 and 64 notations, and Hilbert coding are in use ( 17 ).
Geohash is a hierarchical spatial data structure that divides a given space into a grid structure; it is one of many space partition methods, including the Z-order and space-filling curves. The precision of Geohash can be adjusted, and its size can be reduced by successively removing the characters at the end of the code. Most nearby areas have a similar prefix because of the gradual reduction in precision. In other words, with increasing similarity between the two prefixes, the proximity between the two areas increases. By merging the adjacent spaces and indexing the rectangular grid, the Z space partitioning order can be made in И-shaped.
Establishment of the Research Methodology
Objective Function and Constraint Function
This study aims to separate the homogeneous spaces that minimize the speed deviation of an individual vehicle in the time series. The objective function minimizes the variance-to-mean ratio, that is, the difference between the SMS and TMS, and the constraint function performs the separation of the northbound and southbound using the boundary function which determines the partition of the space along the azimuth; a method that considers the range of each variable as a constraint function is then proposed. Based on the speed information, the objective function, explanatory variable, constraint function, and constraint condition for the space optimization are as follows:
- Objective function

- Constraint function


- Condition of space partition


n = number of vehicles;
SMS = space mean speed;
TMS = time mean speed;
Dynamic Speed-Homogeneous Space Optimization Method
To judge the speed homogeneity, it is necessary to determine whether there are vehicles with different speeds in one area or if only vehicles with similar speeds are traveling through this area. Assuming that the speeds of all the vehicles in the same space are the same, the relationship between the two mean speeds can be expressed as
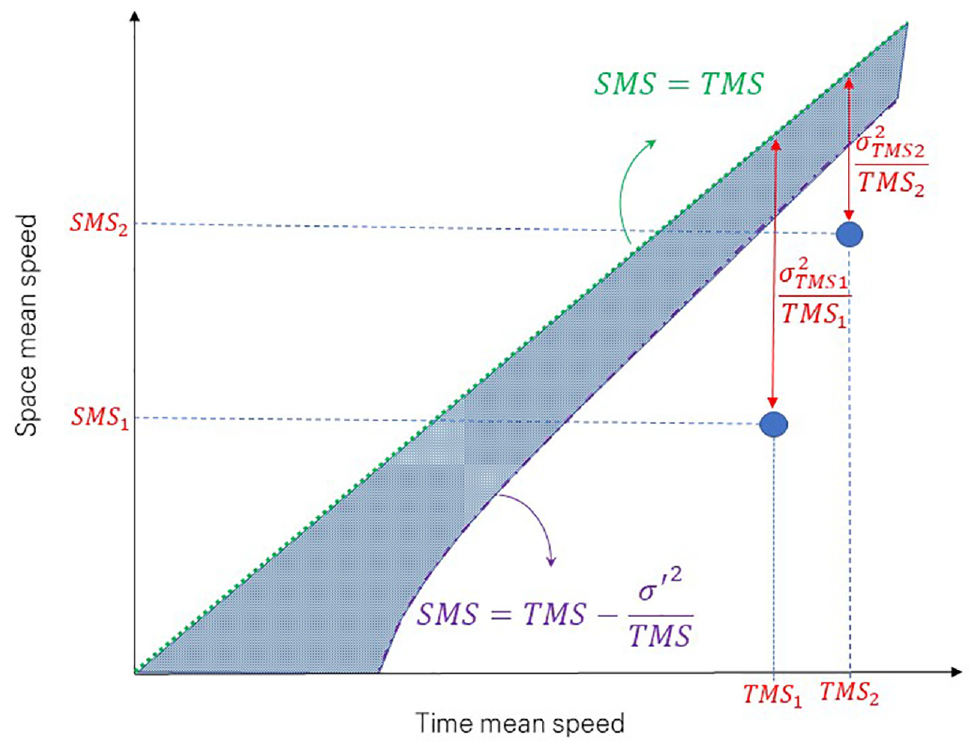
The fundamental concept of dynamic speed-homogeneous space.
Here, the TMS and SMS values used to determine the space partition are related to the mean speed and standard deviation within the space and are affected by the actual speeds of the individual vehicles traveling on the road, individual driving behavior, and performance of the vehicle. Garber et al. ( 2 ) proposed a relationship model for the TMS and SMS considering these correlations, and this model is used in this study.
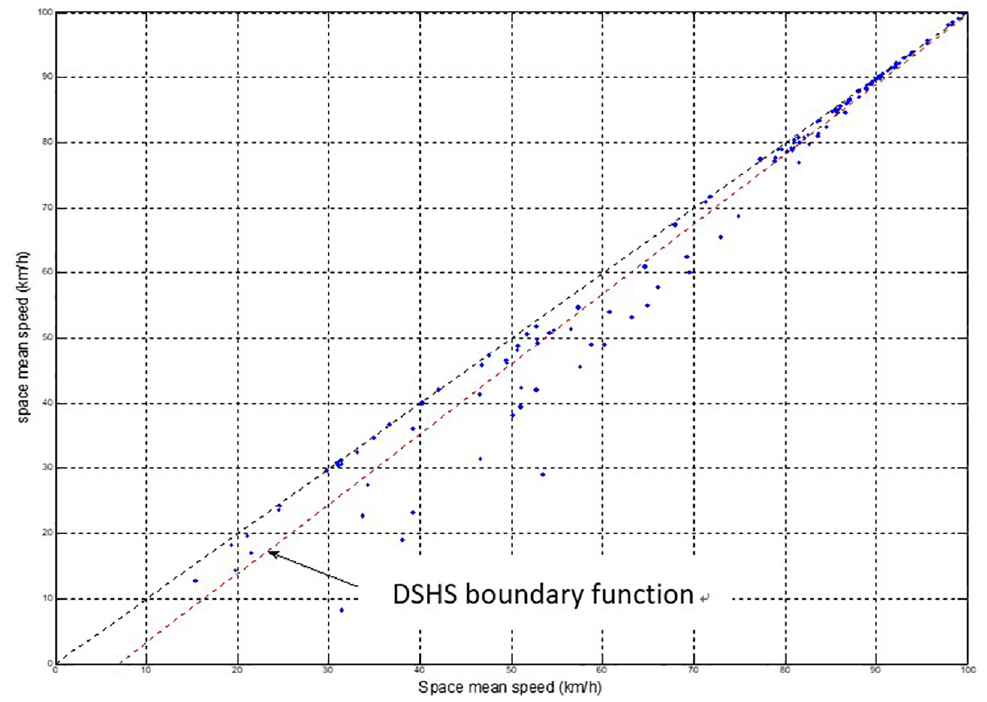
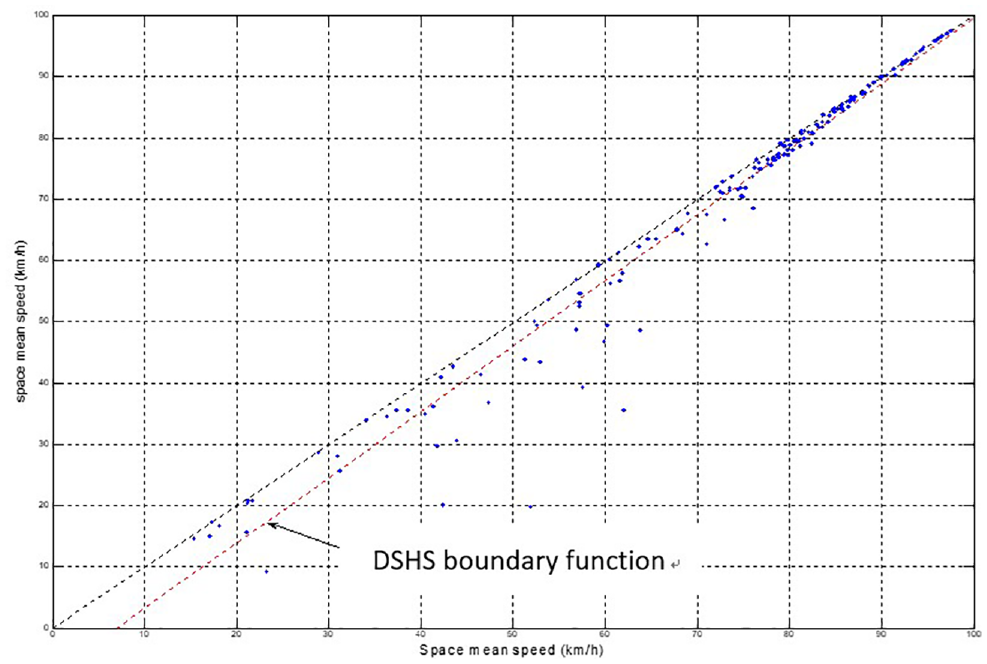
This study focuses on determining the space partitioning range based on the speed distribution rather than estimating the SMS value. The dots in Figure 2 represent the relationship between the TMS and SMS in various segments obtained through the field survey, and the TMS–SMS relationship model is deduced via regression analysis. Using the

The decision function of dynamic speed-homogeneous space.
According to this, the correlation model of Garber representing the time–space mean speeds of the expressway is applied and set as the centerline, and the symmetrical function is calculated based on the distance between the Garber function and the function in which the TMS and SMS are equal. This symmetrical function is used to determine the space partition, as shown in Figure 2.
Space Partition Method
The space partition follows the Geohash algorithm, and the default number between the steps follows the quaternary notation. The mainland of South Korea lies between the latitudinal coordinates of 126° and 130° east and longitudinal coordinates of 34° and 38° north. To minimize the difference between the partition steps, a space partition approximately resembling a square, which fits the shape of South Korea, is applied using the quaternary notation, and the longitude and latitude are divided identically. Because the space partition number is related to the fragmentation of the partition range, a low space number for a one-time partition is applied, and the maximum partition number is set at 12. The space partitioning method is as follows:
Step 1: When partitioning the space into four once, for space 2 (Figure 3), the latitude is “1” at the bottom, longitude is “0” at the left, and the binary numeral “10” becomes “2” in the quaternary notation.
Step 2: The code is generated by dividing the given GNSS coordinates by up to 12 times and used after comparing its digits.
Step 3: When the space code is 123123123123, the initial space is 1, the fifth partition space code is 12312, and the coordinates with the same code are calculated in the same space.
If the space partitioning is conducted based on the aforementioned partition steps, a space code with the same order of magnitude as the partition number is generated. For a one-time partition, four spaces, that is, CH0, CH1, CH2, and CH3, are generated, and for a two-time partition, 16 spaces, such as CH00, CH01, CH02, CH03, and so forth are generated. After the 12-time partition, 16,777,216 spaces, such as CH000000000000, CH000000000001, CH000000000002, CH000000000003, and so forth are generated.
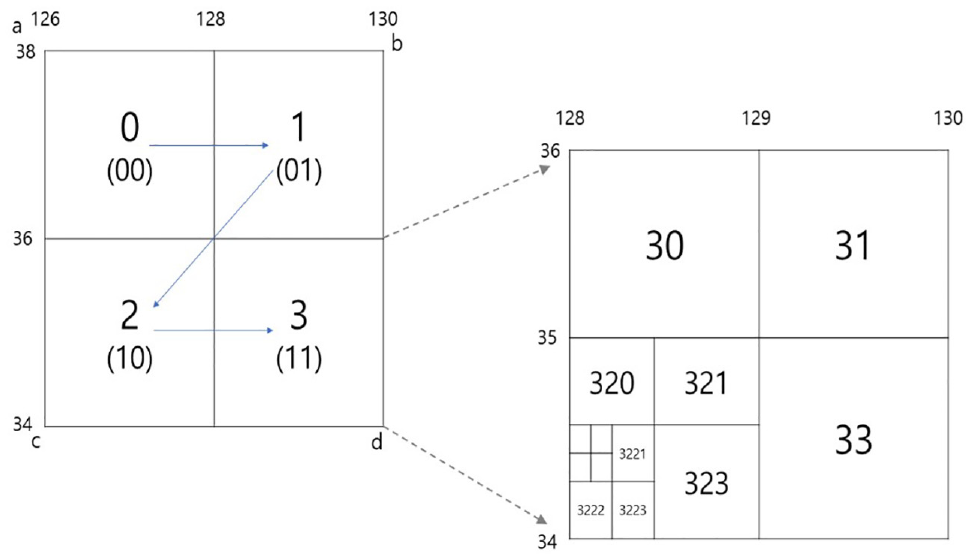
The method of space partition.
Separation Method of the Northbound and Southbound
If the location-based progress direction of each vehicle is in the same range, that is, the progress direction of the vehicles is constant in one segment, it is easy to separate the northbound and southbound. Notably, for the north–south direction route, the northbound remains as such, and for the east–west direction route, the eastbound becomes the northbound, and the opposite directions become southbound. In the case of the road including curved tracks, as shown in the left hand side of Figure 4, it is not possible to segregate the northbound and southbound by setting a specific azimuth range. Therefore, to determine the entire direction of the road within one space, a method of finding the farthest coordinate first, followed by the road shape in the north–south or east–west directions based on the direction of these two points, and separating the northbound and southbound by considering the road progress direction as the reference azimuth is proposed.
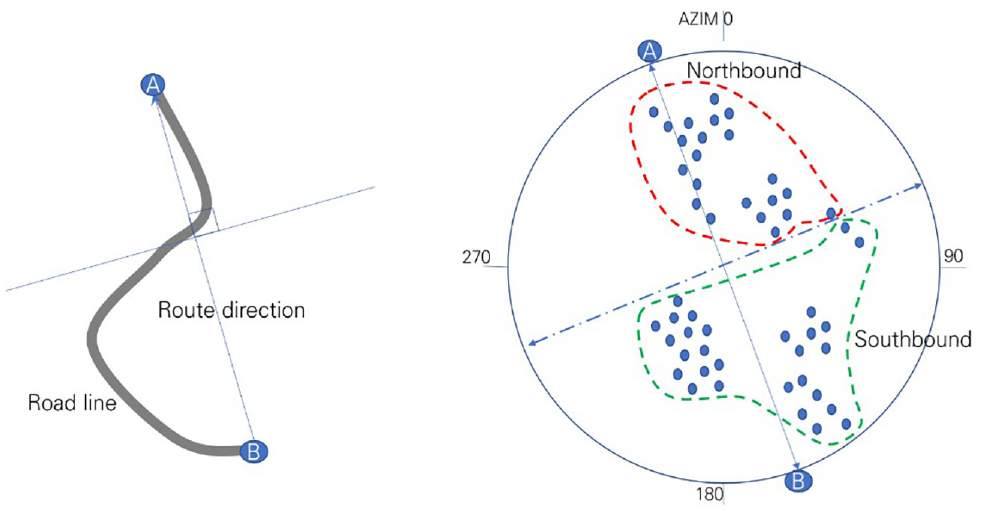
The method of separating the direction of the vehicles.
The method of separating the upstream and downstream data is as follows:
Step 1: From the entire data within the space, the maximum and minimum values in the longitude and latitude coordinates are determined. As can be seen in Figure 5, the maximum (Xmax) and minimum (Xmin) values of X, and the maximum (Ymax) and minimum (Ymin) values of Y are determined from the data on the longitude and latitude coordinates (X, Y). By matching the Y value at the maximum X value (YXmax), the coordinates of this point are set as (Xmax, YXmax), and, using the same method, four coordinates are obtained.
Step 2: The X- and Y-directional distances, XDIST and YDIST, are calculated based on the four coordinates, and the direction of the route is determined based on the larger value between them. According to Figure 5, if YDIST is larger, the kth space (CH k ) is a north–south directional route.
Step 3: If the difference in the latitude direction (Y) is large, as shown in Figure 5, the azimuth between (XYmax, Ymax) and (XYmin, Ymin) (

Step 4: If the direction is within ±90° from the azimuth of the straight line, it is considered as northbound, and in other cases, it is judged as southbound. As shown in Figure 5, even if it is a curved route, the north or south direction is divided using the azimuth data of each vehicle. However, the case with the azimuth in the same direction as the normal line of the progress direction is excluded. Furthermore, the case in which the progress direction of the expressway is curved in the reverse direction is also excluded from this study.
If
If
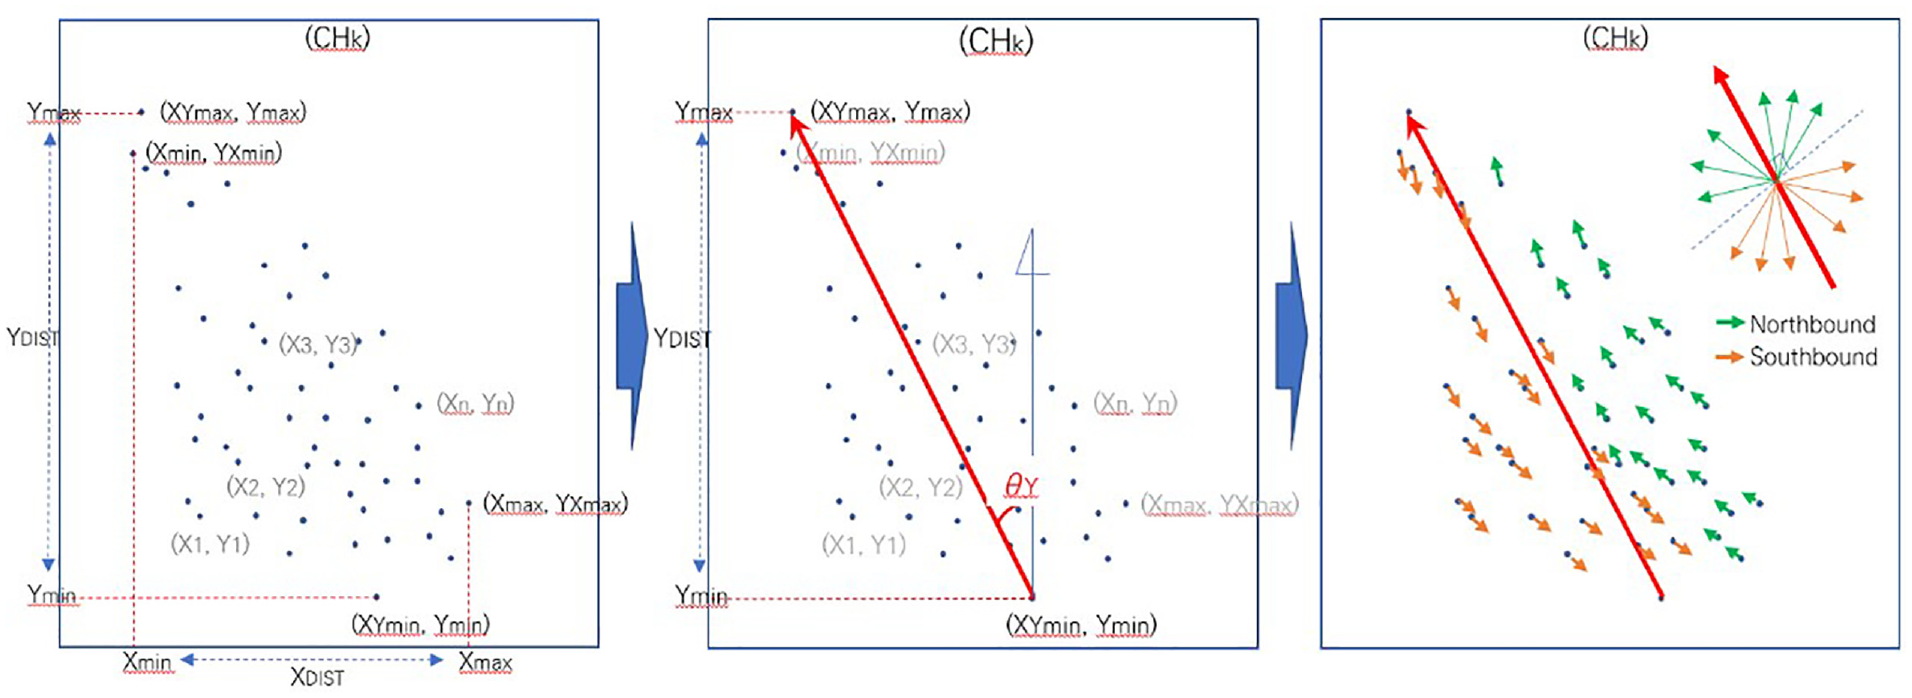
The process of separating the direction of the vehicles.
Application and Analysis of the Developed Model
Data
Data Preparation
Because this study aims for a partition based on the change in speed of vehicles and optimization of the speed-homogeneous space in the case where the road segment is long, an expressway with a relatively long segment length and high speed limit is considered. Here, accidents occur at the diverging and merging areas of continuous flow and non-recurring congestion, rather than at areas with a short segment length, relatively low speed limit, and changes in traffic flow depending on interrupted flow, such as urban areas. Furthermore, it requires the collection of data, such as the location and speed information of the individual vehicles, data on the expressway, and data that are less affected by driving lanes such as a designated lane. Taxi DTG data are mainly distributed in urban areas, and random parking and stopping can occur owing to the effect of boarding, disembarking, and waiting for passengers. Bus DTG, which is shown in Table 1, is also mainly distributed in urban areas, and for intercity buses it can show different characteristics depending on the surrounding traffic flow, which is attributed to the effect of driving lanes such as bus-only lanes. For these reasons, freight vehicle DTG data were used in this study. Although the driving speeds of freight vehicles are relatively low, and their driving lanes are mostly to the right, they are evenly distributed throughout national roads, including expressways, which enables accurate data collection. The range of the collected data was as follows: temporal coverage (April 1–30, 2018 [1 month]), number of data points (about 22,350 million), size (about 3.13 TB), time interval (every 1 s), spatial coverage (Gyeonggi-do area), number of vehicles (2,775).
The DTG Data Table

Note: DTG = digital tachograph; no. = number; na = not applicable.
Data Preprocessing
The data extraction method from the freight vehicle DTG data within the target segment and time ranges was as follows:
Step 1: Among the ITS standard node links, the links of the Gyeongbu Expressway (code 000), as shown in Table 2, were applied, and the entry and exit links (code 101) were excluded.
Step 2: A buffer by number was assigned to the vehicle with a link, the data were extracted via mapping using the coordinates of the DTG data, and the data within the target time range were further extracted.
Step 3: From the extracted data, the data for the target dates were further extracted.
The Link Data Table

Note: No. = number.
Results
Figure 6 shows the entire road network map of South Korea, with the Gyeonggi region (the target section of this study) enlarged; the Gyeongbu Expressway is marked in red.
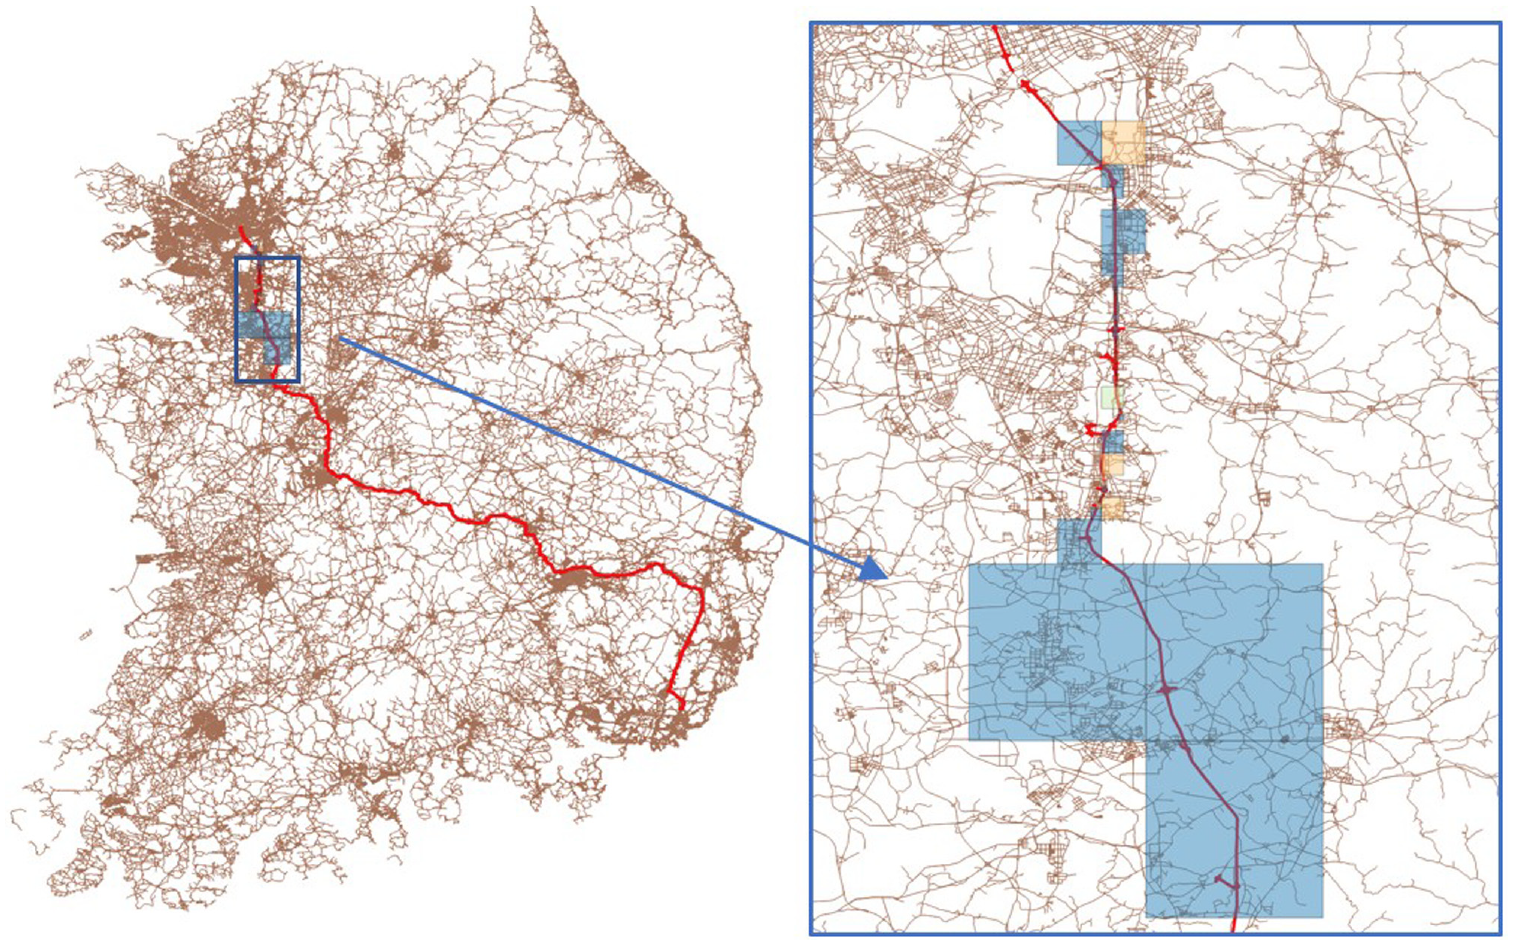
The target area location on the entire road network in South Korea.
The dynamic speed-homogeneous space (DSHS) optimization results for the Gyeongbu Expressway are presented in Figure 7. The number of spaces, average number of data points, and representative values for the different space partitioning steps are listed in Table 3. Based on the DSHS analysis results of the Gyeongbu Expressway, the lines were separated into 127 northbound and 170 southbound, and 38 and 55 spaces were not included within the range of the homogeneous space partitioning boundary function. The homogeneous space partitioning boundary function and distribution of the TMS and SMS are presented in Figures 8 and 9, respectively.
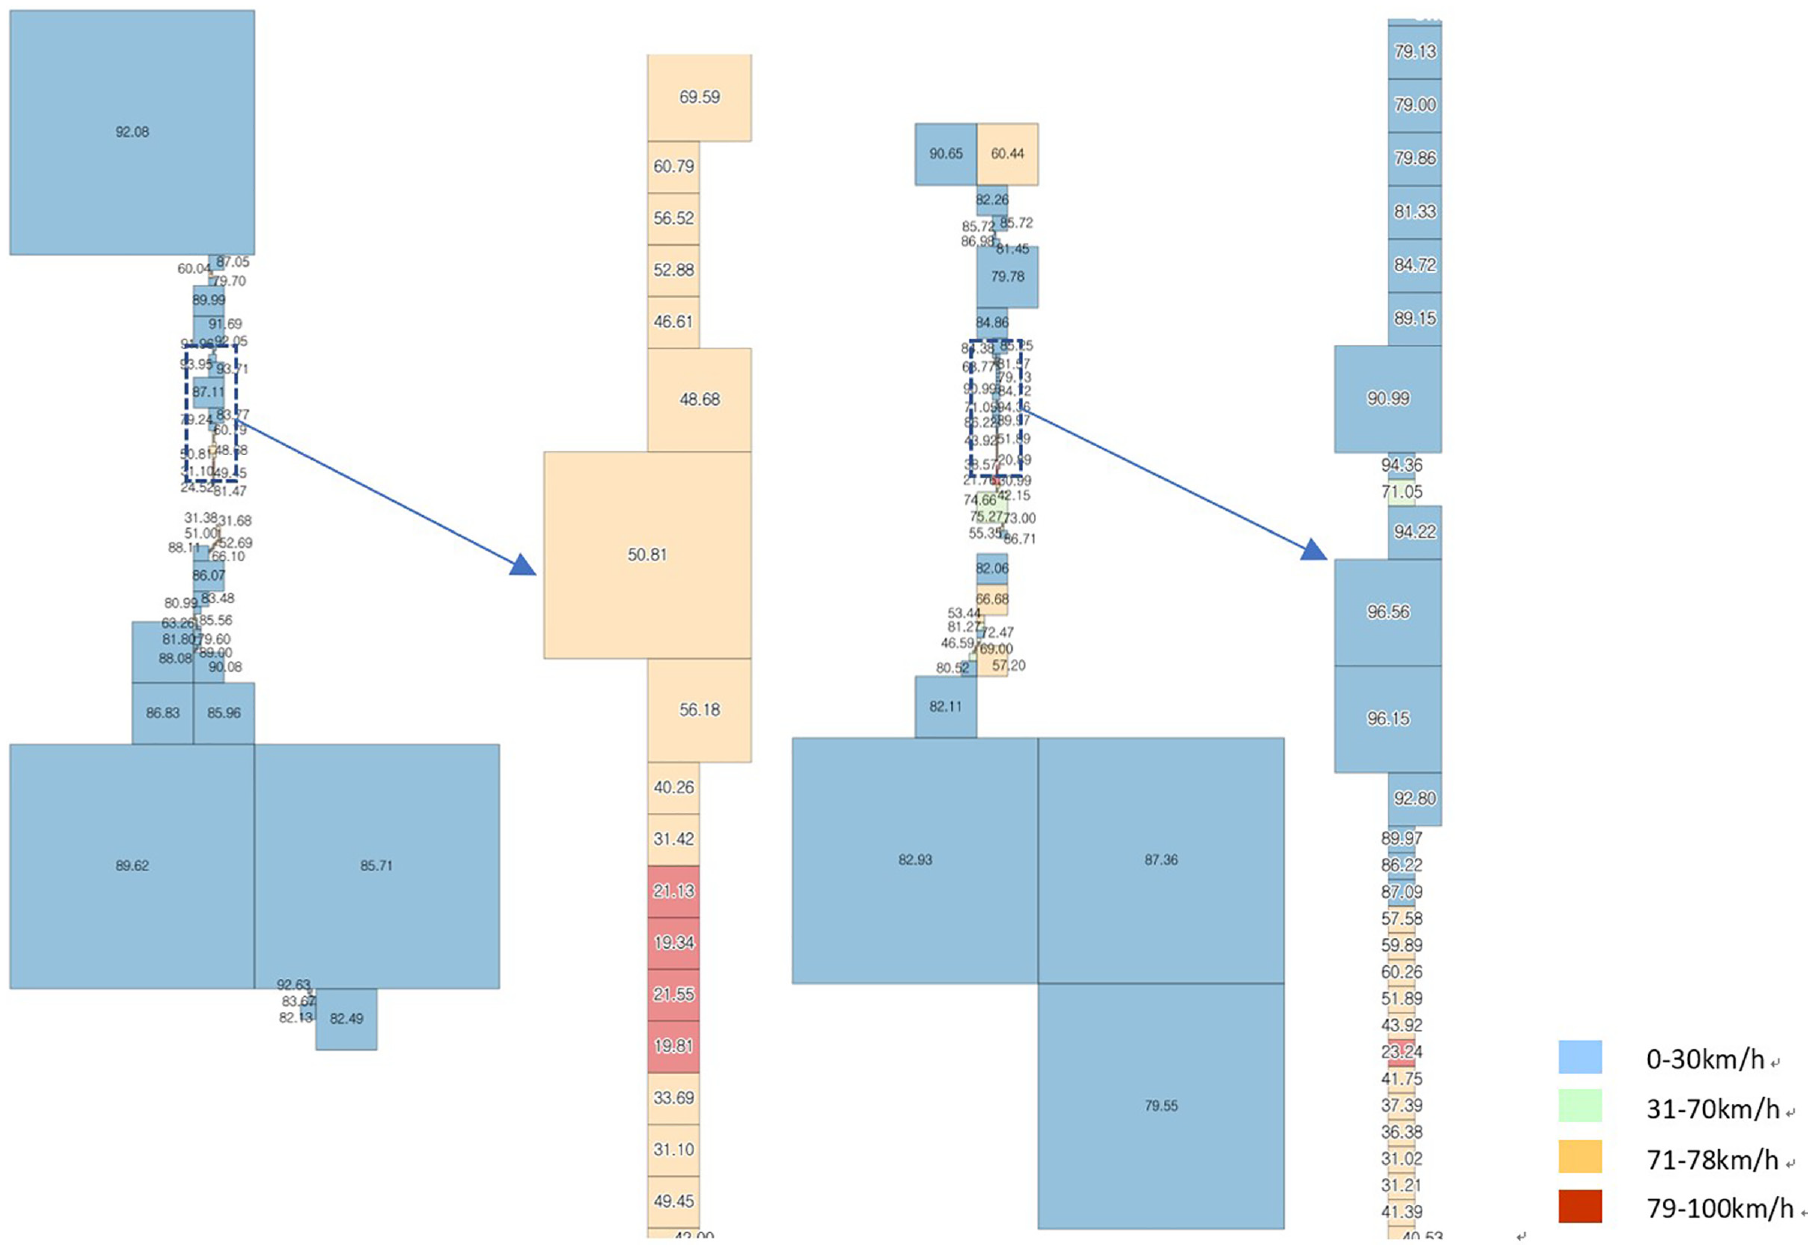
The dynamic speed-homogeneous space analysis result.
The Result of Dynamic DSHS

Note: DSHS = dynamic speed-homogeneous space; na = not applicable.
The dynamic speed-homogeneous space (DSHS) result (northbound).
The dynamic speed-homogeneous space (DSHS) result (southbound).
Discussion
Time Sensitive Analysis
The above results were obtained after analyzing the data for 5 min, and the sensitivity analysis was performed according to the change in data aggregation time. Data were collected at intervals of 15 min and 5 min from 09:30 on the 2.4 km southbound section of the Dongtan Junction of the Gyeongbu Expressway. Figure 10 compares the 15 min and 5 min data. The data were simultaneously aggregated for 15 min from 9:30 to 9:45 and aggregated at 5 min intervals of 9:30–9:35, 9:35–9:40, and 9:40–9:45. In the first 5 min, the speed in the upstream part decreased, and the results show that the decrease in speed gradually propagated to the downstream part. At this time, the 15 min data show a decrease in the upstream speed and a decrease in the speed at the junction (Dongtan Junction). Therefore, the 5 min data can explain the speed change interval, and the 15 min data can explain the overall speed distribution for 15 min from 9:30.
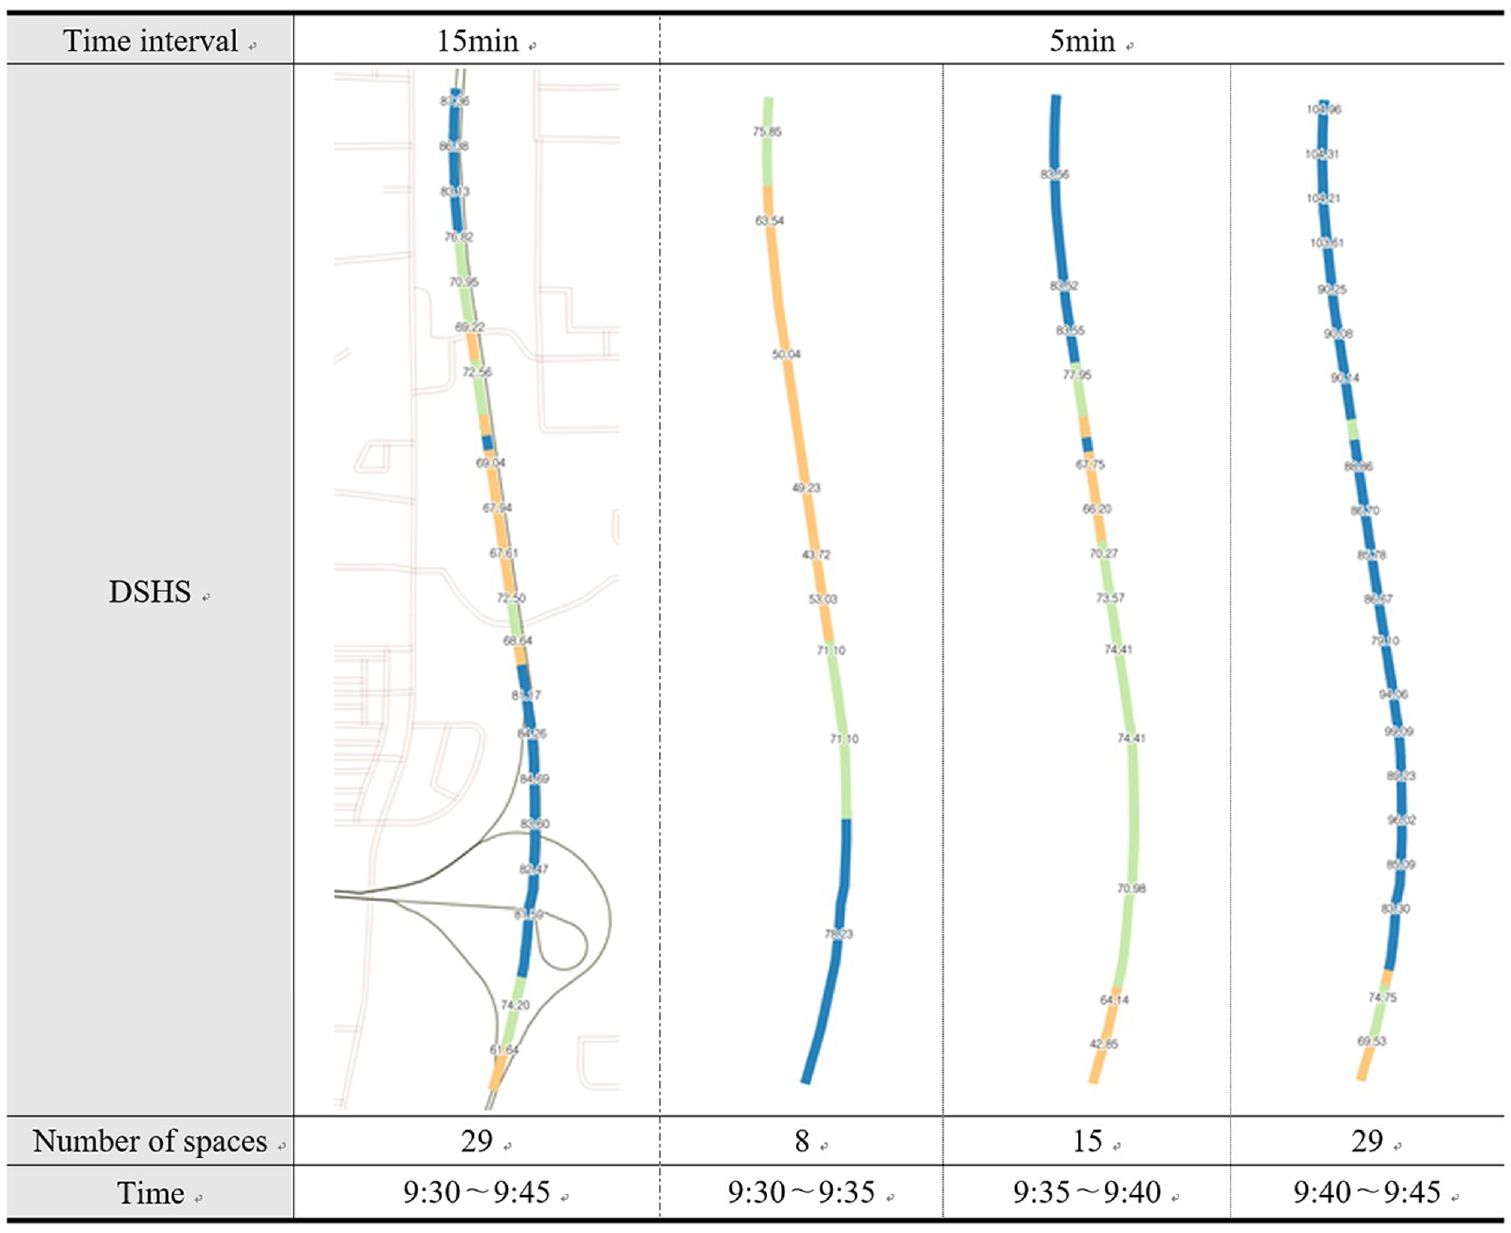
The dynamic speed-homogeneous space (DSHS) result.
Interpretation of Non-Coverging Cases
The DSHS was distributed at a similar speed in the identical time series, and it was divided into 12 steps; however, non-converging spaces were not included within the homogeneous space. This mainly occurred in the segment of the road with a high volume of traffic; for the southbound direction of the Gyeongbu Expressway, 55 of the last partition spaces among 170 spaces corresponded, and for the northbound, 38 of the last partition spaces among 127 spaces corresponded. The length of the non-converging segment accounts for 5.2% and 7.5% of the entire road segment for the northbound and southbound segments, respectively. If the non-converging space is additionally segmented, a homogeneous space can be created. However, as mentioned in the methodology, the size of this space can be excessively reduced. To this end, the rationalization for presenting the space as a non-converging space was analyzed, and a processing method was proposed. As shown in Figure 11, the non-converging spaces have significantly different speeds depending on the road and we can compare the speed distribution with the homogeneous space. If the space segmented into a minimum size does not converge, it can be presented as an unstable traffic flow in which the speed difference within the same space is large, that is, the space is characterized by a large speed difference depending on the roads because of a certain effect.
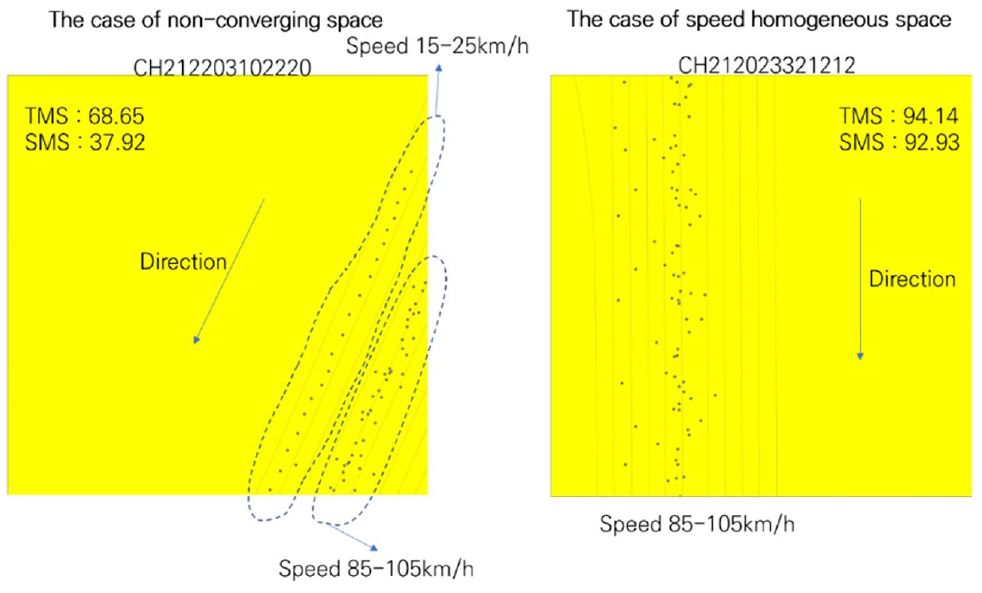
A comparison of non-converging cases.
Result Verification
This study focuses on the optimization of the DSHS while simultaneously considering the change in space–time. Depending on the speed distribution over time, it is divided into different spaces, and the final space determines the SMS using numerous DTG data as representative values. Among the non-converging spaces proposed in the analysis of the results, the spaces that did not converge because of the speed difference by road were excluded. To verify the results, the variance-to-mean ratio of the final speed by homogeneous space was determined and is presented using the Garber model, absolute percentage error, and mean absolute error.
Variance-to-Mean Ratio of the Speed-Homogeneous Space
The difference between the TMS and SMS, the objective function of this study, is estimated by the variance-to-mean ratio; if it is closer to “0,” it can be concluded that the homogeneous space is well optimized. Table 4 shows the variance-to-mean ratio averaged by the expressway direction and space partition number. The minimum value is 0.3594 km/h obtained from the step 8 space of the northbound, which corresponds to a standard deviation of 5.99 km/h when the mean speed is 100 km/h, indicating an extremely small speed deviation between vehicles in the space. The maximum value obtained from the step 8 space of the southbound is 1.3138 km/h, leading to a standard deviation of 11.46 km/h when the mean speed is 100 km/h. The mean of all the variance-to-mean ratios for the expressway northbound is 0.7512 km/h, that for the southbound is 0.7115 km/h, and that for both the northbound and southbound is 0.73 km/h, which is less than 1 km/h, suggesting the high-speed homogeneity of the homogeneous space.
Variance-to-Mean Ratio of the Speed-Homogeneous Space

Note: na = not applicable.
Comparison of the Representative Values of the Speed-Homogeneous Space
As a comparative verification method of the resultant space, the values calculated using the Garber model (
This value is the difference between the estimated value of the SMS obtained using the TMS proposed in the Garber model and the calculated value of the SMS of the speed-homogeneous space in this study. MAPE is the probability of error compared with the SMS, and MAE is the error compared with the SMS.


The MAPE and MAE values of the speed-homogeneous space of the Gyeongbu Expressway are listed in Table 5. The maximum MAPE value of 0.8921% was obtained when compared with the Garber model in the 12-step partition of the northbound. This means that there is an error of 0.89 km/h when the mean speed is 100 km/h. The maximum MAE value of 0.7762 km/h was obtained when compared with the Wang model in the 8-step partition of the northbound.
Comparison of the Representative Values of the Speed-Homogeneous Space

Note: MAPE = mean absolute percentage error; MAE = mean absolute error; na = not applicable.
Conclusion and Future Research
Conclusions
The number of national automobiles registered as of 2020 in South Korea is around 42.5 million and for road extent compared with the number of vehicles, South Korea ranks lowest among OECD countries. Approximately 0.23 million car accidents occur annually, and the number of deceased per car accident on the expressway is more than twice that on other roads, which is attributed to non-recurring congestion and high driving speeds. One of the main causes of broadside collisions, which account for a high ratio of car accidents, is lane changes arising from the interference with other vehicles at the diverging/merging area of the expressway. Rear-end collisions are caused by sudden stops resulting from congestion at the diverging/merging area, front congestion, and accidents. Among such congestion information guidance, the factors that have the most significant impact on the route selection of users are accuracy and quickness. The availability of subdivided and accurate speed information can prepare drivers in advance in one segment of the road, and the number of accidents attributed to non-recurring congestion and high driving speeds can be reduced.
This study aims to analyze speed information, such as mean speed, which changes over time, and the traffic flow of individual segments, and to optimize the provided space through its sequential partition. In this study, a space optimization method was proposed to present the dynamic homogeneous segment of the speed, whatever the generation points of the nodes and links of the road. The speed-homogeneous space enables the fast mapping of massive amounts of data using the space-specific value rather than the linear relationship; therefore, this study is of great significance. The optimization results of the DSHS are as follows.
First, the DSHS based on the GNSS location coordinates presented the range of the space partition function for minimizing the variance-to-mean ratio, which is the difference between the TMS and SMS.
Second, based on the 12-step partition results, a total of 41 speed-homogeneous spaces were determined on average, and the maximum number of speed-homogeneous spaces was 127 and 170 for the north and southbound of the Gyeongbu Expressway, respectively. Here, certain spaces were not included in the range of the speed-homogeneous space, and they accounted for 12.7% of the total extent, and the northbound and southbound of the Gyeongbu Expressway accounted for 5.19% and 7.51%, respectively.
Third, the non-converging space not included in the range of the space partition function was analyzed to be attributed to the effect of vehicles entering or exiting at the diverging and merging areas of the expressway junctions and interchanges. In other words, it was not the speed difference toward the progress direction but the speed difference by roads that was responsible for the non-converging space. Therefore, for the segment with a high speed deviation within the space, the connection intersection only affected parts of the roads and other roads were classified into spaces where normal driving was possible.
Fourth, in the case where the average speed is low among speed-homogeneous spaces, that is, the speed deviation within the space is low and the overall speed is low, it is possible to classify the spaces affected by the connection parts and other traffic factors, including traffic volume.
Finally, based on the analysis results of the sensitivity to the tally time, the case where the speed-homogeneous space is maintained as constant in the target segment is characterized by smooth speed or long congestion, and for the case with insensitive speed changes on the time series, the data can be aggregated for more than 10 min before application. In the case where the speed of the homogeneous space changes, the congestion is initiated or relieved, and if the speed on the time series is sensitive, it is suitable to aggregate the data for less than 5 min before application.
The optimization of the DSHS using the TMS and SMS, along with the homogeneous space partition function, can effectively present the speed-changing sections accurately with a quick processing speed. Furthermore, the partitioning of the speed-changing segment on the expressway and analysis of the influence areas of the diverging and merging parts and the subdivided influence areas depending on the accident circumstances were enabled.
Utilization of the Results
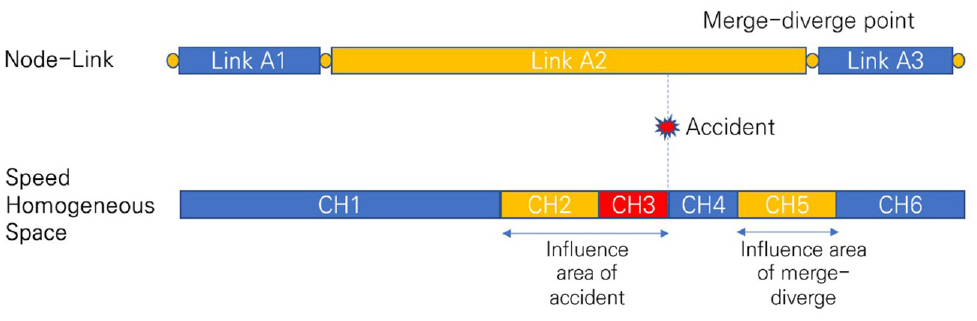
There are several benefits of utilizing the speed data of individual vehicles collected in real time, including the availability of real-time information, reduction of data collection and processing costs, and analysis of the influence area of the diverging and merging areas and accidents. In particular, the analysis of the accident influence area, such as diverging and merging areas and accidents, is a direct traffic analysis method that can be applied using the results of this study; if the delay and congestion generation points caused by the accident and diverging and merging areas are the same as shown in Figure 12, the speed information of the link A2 range has to be averaged and provided for the space composed of links A1, A2, and A3 when providing the information based on the existing nodes and links. By applying the methodology of this study, if CH5 is the non-converging space in the space divided into CH1, CH2, …, CH6, which is the standard of the homogeneous space as shown in Figure 12, the analysis of the influence area of the speed-changing spot, that is, accident spot along with the influence area depending on the speed difference by road of the diverging and merging areas is enabled.
Utilization of the results.
Information including a large speed difference caused by the influence area of the accident and diverging and merging areas and by the road can assist the surrounding situation sensing function of autonomous vehicles and can be provided as important information about the circumstances ahead in the case of sensor malfunction because of weather or other effects. Even for semi-autonomous vehicles or non-autonomous vehicles, real-time speed change information according to the circumstances ahead can play an important role in traffic safety. Such subdivided speed information on the traffic flow can enable traffic analysis and service in various circumstances as traffic management, thereby enabling effective traffic operation.
Application Method and Future Research
This study verified that traffic information from the expressway obtained as linear information can be provided in the unit of the area resulting from the space partition using the speed information based on the GNSS location coordinates generated in real time.
The partition of the area based on constant distance, rather than the traffic information, minimizes the space size, and thus, it can accurately determine the speed-changing spot and a suitable classification is enabled based on the space size and speed-homogeneous space. The application methods of the results of this study are as follows:
First, if the location-based speed information of individual vehicles is collected in real time, the real-time speed information at the present point can be provided.
Second, the analysis of the current location-based speed information of an individual vehicle can provide location-based traffic information with higher precision compared with existing methods. This facilitates the collection of the various demands of the driver by the information provider, and assists the driver in making prompt decisions on driving behavior.
Finally, in the area based on the space presented as the speed-homogeneous space with a low TMS, it is a delayed or congested space because of events such as diverging and merging areas or accidents, and by providing subdivided space speed information in the same link, slow driving information can be furnished for the prevention of a sudden stop.
Future research on roads and environments utilizing the results and methodology presented in this study can be performed as follows.
First, vehicle-road automation for autonomous driving, provision of weather and environment information, and convergence analysis can be enabled. Road weather information, such as severe weather can cause sensor malfunctioning of autonomous vehicles, including the advanced driver assistance systems (ADAS) sensors of non-autonomous vehicles. Therefore, the microscopic road weather information and converging analysis of the traffic condition information can be utilized in the manual transfer of information to autonomous vehicles, and for determining instances of slow driving ahead, lane changing information, and sudden stops, thereby preventing the occurrence of rear-end collisions. The current minimum standard for the provision of the weather network is the town forecast, which can be expressed differently from the partition area based on nodes and links, and the space partition of the corresponding segment enables the accurate provision and analysis of the information.
Second, it can be utilized as a basic technique for providing information on hazardous road sections, such as freezing. Currently, freezing information is provided as spot or length information targeting habitual frozen sections; however, providing location-based freezing section information, such as vehicle sensing and weather information analysis and application can be enabled.
Third, in the case of an emergency caused by various effects, it can be utilized in the prompt tracking of the road segment based on the location coordinates.
Finally, in this study, the DSHS was optimized using information such as the coordinates, speed, and azimuth of the freight vehicles. This reflects the driving characteristics of the freight vehicles, including the relative reduction of the speed limit and driving speed, entry and exit lanes, and slow driving in the rest area. Therefore, if the speed information from autonomous vehicles and sedans, such as shared cars, is collected and utilized in the optimization of the speed-homogeneous space, the driving characteristics can be generalized and the generalized results can be deduced. Moreover, by differentiating the lengths along the longitude and latitude directions depending on the lane types and by conducting a sequential merge study of the final spaces, the optimization of the DSHS in a manner similar to the linear shape of the road can be enabled. Furthermore, the analysis of the speed-homogeneous space model by roads with characteristics such as longitudinal slope and steering radius of the road may be conducted and applied.
Footnotes
Author Contributions
The authors confirm contribution to the paper as follows: study conception and design: K. Chong, Y. Lee; data collection: K. Chong; analysis and interpretation of results: K. Chong; draft manuscript preparation: K. Chong. All authors reviewed the results and approved the final version of the manuscript.
Declaration of Conflicting Interests
The author(s) declared no potential conflicts of interest with respect to the research, authorship, and/or publication of this article.
Funding
The author(s) received no financial support for the research, authorship, and/or publication of this article.