



Abstract
This paper examines the effect of the COVID-19 pandemic on travel time reliability (TTR) performance on two high traffic volume freeway corridors (I-90 and I-405) in the U.S.A. Specifically, the travel time distributions (TTDs) during and before the pandemic are compared. The paper also examines which TTR metrics best capture the effect of the pandemic on reliability performance. There were statistically significant differences, at the 95% confidence level, between TTD in 2020 and corresponding TTDs in 2018 and 2019. Not surprisingly, all measures of central tendency and all measures of dispersions were reduced during the pandemic. Consequently, it was concluded that TTR performance improved during the pandemic regardless of what TTR definition was used. Travel time index (TTI), planning time index (PTI), and the level of travel time reliability (LOTTR) metrics improved during the pandemic, albeit at different rates. In contrast, the buffer index and coefficient of variation increased. In other words, whether an analyst would identify that TTR improved or decreased during the pandemic, and by how much, would be a function of which TTR metric was applied. Not surprisingly, the more congested the roadway section, the greater the impact the pandemic-related interventions had on TTR. It was found that, practically speaking, there are no differences in TTI, PTI, or LOTTR values when TTDs are formulated using a 5 min or 15 min aggregation interval. It was concluded that analysts need to have a deep understanding of the underlying TTD and the various TTR definitions when evaluating changes in freeway systems’ TTR.
Keywords
To reduce the spread of the novel SARS-CoV2 virus, numerous COVID-19 pandemic interventions were implemented in March 2020 and as a result, local and international travel was severely reduced. These travel restrictions created an opportunity to study the effect of relatively high reductions in travel demand on roadway performance. In other words, the COVID-19 pandemic has provided a natural experiment to study common roadway performance measures, how they responded to the changes in the transportation system, and the best ways to communicate such information to transportation professionals and to the traveling public.
In this paper, the effects of the COVID-19 pandemic on travel time distribution and its corresponding travel time reliability performance measures are studied. The concept of travel time reliability (TTR) as a road performance measure has recently been widely adopted by most U.S. state transportation agencies. For example, the FHWA has identified travel time reliability as a key road performance mobility indicator in the Moving Ahead for Progress in the 21st Century (MAP21) Act ( 1 ), the Fixing America Surface Transportation (FAST) Act ( 2 ), and the recent Infrastructure Investment and Jobs (IIJ) Act ( 3 ). However, to date the definition of TTR has not been standardized and, as a result, there are numerous TTR metrics commonly used to measure TTR.
A review of the literature shows a variety of definitions for the TTR of a transportation system. For example, a U.S. national study, the Strategic Highway Research Project 2 Report L04 ( 4 ), described TTR as “the lack of variability of travel times.” Other researchers used statistical derivatives related to the skewness and standard deviation of the travel time distribution to define TTR ( 5 ). The latest edition of the Highway Capacity Manual (HCM-6) states that “travel time reliability reflects the distribution of trip travel time over an extended period. The distribution arises from the occurrence of several factors that influence travel time (e.g., weather events, incidents, work zone presence).” It can be argued that because there is no standard definition of reliability, a variety of metrics have been used to measure TTR. A detailed examination of the different TTR metrics may be found elsewhere ( 6 ).
A previous study by the authors on the performance of four arterial corridors in Nebraska during the pandemic showed that the level of TTR improvement was a function of which TTR metrics were used for the analysis ( 7 ). For example, with different metrics, the average changes in TTR values during the pandemic ranged from 3.5% to 35.0%. The focus of this paper is on whether similar effects will be found on high traffic volume U.S. Interstate highways. In this paper, the effect of the COVID-19 pandemic on the TTR metrics is studied on two freeways that are among the top 15 most heavily traveled corridors in the U.S.A., as measured by average annual daily traffic (AADT) ( 8 ). Specifically, this paper will assess the sensitivity of the TTR metrics to the reduction in travel demand caused by the pandemic. The paper will also examine whether the findings are affected by aggregation level or time of day. In particular, the following questions will be answered:
Did the COVID-19 pandemic result in more reliable freeway travel times?
What TTR metrics best capture the change in travel times caused by the COVID-19 interventions?
Does spatial and/or temporal data aggregation affect TTR and, if so, in what way? and
Is there a need for a change in the way TTR metrics are measured and communicated?
The remainder of the paper is made up of five sections. The first section introduces the concept of TTR and its relationship to roadway travel time distribution measurement, and defines some of the commonly used TTR metrics. The second section describes the freeway corridors that were studied, and the travel times experienced on these corridors under pre-pandemic and pandemic conditions. The third and fourth sections will provide a detailed statistical analysis of the changes in the travel time distributions and the corresponding TTR metrics for both pandemic and pre-pandemic periods. This is followed by a discussion on the lessons learned for future TTR analyses. Concluding remarks are provided in the last section.
Travel Time Distribution and the Concept of Reliability
Roadway travel time distributions vary across space and time of day ( 9 ). Consequently, the underlying travel time characteristics are often categorized spatially (i.e., link, corridor, or system), by the time of day (i.e., peak and off-peak periods), aggregation level (i.e., raw, 5 min, 15 min, or 60 min), and analysis period (i.e., a set of days, e.g., weekdays or weekends). Once these characteristics are explicitly defined then individual travel times can be measured and modeled as a continuous distribution. This paper analyzes empirical travel time distribution (TTD) on two key interstates in the U.S.A. representing travel times for the morning and evening peak periods, during weekdays, aggregated at 5 min and 15 min levels, and during the months of March, April, and May for the years 2018, 2019, and 2020.
As previously stated, there is no universally accepted definition of TTR in the literature. However, most authors recognize that travel time has a distribution that varies as a function of several random and recurrent factors, and that TTR is a function of (i) the central tendency of the TTD, (ii) the amount of spread, or variability, of the TTD, and/or (iii) a combination of the central tendency and spread of the TTD (10–13).
It is important to note that there are many TTR metrics that are based on components of the underlying TTD ( 6 ). These include standard statistical measures, such as the measures of central tendency (e.g., median, mean) and the measures of dispersion (e.g., standard deviation, interquartile range), and combinations of these two measures (e.g., coefficient of variation). They also include metrics specifically designed to capture different components of TTR, such as the travel time index, planning time index, buffer time, and the level of TTR. All of these metrics will be defined and discussed in subsequent sections.
Definition of TTR Metrics
Using a single statistical measure such as mean and median to define TTR has fallen out of favor by most transportation agencies. There is a myriad of reasons for this, including that using only one measure does not tell the full story of the performance of a roadway (7, 8, 12). This is particularly true now, given that recent advances in collection of travel time data allow transportation agencies access to much more comprehensive and robust travel time datasets. Numerous researchers have identified several non-statistical TTR metrics, and the more popular ones are defined below.
Travel Time Index (TTI)
TTI is shown in Equation 1 and is defined as the ratio of the mean travel time from the TTD to the mean travel time under free-flow conditions. The free-flow travel time can be defined as the period it takes a motorist to traverse a roadway from one point to another if there were no congestion or any bad roadway conditions.

where
t = Time period. In this paper, the time period t = 1 refers to the morning peak and t = 2 refers to the evening peak. Note that the length of each section within the time period examined is either 5 min or 15 min in length;
T = Total number of time segments examined;
s = Spatial representation identifier. Note that this length of interest could be a link, segment, or corridor. By definition, the numerator and denominator need to have the same spatial representation;
S = Total number of segments examined on a given corridor;
d = Direction indicator. For example, in this paper, d = 1 indicates eastbound (northbound) and d = 2 indicates westbound (southbound);
D = Total number of directions examined. For each corridor examined in this paper, D is set to two;
By definition, the TTI measures the ratio of the mean travel time on a roadway for a given time period, section, and direction compared with the mean travel times under free-flow conditions for the same conditions. Therefore, it is assumed that a more reliable roadway will have TTI values close to one, all else being equal. In other words, the higher the TTI the greater the congestion or travel delays. According to Schrank et al. ( 14 ), TTI is one of the most widely used TTR metrics, particularly when analyzing the effect of roadway operational improvements.
Planning Time Index (PTI)
This is defined by Equation 2 as the ratio of the 95th percentile travel time of the TTD to the mean travel time under free-flow conditions. The PTI compares the “near worst” travel time conditions to the free-flow travel times.

where
As may be seen from Equation 2, the PTI quantifies the extra time needed by motorists, compared with free-flow conditions, to ensure on-time arrival 95% of the time.
Buffer Index (BI)
The BI is also a ratio-based metric as shown in Equation 3. The numerator is the difference between the values of the 95th percentile travel time and the mean travel time of the TTD which is often referred to as the buffer time. The denominator is the mean travel time of the TTD. The BI attempts to quantify the extra, or buffer, time an average motorist would need on top of the mean travel time value to ensure on-time arrival ( 11 ).

where
Level of Travel Time Reliability (LOTTR)
The LOTTR is defined in Equation 4, and it may be seen that it is the ratio of the 80th percentile travel time to the 50th percentile travel time of the TTD.

where
It may be seen from Equation 4 that the LOTTR is a direct function of the measure of dispersion as it quantifies the relationship between the median value and the 80th percentile value of the TTD. Consequently, one could assume that higher values of LOTTR imply longer travel times or higher measures of dispersion values compared with the median values, all else being equal. It is important to note that LOTTR is used as one of the key mobility indicators recommended in the MAP-21 Act ( 1 ) and the FAST Act ( 2 ) to assess the performance of national highways in the U.S.A. It was found that, for a set of arterial roadways in Nebraska, the LOTTR was highly correlated to both the interquartile range and the standard deviation of TTD ( 7 ).
Coefficient of Variation (COV)
The COV is a commonly used standard statistical measure. It is defined by Equation 5 and has been proposed as a measure of TTR ( 6 ). However, according to the FHWA, it is difficult for the general public to comprehend the meaning of COV, as well as other standard statistical measures such as the interquartile range (IQR), and consequently, FHWA does not advocate its use ( 11 ).

where
In this paper, the effect of COVID-19 interventions on the TTR performance of key Interstate highways will be analyzed. Specifically, the changes in both TTR metrics and standard statistical measures will be tested statistically and discussed. To the authors’ knowledge, only one previous study, Rilett et al. ( 7 ), has tested the sensitivity of different TTR metrics to changes in demand. Unlike that study, where four arterial corridors in Nebraska were analyzed, this paper is focused on the effects of the pandemic on freeway TTR. These effects were studied on two high traffic volume freeway corridors in the Los Angeles region of California and the Chicago region of Illinois.
Travel Time Data and Methodology
Historically, freeway travel time data were collected by public sector agencies. However, with the recent advancements in travel time data collection technologies (e.g., cell phones, navigation systems, etc.), private sector sources produce more detailed travel time information across a greater geographic area and the data are relatively inexpensive to obtain. Recently, FHWA selected INRIX, a private sector company, as a vendor that will provide traffic data for use by state and regional agencies for TTR, congestion, and emission analysis ( 15 ). In other words, the INRIX travel time data has been identified as the baseline dataset that is used by state transportation agencies to meet the federal congestion and freight performance reporting regulations.
In this paper, the INRIX travel time data on two major freeway corridors in the U.S.A. were used for the TTR analysis. By way of background, the INRIX travel time is obtained from a variety of data collection sources including traffic sensors, probe vehicles, and their own Smart Dust Network ( 16 ). In other words, INRIX leverages its location and movement data from millions of connected vehicles, trucks, and mobile devices ( 17 ). The INRIX travel time is derived as the ratio between the segment length and the harmonic average speed for all reporting vehicles on the segment ( 17 ). The data is provided as a function of various vehicle types including passenger cars and trucks at a variety of spatial, and temporal aggregation levels. The analyst may choose to aggregate at various levels including 5 min, 10 min, 15 min, 1 h, and daily. In this paper, both truck and passenger car travel time data on two of the most traveled corridors in the U.S.A. were obtained. Two data sets, one at a 5 min aggregation level and the other at a 15 min aggregation level, were examined because these aggregation levels are commonly used by transportation agencies for analysis purposes. Note that it is assumed that the only difference between the 5 min and 15 min data sets is the aggregation level and that the underlying individual travel times used are the same.
It is important to note that, in this paper, the TTD is based on the average travel time estimated for the given aggregation levels. For example, the 5 min TTD consists of 5 min average travel times over the analysis period for the travel segment being analyzed. For the remainder of the paper it is assumed that all TTD refer to distributions of average, and not individual, travel times. In addition, when the mean and standard deviation of a TTD is discussed, these refer to the mean and standard deviation of a distribution of average, and not individual, travel times.
It is important to note that the variability in a given TTD is a direct function of the level of temporal aggregation and spatial segmentation. For example, the variance of a TTD using a 5 min aggregation level is anticipated to be higher than the variance of a TTD using a 15 min aggregation level, all else being equal ( 18 ). Standard statistical measures, such as variance, are a function of aggregation level, which is the reason why the HCM has historically used one standard level of aggregation (e.g., 15 min) in all its models ( 12 ). Choosing a standard aggregation level allows researchers to compare traffic data without first having to convert their data to a common aggregation level. The effect of temporal aggregation (5 min versus 15 min) on the sensitivity of the TTR metrics will also be tested in this paper.
Figure 1a shows the Interstate 90 (I-90) corridor from Chicago, Illinois to Rockford, Illinois, and Figure 1b shows the Interstate 405 (I-405) corridor from Los Angeles, California to Mission Viejo, California. These corridors were selected because they are two of the top 15 most traveled corridors in the U.S.A. ( 8 ). According to the FHWA ( 8 ), the 2019 Annual Average Daily Traffic on I-90 and I-405 were 321,700 and 383,500, respectively. The length of sections of the I-90 and I-405 corridors that were analyzed are 75 mi and 73 mi, respectively.

Maps of test corridors: (a) I-90 and (b) I-405.
It is important to note that INRIX spatially disaggregates roadways into a series of segments. In this paper, the travel time data were obtained for each coded INRIX segment that makes up the corridor. To obtain the average travel time across the entire corridor for a given time segment (e.g., 9:00–9:15 a.m.), the average travel time for the given time segment was summed for each spatial segment that makes up the corridor. Separate travel time data sets were compiled for each of the two corridors, for both directions, and for two peak periods (e.g., morning and evening). Consequently, for each year there were eight separate travel time data sets. In addition, because the data were collected for three different years (e.g., 2018, 2019, and 2020) a total of 24 TTDs were obtained. Lastly, because two aggregation levels (e.g., 5 min and 15 min) were examined, a total of 48 TTDs were analyzed in this paper. In summary, a total of 100,864 periods were studied which consisted of 75,648 of the 5 min periods and 25,216 of the 15 min periods. Each of these periods had an average travel time, that was provided by INRIX, which was based on the individual travel time data.
It is also important to note that INRIX reports on the number of vehicles or samples used to estimate every average value of the travel time. For the test corridors, the travel time for each 5 min period is an average of five to nine reporting vehicles (probes). Interesting, there were no periods where an average travel time was not provided. It was hypothesized that this occurred because of the high traffic volumes on both corridors.
Comparison of TTDs
Table 1 shows the standard measures of central tendency and dispersion for the 48 TTDs that were analyzed. The columns represent the traffic movement and the peak period under consideration, whereas the rows are the standard metrics for a given year. Not surprisingly, all the measures of central tendency (e.g., the mean and median) were lower in 2020 as compared with the same periods in 2018 and 2019. The mean travel times observed in 2020 decreased by an average of 34%, and the decrease ranged from 15% to 49%. Similarly, the median values decreased by an average of 38% and this decrease ranged from 16% to 57%. Compared with the findings by Rilett et al. ( 7 ) on arterial roadways, the average percentage decrease in average travel time on the tested freeways was approximately 30% greater for both the mean and median analyses. It should also be noted that the average differences between the mean and median values were less than 1% before the pandemic. However, the difference increased to 7% in 2020. This implies that the TTDs became less symmetric because of the pandemic, and this phenomena will be discussed later in this paper.
Standard Measures of Central Tendency and Dispersion

Note: NB = northbound; SB = southbound; EB = eastbound; WB = westbound; AM = morning peak hours; PM = evening peak hours. *The percentage change is estimated as the quotient of (i) the difference between the 2020 value and the average of the 2018 and 2019 values, and (ii) the average of the 2018 and 2019 values.
Another key finding is that the decrease in the mean and median values was approximately 8% higher during the evening peak periods as compared with the morning peak periods. It was hypothesized that this occurred because traffic volumes are relatively higher in the evening peak periods ( 19 ). Table 1 lists the values and changes in two standard measures of dispersion, the standard deviation, and the IQR, for all of the 48 TTDs. The average decrease in standard deviation values when the 2020 values were compared with the 2018 and 2019 values was 21% and this reduction ranged from 5% to 38%. In contrast, the average decrease in the IQR was considerably higher at 76% and this decrease ranged from 64% to 87%. The IQR is often preferred as a measure of dispersion, as compared with other metrics such as the standard deviation because it is more robust to outliers ( 20 ). Interestingly, the percentage changes in standard deviation were lower than the percentage changes in the measures of central tendency. The opposite trend was found for the IQR.
The Welch t-test and the Kolmogorov–Smirnov (KS) test were used to determine whether there were statistically significant differences between the TTD in 2020 and the corresponding TTDs in 2018 and 2019. Specifically, the Welch t-test showed that the differences in mean travel times in all possible comparisons across the 48 TTD were statistically significant at the 95% confidence level. Similarly, the results from the KS test showed that the differences in the cumulative distribution functions for all possible comparisons were statistically significant at the 95% confidence level.
Figures 2 and 3 show the cumulative distribution function (CDF) of the average travel times observed on the Chicago I-90 test corridor and the California I-405 test corridor, respectively. The peak periods for both the 5-min aggregation analysis and the 15 min aggregation levels for all of the analysis periods are shown on the graphs. Not surprisingly, the 2020 TTD is shifted to the left with the measures of central tendency (e.g., median or 50th percentile) values lower than the respective value for the 2018 and 2019 TTDs. It may also be seen that there are no practical differences between the 50th percentiles when the underlying TTDs are formulated by 5 min or 15 min aggregation of average travel times.
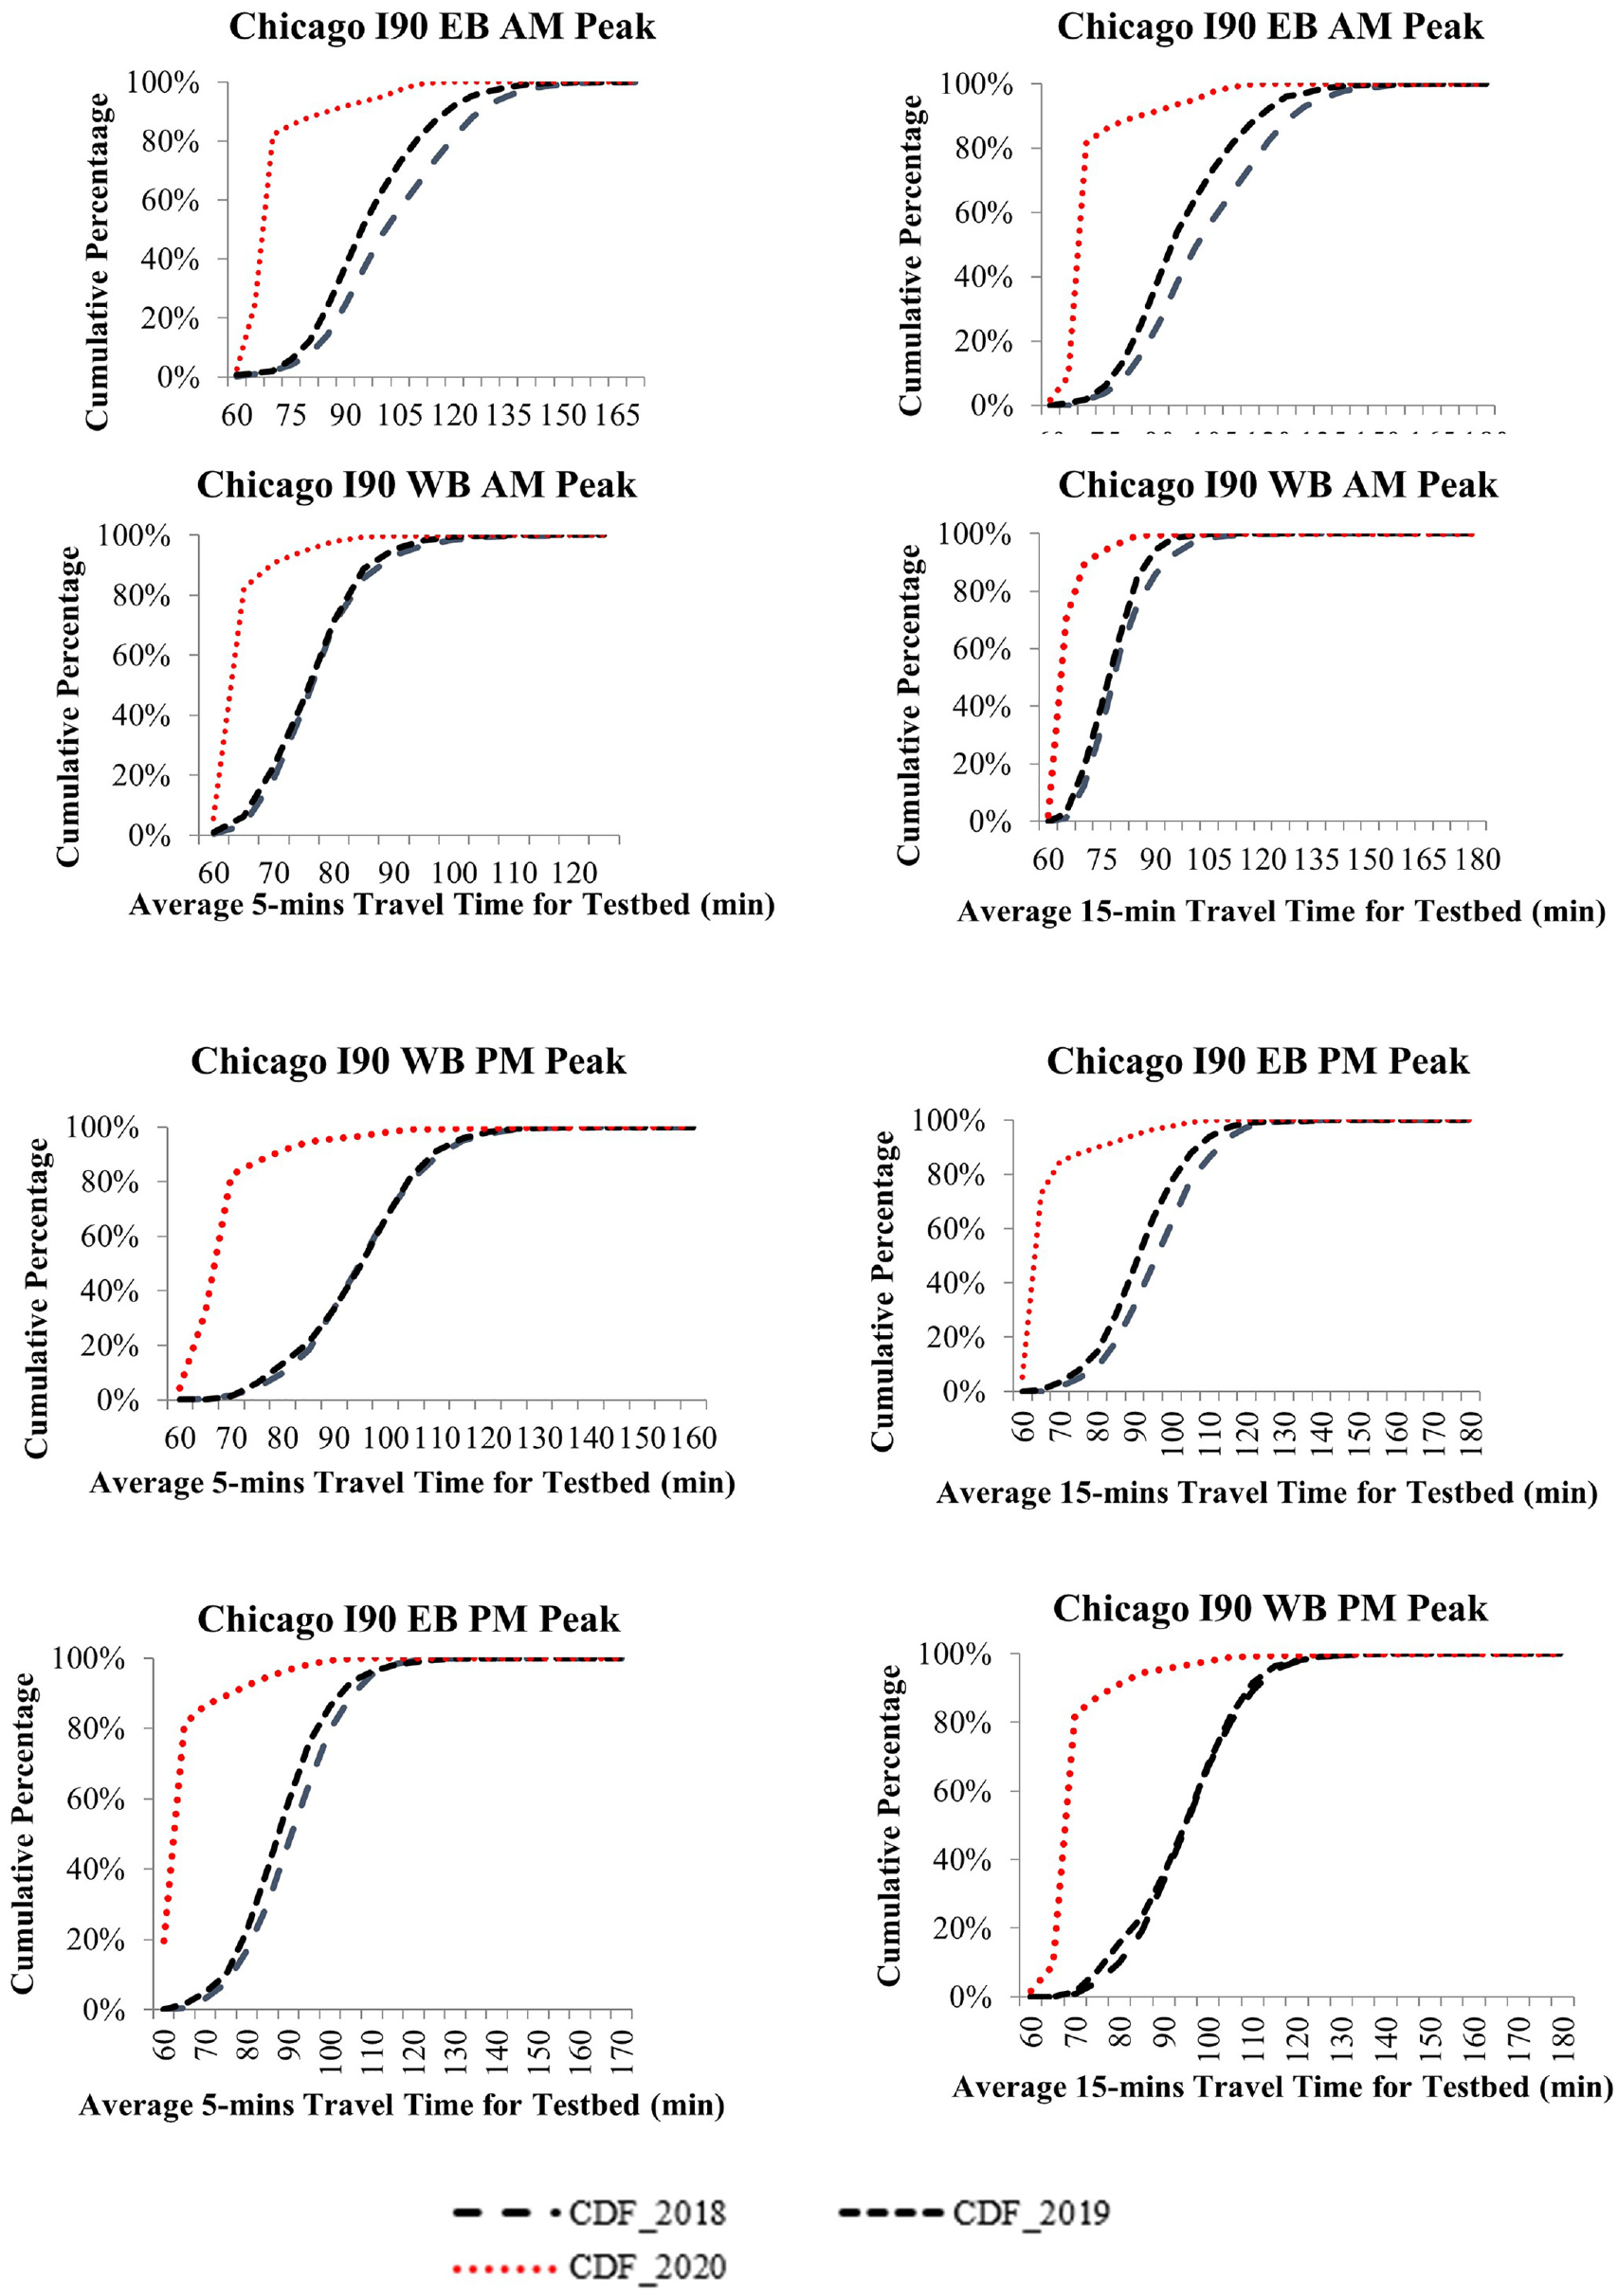
Travel time distributions per time period on I-90 test corridor.

Travel time distributions per time period on I-405 test corridor.
The plots of all of the frequency distribution corresponding to Figures 3 and 4 and Table 1 of the average travel times for both test corridors are presented as Supplemental Material to this paper. Figure 4 shows a standard boxplot of the TTD for the California I-405 NB AM peak for a 5 min and 15 min aggregation level, respectively. The 75th percentile, the median, and the 25th percentile travel time values represent the top, middle, and bottom of each box plot, respectively.

Standard boxplot of the travel time distribution on I-405 (NB AM Peak).
Figure 4 shows that the pre-2020 freeway TTDs were more symmetrical than the 2020 TTD. This phenomenon is in contrast to the arterial roadway analysis where it was found that the TTDs were more symmetrical during the pandemic ( 7 ). It is hypothesized that this difference may occur because arterial roadways and Interstate highways have different traffic flow characteristics which are caused by both geometry and vehicle composition. For example, arterial traffic flow conditions are characterized by regular stops and yields at relatively short distances and therefore there may not be significant speed differences between vehicle types (e.g., trucks and passenger cars) compared with freeways. In addition, there is traditionally a much lower proportion of heavy vehicles on arterial roadways during peak periods. Consequently, the resultant TTD will be different and the differences between the mean and median values, which is a measure of symmetry, will not be as great on arterial roadways as compared with Interstate freeways.
From Figure 4, it may be seen visually that the average TTDs are considerably different during 2020 than those observed in 2018 and 2019. Specifically, the 2020 TTDs may be categorized as having relatively longer tails. It is hypothesized that this is because of the greater reduction in passenger vehicles as compared with trucks during the COVID-19 pandemic ( 21 ). It should be noted that commercial tractor-trailer combinations often have speed limiters that regulate trucks’ top speeds to be considerably lower than the speed limit, all else being equal ( 22 ). In other words, the reduction in demand caused by the COVID-19 pandemic might not affect these heavy vehicles’ top speed. It is hypothesized that this effect explains why the percentage change in the standard deviation was not as large as the changes found in the arterial roadway analysis. It may also be seen that the median values and the IQR of the average TTD in 2020 are 42% and 84% lower than the corresponding values in the preceding years. Similar differences in TTD statistics were obtained when all of the other 42 TTDs were compared as detailed in Table 1.
It can easily be argued that because both the measures of central tendency and the measures of dispersion decreased in 2020, as compared with the preceding 2 years, the freeway testbeds were more reliable during the COVID-19 pandemic. In other words, a typical road user experienced lower average travel times with less variability during the COVID-19 pandemic as compared with the same period in the prior 2 years. This general result was found for both the 5 min and 15 min aggregation analyses. This phenomenon and the effect on TTR metrics are explored in subsequent sections.
Analysis of Temporal Aggregation Effects on TTD
Pre-Pandemic Analysis
It is evident from Table 1 and Figures 2–4 that there were no practical differences in the measures of central tendency between the 5 min and the 15 min aggregated TTDs for all 48 scenarios studied. Specifically, the mean values increased by an average of 1.5% and the percentage increase ranged from 0.0% to 5.7% when a 15 min aggregation, as opposed to a 5 min aggregation, was used to construct the TTDs. Similarly, the median values increased by an average of 1.6% and the percentage increase ranged from 0.1% to 5.8%. In other words, the aggregation level did not appreciably affect the measures of central tendency.
Unlike the measures of central tendency, it may be seen from Table 1 that aggregating from a 5 min to a 15 min level had more of an effect on the measures of dispersion. Specifically, the average percentage decrease in the standard deviation values was 3.1% and this decrease varied from 0.0% to 9.5%. Similarly, the IQR decreased by an average of 3.5% and this decrease ranged from 0.3% to 7.6% when a 15 min aggregation, as opposed to a 5 min aggregation, was used. These results are not surprising because it is well known that information is lost when data are aggregated and this loss of information will have a greater effect on the values of the measures of dispersion as compared with the measures of central tendency (13, 23).
During Pandemic Analysis
Similar to the pre-pandemic period, no appreciable differences were found in measures of central tendency when the travel time data was examined at a 5 min level of aggregation as compared with a 15 min level of aggregation. However, unlike the pre-pandemic results where there were increases in the mean and median values, the mean and median values in the pandemic period decreased by an average of 1.7% and 1.2%, respectively. This decrease ranged from 0.3% to 3.3% and 0.2% to 2.4% for the mean and median values, respectively.
Like the pre-pandemic period, the effect of aggregation level on the measures of dispersion during the pandemic was slightly higher than that of the measures of central tendency. Specifically, the standard deviation increased by an average of 5.3% when a 15 min aggregation level, as opposed to a 5 min aggregation level, was used and the increase ranged from 0.8% to 9.4%. Similarly, the interquartile range decreased by an average of 3.5% and the decrease ranged from 0.0% to 6.9%. That the IQR was not as affected by aggregation level is not surprising because it is well known that the IQR is a more robust measure of dispersion ( 20 ).
In summary, aggregating the data from 5 min to 15 min data did not appreciably affect the measures of central tendency (e.g., less than 2% on average) but did have an effect on the measures of dispersion (e.g., approximately 4% on average). The effect of this phenomenon on standard TTR metrics will be examined in the next section.
Estimation of TTR Metrics
Table 2 shows the values of the five TTR metrics that were calculated for all the 48 TTDs. It may be seen that the TTI values and the PTI values experienced an average reduction of 34% and 23%, respectively, during 2020. The decrease in values ranged from 15% to 49% for the TTI and from 17% to 28% for the PTI. These results are not surprising because, by definition, the TTI and PTI are a function of the mean and the spread of the TTD, respectively. Because both of these latter measurements decreased because of the pandemic so too did the TTR metrics that are based on them. Note that the decrease was less pronounced for the PTI because it is, by definition, related to the spread of the distribution which had a relatively lower percentage decrease in 2020 than the mean. It is important to note that TTI is a direct function of the level of congestion or travel delay. Therefore, a decrease in the TTI implies a reduction in travel delay during the COVID-19 pandemic.
Estimated Travel Time Reliability Metrics

Note: NB = northbound; SB = southbound; EB = eastbound; WB = westbound; AM = morning peak hours; PM = evening peak hours. *The percentage change is estimated as the quotient of (i) the difference between the 2020 value and the average of the 2018 and 2019 values, and (ii) the average of the 2018 and 2019 values. All positive changes are italicized.
From Table 2 it may be seen that the LOTTR values decreased, on average, by 3% during the COVID-19 pandemic. The only exception was the evening peak periods on the I-405 testbed where the LOTTR was found to increase by an average of 5%. In other words, the I-405 corridor actually became less reliable, as defined by the LOTTR, in the evening peak periods during the pandemic. Similar to the findings on the arterial roadway ( 7 ), the LOTTR had the lowest percentage reduction compared with the TTI and PTI metrics. The decrease in LOTTR ranged from 2% to 12%. Note that this relatively small change was related to the finding that the 80th percentile travel time and the 50th percentile travel times tended to decrease by the same relative amount (e.g., approximately 40%) during the pandemic on the highway corridors examined in this paper.
It is clear from this analysis that the LOTTR reliability metric was relatively insensitive to changes in demand caused by the COVID-19 pandemic. This is, by definition, problematic because it is one of the codified measures of TTR performance listed in the U.S. Code of Federal Relations (e.g., 23 CFR § 490.511) ( 24 ). It can be argued that because the LOTTR could not identify the large changes in TTR reliability it should be used with caution when analyzing other changes to the freeway system—such as the effect of adding capacity or implementing demand management measures.
The average increase of the BI values in 2020 was 89% and ranged from 5% to 216%. Similarly, the COV values increased by an average of 25% in 2020 and this increase ranged from 4% to 78%. In summary, the BI and COV metrics indicated that TTR decreased during the pandemic. Earlier it was argued by the authors that, regardless of the TTR definition used, TTR improved during the pandemic. The counterintuitive results provided by the BI and COV analysis is therefore problematic. It is unlikely that any traveler or traffic engineer would argue other than that TTR increased in March, April, or May of 2020 compared with the same periods in 2018 or 2019. Consequently, the BI and COV metrics should be used with caution when comparing TTR changes across different years.
It is important to note that the BI and COV metrics attempt to capture similar phenomena—that is, the ratio of the change in a measure of dispersion of the TTD to that of a measure of central tendency of the TTD. It is therefore not surprising that both the BI and COV increased during the COVID-19 pandemic because, as shown earlier, the measures of dispersion increased at a greater rate than the measures of central tendency.
It is hypothesized that the increases in the BI and COV values on freeways were caused by the higher percentage of trucks on the roadways during the pandemic ( 21 ). That is, the decrease in travel demand was higher for passenger cars than for freight vehicles. As such, truck travel times had a greater weight in 2020 on these metrics than in previous years. Given that trucks tend to (i) travel more slowly than passenger cars and (ii) have less variability in travel times, all else being equal ( 25 ), this may have skewed the travel time statistics and affected the BI and COV estimates. Without a more detailed analysis of the underlying factors, it is difficult to say definitively why this difference in the rate of change between the mean and standard deviation occurred. It is clear that these differences in rate of change were the driving force behind the counterintuitive conclusions described above.
The analysis of the TTI, PTI, and LOTTR metrics on the freeway testbeds during the pandemic showed results similar to those of the earlier arterial roadway corridors analysis ( 7 ). In contrast to the arterial study, the BI and COV values generally increased during the COVID-19 pandemic, which did not occur on the arterial roadways ( 7 ).
Analysis of Temporal Aggregation Effects on TTR Metrics
Pre-Pandemic Analysis
It may be seen from Table 2 that there were no appreciable differences in the TTI values between the 5 min and the 15 min aggregated TTDs of all the 48 TTDs. Specifically, the TTI values increased by an average of 1.4% and the percentage increase ranged from 0.0% to 5.6% when a 15 min aggregation level was used instead of a 5 min aggregation level. As previously explained, the TTI values are directly related to the mean travel times. Therefore, that the differences between the 5 min and 15 min TTI values were similar is not surprising because the same effect was noted in the travel time mean analysis, as described earlier. Similarly, the PTI values increased by an average of 1.7% and the percentage increase ranged from 0.0% to 7.0%. In other words, the aggregation level did not appreciably affect the TTI and PTI values.
Practically, the LOTTR remained essentially unchanged during the pre-pandemic period regardless of which aggregation level was used. Specifically, the LOTTR values increased by an average of 0.1%, across all 48 scenarios, when a 15 min aggregated level was used as compared with a 5 min aggregation level. The BI values did not show any specific decreasing or increasing trends with respect to the aggregation level used. The COV values decreased by an average of 3.7% and this decrease ranged from 0.0% to 9.5%. It is hypothesized that this occurs because, as shown earlier, the aggregation level did not have an appreciable effect on the measures of central tendency but did have an effect on the measures of dispersion. Because the COV is a function of both measures, then it would be expected that data aggregation would affect the results, all else being equal.
During Pandemic Analysis
Similar to the pre-pandemic period, no appreciable differences were found in TTI, PTI, and LOTTR metrics (e.g., less than 3% average change) between the 5 min aggregation level and the 15 min aggregation level. However, there was on average a 13.8% and 6.1% increase in the BI values and the COV values, respectively, when the travel time data was aggregated at a 15 min level as compared with a 5 min level.
In summary, the level of aggregation was shown to affect the BI and COV metrics but not the TTI, PTI, and LOTTR metrics. Therefore, selecting the appropriate temporal aggregation level for metrics that combine measures of dispersion and measures of central tendency is critical. These results show the importance for the analyst to have a deep understanding of the underlying TTDs and the underlying theory for the chosen TTR metrics when evaluating freeway systems.
Spatial Aggregation Analysis
As previously stated, the selected test corridors are among the most traveled highways in the United States as measured by AADT. In addition, the testbeds are part of the major U.S. truck freight corridors and therefore have relatively high truck volumes ( 26 ). The earlier analyses in this paper examined TTR from the perspective of the entire corridor. Logistics companies, for example, would tend to be more interested in the performance reliability of longer corridors. However, it can be easily hypothesized that analyzing long corridors may dampen the impacts of any localized effects. In other words, traffic movements may not be continuous because there are many origin–destination patterns with a mixture of heavy and less congested segments on a given corridor.
Consequently, a spatial analysis was also conducted. Specifically, the I-90 test corridor was divided into 10 segments. However, because of space limitations, the subsequent sections focused on the analysis of three segments with different congestion levels as measured by AADT. In addition, only the westbound evening peak traffic movement at the 15 min aggregate scenario was considered.
Figure 5 shows the location of the selected segments and the origin and destination intersections/ramps. The segment lengths for SEG1, SEG2, and SEG3 are 6.7 mi, 7.0 mi, and 5.2 mi, respectively. SEG1 is located within the central business district of Chicago while the starts of SEG2 and SEG3 are located approximately 23 mi and 45 mi from the end of SEG1 respectively. As would be expected, the further a segment is from downtown Chicago, the lower the traffic volume. For example, the AADT volumes for SEG1, SEG2, and SEG3 are 195,800, 136,400, and 56,300, respectively ( 27 ).
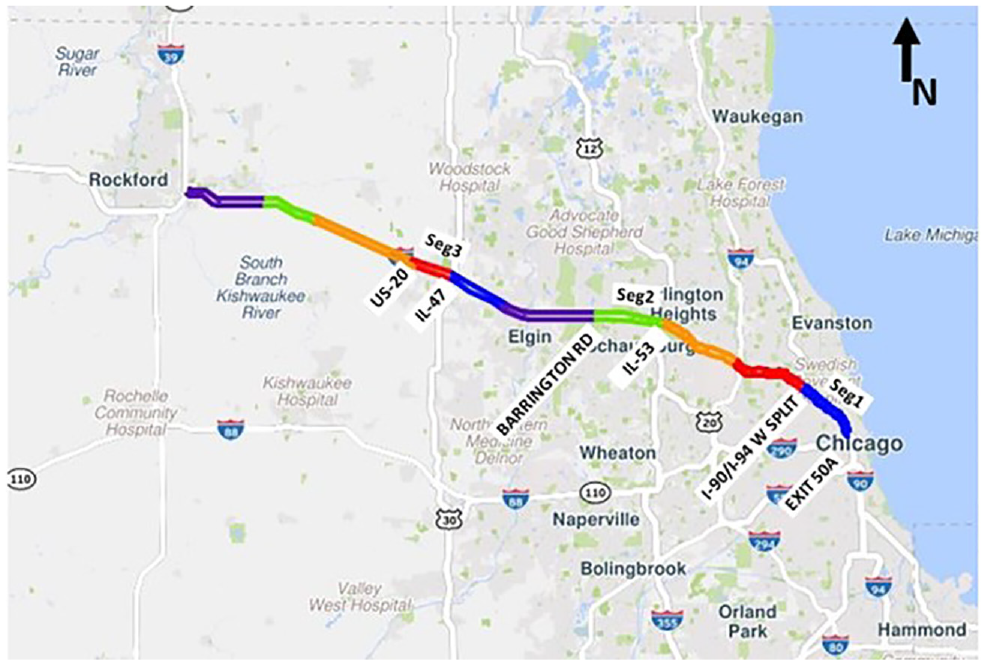
Map of I-90 test corridor showing spatial segmentations.
Table 3 shows both the descriptive statistics of TTD and the corresponding TTR metrics as a function of spatial segmentation and the analysis year.
Segment Travel Time Distribution Statistics and Travel Time Reliability Metrics

Note: SD = standard deviation.
The percentage change is estimated as the quotient of (i) the difference between the 2020 value and the average of the 2018 and 2019 values, and (ii) the average of the 2018 and 2019 values. All positive changes are italicized.
Table 3 shows that, before the COVID-19 pandemic, the more congested segments tended to have longer travel times. As expected, the segments that experienced the highest pre-pandemic congestion levels also had the greater decrease in the mean travel time (e.g., a measure of central tendency) and standard deviation of travel time (e.g., a measure of dispersion) during the pandemic, all else being equal. Specifically, the mean travel times were reduced by 67%, 14%, and 6% for SEG1, SEG2, and SEG3, respectively. Similarly, the standard deviation values were reduced by 63%, 56%, and 44% for SEG1, SEG2, and SEG3 respectively. More data and detailed analysis will be required to confirm whether similar patterns with respect to congestion hold true for other Interstate highway corridors.
The TTR metrics for the spatial aggregation analysis generally show similar trends to the findings for the analyses of the entire corridor. For example, the TTI and PTI values, similar to the measures of central tendency and dispersion, increase with congestion. In particular, the pre-pandemic TTI values indicate that the mean travel times were more than 2.5 times the free-flow travel time for SEG1 and approximately 1.1 times the free-flow times for SEG2 and SEG3. Similarly, the PTI values before the pandemic imply that the 95th percentile travel times were more than 4.1 times the free-flow condition for SEG1 and less than 2.0 times for both SEG2 and SEG3. The TTI and PTI, have been used as a surrogate measure of congestion ( 11 ). If true, then SEG1 was more congested than both SEG2 and SEG3.
It was found that the LOTTR values were not very sensitive to large changes in AADT. For example, while the changes in the TTI and PTI metrics were over 60% when the pre-pandemic and pandemic periods were compared, the change in LOTTR was less than 15% when a similar comparison was made. Also, while SEG2 has a 30% higher AADT value than SEG1, there was only a 2% change between their corresponding LOTTR values.
It is important to note that the BI and COV values for SEG1 (e.g., the most congested segment) increased during the pandemic, indicating that TTR on this segment actually decreased during the pandemic. For SEG2 and SEG3, the least congested segments, the opposite was found. It can be hypothesized that using the BI and COV to analyze TTR might be more problematic on highly congested roadways than on less congested roadways, all else being equal.
The above findings indicate a common problem with using the BI and COV metrics for measuring reliability. That is, the only way to understand the changes in these two TTR metrics for a given situation is to have a deep understanding of how the measures of central tendency and measures of dispersion are changing. For instance, it was shown on the congested segment that reliability decreased during the pandemic, as measured by the BI, because the measures of dispersion decreased at a greater rate than the measures of central tendency, all else being equal. It is easy to hypothesize that the drivers on this corridor would think that TTR improved because both their mean travel time and travel time variance decreased. It is easy to argue that concentrating on these latter metrics (e.g., mean, standard deviation) will be more useful to the analyst than focusing solely on the BI and COV values.
TTR Analyses: Lessons Learned
It is clear from the above analyses that all of the commonly used TTR metrics are based on the underlying characteristics of the TTD. These could be a measure of central tendency, a measure of dispersion, or a combination of both. By definition, the TTR metrics measure different attributes of the TTD and therefore an analyst may come to different conclusions on TTR performance based on what metric they choose to use. For the test corridors discussed in this paper, the TTI, PTI, and LOTTR metrics showed that TTR improved during the pandemic, albeit at different rates. In fact, the LOTTR, which is the reliability metric preferred by the U.S. Department of Transportation for the performance evaluation of the National Highway System, was found to be relatively insensitive to the large changes in demand that occurred as a result of the pandemic. In other words, the LOTTR showed very little sensitivity to the large decreases in traffic volume that occurred in March through May of 2020. In contrast, the BI and COV indicated the opposite—that TTR decreased during the pandemic.
As shown earlier, a comparison of the TTDs indicated that both the mean travel time and standard deviation of travel time decreased during the pandemic across all segments, all corridors, and all-time period aggregation values studied. In other words, TTR improved during the pandemic regardless of what TTR definition is used. It is clear that the common TTR metrics highlighted in this paper can lead to different conclusions, all else being equal. This is, of course, problematic because the same data can lead an analyst to wildly different conclusions depending on what TTR metric they choose to use. In particular, the analysis of the LOTTR showed that TTR barely changed during the pandemic. More problematic, the COV and BI metrics showed TTR did not improve during the pandemic and, in fact, became considerably worse. Neither of these conclusions seem reasonable to the authors based on the earlier analysis of the TTDs.
Because of the above results, the authors advocate for the analyst first, if possible, to compare the TTD directly, rather than components of the distribution. As shown in this paper there are standard statistical techniques to infer whether there are any significant changes between two different TTDs. Examples of typical non-parametric tests include the Kolmogorov–Smirnov test, the Mann Whitney–Wilcoxon test, and Welch’s t-test. Subsequently, the analyst can compare statistically the measures of central tendency (e.g., mean, median) and measures of dispersion (e.g., standard deviation, IQR). Given that the IQR is less sensitive to outliers, it is worthwhile to consider using this measure of dispersion in place of the standard deviation. Regardless, focusing on the underlying TTDs will give the analyst all the information they require about changes in travel times. At this point, the analyst can examine the TTR metrics, if they choose, but with the understanding that the metrics may give counterintuitive conclusions if the analyst does not first have a deep understanding of the underlying TTDs.
As discussed in the paper, without examining the TTD first it was difficult to understand why some metrics showed large increases in TTR, one showed little change, and some showed increases. In addition, it is easy to understand how two different analysts could come to completely opposite conclusions about how TTR changed on an Interstate corridor during the pandemic if they used different TTR metrics.
Conclusion
This paper examined the effect of the COVID-19 pandemic on two of the most heavily traveled freeway corridors in the United States (i.e., Interstate 405 in California and Interstate 90 in Chicago). Specifically, the TTD and the corresponding TTR metrics during the peak of the COVID-19 pandemic, from March to May 2020, were compared with the same months in 2018 and 2019.
The INRIX travel time data on these test corridors within the morning peak (6:00–10:00 a.m.) and evening peak (3:00–7:00 p.m.) periods in both directions of travel were used to formulate TTDs. These TTDs were then used in the corresponding reliability analysis. The average 5 min and 15 min aggregate travel times were used to formulate the TTDs. A total of 48 TTDs were formulated—which comprises 16 different scenarios, each having three TTDs for the 2018, 2019, and 2020 analysis periods.
The results show that there were statistically significant differences, at the 95% confidence level, between TTD in 2020 and corresponding TTDs in 2018 and 2019. In all 16 scenarios, the measures of central tendency (e.g., mean and median) and the measures of dispersion (e.g., standard deviation and IQR) were reduced during the COVID-19 pandemic compared with the previous 2 years pre-pandemic period. Specifically,
In all the 16 scenarios, the average TTD median and IQR values were reduced by an average of 38% and 76%, respectively. Similarly, the mean and standard deviation values were all reduced by an average of 34% and 21%, respectively. Based on the TTD analysis, it was concluded that the reliability performance of the test corridors improved during the COVID-19 pandemic, regardless of which TTR definition is used.
The commonly used TTR metrics, for example, TTI, PTI, and LOTTR, improved during the pandemic by an average of 34%, 23%, and 3%, respectively (i.e., TTR increased). In contrast, BI and COV increased by 89% and 25% during the pandemic (i.e., TTR decreased). It was shown that these differences occurred because each TTR metric provides information on different components of the underlying TTD.
In summary, it was shown that the reliability performance of the two Interstate freeway corridors during the pandemic is a function of which TTR metric was selected. The LOTTR reliability metric was relatively insensitive to changes in demand caused by the COVID-19 pandemic. This is, by definition, problematic because LOTTR is one of the codified measures of TTR in the Code of Federal Relations (e.g., 23 CFR § 490.511). It can be argued that because the LOTTR could not identify the large changes in TTR reliability it should be used with caution when analyzing other changes to the freeway system—such as the effect of adding capacity or implementing demand management measures.
3. The effect of data aggregation on the results was also examined. From a practical perspective, it was found that there are there were marginal changes, of approximately 3% or less, when TTDs were developed using a 15 min aggregation level as compared with a 5 min aggregation level. In contrast, the relative values of BI and COV increased by approximately 14% and 6%, respectively during the pandemic as the travel time data aggregation size used in the analysis increased from 5 min to 15 min.
4. It was found that the improvements in TTR, as measured by the TTI, PTI, and LOTTR metrics, were greater on the segments that were most congested during the pre-pandemic time frames.
The paper has demonstrated the effect of the COVID-19 pandemic on freeway travel time and the associated TTR metrics. The major conclusion is that freeway managers should have a deep understanding of the underlying TTDs, the key parameters (e.g., mean, standard deviation), and the definitions of the different TTR metrics when analyzing changes in TTR. As shown in this paper, relying on a single TTR metric may be problematic.
This paper has also demonstrated the need for a universally accepted definition of TTR. Without one, researchers and system operators may reach contradictory conclusions about changes in TTR as a function of changes to the traffic corridors. The difficulty is that TTR has multiple attributes. For the corridors studied in this paper, both the mean travel time and the travel time variance decreased during the pandemic, albeit at different rates, and it was clear that TTR improved. However, a comparison of TTR using the BI and COV TTR metrics came to the opposite conclusion. A well-formulated TTR definition, that clearly addresses the trade-offs between changes in measures of central tendency (e.g., mean, median) and changes in dispersion (e.g., variance, IQR), is needed. This definition should also acknowledge a common temporal aggregation level and, possibly, a standard spatial aggregation level.
A more detailed analysis of the effect of spatial segmentation on TTR applied to other corridors is recommended for future studies. It will also be worthwhile to conduct a more intensive study on the underlying factors, specifically related to the different vehicle classes operating on the freeways, that caused the changes seen in the dispersion of travel times found in this paper. In particular, it would be interesting to study the reasons behind the many outliers observed in the pandemic TTDs. In addition, a detailed analysis of the effect of changes in volume and capacity on TTR performance will be valuable to transportation analysts.
Supplemental Material
sj-pdf-1-trr-10.1177_03611981221090929 – Supplemental material for High Volume Freeway Travel Time Reliability and the COVID-19 Pandemic
Supplemental material, sj-pdf-1-trr-10.1177_03611981221090929 for High Volume Freeway Travel Time Reliability and the COVID-19 Pandemic by Ernest Tufuor and Laurence Rilett in Transportation Research Record
Supplemental Material
sj-pdf-2-trr-10.1177_03611981221090929 – Supplemental material for High Volume Freeway Travel Time Reliability and the COVID-19 Pandemic
Supplemental material, sj-pdf-2-trr-10.1177_03611981221090929 for High Volume Freeway Travel Time Reliability and the COVID-19 Pandemic by Ernest Tufuor and Laurence Rilett in Transportation Research Record
Footnotes
Acknowledgements
The authors appreciate the assistance of the Nebraska Department of Transportation for the INRIX data.
Author Contributions
The authors confirm contribution to the paper as follows: study conception and design: E. Tufuor, L. Rilett; data collection: E. Tufuor; analysis and interpretation of results: E. Tufuor, L. Rilett; draft manuscript preparation: E. Tufuor, L. Rilett. All authors reviewed the findings and approved the final version of the manuscript.
Declaration of Conflicting Interests
The author(s) declared no potential conflicts of interest with respect to the research, authorship, and/or publication of this article.
Funding
The author(s) disclosed receipt of the following financial support for the research, authorship, and/or publication of this article: The research was made possible through the funding of the U.S. Department of Transportation and the Mid-America Transportation Center [25-1121-0005-058].

Data Accessibility Statement
Some or all data, models, or codes used during the study were provided by a third party. Direct requests for these materials may be made to the provider as indicated in the Acknowledgments.
Supplemental Material
1. Interstate 90 (I-90) Frequency Distribution of Average Travel Times (minutes).
2. Interstate 405 (I-405) Frequency Distribution of Average Travel Times (minutes).
Supplemental material for this article is available online.
The contents of this paper reflect the views of the authors, who are responsible for the facts and accuracy of the information presented in the paper, and are not necessarily representative of the Nebraska Department of Transportation.
References
Supplementary Material
Please find the following supplemental material available below.
For Open Access articles published under a Creative Commons License, all supplemental material carries the same license as the article it is associated with.
For non-Open Access articles published, all supplemental material carries a non-exclusive license, and permission requests for re-use of supplemental material or any part of supplemental material shall be sent directly to the copyright owner as specified in the copyright notice associated with the article.
