
Abstract
Exploring and analyzing safety influencing factors can guide targeted traffic safety management. Traditional traffic safety models are aimed at specific data problems and making adjustments to the model structure, which lack focus on predictive ability and have limited information on the analysis of influencing factors. In recent years, machine-learning methods have opened new avenues in modeling that have higher prediction accuracy, can identify complex nonlinear relationships, and can overcome over- and under-dispersion and correlation. Machine-learning methods, however, pose the problem of limited interpretability. The interpretable machine-learning framework SHAP can be an effective solution, which can not only reflect the influence of features in each sample but also generate global interpretation. This study established gradient boosting models including the CatBoost and XGBoost models as traffic safety models, which were compared with a traditional NB regression model and a zero-inflated negative binomial regression model. SHAP was used to analyze several safety influencing factors, including geometric design features, traffic operation characteristics, time of day, and land use. Results confirmed that the CatBoost model has better prediction ability and is a more suitable traffic safety model than the traditional negative binomial regression model. Among the key findings were that ramp type is the most important factor in freeway crash frequency; curve presence has a great positive impact, while truck proportion has a great negative impact; and traffic volume is highly correlated with truck proportion. These findings can provide theoretical support for safety operation management and targeted improvement measures for freeways.
With the freeway’s advantages of high-quality traffic facilities, large traffic flow, and comfortable operation, freeway construction in China entered a rapid development stage in the late 1980s and has sustained that development. From 16,300 km in 2000 to 150,000 km by the end of 2020, the average annual growth rate reached 6700 km per year ( 1 ). Unfortunately, this rapid development brought with it increasingly prominent safety problems and a high death toll ( 2 ). Establishing traffic safety models to analyze the relationship between freeway crashes and influencing factors is essential to guide traffic management departments to carry out targeted safety management.
In the early stages of traffic crash modeling, negative binomial (NB) regression models, which consider the non-negativity and over-dispersion of crash data, dominated research. With the passage of time and progression in research, other data problems such as underlying heterogeneity and correlation caught the attention of the researchers, and many studies developed models targeted for various data problems. To manage underlying heterogeneity, the random effects model, random parameters model, and finite mixture model have been used ( 3 ). To consider spatial correlation and temporal correlation, existing studies have mainly used the spatial autoregressive model ( 4 ) and spatial–temporal interaction model ( 5 ).
However, these studies are often aimed at solving specific data problems that require certain model structure adjustments, making it difficult for them to consider multiple data problems at the same time. Some complex models have been developed that can deal with multiple data problems, but they tend to have poor transferability to other databases. In addition, because the focus of these studies is on the adjustment of the model structure, they often lack consideration of the model’s predictive ability and provide limited analysis of influencing factors.
In recent years, machine-learning methods, with their improvement in accuracy and handling of large-scale data, have provided new opportunities for establishing traffic safety models and exploring safety influencing factors. Machine-learning methods usually have higher prediction accuracy than traditional statistical models ( 6 ), can identify complex nonlinear relationships between independent variables and dependent variables ( 7 ), have good transferability ( 8 ), and can overcome the problems of over-/under-dispersion and correlation ( 3 , 9 ). Gradient boosting, such as CatBoost and XGBoost, is a powerful machine-learning technique that has achieved state-of-the-art results in a variety of practical tasks. Among the various gradient boosting methods, CatBoost outperforms the others with respect to quality and can successfully handle categorical features ( 10 ).
However, machine learning also has the problem of limited interpretability of safety influencing factors, but the interpretable machine-learning framework SHAP (SHapley Additive exPlanations) can be an effective solution ( 11 ). Compared with the interpretation of variables in traditional statistical models, SHAP can not only reflect the positive and negative influence of the features in each sample, but also generates global interpretation tools, including feature importance, summary plots, feature dependence, and interactions, which can be used to comprehensively analyze the comparative influence among safety influencing factors on crashes.
Therefore, to accurately explore and analyze safety the influencing factors of the freeway, this study established a CatBoost and an XGBoost traffic safety model based on electronic toll collection (ETC) data and compared them with a traditional NB regression model and a zero-inflated negative binomial (ZINB) regression model. The interpretable machine-learning framework SHAP was used to analyze the safety influencing factors of road geometric design, traffic operation characteristics, and time of day. The results of this study can thus provide more comprehensive technical support for future freeway safety management.
Literature Review
Safety Influencing Factors on Freeways
The occurrence of traffic crashes is a complex process, which is affected by various factors, including geometric design features and traffic operational characteristics. Identifying and analyzing the key factors influencing freeway safety allows targeted measures to be taken to improve safety.
One of the major factors is roadway geometric design, which contains horizontal, vertical, and cross-section alignment. Horizontal alignment mainly includes curves and ramps. Previous research has shown that the crash risk on curved segments is higher than on straight segments ( 12 ). In addition, the crash risk of ramp segments is higher than that of general mainline segments: the greater the number of ramps, the higher the crash risk. Different types of ramps have different effects on crashes ( 13 ). Vertical alignment is also an important influencing factor on freeway safety, as, for example, crashes increase with the steepness of longitudinal slope ( 14 ). One of the main cross-section alignment factors is the number of lanes. However, there is no consensus on the relationship between the number of lanes and traffic crashes. Some studies have shown that the number of lanes is negatively correlated with traffic crashes, while some have shown opposite results ( 15 , 16 ). Moreover, some studies have shown that the relationship between the number of lanes and traffic crashes is not a simple linear relationship ( 17 ).
Traffic operational characteristics, including traffic volume, average speed, and truck proportion, compose the external traffic environment that drivers need to deal with directly during driving. Studying the relationship between traffic operational characteristics and crashes can provide a theoretical basis for encouraging effective traffic flow and improving freeway safety measures. Previous research has shown that large traffic volume leads to an increase in crash frequency ( 18 ). However, there is no consistent conclusion about the correlation between the average speed and crashes. Some studies have shown that average speed is positively correlated with traffic crashes, while other studies have found that higher speed can be associated with decreased crashes ( 12 , 19 ). The relationship between truck proportion and crashes also shows quite different results. A positive correlation has been found in some studies, while others have shown negative correlations ( 20 , 21 ).
Traffic Safety Models for Freeways
It is very important to select the appropriate traffic safety model to explore and analyze the relationships between safety influencing factors and crashes. The structure of the model is closely related to the characteristics of crash data, and many typical data problems can emerge in the process of modeling, including over-dispersion, under-dispersion, underlying heterogeneity, and temporal and spatial correlation ( 3 ).
Multiple linear regression was initially used for the traffic safety modeling, but the linear regression model could not accurately describe the non-normal distribution of the number of crashes, the non-negative characteristics of the number of crashes, and the small probability of the crash event ( 22 ). Generalized linear models (GLMs), such as the Poisson and NB models, are often used to analyze traffic characteristics and crash frequency. The Poisson model is the most basic counting model ( 23 ), which considers the characteristics of random, dispersed, and non-negative crash data, and generally requires that the mean value of the crash data is equal to the variance. However, the crash data are often over-dispersed, that is, the mean is less than the variance, which violates the basic assumption of the Poisson model that the mean is equal to the variance ( 24 ). The NB model, in contrast, can deal with over-dispersion crash data because of the introduction of an error term in the equation ( 25 ).
To solve more complex data problems, many studies adjusted the model structure according to a specific problem to establish a more effective model. To address underlying heterogeneity, random effects models, random parameters models, and finite mixture models were developed ( 3 ). Correlation problems, such as temporal and spatial correlations, are also because of underlying heterogeneity. To build a traffic safety model, crash data needs to be gathered within a certain spatial and time range. Many fixed temporal and spatial factors that affect the occurrence of crashes cannot be observed, collected, or included in the model; that is, they cannot be captured by the existing independent variables in the model. However, these characteristics are still retained in the crash data. Therefore, a spatial autoregressive model was developed to capture spatial correlation in data ( 4 ), and a spatial–temporal interaction model was developed to deal with the interaction of temporal and spatial correlation ( 5 ). Over the course of time, however, traffic safety research has been expanding from dealing with only a single data problem to dealing with multiple data problems simultaneously ( 26 ), which has led to increasing demand for a high-order model structure.
At the same time, machine-learning models have been gradually introduced, and they tend to have higher prediction accuracy than traditional statistical models. Tang et al. ( 6 ) evaluated the transfer learning techniques of two-stage TrAdaBoost.R2, which showed better predictive performance and adaptability to a small sample size than the NB model. Chang and Chen ( 9 ) developed a classification and regression tree (CART) model to analyze crash frequency; they concluded that the CART model provided both theoretical and applied advantages over NB regression. Yehia et al. ( 8 ) examined the performance of the boosting techniques to transfer the crash prediction model between countries comparing with the conventional statistical regression models.
However, research using machine-learning models in freeway crash frequency analysis is still in its infancy, and researchers often face the problem of limited interpretation of influencing factors ( 27 ). In research fields other than traffic safety, some studies have used gradient boosting decision trees such as CatBoost and XGBoost combined with the interpretable machine-learning framework SHAP to mine the influence of feature variables ( 11 ). As noted earlier, CatBoost outperforms existing gradient boosting methods with respect to quality and is suitable for heterogeneous datasets with categorical variables and continuous variables ( 10 ). SHAP can generate the global interpretation, including feature importance, summary plots, feature dependence, and interactions, to explain the complex influence relationship between each feature and predicted values using the classic Shapley values from game theory and their related extensions ( 28 ).
Data Preparation
Freeway Selection and Analysis Units
This study focuses on the 100-km G15W freeway in Suzhou, China. To maintain consistency within analysis units, the freeway was split into homogenous segments according to the change in the number of lanes and the location of ramps. Based on the homogeneous division, the analysis units were divided into 1 km units to be maintained within a reasonable range. By considering each segment in both directions, the G15W freeway was divided into 197 homogeneous segments with an average length of 0.951 km.
Description of Independent Variables
This study selected geometric design features (number of lanes, ramp type, and curve type), traffic operation characteristics (traffic volume, average speed, and truck proportion), time of day, and land use as independent variables to analyze their relationships with crash data. The descriptive statistics are summarized in Table 1.
Descriptive Statistics of Variables

Note: SV = single-vehicle; MV = multi-vehicle; vph = vehicles per hour; Min. = minimum; Max. = maximum; SD = standard deviation; NA = this variable has no unit.
Geometric Design Features
The roadway geometric design features in this study consisted of the number of lanes, ramp type, and curve type. ArcGIS was used to vectorize the segments based on the Baidu satellite map and street view map. Through spatial statistical analysis, the road geometry data of all segments of G15W freeway were collected, including the number of lanes, ramp type, and curve type. The number of lanes, ramp type, and curve type are all categorical variables.
Traffic Operation Characteristics
The traffic operation characteristics selected for this study included traffic volume, average speed, and proportion of trucks. Traffic volume and average speed were extracted from ETC data from May 13, 2022, to June 14, 2022. The ETC data contained a total of 275,963 rows of traffic volume data and 290,437 rows of average speed data with the timestamp, location of the ETC portal, and vehicle type. From this data, the proportion of trucks was calculated, and all traffic operation characteristics were matched to the research segments and aggregated into each hour, which is average in each segment over an hour. Thus, the traffic volume, average speed, and truck proportion for each hour for each of the 197 research segments were obtained.
There are obvious differences in the characteristics of crashes in different land use areas or at different times of the day. To consider the impact of land use and temporal distribution on crash likelihood, the land uses and times of day were included in the model dataset. The land use was classified as urban area and suburban area according to the urban boundary data of Suzhou City, China.
Crash Data
High-quality crash data is necessary to evaluate traffic safety. To ensure the quality of crash data, this study analyzed freeway crashes based on the crash table in the database of Tongji University’s Suzhou Traffic Crash Research, Judgment, and Warning System. The crash table contains all traffic crash records from the G15W freeway from May 13, 2022, to June 14, 2022, which can be divided into different crash types including single-vehicle (SV) and multi-vehicle (MV) crashes. The crashes were matched to the research segments by using the timestamp, milestone, and direction records in the table. The number of crashes that occurred per hour in each of the 197 research segments was thus obtained. The descriptive statistics are summarized in Table 1.
Methodology
Traffic Safety Models
This study used gradient boosting models, including the CatBoost and XGBoost models, to evaluate the safety of freeways, and also developed a NB regression model as a common traditional statistical model for comparison. Considering that the number of crashes per hour has many zeros, the ZINB regression model was also developed to compare with the gradient boosting models.
(1) NB regression model
For each sample


where
(2) ZINB regression model
With respect to the observed data that are characterized by a significant number of zeros, in most the cases, zero-inflated regressions offer better goodness of fit and have been broadly applied to traffic safety analysis, especially, the ZINB models ( 29 ). The ZINB distribution is presented as follows:
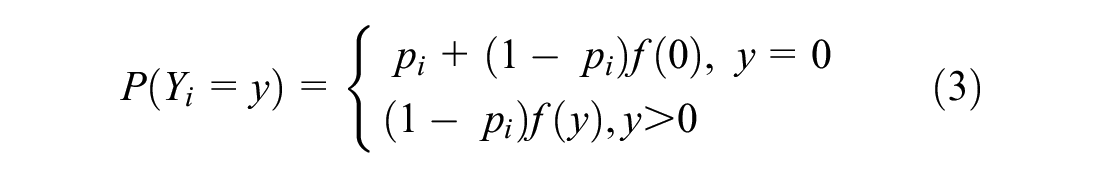
where
(3) CatBoost model
Gradient boosting is a powerful machine-learning technique that achieves state-of-the-art results in a variety of practical tasks. CatBoost, one of the gradient boosting methods, is a new open-sourced gradient boosting library that successfully handles categorical features; with respect to quality, CatBoost outperformed existing publicly available implementations of gradient boosting in a set of popular publicly available datasets ( 10 ). Since the dataset of this study contains a variety of categorical variables, the CatBoost model within gradient boosting methods was selected to build the traffic safety model.
CatBoost uses binary decision trees as base predictors. Two critical algorithmic advances introduced in CatBoost are the implementation of ordered boosting, which is a permutation-driven alternative to the classic algorithm, and an innovative algorithm for processing categorical features, which can solve the problem of prediction shift caused by the special kind of target leakage present in all currently existing implementations of gradient boosting algorithms ( 30 ).
The ordered boosting algorithm is defined as follows:
Step 1: Input n samples
Step 2: In the decision tree
Step 3: Train I decision trees and output the final model
As the method of processing categorical features, CatBoost uses the creative classification feature processing algorithm to generate new numerical features, which is defined as follows:
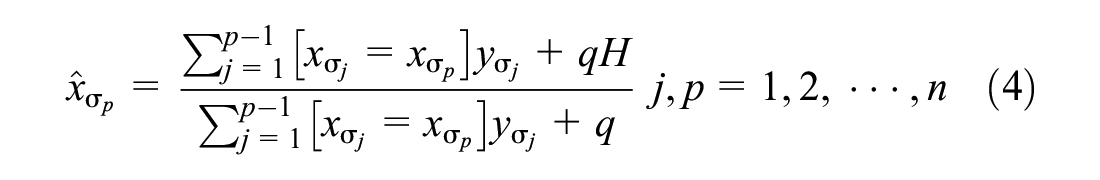
where
(4) XGBoost model
XGBoost is used for supervised learning problems, using training data to predict target variables. The model uses a decision tree as the base learner to build multiple weak learners, and continuously trains the model along the direction of decreasing the gradient during the iterative learning process. A Taylor series was applied successively to minimize the mean squared error as the loss function with a regularization term added to the objective function for controlling the accuracy and complexity of the model ( 31 ). The summation model of multiple decision trees can be used to express XGBoost; the formula is as follows:

Referring to the idea of logistic regression iteration, when the tth tree is added to the model, it can be expressed as follows:

Then the final tree structure was derived by generating K regression trees, and outputting the sample predicted value.
Model Performance Evaluation
The mean absolute error (MAE) and root mean squared error (RMSE) are the indexes that reflect the difference between the predicted crash number and the observed crash number. Generally, the MAE and RMSE are greater than or equal to 0. The smaller the MAE and RMSE values, the higher the prediction accuracy of the model. The definitions are as follows:


where
Interpretable Machine-Learning Framework, SHAP
Machine-learning methods have the problem of limited interpretability of influencing factors, which can be addressed using SHAP. SHAP constructs an additive interpretation model in which all features are regarded as “contributors.” For each prediction sample, the model generates a predicted value; a SHAP value is assigned to each feature in the sample, which can reveal the complex influencing relationships between each feature and predicted values ( 32 ).
The feature importance

where M is the number of input features, N is the set of all input features, S is the set of non-zero feature indexes (the features that are being observed and are not unknown), and
A feature’s SHAP value reflects its marginal contribution in different feature subsets; that is, when the SHAP value >0, it indicates that the feature improves the predicted value, but when the SHAP value <0, the feature has a negative effect.
Results and Discussion
Traffic Safety Models
In this study, gradient boosting models, including the CatBoost and XGBoost models, were used for the traffic safety model, and it was compared with the traditional NB regression model and the ZINB regression model using the MAE and RMSE as model performance evaluation indices. For the purpose of this paper, the dataset was divided into a training set and a test set, with a division ratio of 7:3. To avoid over fitting and improve the models’ performance, parameter tuning was used, and the parameter grid search method was adopted to optimize parameters. The gradient boosting models were developed using the machine-learning library CatBoost and XGBoost of the Python programming language. The results of the model performance evaluation are summarized in Table 2.
Model Performance Evaluation Results

Note: Parameters of CatBoost model: learning rate = 0.01, depth = 9, iterations = 200, loss_function = “MAE”; parameters of XGBoost model: learning_rate = 0.03, max_depth = 9, n_estimators = 200, min_child_weight = 7. MAE = mean absolute error; RMSE = root mean squared error; NB = negative binomial; ZINB = zero-inflated negative binomial.
As shown in Table 2, the MAE and RMSE of the CatBoost model are lower than that of the NB regression model, the ZINB regression model, and the XGBoost model. The performance of the CatBoost model was increased over the NB model by 52.5% according to the MAE, and by 7.5% according to the RMSE, both of which indicate that the CatBoost model has better prediction ability and is more suitable for the traffic safety model than the traditional NB regression model.
Safety Influencing Factors
Because the CatBoost model displayed better performance, it was used to explore and analyze the relationships between safety influencing factors and crash frequency. As mentioned, however, the prediction output of the complex black box machine-learning model is difficult to analyze. For this purpose, the interpretable machine-learning framework SHAP can be an effective solution.
SHAP is an additive interpretation model based on Shapley value theory, which is used to describe the marginal contribution of all variables in cooperative game theory. It calculates the marginal contribution of a feature when it is added to the model, and then takes a mean value that considers the different marginal contributions of the feature in all feature sequences. Note that the ordinate is not the value of dependent variable y, but rather the SHAP value. Compared with the interpretation of variables in traditional statistical models, SHAP has more abundant explanatory information, which can improve the reliability of prediction results of the model and reveal complex influencing relationships between the features and the predicted values. Not only can it explain a single prediction instance, but it can also generate a matrix from the SHAP value of each instance for global interpretation. More specifically, for a single prediction instance, it can reflect the influence of the features in each sample and show the positive and negative influence. For global interpretation, it includes feature importance, summary plots, feature dependence, and interactions, which can comprehensively analyze the relationship between safety influencing factors and crashes.
Therefore, to achieve the objectives of this study, SHAP was used to analyze the safety influencing factors of road geometric design, traffic operation characteristics, and time of day based on the trained CatBoost model. It is developed using machine-learning interpretability library SHAP of the Python programming language. Firstly, the feature importance plot was generated by taking the average of the absolute SHAP values of each feature as the importance of the feature. To see the difference in crash types, the plots of total crashes, SV crashes, and MV crashes were drawn respectively, as shown in Figure 1.
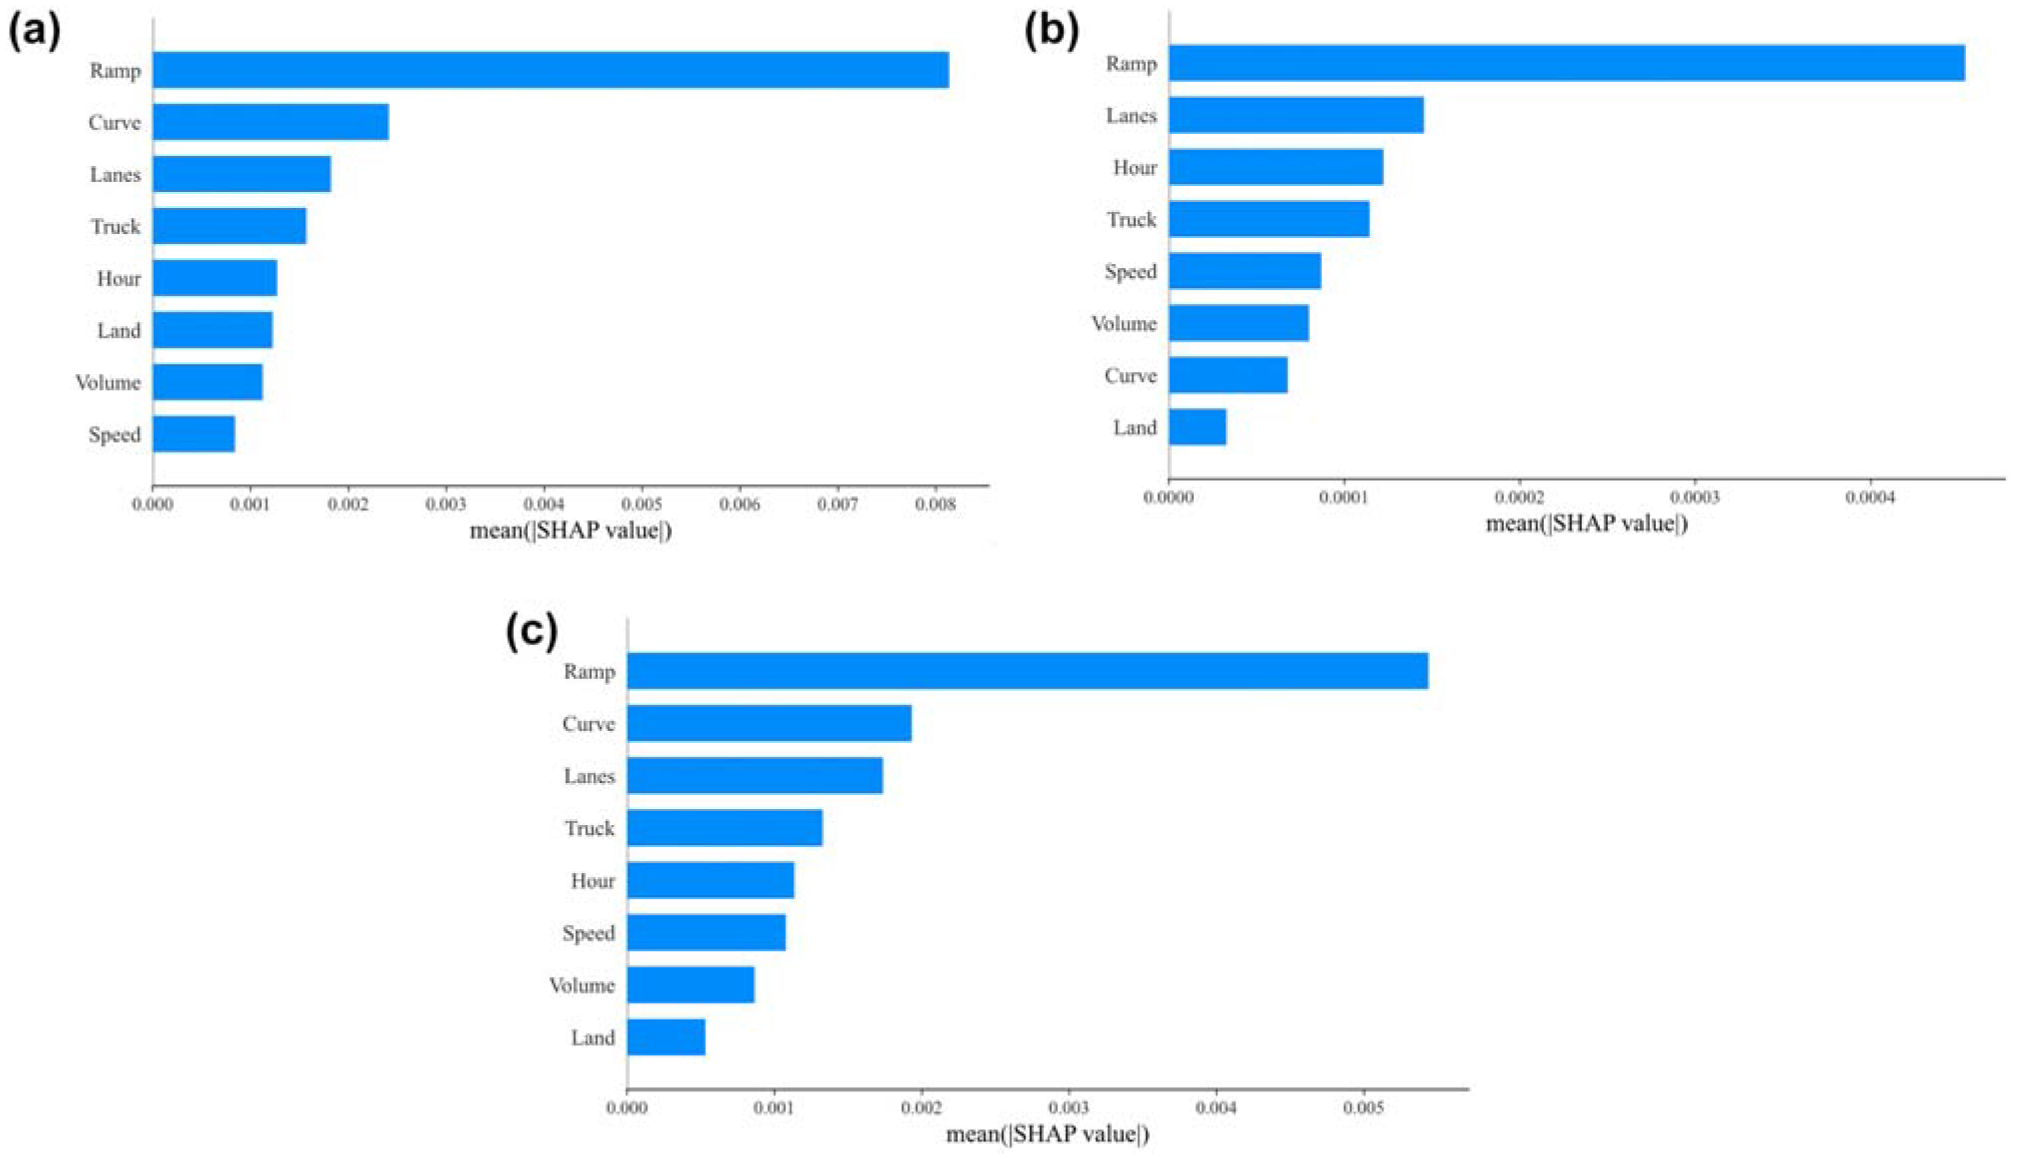
Feature importance plots: (a) total crashes, (b) single-vehicle crashes, and (c) multi-vehicle crashes.
It can be observed from Figure 1a that the presence of ramps is the most important factor in freeway crash frequency. In addition, the curve presence, number of lanes, and truck proportion affect the crashes moderately; the time of day, land use, traffic volume, and average speed have little influence on crashes. While most factors have shown similar influence in the previous literature, the small impact of traffic volume is not supported by previous research and needs to be further analyzed. As for different crash types, Figure 1, b and c, shows that ramp type is the most important factor in both SV crashes and MV crashes. However, unlike total crashes, SV crashes are greatly influenced by the time of day, while the importance ranking of MV crash influencing factors are almost the same as that of the total accidents.
To further understand the relationship between safety influencing factors and crash frequency, a summary plot of SHAP values is drawn using total crashes as an example, which shows the distribution of each feature’s SHAP value. The relationship between the value of each influencing factor and total crashes is presented using color coding. The summary plot of the SHAP value result is shown in Figure 2.

Summary plot of SHAP value results (color online only).
The results in Figure 2 show that ramps, curves, truck proportion, and land use have clear associations with crashes. In these four factors, the feature values are clearly separated between low (blue) and high (red). More specifically, crashes on freeways mostly happen near ramps; the more complex the ramp type in the road segment, the higher the number of crashes; there are more crashes on curved road segments than on straight road segments and more crashes in urban areas than in suburban areas. It is worth mentioning that truck proportion, however, is negatively correlated with crashes, which does not conform to the general perception but is consistent with some previous research results ( 21 ). In contrast, the overlapping colors for the number of lanes, time of day, traffic volume, and average speed show that these influencing factors do not have an apparent directional impact on crashes. The directional impact of these four features is mixed.
To further analyze the specific impact of the factors’ relationships with freeway crashes, SHAP partial dependence plots (PDPs) were drawn, as shown in Figure 3.

SHAP partial dependence plot results: (a) ramp type, (b) curve type, (c) number of lanes, (d) truck proportion, (e) hour of day, (f) land use, (g) traffic volume, and (h) average speed.
It can be observed from Figure 3a that there is a positive correlation between ramp type and crashes. Crashes are more likely to happen on the segments with ramps than the segments without ramps, which has an x-axis value of 0. Segments with more than one ramp are more likely to cause crashes than a single ramp (values 1 and 2). In segments with multiple ramps, segments with two entrance ramps (value 5) are the most dangerous, followed by two ramps, first in and then out (value 3), and finally two ramps, first out and then in (value 4).
Figure 3b shows that curved segments (value 1) have a positive impact on crashes, while straight segments (value 0) have a negative impact on crashes. Figure 3c demonstrates that, overall, there is a negative correlation between the number of lanes (the figure’s x-axis values correspond with the number of lanes) and crashes. The SHAP values of two-lane and three-lane segments one-way are higher than those with four and five lanes. In addition, most of the SHAP values of two lanes and three lanes are greater than 0, while about half of the SHAP values of four and five lanes are less than 0, which means that when the number of lanes is less than or equal to three, the factor has a positive impact on freeway crashes, whereas when the number of lanes is greater than three, the direction of influence of the number of lanes on crashes is uncertain.
It can be seen from Figure 3d that the truck proportion SHAP values presents a downward trend. Moreover, when the truck proportion is less than around 50%, most of the SHAP values are greater than 0, which indicates that the truck proportion affects freeway crashes positively. When the truck proportion is greater than 50%, however, most of the SHAP values are less than 0, which indicates that high proportions of trucks have a negative impact on crashes.
As for hour of day, it can be observed from Figure 3e that the peak of SHAP values occurs from 10 to 11 a.m. and from 7 to 8 p.m. In addition, most of the SHAP values from 10 to 11 a.m. and from 7 to 8 p.m. are greater than 0, which means that crashes are more likely to occur at that time. Most of the SHAP values at night and early morning are less than 0, which shows that there is a negative correlation between these periods and freeway crashes.
Figure 3f shows that an urban area (value 1) has a positive impact on crashes, while a suburban area (value 0) has a negative impact on crashes. Figure 3g depicts the SHAP values of traffic volume. Since the order of magnitude of traffic volume is larger than that of the other variables, the logarithm of traffic volume is used. Because the traffic volume has little influence on crashes, most of the SHAP values are close to 0. The SHAP values of traffic volume overall present a slight upward trend. Moreover, when the traffic volume is less than 500 vehicles per hour (vph), most of the SHAP values are less than 0, which indicates that low traffic volume has a negative impact on crashes. When the traffic volume is greater than 500 vph, most of the SHAP values are greater than 0, which indicates that a large traffic volume leads to an increase in crash frequency.
It can be seen from Figure 3h that when the average speed is higher than 60 km/h and lower than 120 km/h, which are the minimum and maximum speeds allowed on the freeway, respectively, overall, there is a positive correlation between average speed and crashes. When the average speed is higher than 60 km/h and lower than 100 km/h, most of the SHAP values are less than 0, which indicates that the average speed affects freeway crashes negatively. When the average speed is higher than 100 km/h and lower than 120 km/h, most of the SHAP values are greater than 0, which indicates that the average speed has a positive impact on crashes.
It is evident in this analysis that the relationships between crashes and most of the safety influencing factors are well defined, but the traffic volume results of this study, which show a small impact on crashes, as seen in Figure 1, are inconsistent with those of previous studies. Further analysis is thus needed. It can be inferred from Figure 3, d and g , that the effect on crashes of traffic volume is opposite the effect of truck proportion. Therefore, SHAP interaction values were used to reveal the interaction between the variables, as shown in Figure 4.
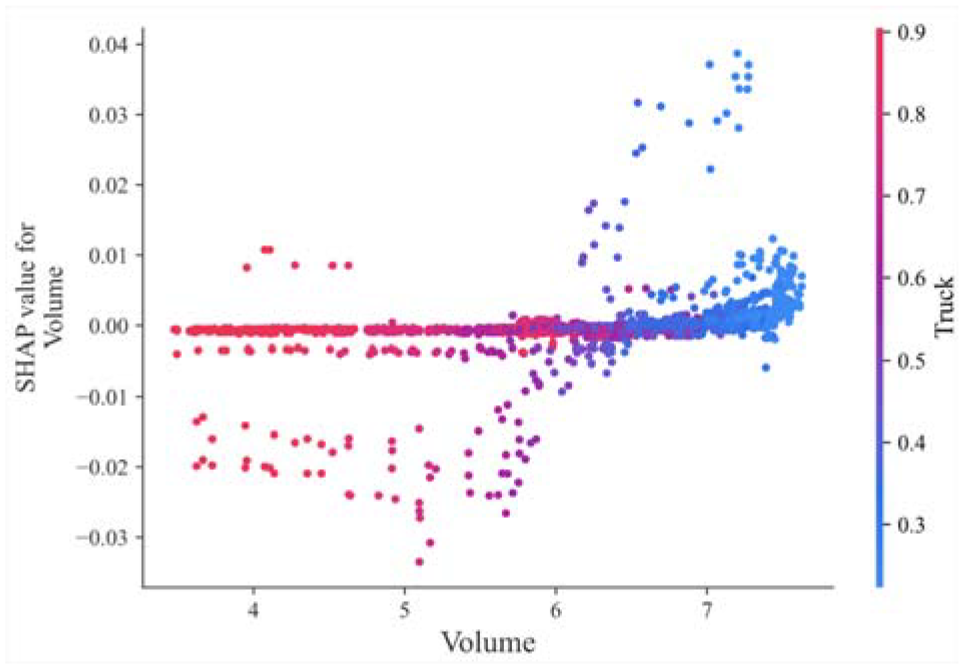
SHAP interaction value results of traffic volume and truck proportion.
It can be observed from Figure 4 that the value of traffic volume is highly correlated with the value of truck proportion. The higher the traffic flow, the lower the truck proportion becomes. Checking the collinearity diagnostics showed that the variance inflation factor (VIF) of traffic volume and truck proportion was 6.9, which indicated that there was significant multi-collinearity between the factors. Therefore, although the CatBoost model can address the multi-collinearity issue and has higher prediction accuracy ( 33 ), multi-collinearity can still make the estimation of a single variable’s contribution inaccurate.
Summary and Conclusions
This study utilized ETC data to explore and analyze the safety influencing factors on a freeway in China. To make use of the advantages of machine-learning methods, a CatBoost model was established as the traffic safety model, which was compared with the traditional NB regression model. The interpretable machine-learning framework SHAP was used to analyze the safety influencing factors from the categories of geometric design features (number of lanes, ramp type, and curve type), traffic operation characteristics (traffic volume, average speed, and truck proportion), hour of day, and land use. The results were then analyzed by using SHAP’s feature importance plot, summary plot, PDPs, and interaction values plots, which provided theoretical support for safety operation management and targeted improvement measures of freeways.
The important conclusions that can be drawn out of this study are as follows.
(1) The CatBoost model has better prediction ability and is more suitable for a traffic safety model than the traditional NB regression model. The performance of the CatBoost model showed an increase over the NB model by 52.5% and 7.5% according to the MAE and RMSE, respectively.
(2) Ramp type is the most important factor in freeway crash frequency; specifically, crashes on freeways mostly happen near ramps. In addition, the more complex the ramp type in the road segment, the more crashes are likely to occur.
(3) As for other geometric design features, curve type has a positive impact on freeway crashes, as there are more crashes on curved road segments than on straight road segments. The number of lanes affects crashes moderately: when the number of lanes is less than or equal to three, there is a positive impact on freeway crashes, but when the number of lanes is greater than three, the direction of influence of the number of lanes on crashes is uncertain.
(4) Of the traffic operation characteristics, truck proportion has a negative impact on freeway crashes, while traffic volume and average speed show little influence. The SHAP PDPs of traffic volume show that a large traffic volume led to a slight increase in crash frequency. The reason why the traffic volume in this study does not have a great impact on crashes, which is quite different from the conclusions of previous studies, is that it is highly correlated with truck proportion. Although the CatBoost model can address the multi-collinearity issue and has higher prediction accuracy, multi-collinearity can still make the estimation of the contribution of a single variable inaccurate.
(5) As for hour of day, crashes are more likely to occur from 10 to 11 a.m. and from 7 to 8 p.m. There is a negative correlation between night and early morning periods and freeway crashes. As for land use, there are more crashes in urban areas than in suburban areas.
These conclusions with respect to the safety influencing factors can help traffic management departments to take targeted traffic safety management measures, which can effectively improve freeway traffic safety. For example, the safety of ramps can be strengthened by ensuring safe sight distance and setting reasonably placed signs and markings. Also, traffic departments can add warning signs at curved segments and strengthen the supervision of trucks when the traffic volume is low. In addition, traffic police can focus on freeway safety in key time periods and strengthen on-site law enforcement.
There are several possible extensions to this study. Firstly, because of the limitation of data acquisition, the time range of this study is short. A longer time range can be selected in the future for a more accurate traffic safety model. Secondly, there are many other factors that also affect road safety, such as the vertical section type and the presence of electronic policing equipment. Incorporating more safety influencing factors into the CatBoost model can result in more comprehensive and accurate crash predictions.
Footnotes
Acknowledgements
The authors are grateful to Barbara Rau Kyle for her helpful edit.
Author Contributions
The authors confirm contribution to the paper as follows: study conception and design: J. Li, X. Wang, X. Yang, Q. Zhang, H. Pan; data collection: J. Li, X. Wang, X. Yang, Q. Zhang, H. Pan; analysis and interpretation of results: J. Li, X. Wang, X. Yang, Q. Zhang, H. Pan; draft manuscript preparation: J. Li, X. Wang, X. Yang, Q. Zhang, H. Pan. All authors reviewed the results and approved the final version of the manuscript.
Declaration of Conflicting Interests
The author(s) declared no potential conflicts of interest with respect to the research, authorship, and/or publication of this article.
Funding
The author(s) disclosed receipt of the following financial support for the research, authorship, and/or publication of this article: This study was sponsored by the Chinese National Science Foundation (52372335) and Director Fund of Key Laboratory of The Ministry of Public Security for Road Traffic Safety (2022ZDSYSZRJJ01).