



Abstract
Commercial motor vehicle (CMV) drivers often experience difficulties in turning and crossing at ramp terminals. CMV-involved crashes could cause queue spillback at ramp terminals and possibly nearby freeway mainline and crossroads. The safety and mobility of ramp terminals for accommodating CMVs is thus of significant importance. However, interchange ramp terminals have rarely been investigated in previous safety studies, especially with regard to CMV-involved crashes. This study aimed at examining CMV-related crashes that occurred at ramp terminals. Heterogeneous negative binomial (HTNB) and traditional negative binomial (NB) models were fitted and compared while developing a safety performance function (SPF) for predicting CMV crashes and identifying high-risk ramp terminals. Information on crash history and site-specific characteristics was collected at 285 ramp terminals in the state of Kentucky between 2015 and 2019. The results showed that the HTNB model outperformed the NB model in relation to various goodness-of-fit measures (e.g., likelihood ratio test “LRT”, Akaike information criterion “AIC” and McFadden Pseudo R-squared statistic). The predicted crash frequencies while applying the HTNB model were then used to identify and rank high-risk ramp terminals. Ramp terminals with signalized traffic control type, with greater average daily traffic on the exit ramp, with two or more traffic lanes on the exit ramp, and adjacent to commercial or industrial areas were found to experience more CMV crashes. Several safety countermeasures were proposed to alleviate CMV-involved crashes at ramp terminals. One example is ensuring the presence of physical medians on crossroads (or major roads) ahead of exits ramps.
According to the Federal Motor Carrier Safety Administration (FMCSA), 36,560 fatal crashes occurred on U.S. roadways in 2018 ( 1 ). Of these, 5,096 (or 14%) involved commercial motor vehicles (CMVs) ( 1 ), that is, large trucks and buses. Because of CMVs’ specific characteristics, such as mass and physical dimensions, crashes involving such heavy vehicles often result in severe injuries. Besides, CMV-involved crashes can cause traffic flow interruption, especially at interchange ramp terminals, where CMV drivers often experience difficulties in turning and crossing maneuvers ( 2 ). The Highway Safety Manual ( 3 ) defines a ramp terminal as an at-grade intersection where a freeway interchange ramp intersects with a non-freeway crossroad or major road (refer to Figure 1c). Based on the Washington ramp-related crash database, Torbic et al. reported that a higher percentage of ramp terminal truck crashes occurred on ramp exit ramps compared with entrance ramps ( 4 ). Nearly 80% of truck-related crashes were multiple-vehicle collisions, with rear-end and sideswipe same-direction crashes as the most common collision types. In the state of Kentucky similar findings were reached, as it was found that sideswipe same-direction and rear-end crashes comprised, respectively, 35% and 30% of total CMV crashes that occurred at ramp terminals during the years 2015 to 2019. This shows that CMV-related crashes play an important role in the design of ramp terminals (e.g., number of traffic lanes on the exit ramp and crossroad, and ramp terminal traffic control).
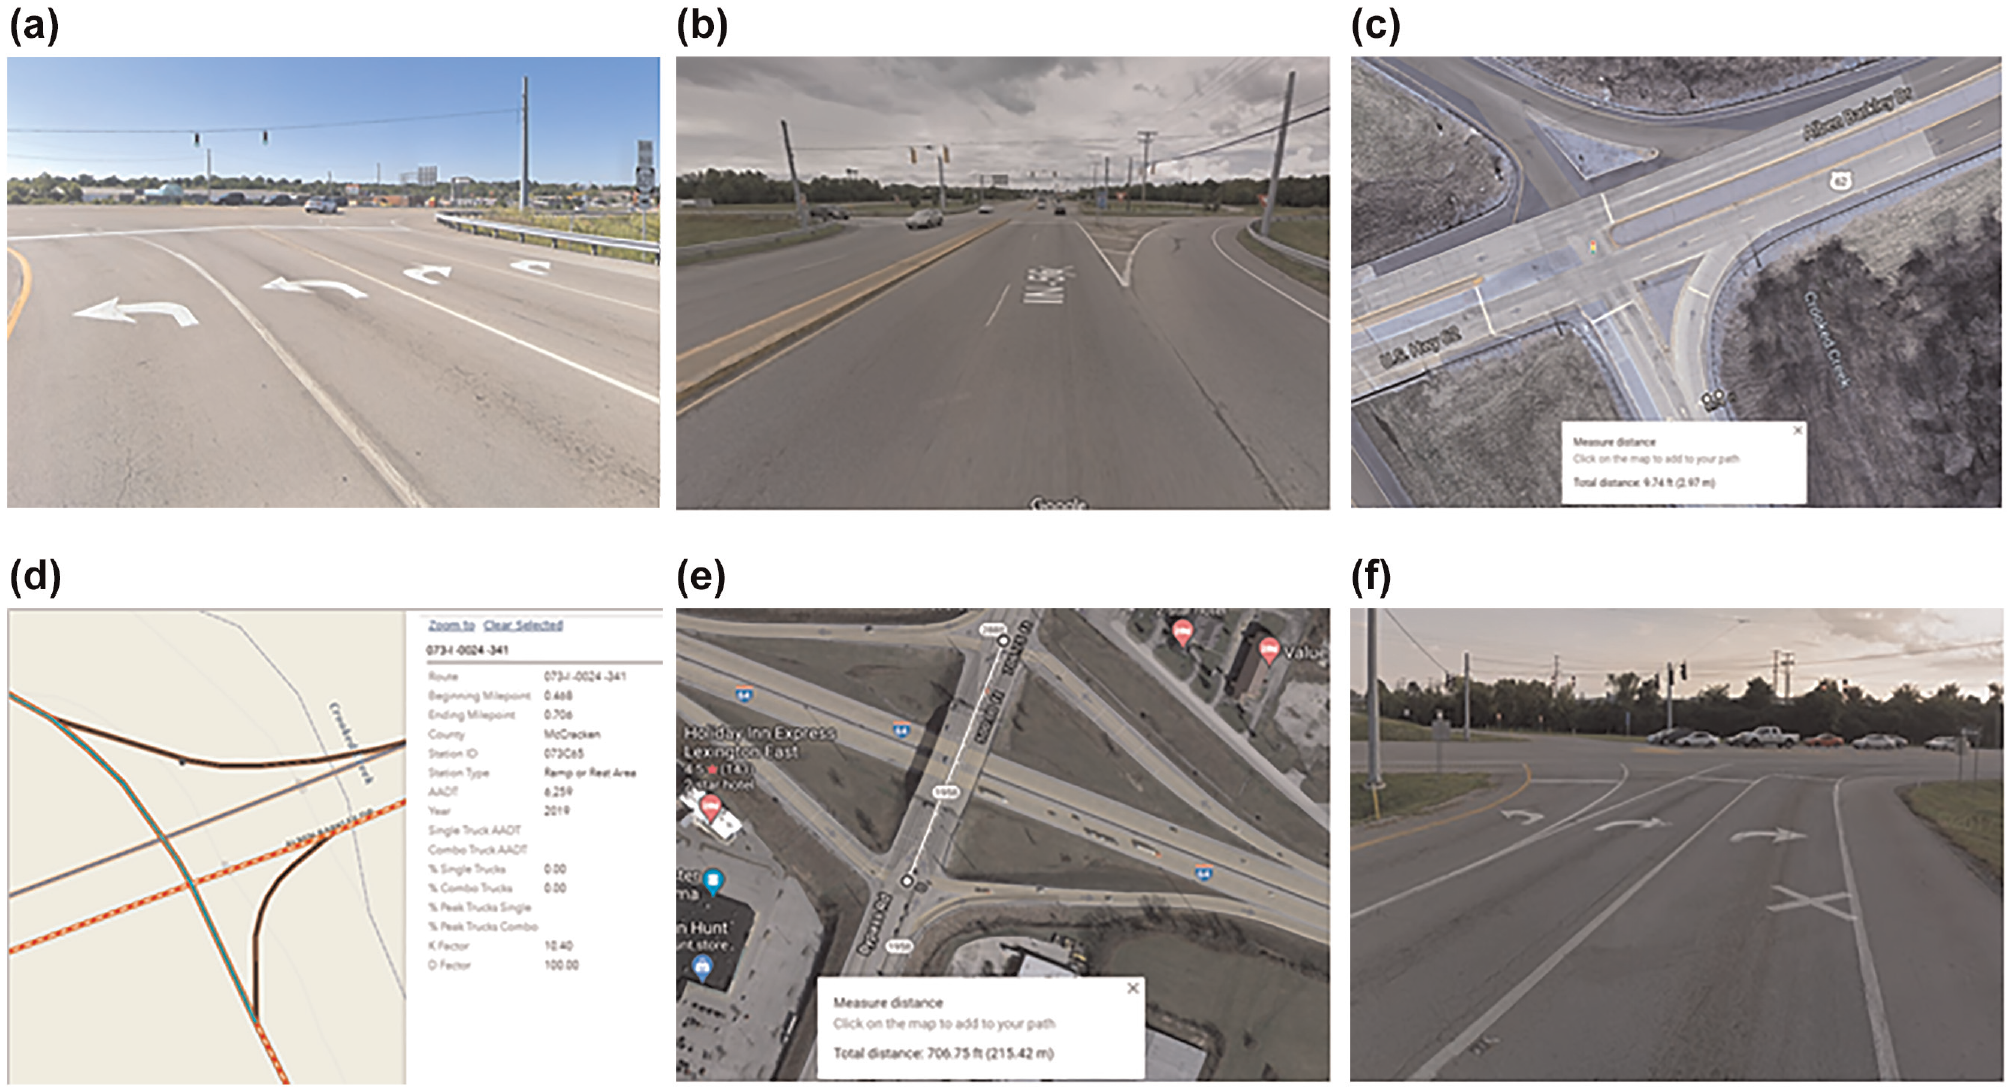
Sample ramp terminal data collection using Google Maps ( 5 ): (a) presence of exclusive right- and left-turn lane on exit ramp, (b) identifying number of through lanes on crossroad, (c) measuring right shoulder width on exit ramp, (d) identifying ramp and crossroad annual average daily traffic values using the Kentucky Transportation Cabinet Interactive Map, (e) measuring distance to adjacent ramp terminal, and (f) identifying ramp terminal traffic control type.
Ramp terminals involving CMV crashes often experience operational issues, such as inadequate queue spillback, which can be extended to nearby mainline freeway or crossroads ( 6 ). As a result, the safety and mobility of ramp terminals for accommodating CMVs is of significant importance. Safety performance functions (SPFs) are crash prediction models that can be applied to evaluate different transportation facilities (e.g., road links, intersections, etc.). SPFs relate the expected number of crashes for a specific road facility as a function of its site-specific characteristics and traffic conditions. SPFs are widely used in network screening, the estimation of crash modification factors, and the development and evaluation of safety countermeasures ( 7 ).
The review of the literature has shown that SPFs have rarely been developed at ramp terminals (notable exceptions are Parajuli et al. [ 8 ]; Claros et al. [ 9 ]; Lee et al. [ 10 ]), especially when involving CMVs. In other words, no SPF has yet been developed to serve as a benchmark for CMV-involved crashes at ramp terminals. Besides, the majority of previous studies have applied the conventional negative binomial (NB) model as an SPF tool in identifying high-crash locations. The NB model restricts the dispersion parameter to be fixed across all sites. It should be noted that the dispersion parameter plays an important role in the identification and ranking of high-crash locations, as it is used to compute the weight factor for the empirical Bayes (EB) method ( 11 ). Several previous studies have shown that, in many cases, the dispersion parameter can vary from one location to another as a function of site-specific characteristics ( 11 – 13 ). The assumption of fixed dispersion parameter may lead to biased SPF estimation results and incorrect identification of hazardous locations ( 14 ).
This study aims to fill the existing gap through developing an SPF at ramp terminals and identifying hazardous ramp terminals for CMV-involved crashes. For this, two standard NB and heterogeneous negative binomial (HTNB) models were fitted and compared. The HTNB model is a more flexible approach to account for unobserved heterogeneity while allowing the dispersion parameter to vary across the crash sites as a function of site-specific characteristics. Afterwards, the EB method was used to identify high CMV-crash ramp terminals, where the sites were ranked according to the excess expected crash (EEC) values. CMV crash data (2015–2019) were collected at 285 ramp terminals in the state of Kentucky and used in this study.
Literature Review
SPF Development
El-Basyouny and Sayed developed and compared the NB model and HTNB models in relation to model goodness-of-fit (GOF) and their application in the identification and ranking of high-crash locations ( 15 ). The study used crash data for 392 arterial segments located in British Columbia, Canada, covering the period from 1994 to 1996. The results showed that the HTNB approach outperformed the NB approach. Moreover, both models were very close in ranking high-crash locations. Lord and Park investigated how different functional forms, as well as fixed and time-varying dispersion parameters of the NB structure affected EB estimates ( 11 ). Two conventional NB and generalized NB (i.e., the NB with varying dispersion parameter) models were developed using crash data collected at rural three-legged intersections in California for a five-year (1997–2001) study period. The results showed that the EB estimates changed significantly for different functional forms. Furthermore, the NB model with a time-varying dispersion parameter resulted in better statistical performance in relation to GOF measures, as well as the identification of hazardous sites. Lu et al. developed and compared the simple and full SPF models, in which the former incorporated traffic volume only, whereas the latter included both traffic volume and roadway characteristics ( 16 ). Both SPFs were developed for total and fatal/injury crashes that occurred on urban four-lane freeway interchange influence areas in Florida from 2007 to 2010. The comparison results showed that the two models resulted in similar predictive performance and network screening.
Aguero-Valverde et al. applied multivariate models to identify and rank high-crash locations by crash type ( 17 ). The crash data were collected on rural undivided two-lane highways in Center County, Pennsylvania for 7 years (2003–2009). The results showed that the multivariate Poisson-lognormal (MVPLN) spatial model produced the best fit to the crash data. Wang et al. used a generalized negative binomial-P (GNB-P) model to develop separate intersection SPFs for three different crash types, including same-direction crashes, intersecting-direction crashes, and single-vehicle crashes ( 14 ). Five-year (2015–2019) crash data were collected for intersections located on urban and suburban arterials in the state of Connecticut. The results showed that the over-dispersion of SPFs varied across different intersections, where the minor road annual average daily traffic (AADT) was positively associated with the over-dispersion of SPFs for all three crash types.
Safety Evaluation at Ramp Terminals
There have been a few studies that focused on crash frequencies at ramp terminals. For example, Claros et al. developed distinct SPFs for diverging diamond interchange (DDI) ramp terminals for different crash severities in Missouri ( 9 ). A total of 13,000 ramp terminal-related crash reports, covering a three-year period from 2010 to 2012, were used for SPF development. The study indicated that the DDI ramp terminals had 37.5% fewer total crashes and 55% fewer fatal and injury crashes than the conventional diamond signalized terminals.
Lee et al. used a multilevel random-parameters model at ramp segments among three different ramp types, including direct, semi-direct, and loop ramps ( 10 ). The model was estimated using crash data that were collected on 1,070 freeway ramps over a four-year period from 2007 to 2010 in South Korea. The results showed that crash frequency increased on ramp segments with higher AADT, short ramp lengths, or both. Atiquzzaman and Zhou conducted a comparative analysis of wrong-way driving (WWD) crashes that occurred at exit ramp terminals in Illinois and Alabama ( 18 ). The crash data were collected at ramp terminals of full diamond and partial cloverleaf interchanges in these two states for the years 2009 to 2013. The results revealed that Illinois exit ramp terminals experienced lower WWD crashes than those in Alabama, which was mainly attributed to the higher usage of certain geometric design features and traffic control devices at exit ramp terminals in Illinois.
CMV-Related Studies
Schneider et al. employed the NB model to analyze the impacts of horizontal curvature on truck crashes that occurred on rural two-lane collector and arterial horizontal curves in Ohio between 2002 and 2006 ( 19 ). It was found that horizontal curvature, truck average daily traffic, and passenger car traffic increased the number of truck crashes. Vadlamani et al. identified high-risk sites associated with large truck crashes in Arizona ( 2 ). Two high-crash identification approaches were used: the property damage only equivalent (PDOE) method and the NB model. Crash data were collected from the Arizona DOT for 6 years (2001–2006). High-crash locations identified using the NB model had less severe-injury crashes and large AADTs. On the contrary, high-risk locations identified using the PDOE method exhibited relatively large fractions of trucks and severe crashes, but small AADTs.
Dong et al. investigated the frequency and severity of large truck-involved crashes that occurred on Tennessee state route roadways between 2006 and 2010 ( 20 ). The NB and multinomial logit (MNL) models were adopted to estimate the factors influencing the crash frequency and severity, respectively. The study showed that the AADT, truck percentage, driver condition, and weather condition were significantly associated with both crash severity and frequency estimation of large truck crashes. Apronti et al. examined the safety effectiveness of steep grade advance warning signs used for truck safety on Wyoming’s mountainous passes ( 21 ). A zero-inflated NB regression model was developed as an SPF tool using 10-year (2006–2015) crash data collected in Wyoming. The study showed that the used advance warning systems did not significantly reduce truck crash risks at high-risk locations.
Overall Summary and Study Contribution
The review of previous literature has shown that SPFs have rarely been developed at ramp terminals, especially when involving CMV crashes. Furthermore, the majority of previous studies have applied the conventional NB model as an SPF tool in identifying high-crash locations, which could restrict the NB model’s dispersion parameter to be held fixed across the sites.
This study aims to fill the existing gap by developing CMV crash-specific SPFs at ramp terminals and identifying hazardous ramp terminals for CMV-involved crashes using the HTNB model, which is a more flexible approach by allowing the model’s dispersion parameter to vary across the crash sites as a function of site-specific characteristics. The HTNB model was compared with the conventional NB model. Afterwards, the EB method was used to identify high-CMV-crash ramp terminals. To accomplish the study objectives, extensive CMV crash data (2015–2019) were collected at 285 ramp terminals in the state of Kentucky.
Data Collection and Processing
This study is part of a research project that aimed at analyzing the risk factors associated with crashes involving CMVs in the state of Kentucky. Therefore, only CMV-involved crash data were screened and analyzed in the project, where at least one CMV was involved in the crash. CMV-involved crash data were collected from the Kentucky Transportation Cabinet (KYTC) for a five-year period (2015 through 2019). Following an extensive data cleaning process, a total of 624 ramp terminal-related crashes involving CMVs were finally identified, broken down as 543 crashes (87%) resulting in no injuries (i.e., PDO) and the remaining 81 crashes (13%) were injury-related (i.e., involving any of the KABC-scale levels). It should be noted that information on geometric design (such as number of lanes on exit ramp, presence of exclusive left-turn lane on exit ramp, etc.) and traffic conditions (e.g., AADT and heavy-vehicle percentage) was not available in the crash database. As a result, additional effort was made by the research team to collect site-specific characteristics for all the studied ramp terminals via Google Maps ( 5 ) back to the year of crash occurrence. Information in relation to area type, ramp AADT, and crossroad AADT was collected from the KYTC Interactive Map ( 22 ). Figure 1 shows sample ramp terminal data collection for some variables using Google Maps ( 5 ). Furthermore, Figure 2 shows a schematic sketch of the inside and outside crossroad ( 3 ).

Excerpt from Highway Safety Manual defining inside and outside crossroad ( 3 ).
CMV crashes were then aggregated per site (i.e., per ramp terminal) to represent the crash frequency by totaling CMV crashes occurring within each ramp terminal. A total of 285 ramp terminals were used in the analysis. Of the total 285 ramp terminals, there were only seven ramp terminals that experienced suspected serious injury (i.e., incapacitating injury or severity level “A”) and four other ramp terminals that experienced fatal crashes (i.e., severity level “K”). For this, because of very limited sample sizes associated with these injury categories, it was quite impossible to develop separate SPFs for different injury levels. As a result, an overall CMV crash-specific SPF model (based on total CMV crashes) has been developed. Figure 3 shows the spatial distribution of CMV crashes that occurred at ramp terminals in the state of Kentucky (Google Earth [ 23 ]). As it can be seen from the figure, the majority of CMV crashes occurred at ramp terminals located in major hub cities, such as Louisville, Lexington, and Covington (close to the Kentucky–Ohio state border).
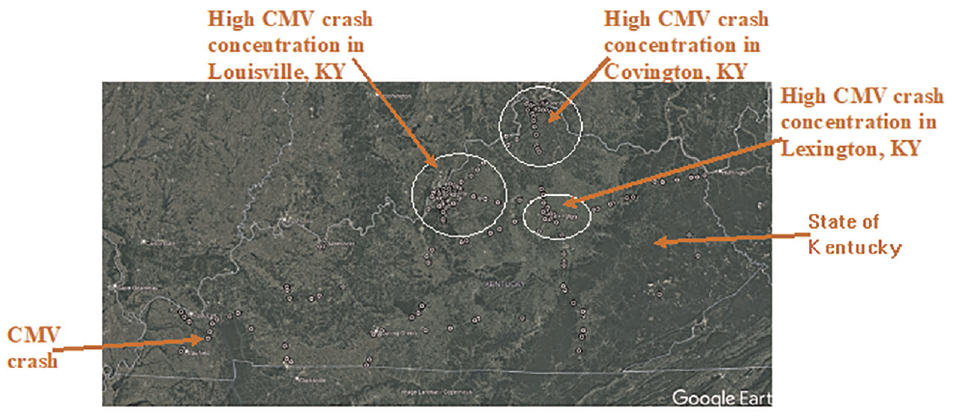
Spatial distribution of commercial motor vehicle (CMV) crashes across the state of Kentucky ( 23 ).
To develop a valid SPF, 50 zero-crash ramp terminals were randomly collected across the state of Kentucky and their information was added to the crash frequency database. The 285 ramp terminals were randomly split into calibration and validation datasets with a ratio of 75:25, where the former (214 ramp terminals experiencing a total of 461 CMV crashes) was used to develop the NB and HTNB models, while the latter (71 ramp terminals having 163 CMV crashes) was used to evaluate the prediction performance of the fitted models.
Descriptive statistics of all explored variables in the calibration dataset (i.e., 214 ramp terminals) are presented in Table 1. Note that Table 1 includes variables related to “inside crossroad” and “outside crossroad”. The inside crossroad is that major road approach closest to the mainline freeway, whereas the outside crossroad is the one that is far away from the mainline freeway (i.e., on the other side of the freeway).
Descriptive Statistics of Explanatory Variables in the Calibration Dataset (214 Ramp Terminals) Used for Safety Performance Factor Models
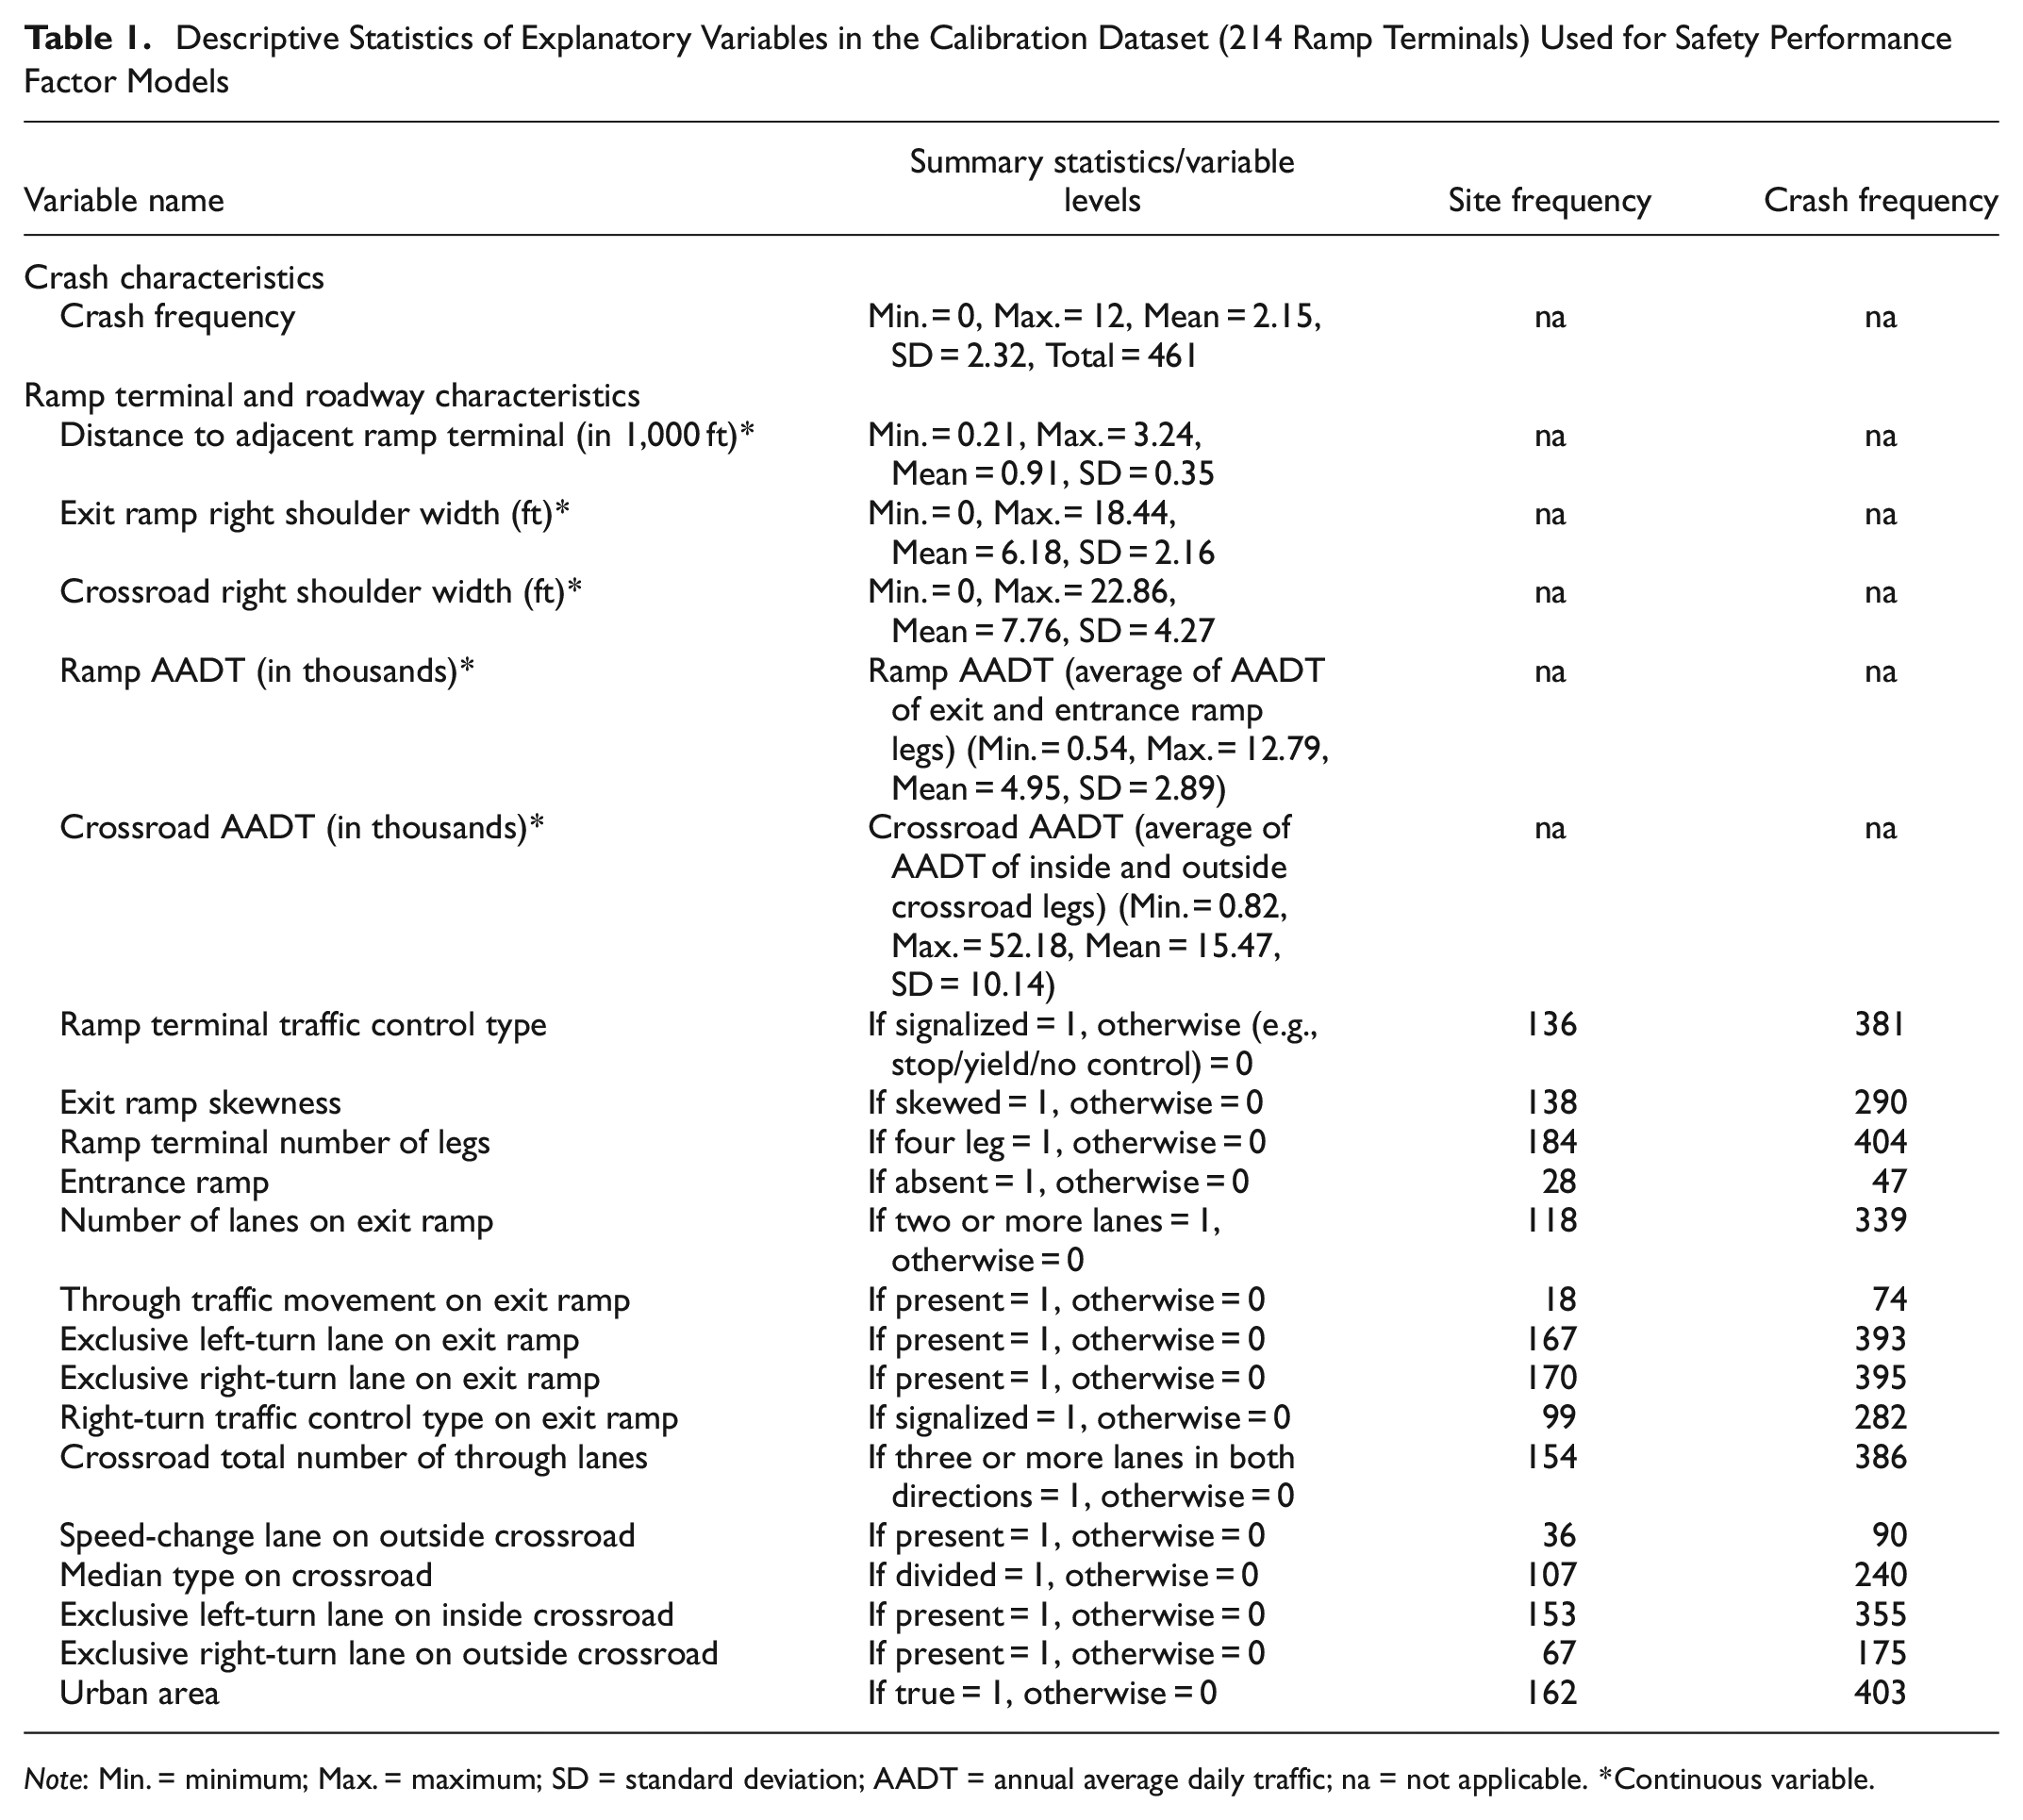
Note: Min. = minimum; Max. = maximum; SD = standard deviation; AADT = annual average daily traffic; na = not applicable. *Continuous variable.
Methodology
In this study, two count models, named NB and HTNB models, were fitted and compared to develop SPFs for CMV-related crashes at ramp terminals. Let

where

where
The NB model assumes the dispersion parameter (α) is fixed across all observations. However, such assumption is not generally true, especially where roadway traits change significantly from one site to another. A prominent extension of the NB model is the HTNB model, which is a more flexible approach to address unobserved heterogeneity through allowing dispersion parameter to vary across crash sites as a function of site-specific characteristics. The superiority of HTNB model over the traditional NB model has been confirmed in previous studies ( 12 , 13 , 24 , 25 ). Similar to the traditional NB model, the HTNB model uses the same probability density function as that given in Equation 2. However, in the HTNB model, the dispersion parameter is expressed as a function of site-specific attributes, as follows:

where
With Equation 3, one can associate the dispersion parameters (
Model Comparison and Selection
For each model, the overall GOF measure is determined by calculating the deviance statistic (D). This statistic is calculated using Equation 4, as follows:

where
Another GOF measure used to assess the fitted models was the McFadden Pseudo

The likelihood ratio test (LRT) was used in this study to compare between the NB and HTNB models, where the former is nested within the latter ( 26 ). The LRT is based on the differences in the log-likelihoods of these two models, which follows a Chi-squared distribution with degrees of freedom equal to “the difference between number of predictors in both models” (which is equal to one in this study), as follows:

where
The Akaike information criterion (AIC) was also used to select the best fit model. The AIC is defined as follows:

where
Two additional evaluation measures were used in this study to examine the predictive performance of the NB and HTNB models using the validation dataset, namely mean absolute deviance (MAD) and mean square prediction error (MSPE). The two measures are calculated as:


where
In addition to the above GOF measures, this study also used the Cumulative Residuals (CURE) method for assessing the NB and HTNB models to visually show how well these models fit the predicted crash data. For each model, the CURE plot depicts the cumulative residuals versus the predicted number of crashes. A good CURE plot is one oscillating around zero ( 27 ). The CURE method has been used in other safety studies (11, 28–32).
Empirical Bayes Method
The EB method was used to rank hazardous ramp terminals, where the expected number of crashes is calculated as the weighted average of the observed and predicted number of crashes estimated by the SPF model (
9
,
15
,
16
). The EB method has widely been used as a promising tool for identifying and ranking hazardous locations. The EB estimate (


where
Hazardous ramp terminals were then ranked in descending order based on the EEC values (17, 33–35), calculated as the differences between the expected and predicted number of crashes at the sites of interest, as follows:

Results and Discussion
SPF Model Development for CMV Crashes at Ramp Terminals
Table 2 shows the significant parameters of the fitted NB and HTNB models at a 10% significance level. To better discuss the effects of the significant predictors on CMV crash frequency, the marginal effects (MEs) of all explanatory variables were calculated and are shown in Table 2. The MEs reflect the change in CMV crash frequency resulting from one unit change in the value of a continuous variable (e.g., ramp AADT) or the effect on the crash frequency of an indicator variable (e.g., presence of divided median on crossroad) when changing from zero to one. These two models and the associated GOF measures were estimated using Stata version 16.0 (
36
). In relation to the sign and magnitude of the included explanatory variables, both NB and HTNB models provided fairly similar findings. The model GOF measures, including the deviance statistic (D) and McFadden Pseudo
Results of the NB and HTNB Models at Ramp Terminals
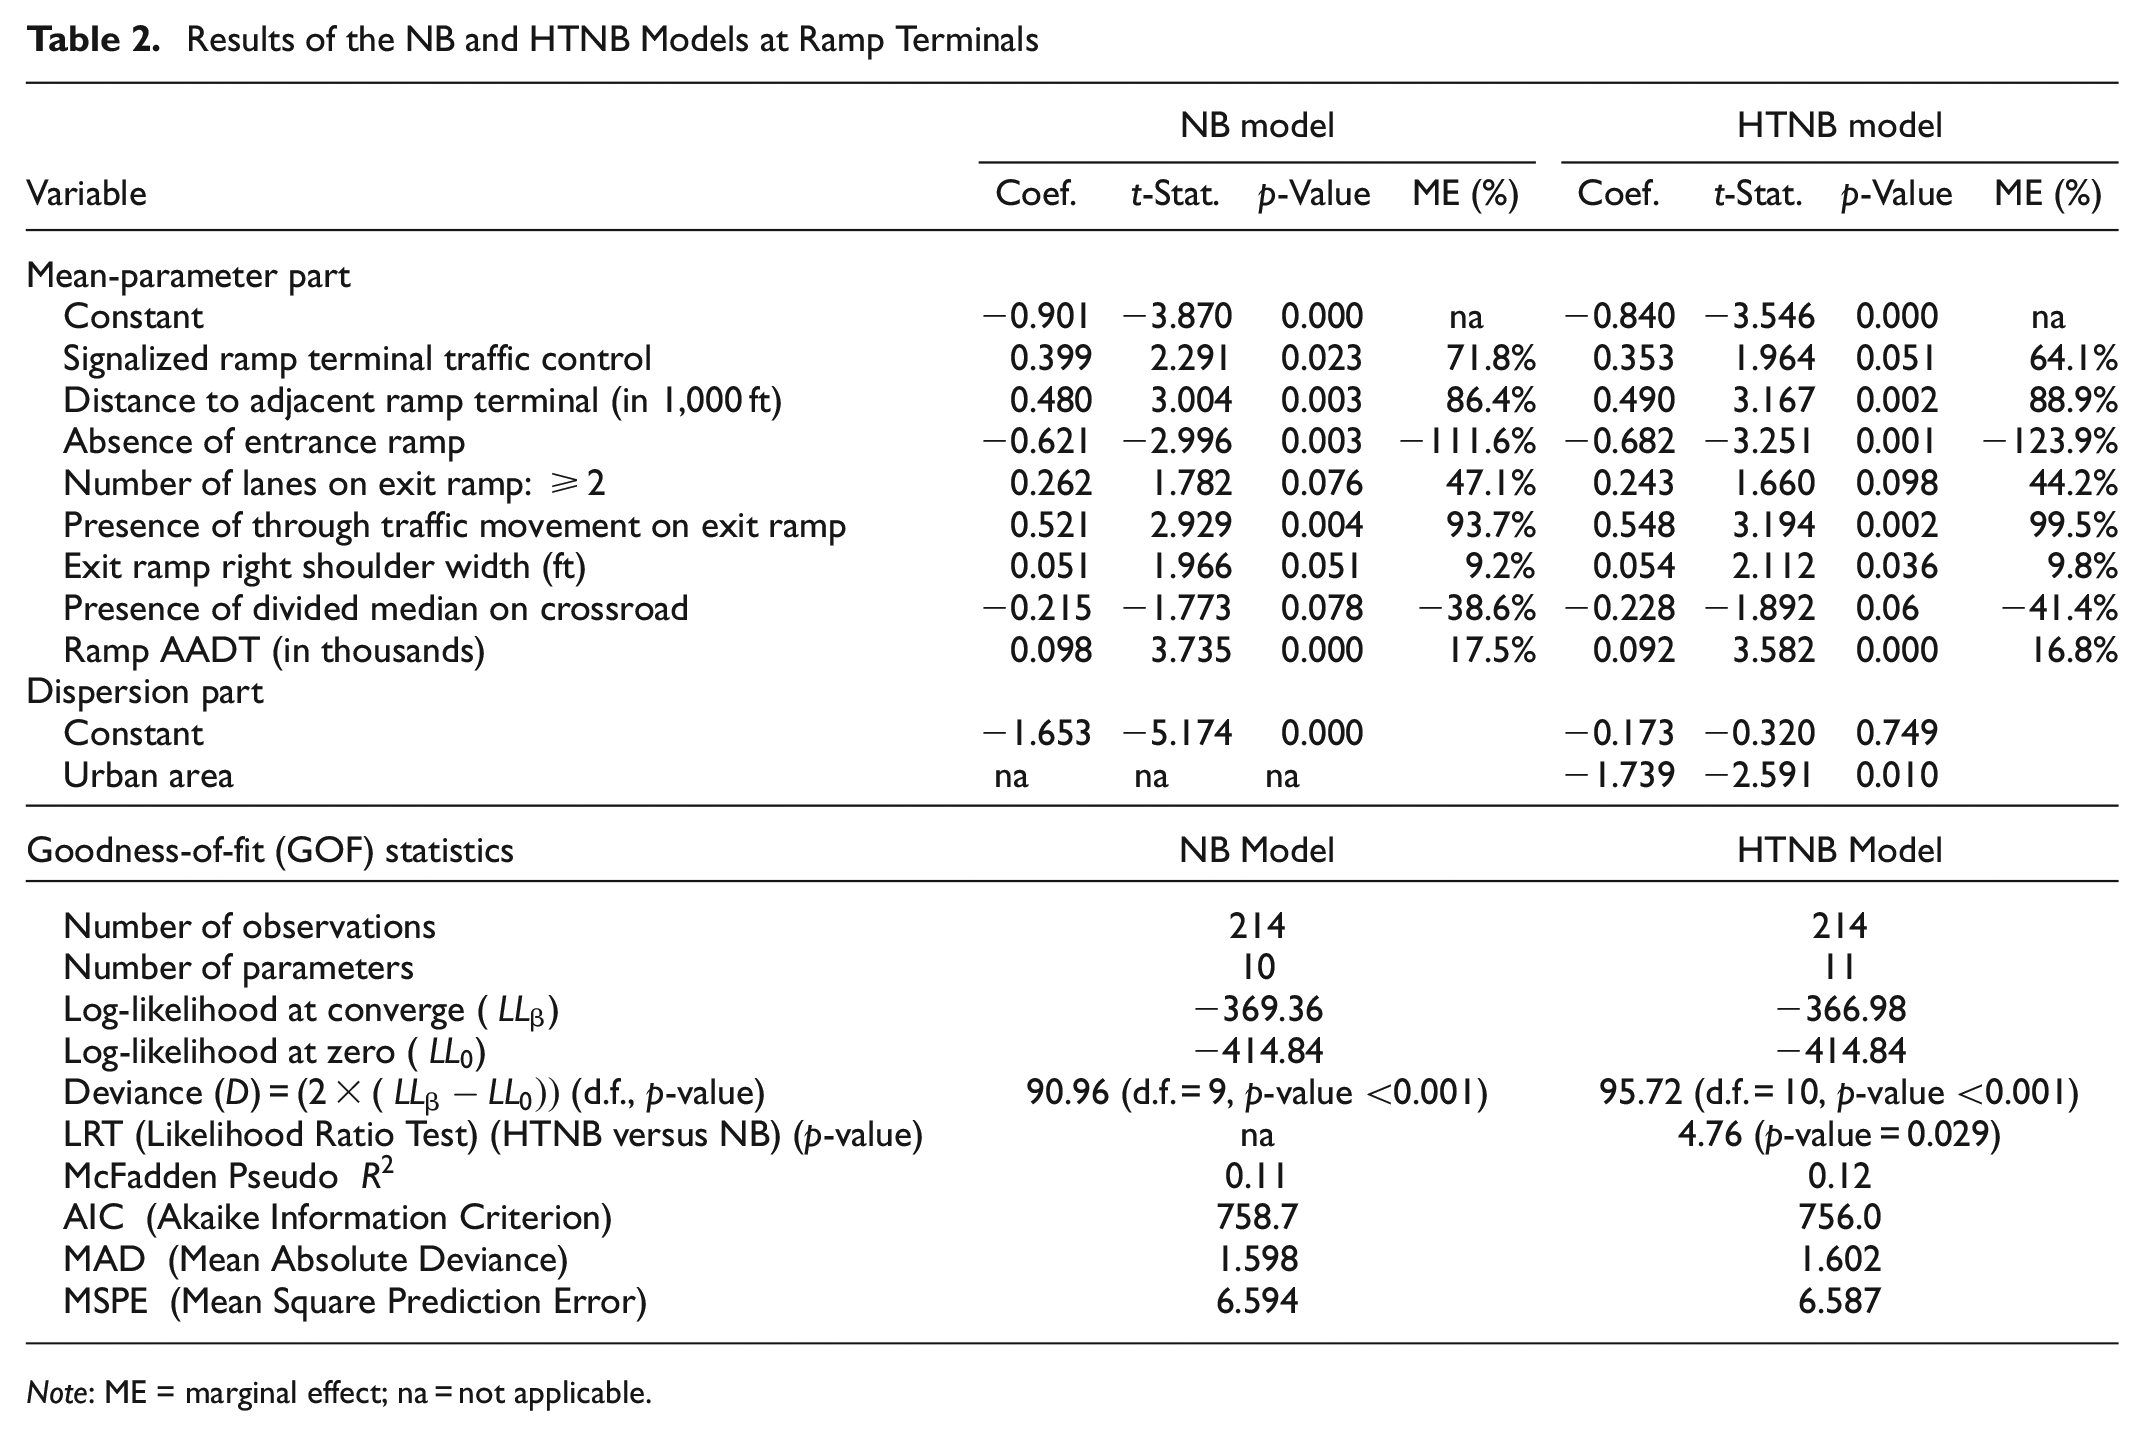
Note: ME = marginal effect; na = not applicable.
The results showed that signalized ramp terminals, distance to the adjacent ramp terminal, exit ramps with two or more traffic lanes, presence of through traffic movement on the exit ramp, exit ramp shoulder width, and ramp AADT were positively associated with ramp terminal CMV crash frequency. On the other hand, absence of terminal entrance ramp and divided median on the crossroad reduced the number of CMV-involved crashes at ramp terminals. For the HTNB model, urban area type was found to be statistically correlated with dispersion parameter. This shows that the HTNB dispersion parameter significantly varied by area type (i.e., urban or rural).
The findings drawn from this study seemed intuitive and were in line with the expectations. For example, compared with unsignalized ramp terminals, signalized terminals contributed to higher CMV crash frequency. One possible explanation is that signalized terminals might have more vehicular traffic, as well as more complex, conflicting movements, as compared with unsignalized terminals. From the marginal effect, signalized ramp terminals increased the number of CMV crashes by 64.1%. Not surprisingly, exit ramps with two or more travel lanes or having through traffic movement were associated with increased number of CMV crashes. This is mainly because exit ramps with such characteristics are more prone to conflicting traffic movements. Based on the estimated MEs, exit ramps with two or more travel lanes were associated with 44.2% increase in CMV crash frequency, whereas the presence of through traffic movement on exit ramps increased the crash frequency by 99.5%.
The results also showed that more CMV crashes occurred at ramp terminals with longer distance to an adjacent ramp terminal. One potential reason for this finding is that as the distance between two nearby ramp terminals increases, drivers tend to drive relatively more aggressively, which increases the CMV crash risk. This result is consistent with other studies ( 39 , 40 ). From the marginal effect, a 1,000 ft increase in the distance to an adjacent ramp terminal was associated with 88.9% increase in CMV-related crashes. The frequency of CMV crashes was found to increase with the increase in right shoulder width on exit ramps. This can be attributed to the wide shoulders encouraging drivers to inappropriately use the shoulder to pass other waiting vehicles at the terminal, especially large trucks that are characterized by larger size risk. This finding is consistent with other studies ( 39 , 40 ). The marginal effect indicated that a 1 ft increase in the exit ramp’s right shoulder width was associated with 9.8% increase in the CMV crash frequency.
Ramp AADT was found to increase CMV crashes. In fact, AADT reflects the exposure to the crash risk at ramp terminals. This result was reported in previous studies ( 8 , 10 , 14 ). As another example, the presence of medians on crossroads reduces the number of CMV crashes through physically separating opposing traffic movements. According to the marginal effect, a one-unit increase in ramp AADT (in thousands) was associated with 16.8% increase in CMV crashes.
The result of the LRT comparing HTNB versus NB model showed that the former was superior to the latter at the 5% significance level (p-value = 0.029). To decide whether there is a significant difference between the NB and HTNB models in relation to model fitting, two AIC rule-of-thumb criteria, defined by Hilbe ( 41 ) and Fabozzi et al. ( 42 ), were adopted in this study. According to Hilbe’s ( 41 ) AIC rule-of-thumb criteria, if the difference in AIC (or delta AIC) ranges between 2.5 and 6, then the model with the lower AIC is favored over its counterpart model. Fabozzi et al. ( 42 ) indicated that if delta AIC is less than 2, neither NB nor HTNB are preferred over one another. In this study, delta AIC (between the NB and HTNB models) is 2.7 (i.e., is not less than 2 and is greater than 2). Therefore, the NB model is not as good as the best model (the HTNB model). Moreover, another conclusion is that there is no substantial evidence to support the NB model (over the HTNB model), which is in line with the LRT results. So, in conclusion, according to Hilbe ( 41 ) and Fabozzi et al. ( 42 ), there is sufficient evidence to support that the HTNB is preferred over the NB model.
Nevertheless, both NB and HTNB models still produced similar crash prediction performance based on the MAD and MSPE estimates using the validation dataset. Figure 4 shows the CURE plots versus the predicted number of crashes for each of the NB and HTNB models. For both models, the CURE plots look very similar. However, the HTNB model provided a slightly better fit as its CURE plot stayed within ±2σ (or ±2 standard deviation limits) of cumulative residuals, as compared with its NB counterpart. Overall, based on all the above GOF statistics, especially for the model fitting based on the LRT statistic, AIC, and McFadden Pseudo
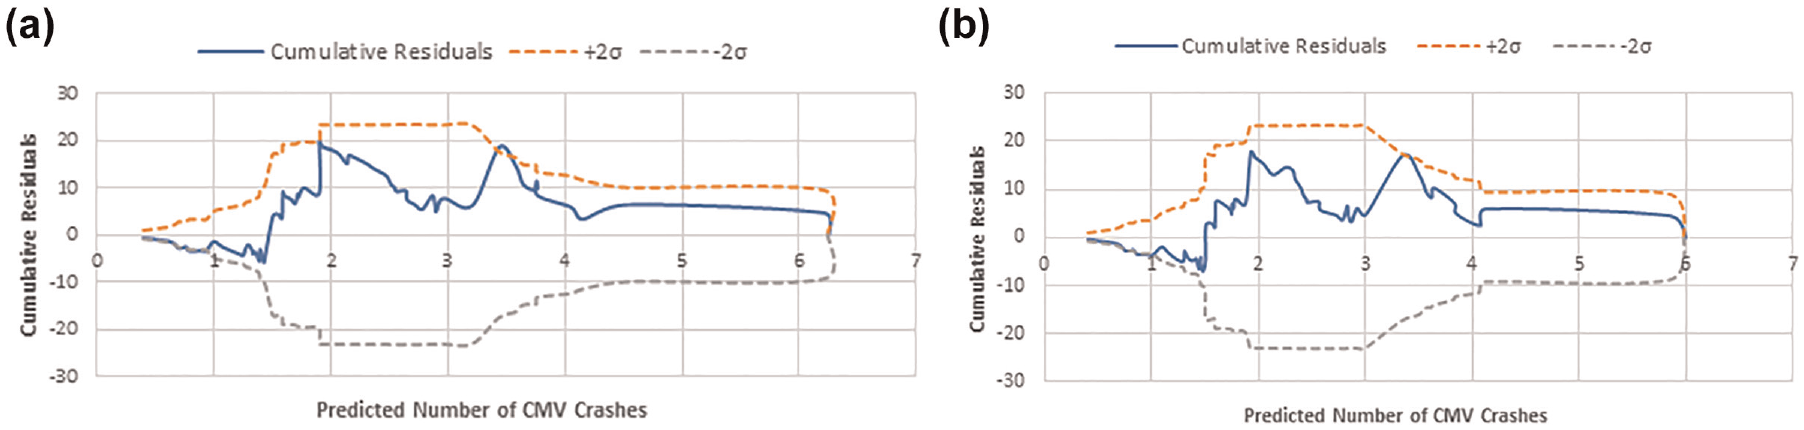
CURE plots for: (a) negative binomial model and (b) heterogeneous negative binomial model.
High CMV-Crash Identification at Ramp Terminals
At this step, CMV crash-prone locations were ranked with respect to the EEC values (from Equation 12) for predicted crashes from the HTNB model. Table 3 shows the top 10 hazardous ramp terminals identified using the EEC method. With the exception of the seventh rank that was a “stop-control” ramp terminal, the remaining nine terminals were signalized ones. Figure 5 shows map views (
5
) of the top four hazardous ramp terminals listed in Table 3. The figure shows that all these ramp terminals were adjacent to commercial/industrial areas, truck rest areas, or both, which generate additional CMV traffic from/to interstates through ramp terminals. The average AADT for the sites listed in Table 3 is 6,182, which is greater than the grand average AADT of all of the studied sites (
Top 10 Hazardous Ramp Terminals Identified Using the EB Method
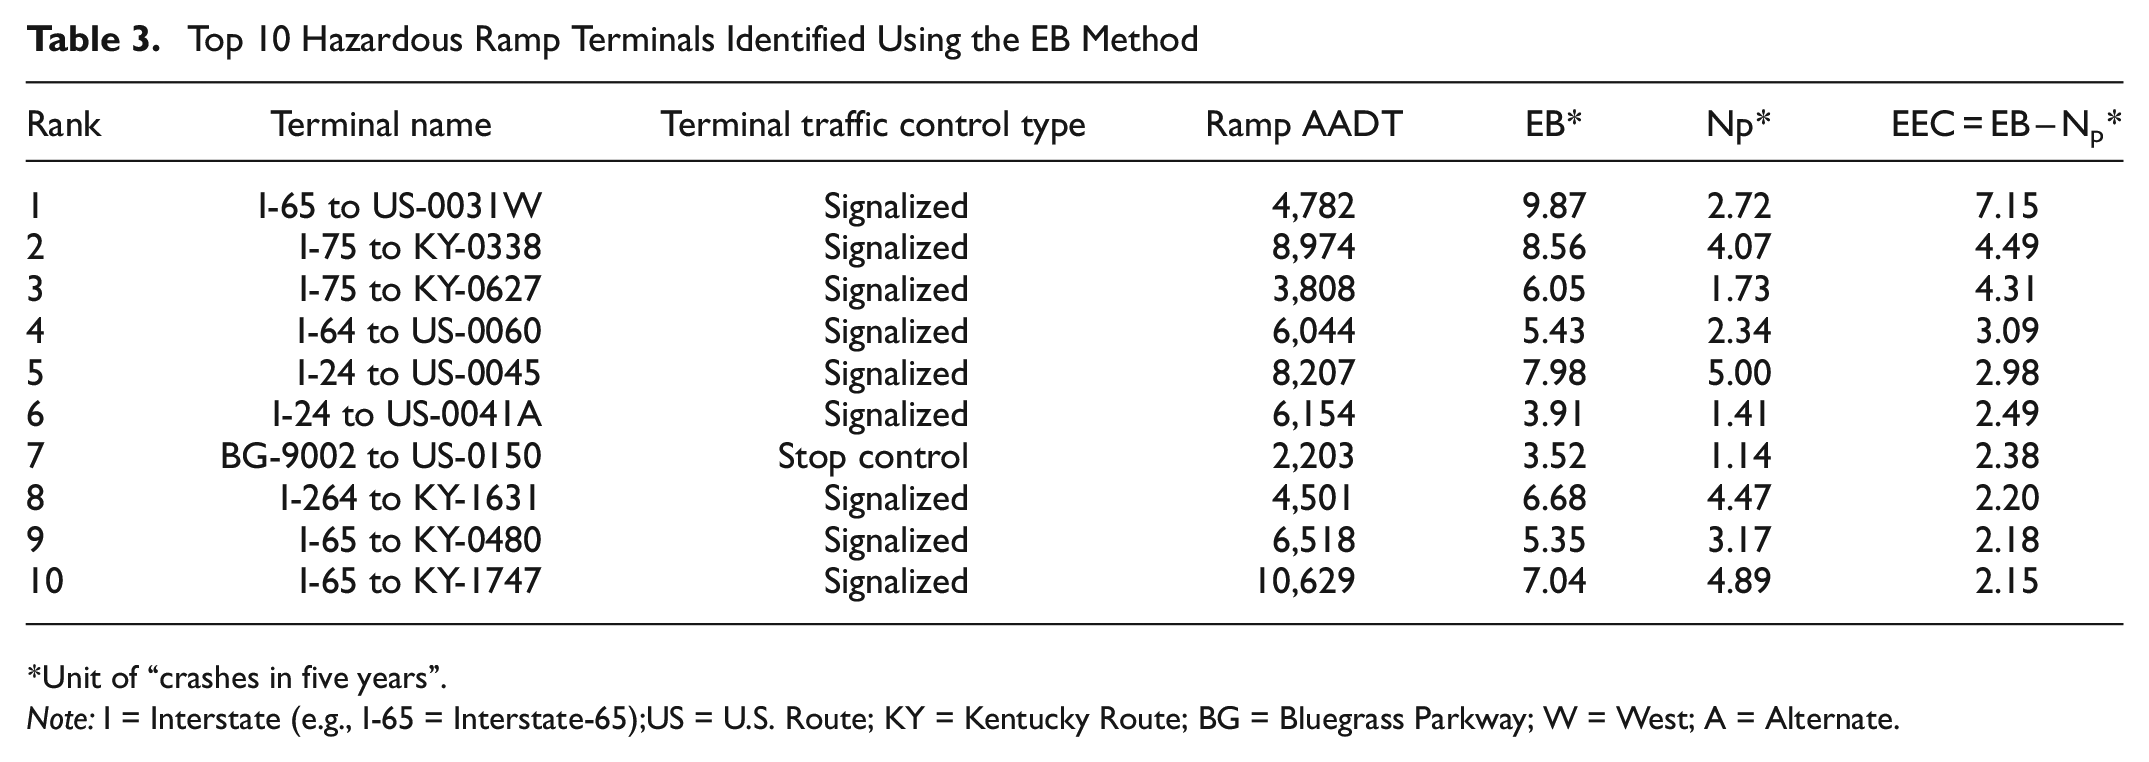
Unit of “crashes in five years”.Note: I = Interstate (e.g., I-65 = Interstate-65);US = U.S. Route; KY = Kentucky Route; BG = Bluegrass Parkway; W = West; A = Alternate.

Google Map views of the top four high-crash ramp terminals ( 5 ): (a) rank #1: I-65 to US-0031W, (b) rank #2: I-75 to KY-0338, (c) rank #3: I-75 to KY-0627, and (d) rank #4: I-64 to US-0060.
In-Depth Site Investigation and Proposed Safety Countermeasures
This section builds on the results from the obtained predictions from the HTNB model and presents more details about the top 10 high CMV-crash ramp terminals previously identified under “High CMV-Crash Identification at Ramp Terminals”. The identified top 10 hazardous sites were further investigated through Google Maps ( 5 ) inspection and the review of police narratives. For each site, detailed information of the CMV crashes was extracted for the most frequent at-fault vehicle type, most frequent collision type, most frequent pre-collision action, most mentioned crash causes based on police narrative, area type, and presence of industrial (e.g., truck rest area or company) or commercial area within 1-mile radius of the terminal. Table 4 provides relevant information on the aforementioned characteristics for the top 10 high CMV-crash ramp terminals. Figure 6 also depicts the site and crash characteristics of the top 10 ramp terminals. Both Table 4 and Figure 6 provide interesting findings. For example, CMVs were responsible for the vast majority of crashes occurred at the targeted sites. As another example, all top 10 hazardous ramp terminals were adjacent to industrial area or trucking companies (see also Figure 5). A large proportion (80%) of the sites had more than two traffic lanes on the exit ramp. Half of the sites (50%) were located in rural areas. Sixty percent of the sites had no physical median on the crossroad. “Making left turn” and “Going straight ahead” together were the most frequent pre-collision actions, comprising 60% of the total observations. Sideswipe same-direction and rear-end crashes were found to be the most common collision types at the identified hazardous sites. These crashes were mainly attributed to larger blind spots for CMVs, which made it difficult for CMV drivers to safely negotiate ramp terminals.
Detailed Information about the Top 10 High CMV-Crash Ramp Terminals
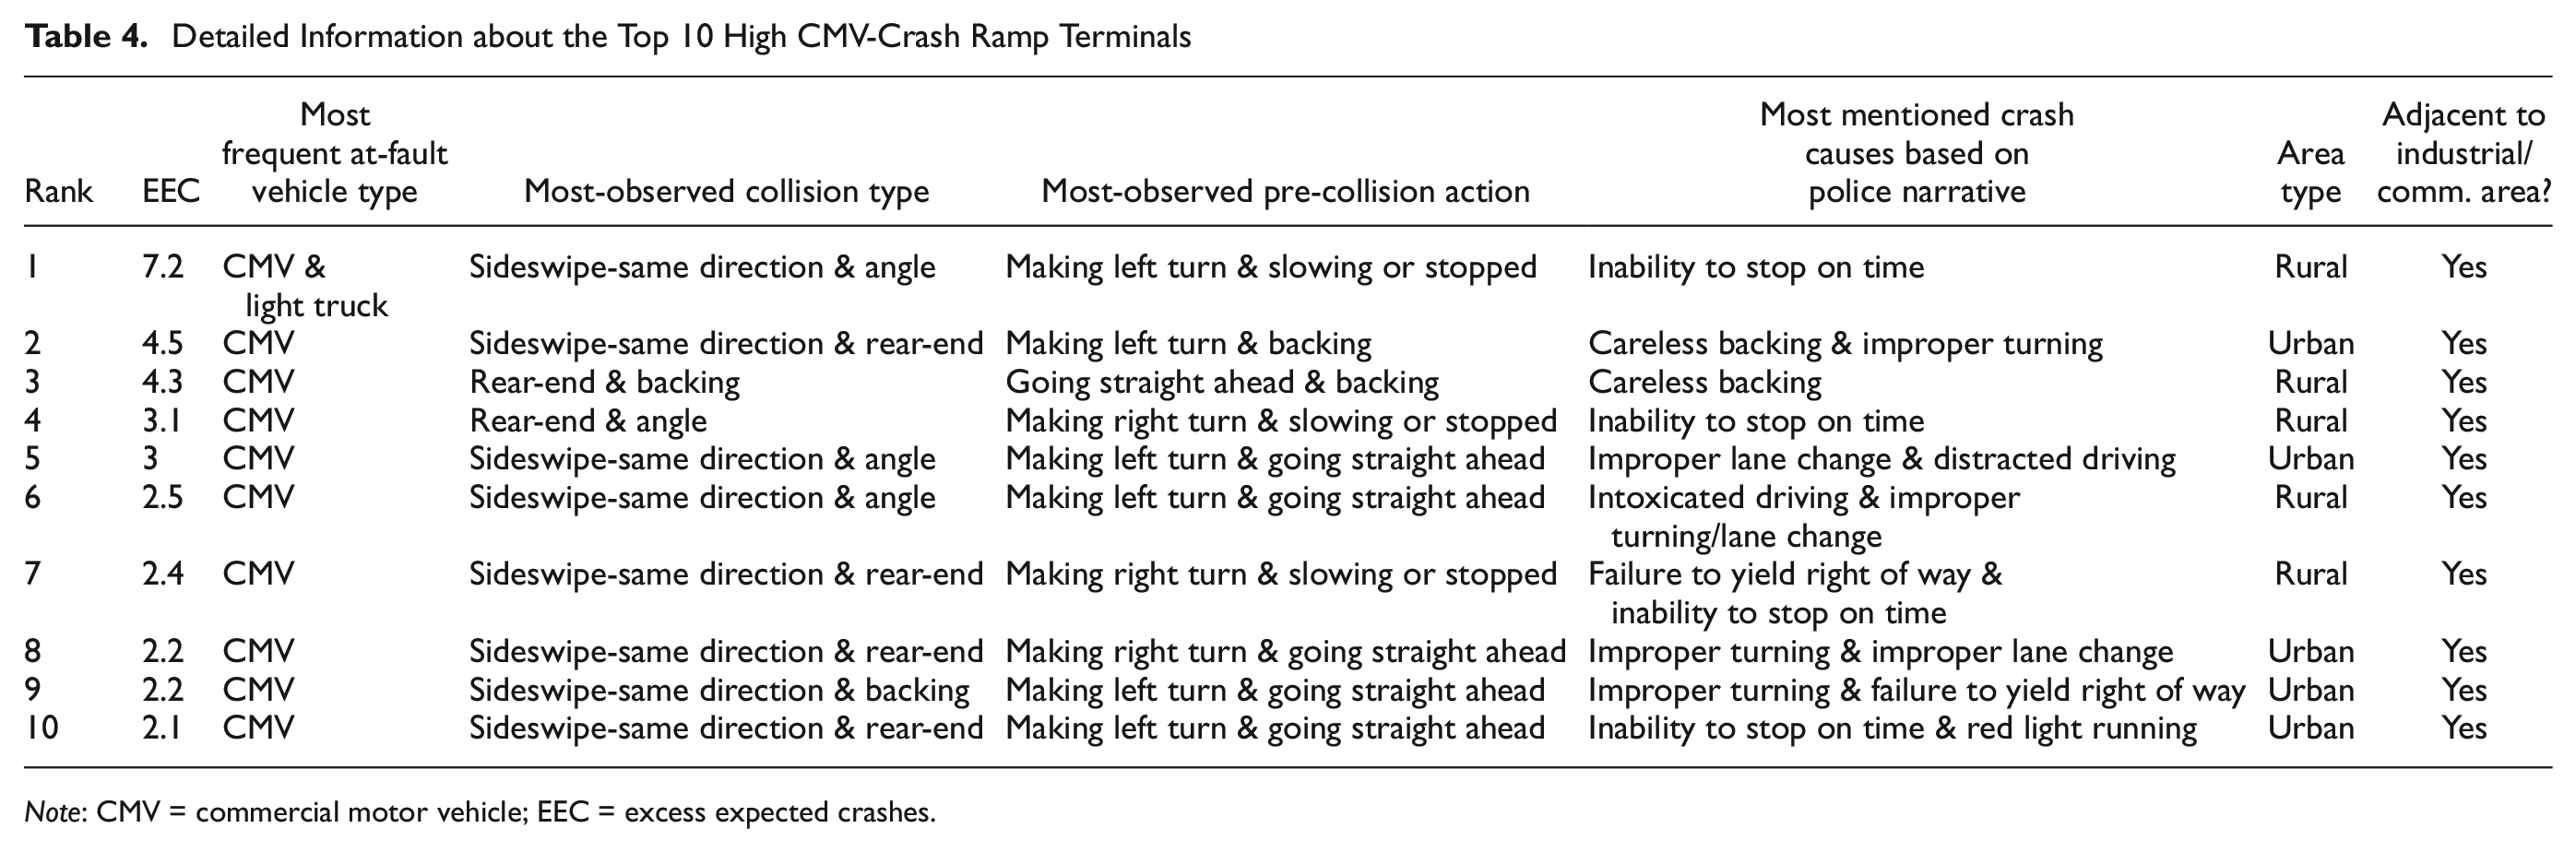
Note: CMV = commercial motor vehicle; EEC = excess expected crashes.
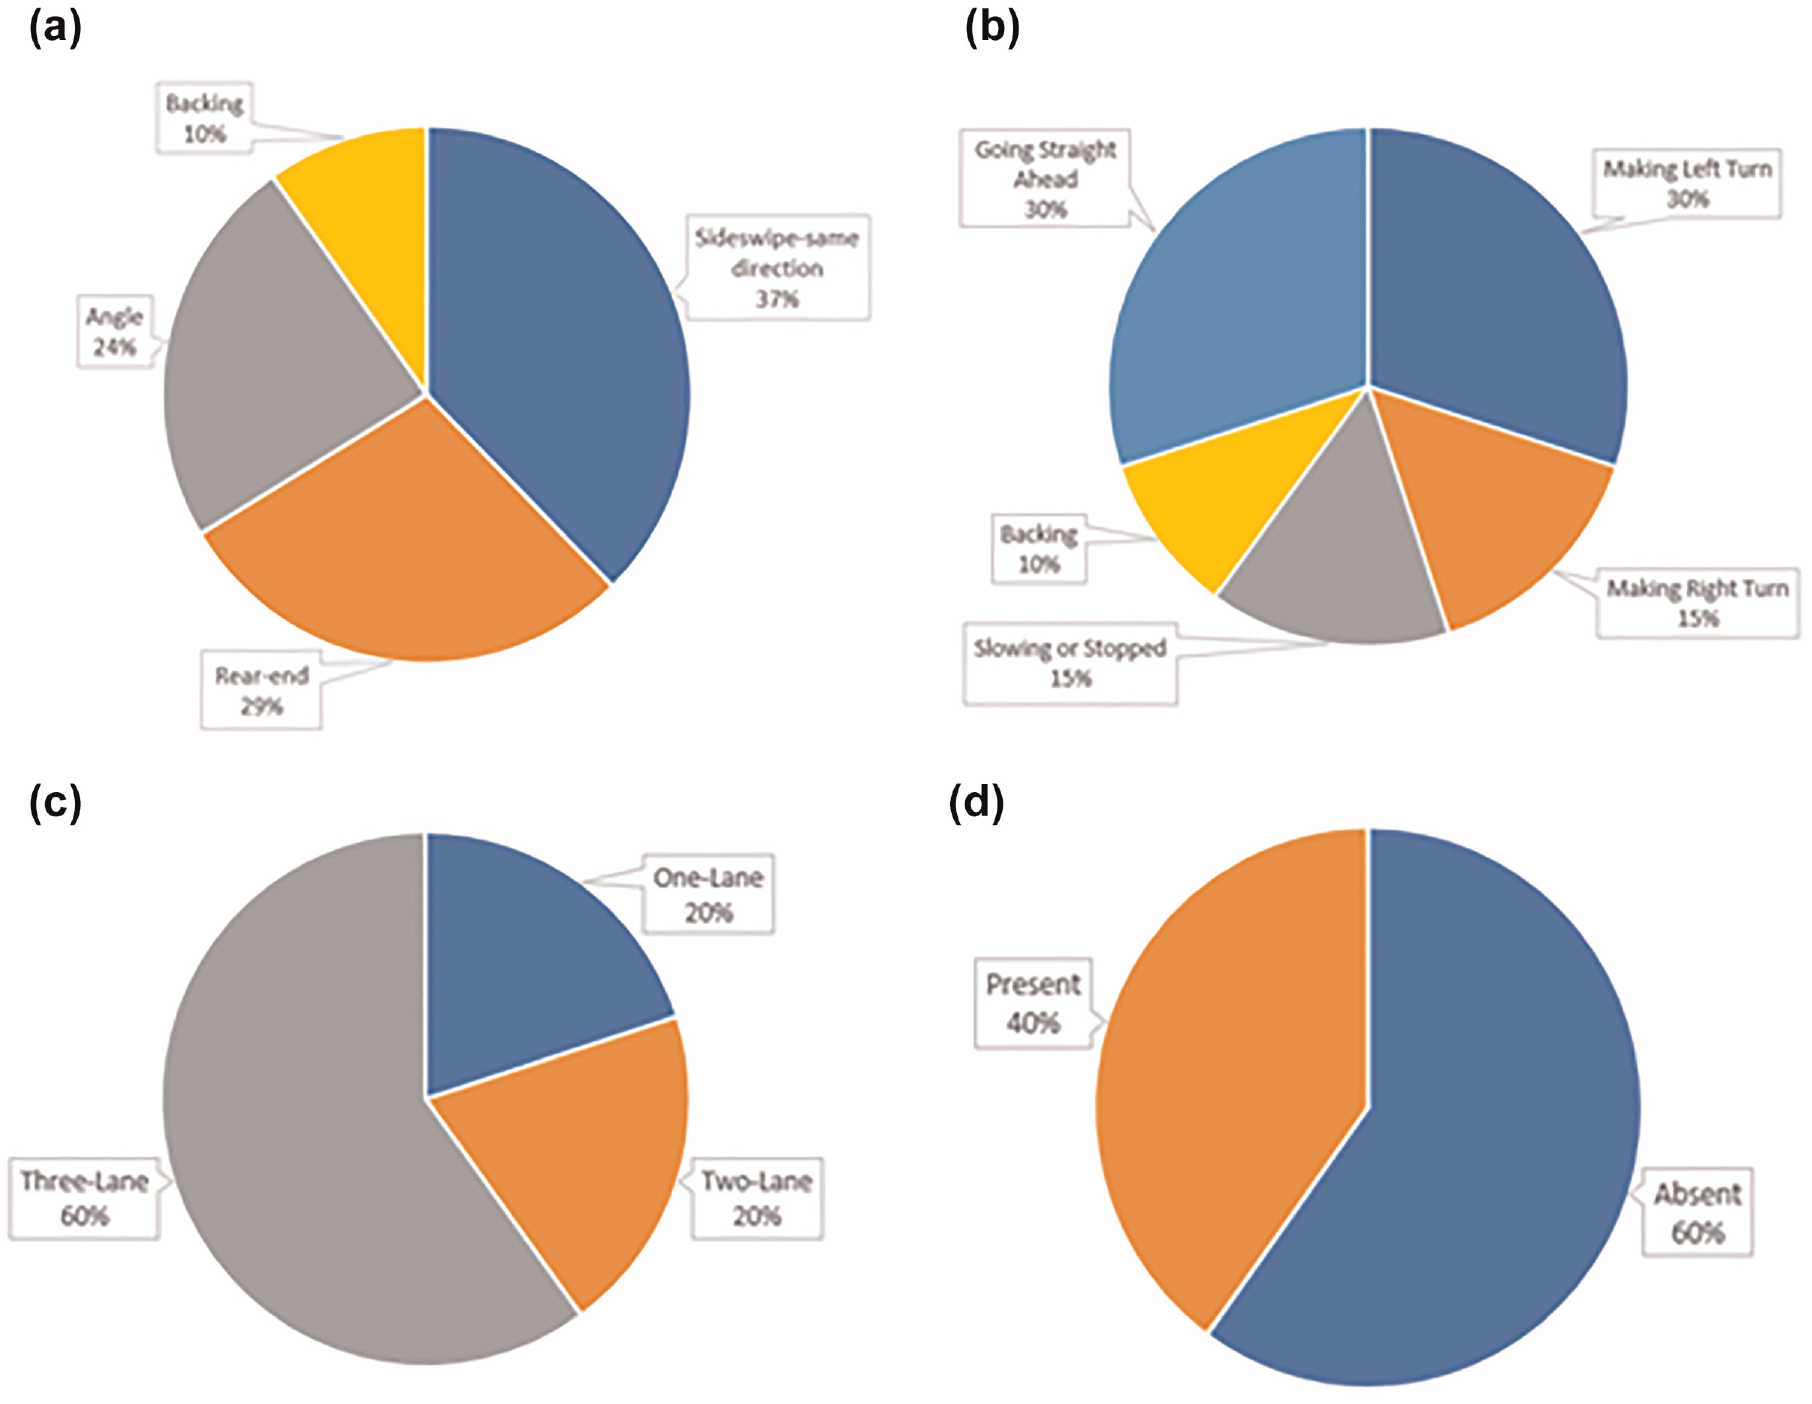
Pie charts of site-specific and commercial motor vehicle crash characteristics for the top 10 high-risk ramp terminals: (a) most-observed collision type, (b) most-observed pre-collision action, (c) number of lanes on exit ramp, and (d) crossroad physical median presence.
The above statistics, especially on at-fault vehicle type, manner of collision, and pre-collision action, indicate that a disproportionally large number of crashes could be attributed to CMV drivers’ improper turning maneuvers, being unable to stop on time, and failing to yield the right of way. Countermeasures were then selected based on the crash and site-specific characteristics shown in Table 4 and Figure 6, and also based on the results of the HTNB model, and similar findings derived from previous studies (2, 43–47).
Potential countermeasures targeting high CMV-crash ramp terminals include:
• Improving ramp terminal geometric design elements to better accommodate CMVs (e.g., widening pavement surface on the crossroad for CMVs’ proper turning maneuvers). Note that the thorough analysis of CMV crashes (e.g., review of police crash narratives), as well as using detailed inspection of the top 10 ramp terminals using Google Maps revealed that a high number of CMV crashes was mainly attributed to CMVs’ failure to make the proper turning maneuver, especially left-turn maneuvers (mainly because of the existence of narrow right shoulders on the crossroad) (also reported by Fitzpatrick et al. [ 44 ] and Abdel-Aty et al. [ 45 ]).
• Ensuring presence of physical medians on crossroads ahead of exits ramps.
• Installing warning signs to better advise through truck traffic on exit ramps.
• Improving road delineation, such as installation of guiding posts or improving poor/faded pavement markings, on both ramps and crossroads.
• Installing truck intelligent systems, for example, forward collision warning system, autonomous emergency braking, and intelligent blind-spot intervention system, to reduce CMV crashes related to driver errors (e.g., inability to stop on time or failing to see vehicles in blind spots).
• Intensifying traffic enforcement, for example, stricter police enforcement, to minimize driving violations at ramp terminals more prone to CMV-related crashes.
• Improving driver training/education programs and CMV driving skills to safely negotiate ramp terminals, especially when making turning-related maneuvers.
Conclusions and Study Applications
The main objective of this study was to develop an SPF for CMV-involved crashes occurring at ramp terminals, which was rarely investigated in previous safety literature. Two NB and HTNB models were developed and compared using crash records at 285 ramp terminals in Kentucky over a five-year period (2015–2019). Extensive effort was made by manually collecting ramp terminal-specific characteristics, including geometric design elements and traffic volumes at the 285 ramp terminals. Seventy-five percent of the sites, consisting of 214 ramp terminals, were used to develop the SPFs, and the remaining 25% were used to validate the prediction performance of the models. The majority of GOF measures, such as LRT, AIC, McFadden Pseudo
For the HTNB model, urban area type was found to be statistically correlated with dispersion parameter. This indicates that the HTNB dispersion parameter significantly varied by area type (i.e., urban or rural). In relation to ramp-terminal characteristics, the results of the HTNB model showed that signalized ramp terminals, distance to the adjacent ramp terminal, exit ramps with two or more traffic lanes, presence of through traffic movement on the exit ramp, exit ramp shoulder width, and ramp AADT increased ramp terminal CMV crash frequency. On the other hand, the absence of terminal entrance ramp and divided medians on the crossroad were negatively associated with CMV-involved crashes at ramp terminals.
The HTNB model was then integrated with the EB method for each ramp terminal to identify and rank high CMV crashes at ramp terminals. The top 10 high-crash sites identified by the EEC method were then further inspected by the research team to identify the physical characteristics and causes of CMV crashes and propose the necessary safety countermeasures. The inspection results showed that all top-10 sites were adjacent to industrial/commercial areas or trucking companies. “Making left turn” and “Going straight ahead” together were the most common pre-collision actions, comprising 60% of the total observations. Based on the key findings drawn from this study, several safety countermeasures were proposed to enhance the safety of CMV movements at ramp terminals. One example is ensuring the presence of physical medians on crossroads (or major roads) ahead of exits ramps. Further research in this domain is warranted to evaluate the efficiency of those countermeasures in reducing the occurrence of CMV crashes at ramp terminals.
The SPF developed in this study at ramp terminals involving CMVs can be used by safety researchers and practitioners from other states or jurisdictions to gain insights into the effects of different ramp terminal-specific characteristics on crashes involving CMVs. Because of the insufficient sample size associated with this study, it was not able to develop separate SPFs for signalized and unsignalized ramp terminals or for three- and four-leg ramp terminals. Future research is recommended using many observations, where separate SPFs can be developed for the aforementioned categories. Noticeably, the effect of temporal instability on the fitted SPFs was not considered in this study. An interesting future research avenue would examine how temporal instability affects the developed CMV crash-specific SPFs at ramp terminals.
Footnotes
Acknowledgements
The authors would like to extend their gratitude to KYTC for providing the necessary crash and roadway data used in this research.
Author Contributions
The authors confirm contribution to the paper as follows: study conception and design: Kirolos Haleem and Mehdi Hosseinpour; data collection: Mehdi Hosseinpour; analysis and interpretation of results: Mehdi Hosseinpour; draft manuscript preparation: Mehdi Hosseinpour. All authors reviewed the results and approved the final manuscript version.
Declaration of Conflicting Interests
The author(s) declared no potential conflicts of interest with respect to the research, authorship, and/or publication of this article.
Funding
The author(s) disclosed receipt of the following financial support for the research, authorship, and/or publication of this article: The authors would like to acknowledge the Kentucky Transportation Cabinet (KYTC) for the grant provided to conduct this research.
The opinions, findings, and conclusions in this paper are those of the authors and not necessarily those of KYTC.