



Abstract
Compared with roadway segments and intersections, the safety of interchange ramp segments has not been studied extensively, especially in the context of commercial motor vehicles (CMVs). The main objective of this study was to develop a safety performance function (SPF) tool for predicting CMV crashes occurring on interchange ramp segments. Four count models, including the negative binomial (NB), heterogeneous NB (HTNB), standard Conway–Maxwell–Poisson (CMP), and heterogeneous Conway–Maxwell–Poisson (HTCMP), were used and compared while fitting CMV crash-specific SPFs along interchange ramp segments in Kentucky. The HTCMP model, which is an extension of the standard CMP model, is a more flexible approach that handles both over-dispersed and under-dispersed crash data while exhibiting varying dispersion parameters. Five-year (2015 to 2019) CMV-related crashes along Kentucky’s ramp segments were used. The model comparison results showed that the HTCMP significantly outperformed the other three models in crash prediction accuracy and goodness-of-fit statistics (e.g., the Akaike information criterion, Bayesian information criterion, and McFadden’s Pseudo R-squared). The SPF model results using the HTCMP approach indicated that on-ramps (relative to off-ramps), ramp annual average daily traffic, ramp configuration, left shoulder width, ramp gore length, absence of left roadside barrier, and presence of other merging or diverging ramps within the ramp of interest were significantly associated with CMV crash frequency on ramp segments. Potential safety countermeasures were proposed, for example, increasing ramp gore length to be at least 730 ft (since this was associated with a reduction in CMV crashes on ramp segments).
Traffic crashes involving commercial motor vehicles (CMVs), that is, large trucks and buses, often result in disruption in traffic safety and flow ( 1 ). According to the Federal Motor Carrier Safety Administration (FMCSA), CMVs were involved in 5,096 fatal crashes in 2018, a 48% increase from 2009 ( 2 ). Interchange ramps are roadway sections that connect two freeways, or a freeway and a non-freeway highway ( 3 ). CMVs can have challenges on ramp segments since ramp segments, compared with interstate mainlines, have narrower pavement widths, sharper curves, and may lack roadside safety barriers, which make it more difficult for CMV drivers to safely negotiate these segments. A CMV-involved crash on a ramp segment may cause ramp closure or queue spillback, which can be extended to the nearby freeway’s mainline ( 4 ). For this, the safety of ramp segments for accommodating CMVs is of great importance to transportation officials and state departments of transportation (DOTs). Noticeably, relatively few studies have been conducted on the safety of interchange ramp segments, especially when involving CMVs.
An effective way to reduce traffic crashes on ramp segments is to accurately predict CMV crashes to be able to implement safety countermeasures on those segments with higher numbers of crashes than the expected. CMV crash predictions are best performed using CMV crash-specific safety performance functions (SPFs) (also called crash prediction models). The standard negative binomial (NB) regression model has been used extensively in the safety literature to develop SPFs for different transportation facilities (e.g., road segments, intersections, etc.). However, several studies have shown that the conventional NB model represent several limitations, such as having inflexible fixed dispersion parameters ( 5 – 8 ).
The issue of fixed dispersion parameters might cause biased SPF estimation results ( 9 ). Previous studies have demonstrated that the dispersion parameters often vary from one location to another depending on site-specific characteristics ( 5 , 6 , 9 , 10 ). Furthermore, most SPFs developed in safety research have simply related crashes to traffic volume only, neglecting to consider geometric characteristics ( 9 ). An improper SPF might lead to safe sites being mistakenly classified as unsafe ( 11 ).
The main objective of this study is to compare the performance of four different models, including the standard NB, heterogeneous NB (HTNB), standard Conway–Maxwell–Poisson (CMP), and heterogeneous Conway–Maxwell–Poisson (HTCMP) regression models, in developing SPFs for CMV-related crashes along ramp segments. It should be noted that the HTCMP model has not been extensively used in the literature for developing SPFs (notable exceptions are Lord et al. [ 12 ] and Geedipally and Lord [ 13 ]). For this, detailed information on recent CMV crash history, traffic conditions, and geometric characteristics was collected on 298 ramp segments in the state of Kentucky over a five-year period (2015 to 2019).
Literature Review
Ramp-Related Safety Studies
Compared with roadway segments and intersections, ramp segments have not been thoroughly investigated in the literature. For example, Parajuli et al. ( 14 ) developed separate SPFs for different ramp classifications, including ramp segments, ramp terminals, and interchanges (i.e., the mainline portion of the freeway within the influence zone of the interchange). Crashes were gathered from different regions of Ontario between 1997 and 2003. For ramp segments, separate SPFs using the NB structure were developed for property damage only (PDO) and injury/fatal crashes. Two predictor variables were used to develop the ramp SPFs: annual average daily traffic (AADT) along the ramp section and ramp length. Lu et al. ( 15 ) developed a simple SPF model and a full SPF model, in which the former incorporated traffic volume only, whereas the latter included traffic volume and roadway characteristics. The two SPFs were separately developed using the NB model for total and fatal/injury crashes that occurred on urban four-lane freeway interchange influence areas in Florida between 2007 and 2010. The comparison results showed that the two models resulted in similar prediction performance and network screening. The empirical result supported the use of the flow-only SPF model, whose development requires much less effort compared with that of the full SPF.
Lee et al. ( 16 ) developed multi-level random-parameter models to predict traffic crashes along three different ramp types: direct, semi-direct, and loop ramps. Crash data were collected on 1,070 freeway ramps over a four-year period from 2007 to 2010 in South Korea. The results showed that crash frequency increased on ramp segments with higher AADT and short ramp lengths. Wang et al. ( 17 ) investigated the real-time crash risk for expressway ramps using different factors related to road geometric, traffic, socio-demographic, and trip generation characteristics. Detailed information on the aforementioned factors was gathered on three main expressways in Central Florida, including State Road 408, State Road 417, and State Road 528 from July 2013 to March 2014. The Bayesian logistic regression models were used to determine the effects of various factors on ramp crash risk. The results showed that these models with the socio-demographic and trip generation covariates had a better prediction performance than their counterparts without such parameters. Recently, Matarage and Dissanayake ( 18 ) estimated the Highway Safety Manual (HSM) calibration factors for freeway ramp segments in Kansas using ramp-related crash data collected over a three-year period from 2014 to 2016. For entrance ramps in Kansas, the results showed that the HSM methodology over-predicted single-vehicle crashes and multi-vehicle fatal and injury (FI) crashes. On the other hand, the HSM methodology under-predicted multi-vehicle crashes on exit ramps in Kansas.
Studies Applying CMP-Based and Heterogeneity-Based Models
Compared with the standard NB model, the CMP with varying dispersion parameter (i.e., the HTCMP model) has rarely been applied in safety research for predicting traffic crashes. For example, Lord et al. ( 12 ) examined the application of the CMP regression model for crash prediction and compared the CMP modeling results with those of the traditional NB model. Two different data sets were used in this study, the first set was collected at four-legged, signalized intersections in Toronto, Ontario, Canada, and the second set of data was obtained on rural, four-lane, undivided highways in Texas from 1997 to 2001. The results indicated that the CMP model outperformed the NB model in goodness-of-fit statistics and predictive performance. In another similar study, Geedipally and Lord ( 13 ) compared the performance of NB (with both fixed and varying dispersion parameters) and CMP (with both fixed and varying shape parameters) models in estimating the crash variance. The results indicated that the trend of crash variance predicted by the CMP model was similar to that predicted by the NB model.
Lu and Tolliver ( 19 ) developed and compared alternate crash prediction models, including Poisson, NB, gamma, CMP, Bernoulli, hurdle Poisson, and zero-inflated Poisson regression models, for predicting highway-rail grade crossing (RGC) crashes characterized by under-dispersion issues. Data on RGC-related crashes and highway-rail crossing characteristics were collected from public RGCs in North Dakota from 1996 to 2014. The results indicated that Bernoulli, CMP, and hurdle Poisson models handled under-dispersed RGC crash data properly. Abdella et al. ( 20 ) applied a penalized CMP regression model for predicting over-dispersed crash data. Crashes were collected at 868 signalized intersections in Toronto, Ontario, in 1995. The results demonstrated that the penalized CMP regression model was a promising approach in simultaneously accommodating both dispersion and collinearity issues. Most recently, Shirani-bidabadi et al. ( 8 ) used the CMP model to develop separate SPFs for five highway facilities in Alabama. The CMP models were compared with the multivariate adaptive regression splines (MARS) data mining technique. A total of 1,311 bicycle–vehicle crashes, collected from 2011 through 2015 in Alabama, were used. Overall, the MARS models outperformed the corresponding CMP models.
There are studies that have accounted for crash heterogeneity (e.g., 21 , 22 ). For example, Wali et al. ( 21 ) applied fixed- and random-parameter Poisson and Poisson-gamma count models on two-lane roads in Tennessee and found that the random-parameter Poisson models provided the best model fit. Another method of introducing heterogeneity in crash frequency estimations is the Bayesian approach ( 22 ). With this, Li et al. ( 22 ) applied the Bayesian generalized NB modeling approach while predicting crash frequencies on Georgia’s rural four-lane roadways and found this approach to be successful.
CMV-Related Crash Frequency Studies
Schneider et al. ( 23 ) adopted the NB model to analyze the impacts of horizontal curvature on truck crashes that occurred on rural two-lane collector and arterial horizontal curves in Ohio between 2002 and 2006. It was found that horizontal curvature, truck average daily traffic, and passenger car traffic increased the number of truck crashes. Vadlamani et al. ( 24 ) identified high-risk sites associated with large truck crashes in Arizona. Two high-crash identification approaches were used: the property damage only equivalents (PDOE) method and the NB model. Crash data were collected from Arizona over a six-year period (2001 to 2006). High-crash locations identified using the NB model had lesser severe-injury crashes and larger AADTs. By contrast, high-risk locations identified via the PDOE method exhibited relatively larger fractions of trucks and severe crashes, but smaller AADTs.
Dong et al. ( 25 ) applied a multivariate random-parameters zero-inflated negative binomial model to jointly model crash frequencies by vehicle type at urban signalized intersections. Information on intersection-specific and five-year (2001 to 2005) crash history were obtained for a sample of 603 intersections in Tennessee. It was found that left-turn number, international roughness index, exclusive right-turn number, and posted speed limit significantly contributed to crash frequencies for all crash types. In another similar study using the same database, Dong et al. ( 26 ) investigated the frequency of large truck–involved crashes that occurred on Tennessee state route roadways between 2006 and 2010 using the NB model. The study showed that AADT, truck percentage, driver condition, and weather conditions were significantly associated with crash frequency of large truck–involved crashes.
Summary of Literature Review and Study Contribution
The review of the literature has shown that relatively limited research has been conducted to investigate CMV crash frequencies along ramp sections. Therefore, this study aimed at fulfilling that gap while developing different CMV crash-specific SPFs (using each of the HTCMP, CMP, HTNB, and NB modeling approaches) on ramp segments using CMV-related crashes that occurred on 298 ramp segments in the state of Kentucky between 2015 and 2019. The previously proposed models (i.e., HTCMP, CMP, HTNB, and NB) were explored given their easy-to-apply capabilities compared with other sophisticated methods (e.g., Bayesian generalized NB model), as well as their accommodation of crash observation heterogeneity (specifically the HTCMP and HTNB models).
Data Collection and Preparation
CMV crash data were retrieved from the Kentucky Transportation Cabinet (KYTC) over a five-year period (2015 to 2019). Ramp-related crashes involving CMVs were identified using ramp indicators and crash location geo-coordinates. However, information on ramp-specific characteristics, such as ramp configuration (e.g., diamond, parclo loop, free-flow loop, etc.), ramp type (i.e., on-ramp or off-ramp), number of ramp lanes, presence of shoulder rumble strips, and roadside safety barriers, were not readily available in the KYTC crash database. For this, additional efforts were made by the research team to collect ramp-specific characteristics via Google Maps ( 27 ) back to the year of crash occurrence. Google Maps’ measuring tools were used to measure left and right shoulder widths, ramp length, and gore length, while Google Maps’ Street View feature was used to collect ramp type and configuration, number of lanes, presence or absence of rumble strips, and presence of safety barriers.
Information on area type, ramp traffic volume (or ramp AADT), and heavy vehicle percentage (HVP) along the mainlines and crossroads was collected from the KYTC ( 28 ). Figure 1 shows sample variables’ data collection. Note that this study explored some new variables that have not been extensively used in the safety literature, for example, “gore length” and “presence of ramp within the ramp of interest.”

Sample data collection for ramp-related variables using Google Maps ( 27 ): (a) ramp length; (b) ramp gore length; (c) presence of rumble strips and roadside safety barriers; (d) right shoulder width; (e) ramp AADT from KYTC’s interactive map; and (f) area type (urban or rural) from KYTC’s interactive map.
There were six different ramp configurations used in this study, including diamond, parclo loop, free-flow loop, direct connection, semi-direct connection, and outer connection ramps (see Figure 2). Parclo and free-flow loop ramps are loop-shaped ramps used to accommodate minor left-turn movements, where the latter is a fully grade-separated ramp without stops (there is no controlled terminal or intersection at both ends of the ramp). Outer connection ramp, which is similar to a direct connection ramp, is used where the interchange also has an inner free-flow loop. Semi-direct connection ramps are similar to direct connection ramps, which are used where left-turning movement is considerably heavy. With the exception of diamond and parclo loop ramps that end at an at-grade terminal, the remaining ramp configurations are fully grade-separated, providing uninterrupted traffic flows. Given the lower observations of some of the ramp configurations (e.g., parclo loop, free-flow loop, and outer connection ramps), ramps were grouped into three main categories: diamond, parclo/free-flow loop, and direct/semi/outer ramps.
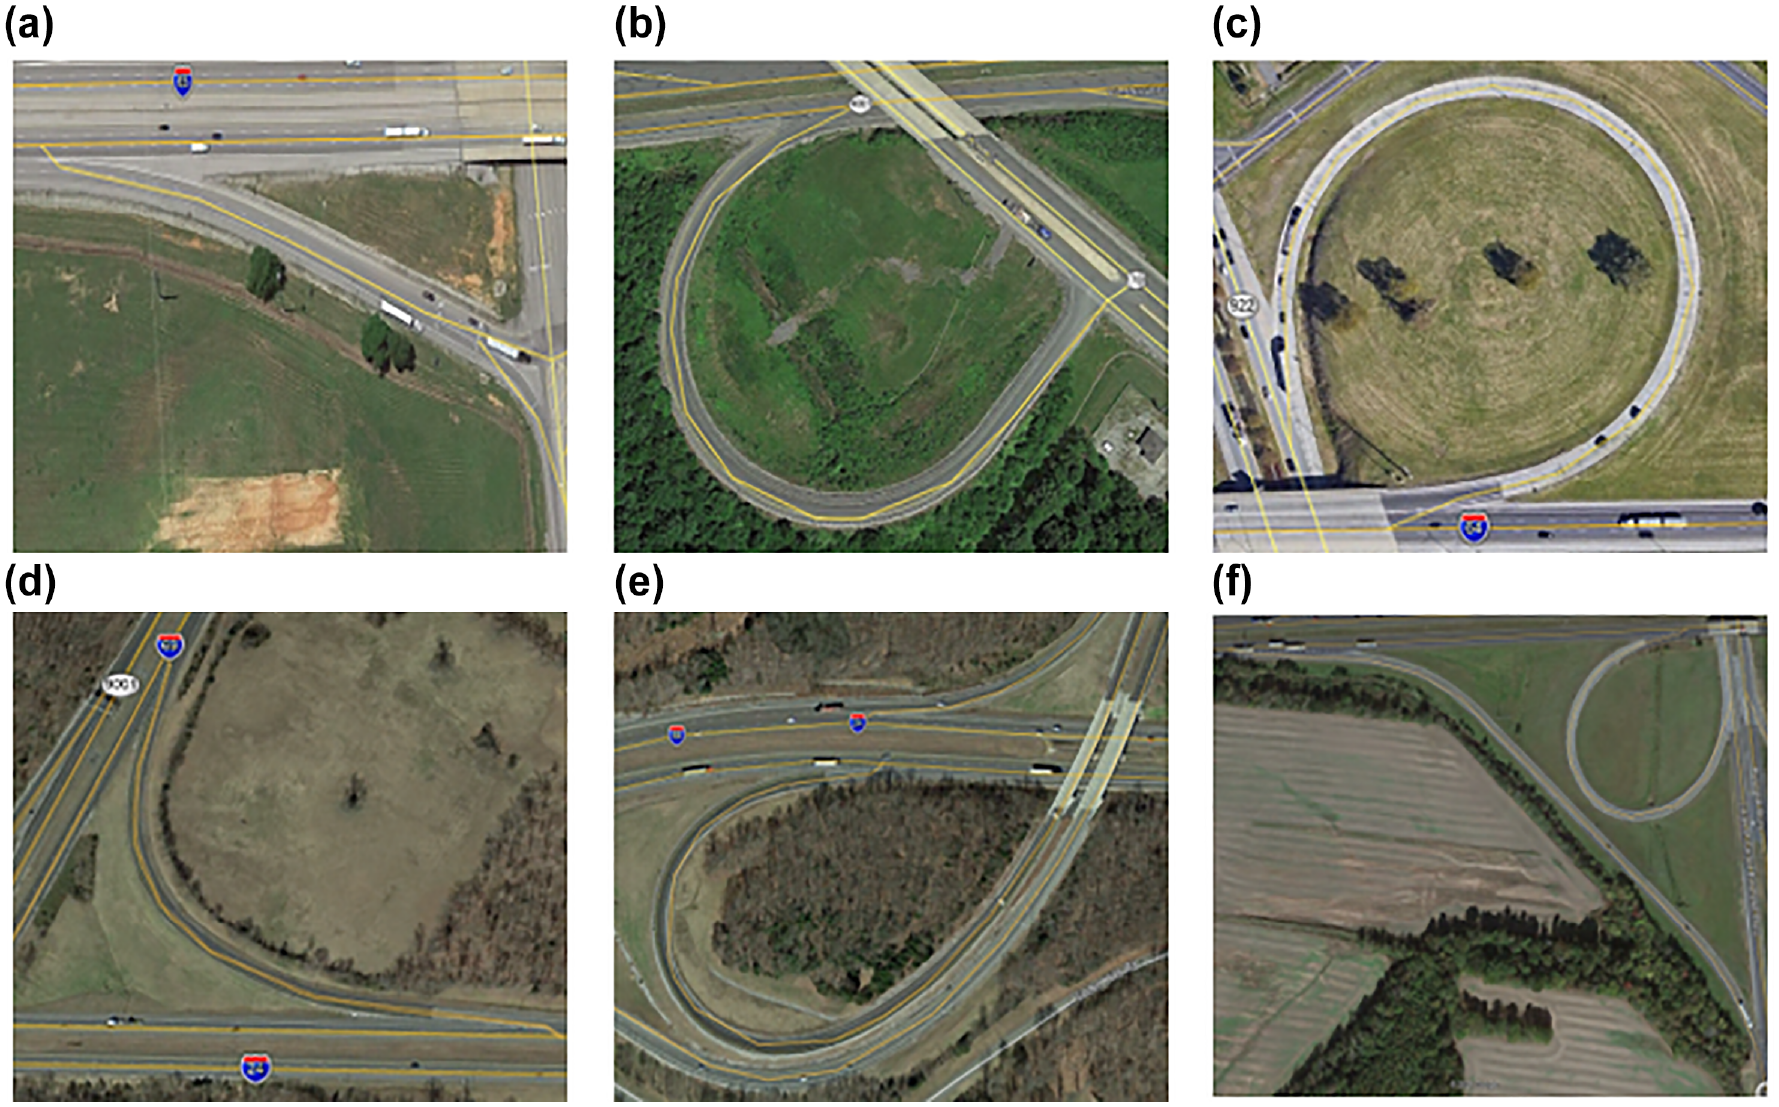
Ramp configurations investigated: (a) diamond; (b) parclo loop; (c) free-flow loop; (d) direct connection; (e) semi-direct connection; and (f) outer connection.
Over the five-year study period, 408 CMV-involved crashes were found to occur on ramp sections. Of these, 332 (81.4%) were PDO (O), 62 (15.2%) involved possible (C) and suspected minor injuries (B), and 14 (3.4%) resulted in fatal (K) and suspected serious injuries (A). Overall, 234 ramp segments were found to have at least one CMV crash. Of these, there were 63 segments that aggregately experienced injury or fatal (KABC) crashes during the five-year period (2015 to 2019). Furthermore, only 13 ramp segments experienced severe (KA) crashes over the study period. In addition, only one ramp segment was associated with a fatal CMV crash. For this, given the very limited sample sizes associated with these injury categories, it was quite impossible to develop separate SPFs for different injury severity levels. As a result, an overall CMV crash-specific SPF model (based on total CMV crashes) has been developed.
To develop a valid SPF, 64 crash-free ramp segments were randomly collected across the state of Kentucky and their roadway and ramp characteristics were collected by the research team using Google Maps ( 27 ). Using the random generator technique, the 298 ramp segments were randomly divided into calibration data set (75% or 223 records) for model fitting and validation data set (25% or 75 records) for prediction assessment. This splitting regime fulfills the HSM-recommended minimum sample size of 30 to 50 sites for SPF development. In addition, previous studies, such as Shirani-bidabadi et al. ( 8 ), Khattak et al. ( 29 ), and Wang et al. ( 30 ), used very similar sample sizes.
Table 1 presents descriptive statistics of the explored variables used in the calibration data set. From Table 1, the observed variance and mean of crash data (in the calibration data set) were 2.66 and 1.23, respectively, indicating crash over-dispersion. For the validation data set, the observed variance and mean were 11.74 and 1.79, respectively, that is, crashes were over-dispersed as well. The distribution of CMV crashes on ramp segments is shown in Figure 3.
Descriptive Statistics of Variables Used for Developing CMV Crash SPFs
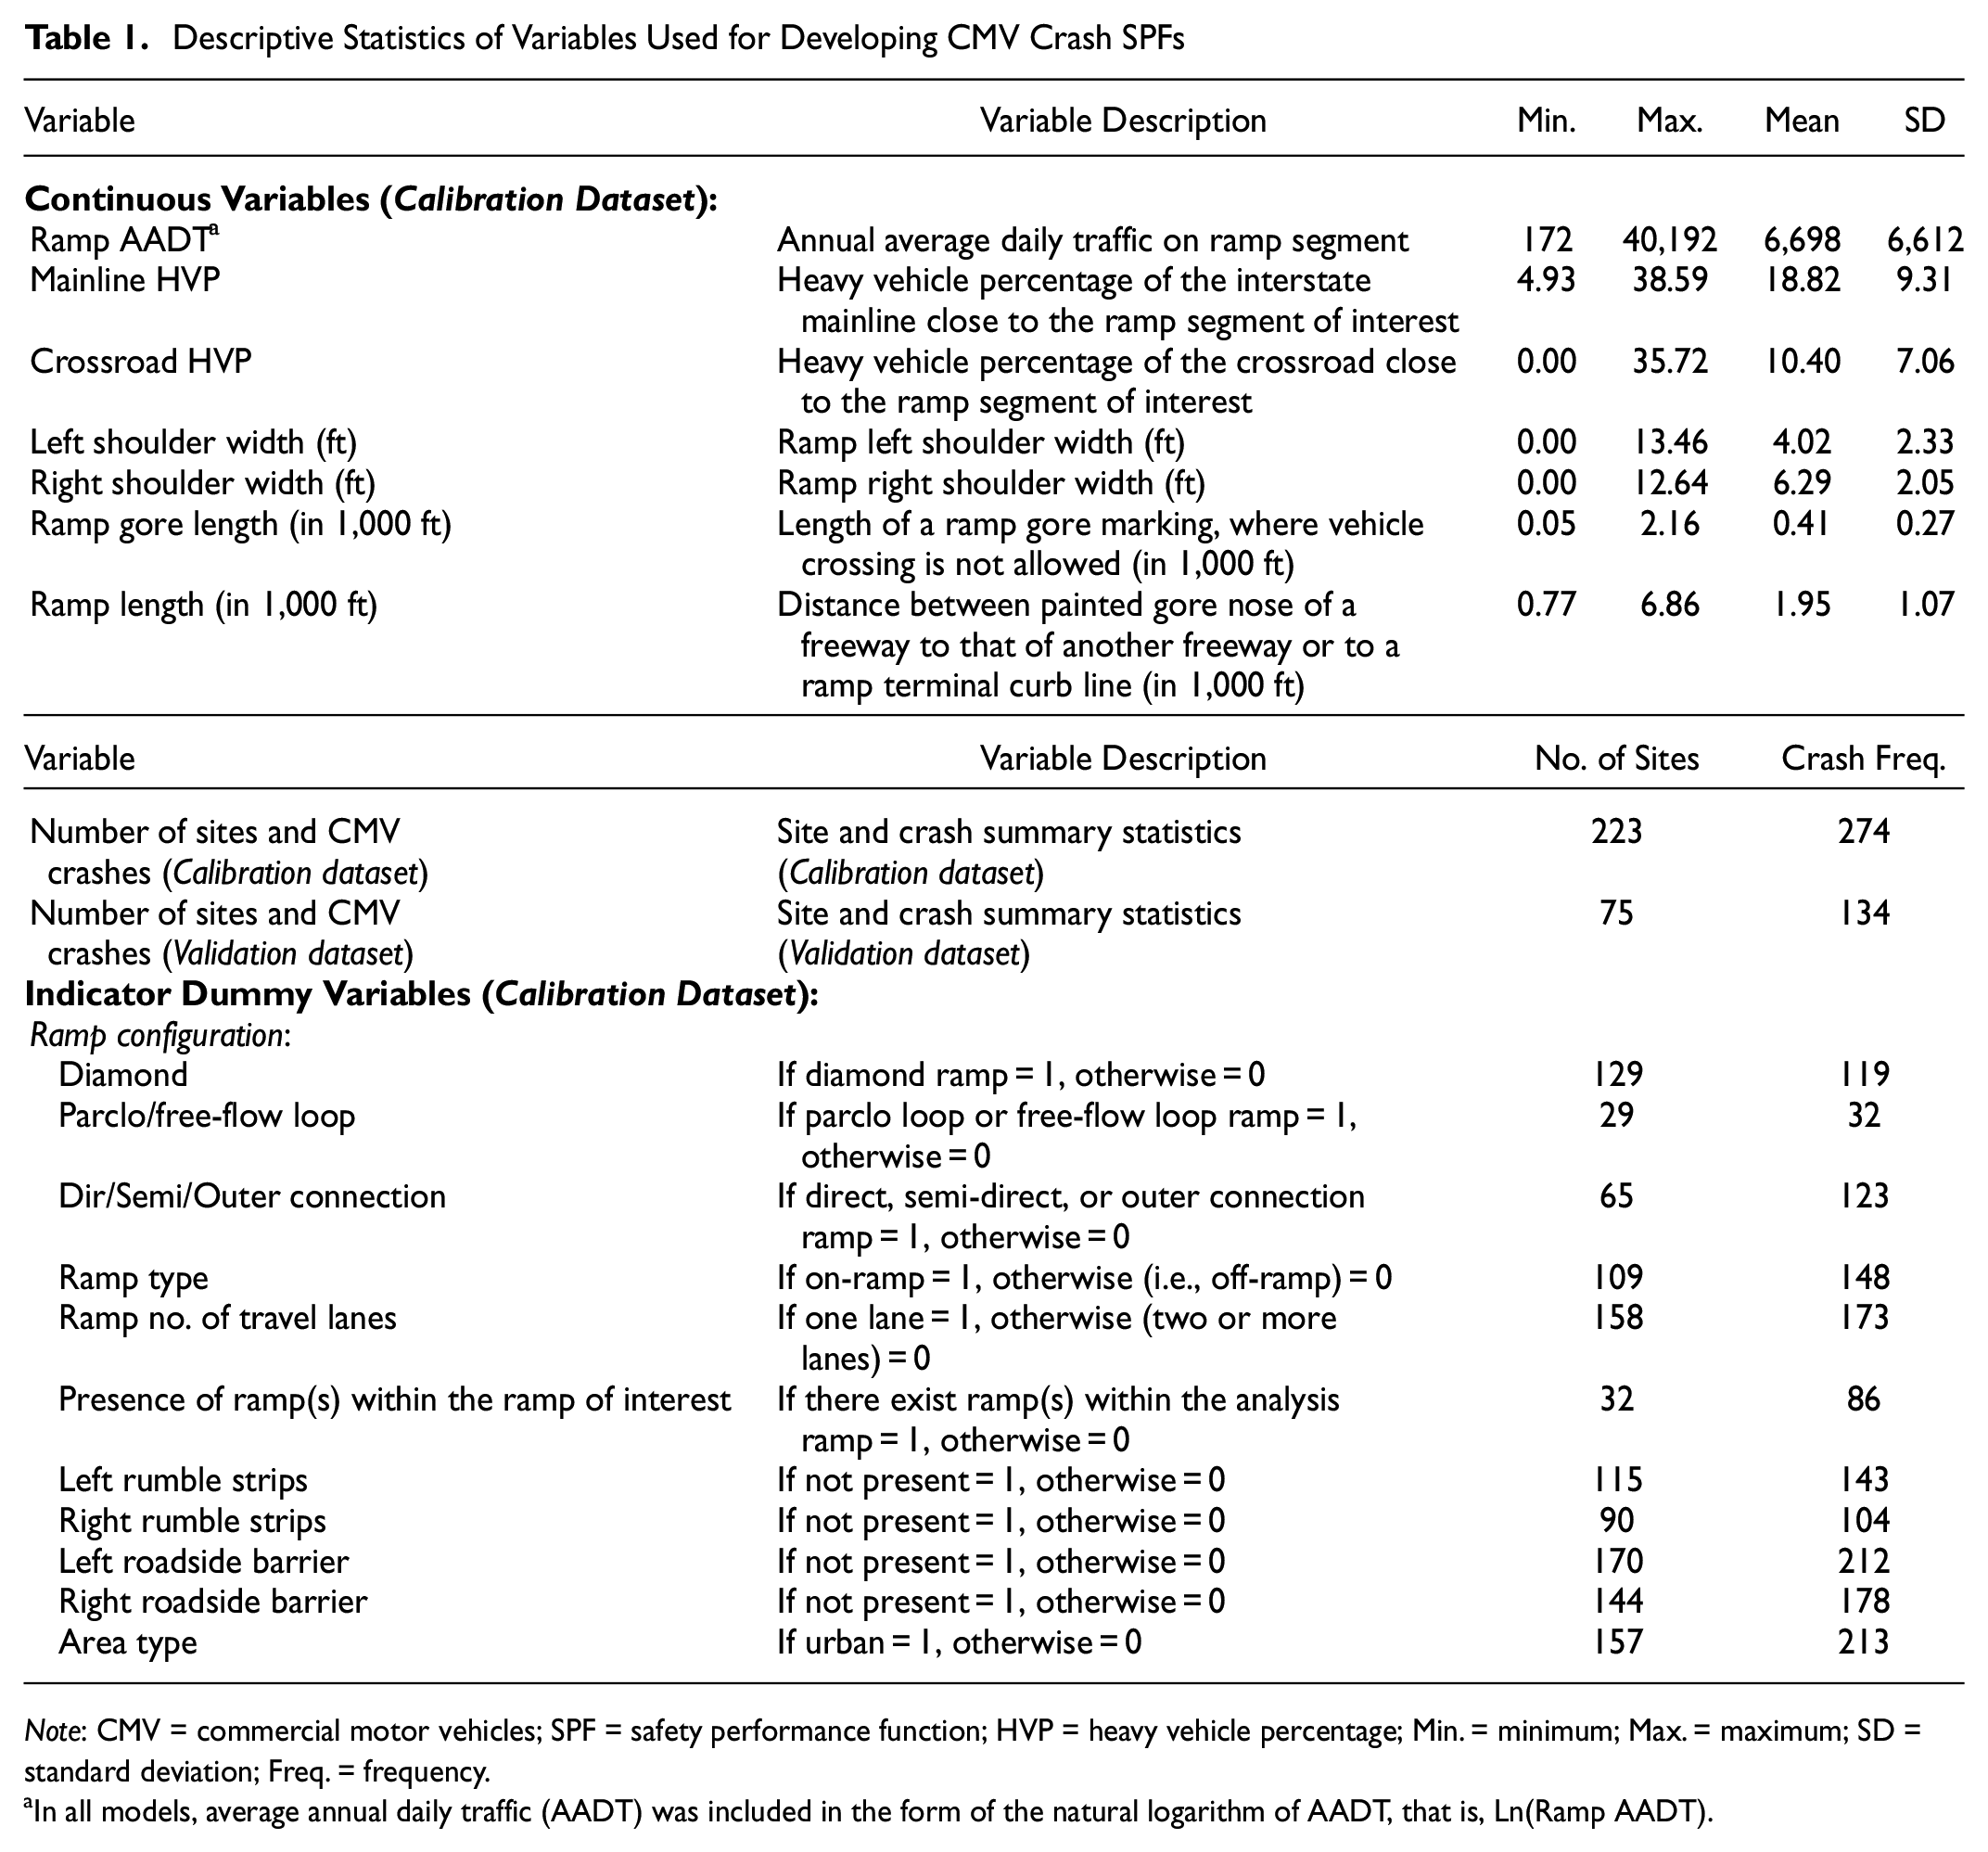
Note: CMV = commercial motor vehicles; SPF = safety performance function; HVP = heavy vehicle percentage; Min. = minimum; Max. = maximum; SD = standard deviation; Freq. = frequency.
In all models, average annual daily traffic (AADT) was included in the form of the natural logarithm of AADT, that is, Ln(Ramp AADT).

Distribution of commercial motor vehicles (CMV) crashes on ramp segments (2015–2019).
Methodology
NB, HTNB, CMP-Based, and HTCMP Models
The standard NB (i.e., Poisson-gamma mixture) regression is the most frequent and popular model that has been used by safety researchers for predicting traffic crashes and developing SPFs. The NB model assumes that a dispersion parameter follows a gamma distribution ( 31 ). Therefore, the NB model captures the over-dispersion by incorporating an error term into Poisson means and allows the variance to differ from the mean, such that:


where
α denotes dispersion parameter, and
The probability density function (pdf) of the NB model is given as:

where θ is the inverse dispersion parameter (1/α) and
The standard NB model assumes the dispersion parameter (α) to be fixed across all sites. However, some previous studies have shown that this assumption does not hold in many cases where the dispersion parameter (α) of the NB model is not fixed ( 5 , 6 , 32 , 33 ). The heterogeneous negative binomial (HTNB) model (in some documents, referred to as generalized negative binomial (GNB) model) is an extension of the NB model, which allows “α” to vary as a function of site-specific characteristics, as follows ( 5 ):

where
Compared with the traditional NB model, the HTNB model can properly handle the over-dispersion by allowing the dispersion parameter to vary across observations. However, both NB and HTNB models have been reported to exhibit some limitations. For example, these two models are unable to handle under-dispersion, where the variance of crashes is less than the mean ( 7 , 34 , 35 ).
A CMP (or Conway–Maxwell–Poisson) regression model can appropriately account for the aforementioned issues. An advantage of the CMP model over the NB model is that the former can model count data subjected to both over- and under-dispersion, while the latter only estimates over-dispersed count data ( 8 , 12 , 36 ). Like the HTNB model, the heterogeneous Conway–Maxwell–Poisson regression model (HTCMP) is a promising generalization of the standard CMP model that allows the dispersion parameter to vary across observations depending on site-specific characteristics ( 13 ). The probability mass function (pmf) of an HTCMP distribution is:





where
It should be noted that the CMP distribution was later reparametrized by Guikema and Goffelt (
38
) through substituting
Goodness-of-Fit (GOF) Measures
Overall, four count-response models, including NB, HTNB, CMP, and HCMP models, were fitted and compared to develop the CMV crash-specific SPFs along ramp segments. For each model, the overall GOF measure was determined by calculating the deviance statistic (D). This statistic is calculated using Equation 10, as follows:

where
A significant value for the deviance statistic indicates a good statistical fit.
Another GOF measure used to assess the fitted models was the McFadden Pseudo

The Akaike information criterion (AIC) and Bayesian information criterion (BIC) were also used to select the best-fit model. The AIC and BIC are calculated as follows:


where
LL is the model’s log-likelihood at convergence,
P is the number of model parameters, and
n is the number of observations.
In general, models with the least AIC and BIC values are preferred. All models were fitted using R software ( 39 ).
To assess the predictive performance of the four alternative models developed in this study (i.e., NB, HTNB, CMP, and HTCMP), three additional GOF measures were applied using the validation data set. These were the mean absolute deviance (MAD), the mean square prediction error (MSPE), and the cumulative residuals (CURE) plots. The MAD and MSPE statistics were computed using Equations 14 and 15, respectively:


where
To visually assess how well the four developed SPFs fitted the crash data, the CURE plot versus AADT was developed for each model using out-of-sample observations (i.e., validation database). More details on the CURE method are found in previous studies (e.g., 40–42).
Results and Discussion
CMV Crash-Specific SPF Model Results Along Ramp Segments
The results of the four developed NB, HTNB, CMP, and HTCMP models and their associated GOF statistics are shown in Table 2. From Table 2, as indicated by the deviance statistic (D), all fitted models were statistically different from their constant-only counterparts, which rejects the null hypothesis that the models had the same prediction performance as their corresponding constant-only models. According to McFadden Pseudo R2, AIC, and BIC statistics, the HTCMP model outperformed the other three models. The superiority of the HTCMP model was also supported by the MAD and MSPE measures (especially the MSPE measure) from the validation data set, where the HTCMP had the least MSPE and second least MAD.
CMV Crash-Specific SPF Results for Ramp Segments

Note: CMV = commercial motor vehicles; SPF = safety performance function; NB = negative binomial; HTNB = heterogeneous negative binomial; CMP = Conway–Maxwell–Poisson; HTCMP = heterogeneous Conway–Maxwell–Poisson; AADT = average annual daily traffic; AIC = Akaike information criterion; BIC = Bayesian information criterion; MAD = mean absolute deviance; MSPE = mean square prediction error; Coeff. = coefficient; Stat. = statistic; na = not applicable.
Ln(5 × ramp segment length) used as offset in all four models.
Not significant (N/S) at 10% significance level.
As seen in Table 2, ramp type (on-ramp), presence of merging or diverging ramp(s) within the ramp of interest, ramp gore length, absence of left roadside barrier, and ramp AADT (represented by “Ln(Ramp AADT)”) were found to significantly influence CMV crashes in all fitted models. For the HTCMP model, there were two additional variables contributing to crash frequency, ramp configuration and ramp left shoulder width. The former (diamond and parclo/free-flow loop ramps) were associated with higher CMV crashes compared with direct/semi/outer connection ramps, whereas the increase in the latter (left shoulder width) was associated with CMV crash reduction.
The results obtained in this study were intuitive and in line with prior expectations. For example, as ramp AADT increased, the exposure to crash risk increased. In other words, the higher the number of motor vehicles on ramp segments, the higher the risk of CMV crashes. This result was reported in previous studies ( 14 , 16 , 17 , 24 , 26 , 43 ). Not surprisingly, wider left shoulders reduced the number of CMV crashes by providing more recovery room for the driver of an errant vehicle to regain control of the vehicle when departing their intended travel lane. A similar finding was reached for the absence of left safety barrier on the ramp, where there was an increase in CMV-related crashes on ramp segments without left-side safety barrier. This is mainly since roadside safety barriers prevent errant vehicles from running off the roadway and colliding with roadside fixed hazards or rolling over on steep embankments ( 44 ). In addition, drivers tend to drive more attentively and at lower speeds on those road segments installed with roadside safety barriers, mainly a result of drivers’ sense of having less room to take corrective actions after leaving the roadway.
An interesting finding was that ramp gore length was negatively associated with CMV crashes, indicating that the longer the ramp gore length, the lower the number of CMV crashes was. This can be explained by a longer gore length reducing the risk of sudden lane changes or conflicts between the mainline through traffic and ramp-related traffic, where drivers have sufficient length to safely change their lane or adjust their speed before exiting or entering the freeway’s mainline toward a ramp. Another interesting finding was that the presence of ramp(s) merging into or diverging from the ramp of interest increased CMV crashes. This result is intuitive and can be explained by the risk of vehicle-to-vehicle collisions, especially same-direction sideswipe or rear-end crashes, increasing with the presence of merging/diverging ramp(s).
With regard to ramp configuration, the results showed that diamond and parclo/free-flow loop ramps experienced more crashes than other ramp categories. A possible explanation for this finding is that diamond and parclo ramps have relatively lower speed limits than other ramp types. Consequently, drivers may face more difficulties in adjusting their speed to the speed limits of these ramps, especially near ramp terminals, which require drivers to come to a complete stop at some instances. Moreover, parclo and free-flow loop ramps have smaller horizontal curve radii, which might result in loss of vehicle control and possible CMV-related crashes. Similar findings were reported by Bared et al. ( 43 ). With regard to ramp type, on-ramps were found to experience more crashes than off-ramps. One potential explanation is that on-ramps were more prone than off-ramps to riskier driving actions, such as lane changing or merging maneuvers. Specifically, this is mainly a result of the increasing weaving maneuvers at on-ramps as drivers tend to change lanes from the ramp to the mainline lanes. This result is consistent with those in previous studies ( 43 , 45 ).
Cumulative Residuals (or CURE) Plots for Model Assessment
Figures 4 and 5, respectively, show the CURE plots against ramp AADT and fitted crashes created for each SPF model using the validation data set. As seen in Figure 4, all the CURE plots stayed mostly within ± 2σ (or ± 2 crash standard deviation limits) boundaries and were almost below the zero line. This indicates that all the models overestimated the expected number of crashes for a wide range of AADT in the validation data set. A similar CURE plot trend was also reported by Lu et al. ( 42 ), where the CURE plots were consistently below the zero line. The NB, HTNB, and CMP models generated almost identical CURE plots. However, the HTCMP model provided the best fit since its CURE plot was closer to zero (horizontal axis), especially for ramp AADT ranging from 5,000 to 15,000.
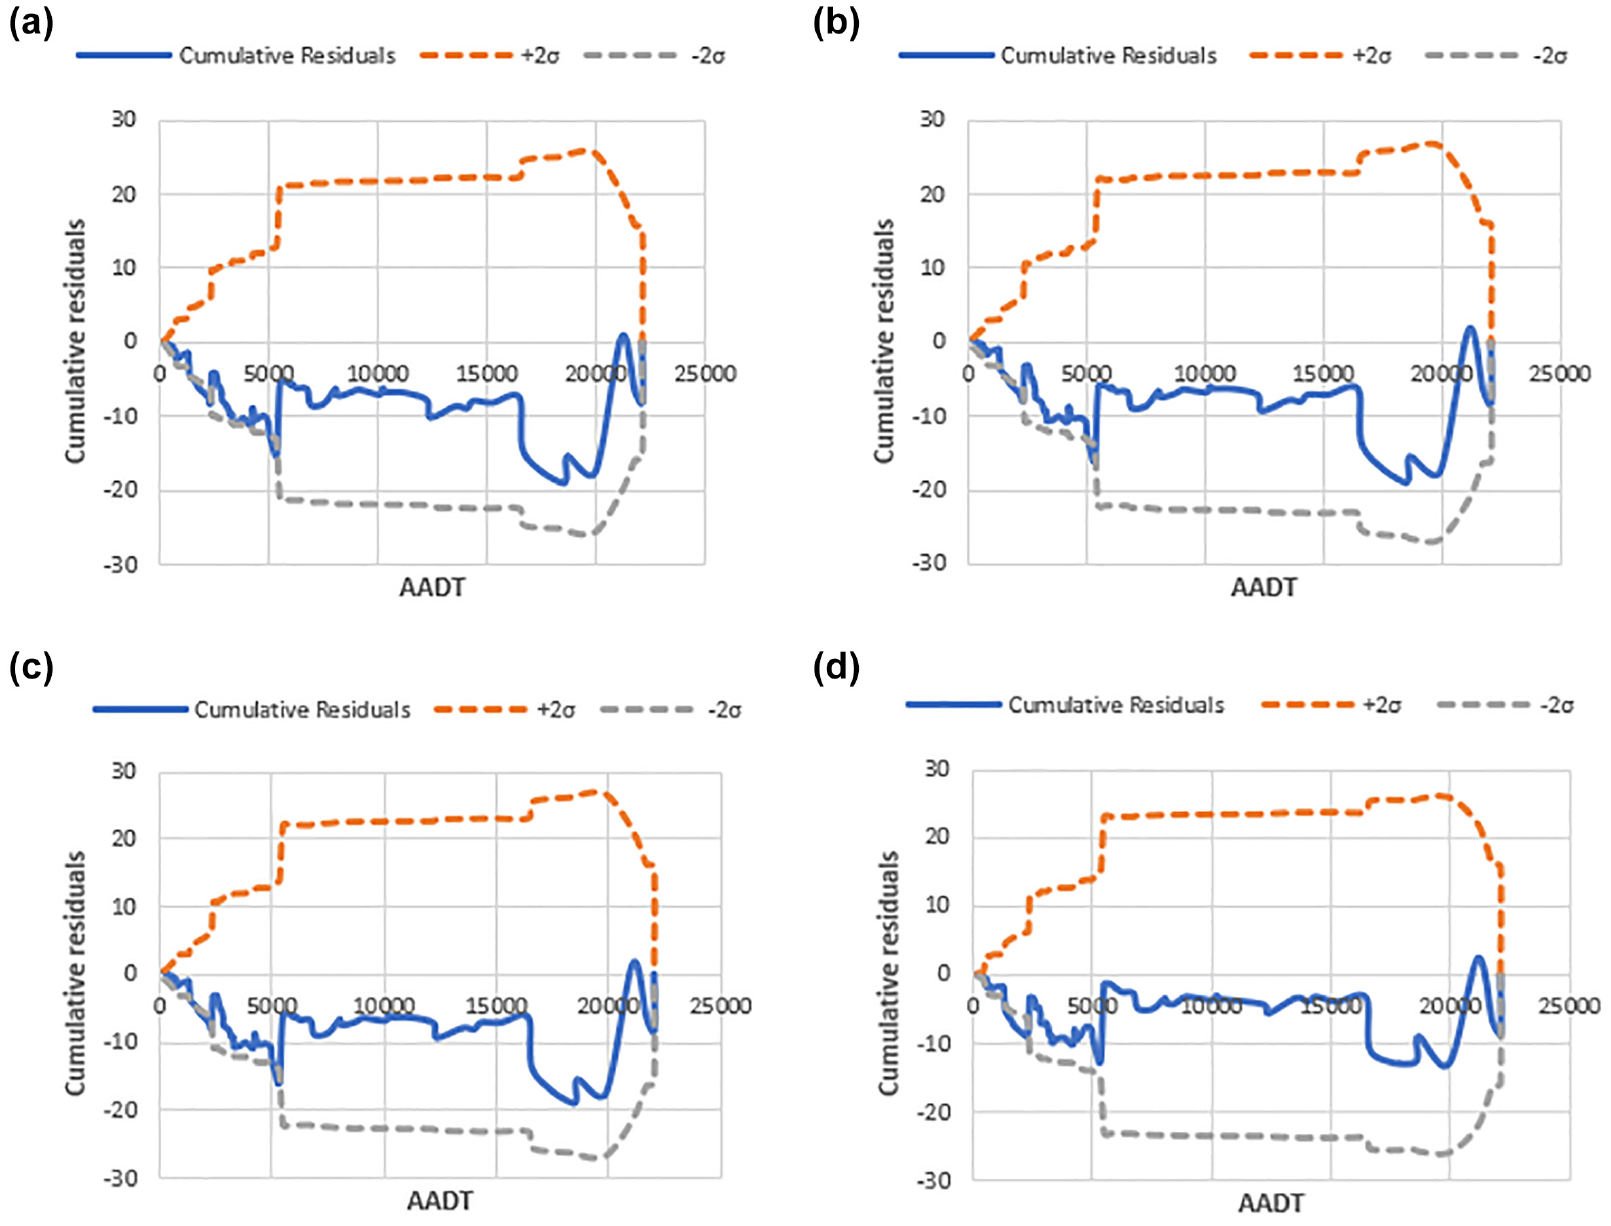
CURE plots versus AADT for: (a) NB model, (b) HTNB model, (c) CMP model, and (d) HTCMP model.

CURE plots versus fitted crashes for: (a) NB model, (b) HTNB model, (c) CMP model, and (d) HTCMP model.
Similarly, Figure 5 demonstrates that the cumulative residual plots for the NB and HTNB models were quite similar, while that of the CMP model stayed beyond the −2σ boundary at the beginning of the curve for the fitted crashes ranging between 0.24 and 0.64. Nevertheless, the plot for the HTCMP model was less biased and oscillated more closely to zero (horizontal axis), indicating a better overall fit for the model. The CURE plots thus supported the conclusion that the HTCMP model was the best-fit approach compared with the other models.
Overall, almost all GOF measures favored the HTCMP model over the other fitted models, indicating that the HTCMP could be used as a promising SPF tool for effectively predicting CMV-related crashes on ramp segments. The superiority of the HTCMP model can be attributed to this model, compared with the other comparing models, capturing better unobserved heterogeneity by allowing the dispersion parameter to vary across the crash sites.
Proposed Countermeasures for CMV Safety Along Ramp Segments
Based on the HTCMP model results, potential engineering and vehicle-related countermeasures were proposed to improve CMV safety along ramp segments, as follows:
Ensuring existence of roadside safety barriers on ramp segments.
Providing wider left shoulders of at least 4 ft (since there was a reduction in CMV crashes on-ramps having shoulders wider than 4 ft) (refer to Figure 6a).
Increasing ramp gore lengths to be at least 730 ft (since there was a reduction in CMV crashes on-ramps having gore lengths of at least 730 ft) (refer to Figure 6b).
Installing warning signs at the end of a merging ramp connecting to another ramp segment.
Improving ramp delineation, such as installation of chevrons, flashing beacons, or advanced curve warning signs, especially on-ramps with sharp curves.
Ensuring the existence of warning signs on main ramps to inform drivers of merging or diverging ramps ahead.
Using in-vehicle truck intelligent crash-preventive systems, such as forward collision warning system, autonomous emergency braking, and electronic stability control, to reduce CMV crashes related to driver errors (e.g., inability to control vehicle or improper lane changing) or CMV rollover occurrence.

Commercial motor vehicles (CMV) crashes versus: (a) ramp left shoulder width (ft); and (b) ramp gore length (in 1,000 ft).
Conclusions
Acknowledging the relatively limited research on CMV-involved crashes on ramp segments, as well as the lack of studies on selecting different SPF forms, this study took the initiative and applied a non-extensively applied safety model (the HTCMP model) as an SPF tool for predicting CMV crashes and identifying hazardous ramp segments in Kentucky. The HTCMP model possesses the ability to handle both over-dispersion and under-dispersion. To investigate the applicability of the HTCMP model in predicting CMV crashes, this study compared the HTCMP model to three other modeling approaches, including the traditional NB, HTNB, and CMP models.
Detailed information on five-year crash data, between 2015 and 2019, and site-specific characteristics were collected on 298 ramp segments in the state of Kentucky. Almost all GOF measures, including Pseudo R2, AIC, BIC, and MSPE, favored the HTCMP model as the best-fit model. In the HTCMP model, ramp configuration and area type were significant in explaining the varying dispersion parameter. Moreover, on-ramps (relative to off-ramps), ramp AADT, ramp configuration (diamond and parclo/free-flow-loop ramps), left shoulder width, ramp gore length, absence of ramp left roadside barrier, and presence of other merging or diverging ramps within the ramp were significantly associated with CMV crash frequency on ramp segments.
A significant merit of this study is that it adopted CMP-family models (especially the HTCMP model) and compared them to the NB-based models (including the standard NB and HTNB) while developing CMV crash-specific SPFs. It was found that the HTCMP model is a promising approach for predicting CMV crashes along ramp segments and successfully identifying hazardous ramps. Future research is still recommended for comparing the HTCMP model to other models (e.g., NB, HTNB, and CMP) along other transportation facilities, such as intersections and road segments. Furthermore, it will be interesting to examine the transferability of the HTCMP models to other states in the U.S., as well as to other countries.
Footnotes
Acknowledgements
The authors would like to extend their gratitude to KYTC for providing the necessary crash and roadway data used in this research. The authors would like to acknowledge the following students who contributed to the data collection process: Jessica Clouser, Baron Williams, Nicholas Abshire, Tevin Leigh, Nathanael Hummel, and Ryan Mains.
Author Contributions
The authors confirm contribution to the paper as follows: study conception and design: Kirolos Haleem; data collection: Mehdi Hosseinpour; analysis and interpretation of results: Mehdi Hosseinpour; draft manuscript preparation: Mehdi Hosseinpour; draft manuscript preparation: Kirolos Haleem. All authors reviewed the results and approved the final manuscript version.
Declaration of Conflicting Interests
The author(s) declared no potential conflicts of interest with respect to the research, authorship, or publication of this article.
Funding
The author(s) disclosed receipt of the following financial support for the research, authorship, or publication of this article: The authors would like to acknowledge the Kentucky Transportation Cabinet (KYTC) for the grant provided to conduct this research.
The opinions, findings, and conclusions in this paper are those of the authors and not necessarily those of the Kentucky Transportation Cabinet.