
Abstract
The arrival-departure (AD) window is actually an area that controls takeoff, where departing aircraft on the side runway are not allowed to take off when there are approaching aircraft in the AD window. To solve the operation conflict of the lateral runway system, the model and method of AD window based on collision risk theory are proposed for the first time. Firstly, the paper takes the operation process of the landing and departing aircraft under the simultaneous operation of the lateral runway as the research object, and gives the risk prediction based on the flight program protection area combining the runway configuration and the operation characteristics of the aircraft. Secondly, combined with the relative position change characteristics of aircraft pairs on the lateral runway, the real-time dynamic interval calculation model of two aircraft is built. The lateral runway collision risk calculation model based on position error theory is further established. Then, the solution process of AD window is designed based on the dichotomy method, so as to determine the final AD window boundary. Finally, taking Beijing Daxing International Airport, China, as an example, the location of the AD window is calculated, and the boundary of the AD window is determined to be 8,012 m before the entrance of Dongyi runway, and the maximum critical collision risk value is 4.9371 × 10⁻⁹ times/flight hour. The results have been verified by the control simulator and applied to the actual operation of Beijing Daxing International Airport from 2019 to the present. The practical operation results show that the proposed method and model can quantitatively determine the position of the AD window and effectively control the operation risk of lateral runway systems.
Keywords
With the rapid increase of the demand for air transportation, the problem of airport operation congestion is becoming more and more prominent ( 1 ). One of the ways to improve airport capacity is to increase the number of runways. Therefore, major hub airports successively build new runways or change the runway configuration to meet the growing demand for flight takeoff and landing ( 2 ).
A lateral runway is one where two or more runways do not intersect but runway extension line have an intersection angle greater than 15 degrees, also known as open V-shaped runway. Beijing Daxing International Airport is the first airport with this runway configuration in China. Because of the safety risk of running lateral runways, our team accepted the commission of North China Air Traffic Management Bureau to find a solution to the problem.
The arrival-departure (AD) window is actually an area that controls takeoff, where departing aircraft on the side runway are not allowed to take off when there are approaching aircraft in the AD window. The concept and principle of the AD window will be introduced in the next section. The Federal Aviation Administration (FAA) suggests that the AD window could be used for intersecting runways to avoid conflict ( 3 ). Previous research has established the AD window by Monte Carlo simulation which reduces the collision risk to 10−9 ( 4 ). However, the length and position of the AD window have not been introduced by theoretical model calculation in the current literature.
At present, researchers at home and abroad have carried out many theoretical studies on aircraft collision risk. One type is aimed at en route collision risk, and there are is some research on: cross routes, such as the macro-planning of the cross route angle with the goal of optimizing the route structure; route micro-adjustment with optimizing the location of intersections as the core; factors such as the collision risk at the intersection of routes and the relationship between the angle of intersection, and the length of flight segments; and the use of the “event” model for cross-routes collision risk analysis ( 5 – 11 ). The other type is the study of runway operation mode, but most of the research is based on parallel runways, and the research under lateral runway operation is still in the exploratory stage: the Monte Carlo simulation method was used to calculate safety zones for parallel runway approaches at different intervals and to conduct collision risk analysis for unpredictable flight failures on parallel runway simultaneous instrument approaches; a model was established to analyze the sensitivity of wake to flight safety during paired approach; and real-time risk prediction and conflict resolution are carried out on the aircraft maneuvering in the terminal area ( 12 – 16 ). Taking the runway of Beijing Chengdu New Airport as an example: the operation method of multi-runway airport control, including the V-shaped runway, was studied; a cross-runway collision risk model was established based on conflict points by referring to the modeling method of cross-route conflict points; and a collision risk assessment model between approaching and going around aircraft and departing aircraft under the near-distance parallel runway configuration was established, and a method for setting the AD window was proposed ( 17 – 19 ). Although the above research results are abundant, the limitations are as follows: first, most of the research objects of the model are en route and parallel runways, and the collision risk of aircraft taking off and landing on the side runway is not involved—there are few studies on the collision risk of operation that involve one runway for takeoffs and one for landings; second, the research on the operation mode and risk control means of lateral runway is not mentioned; and third, the calculation results of collision risk are often analyzed, but the specific ATC (air traffic control) strategies are not considered, which makes it difficult to provide reference for practical applications.
Although previous studies give the established method of the AD window for closely spaced parallel runways, it does not conform to the operation mode of lateral runways. In this paper, the operation risk control problem of multi-runway airports with lateral runways is systematically studied. Then, the general calculation model and algorithm for calculating the lateral runway AD window is presented based on the collision risk theory, for the first time. Furthermore, taking Beijing Daxing International Airport as an example, the position of the lateral runway AD window is calculated, and the results have been verified by the ATC simulator and implemented in Beijing Daxing International Airport. Through the application of the AD window, the collision probability of aircraft during approach and departure can be reduced, to ensure operation safety, improve operation efficiency, and reduce the work burden of controllers. At the same time, in the aspect of air traffic flow management, the application of the AD window can plan the aircraft arrival and departure sequence and the allocation of runways in advance, as well as provide a prerequisite reference for flow management, to improve the congestion problem caused by heavy flow during peak periods.
The Basic Idea of the AD Window
According to FAA JO7110.65X, for non-parallel runways such as open V-shaped runways, air traffic controllers (ATCOs) are required to pay more attention to the departure aircraft in case of conflict with approach or departure aircraft on another runway ( 20 ).
As shown in Figure 1, the AD window is a rectangular box on the runway center line with the direction of approach. When the lateral runways are in use simultaneously, if there is an aircraft approaching on one runway in the AD window, the aircraft on the other runway is not allowed to take off. Only if there is no aircraft in the AD window can ATCOs issue takeoff instructions to the aircraft on the other runway. Figure 1 is a schematic of one situation where every direction of each runway can have its own AD window if necessary. It also appears in other modes of operation, such as the simultaneous takeoff and departure of two runways, where the two aircraft converge to a point.
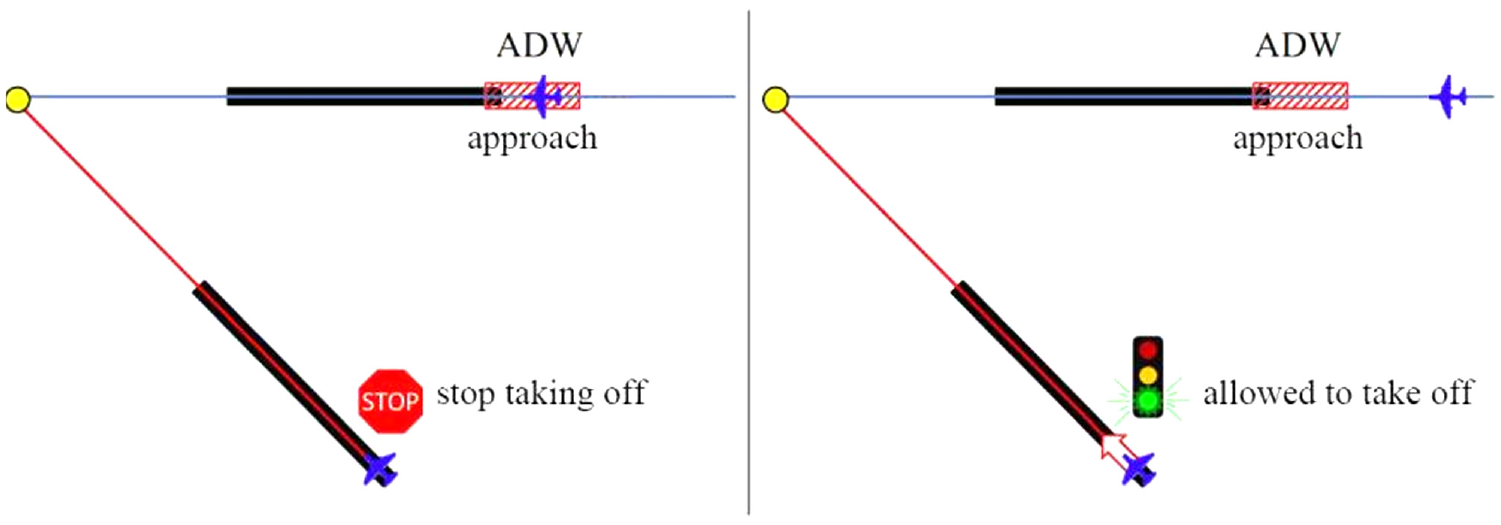
Arrival-departure (AD) window schematic diagram.
The main research difficulty of AD windows is how to determine their length and position. The idea of the AD window based on collision risk theory is to establish an appropriate collision risk calculation model, so that the AD window determined according to the calculation results of this model can ensure that the collision risk of aircraft running simultaneously between runways can meet the requirements of the minimum safety target level.
Establishment of Lateral Runway Collision Risk Model
Establishment of Collision Risk Model
The collision risk model is established based on the theory of position error probability, which can calculate and analyze the change trend of risk value over time in the dynamic process, and judge the rationality of the change of risk according to the motion process. The basic theory of the collision risk model based on position error is that the actual position of the aircraft and the desired position of the aircraft have position errors resulting from navigation system accuracy and human operations. After collecting half a year’s aircraft radar data and analyzing the flight track deviation at the final approach stage of Beijing Capital International Airport, it is found that this error can be considered to obey the normal distribution. Figure 2 shows the track distribution during final approach.
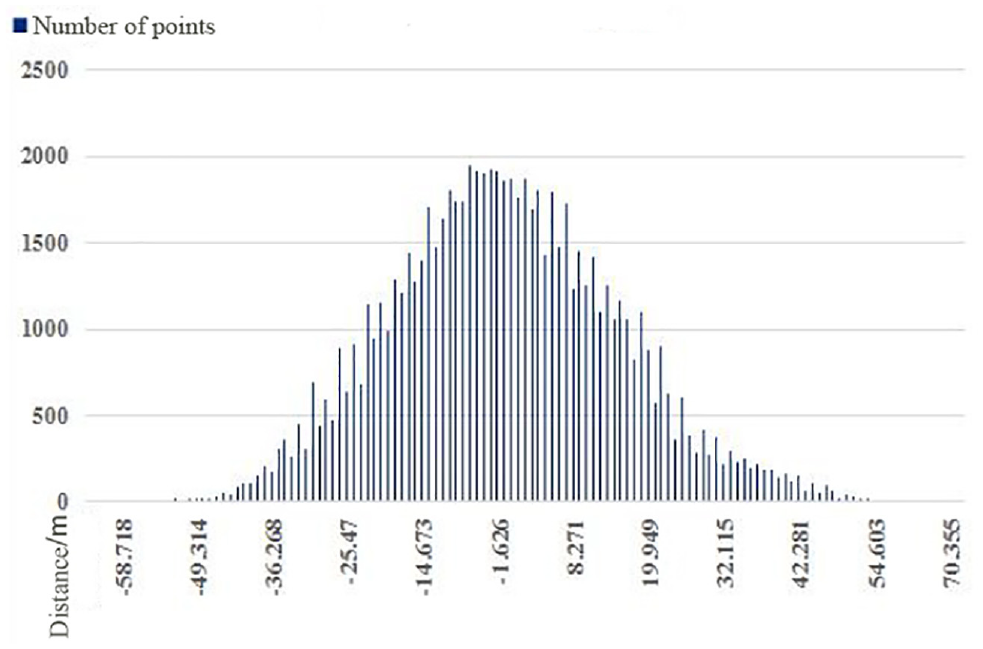
Track distribution during final approach.
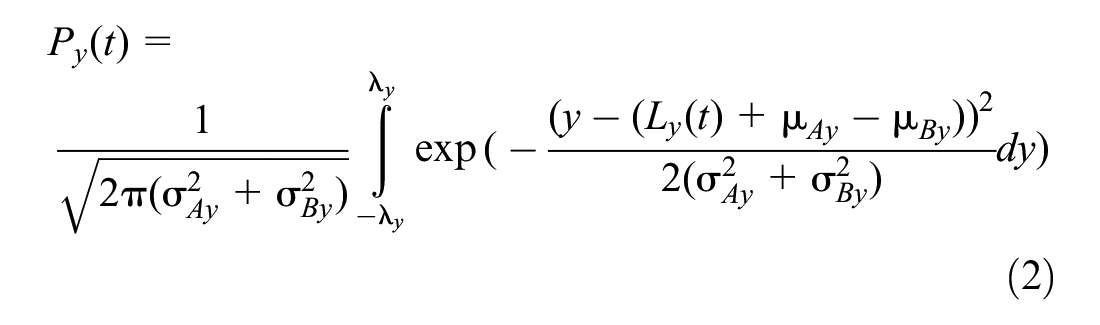
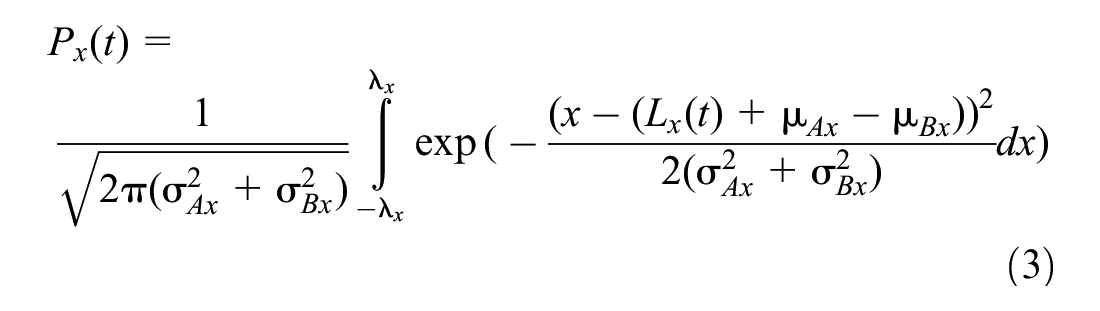
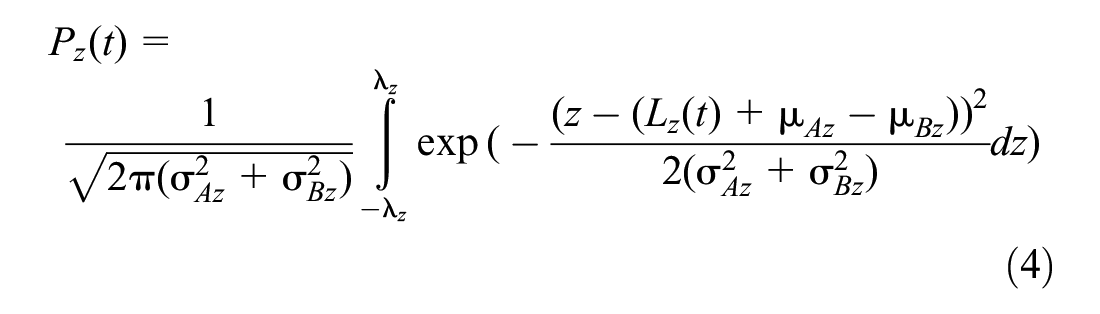
By integrating the probability density function of the distance between the two aircraft, the probability of collision between the aircraft can be obtained. The basic formula is as follows:

where
d = the collision distance between two aircraft (when the distance between the center lines of the two aircraft is between d and −d, it means that the two aircraft collided); and
According to the distance and position error distribution between the aircraft, the calculation formulas of the lateral collision risk, longitudinal collision risk, and vertical collision risk of the two aircraft are further written as follows:
where
μ ix = the mean values of position errors in the lateral directions;
μ iy = the mean values of position errors in the longitudinal directions;
μ iz = the mean values of position errors in the vertical directions
If there is a risk of collision between two aircraft, they must overlap in the lateral, longitudinal, and vertical directions at the same time, so the total collision risk value is the product of the lateral, longitudinal, and vertical collision risks.

Taking the lateral separation as an example, the next section will focus on solving the computational modeling of the dynamic separation
Dynamic Separation Calculation of Two Aircraft
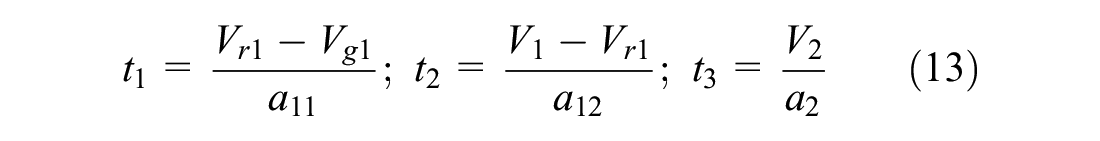
Taking the configuration of Figure 3 as an example, according to the lateral runway configuration and the ATC operation procedure, the southward movement trajectories of aircraft A and B are shown. Aircraft A is approaching, and will conduct a left-turn missed approach program. Because the missed approach program will turn the aircraft at a specified altitude, it is possible for the aircraft to turn left between the missed approach point (MAPt) and the latest turn point. Aircraft B is going to departure. It can be seen from Figure 3 that there is a possibility of collision between aircraft A and B. Based on the kinematics equation of the aircraft, the dynamic separation calculation model during the change of motion state change of two aircraft is established.
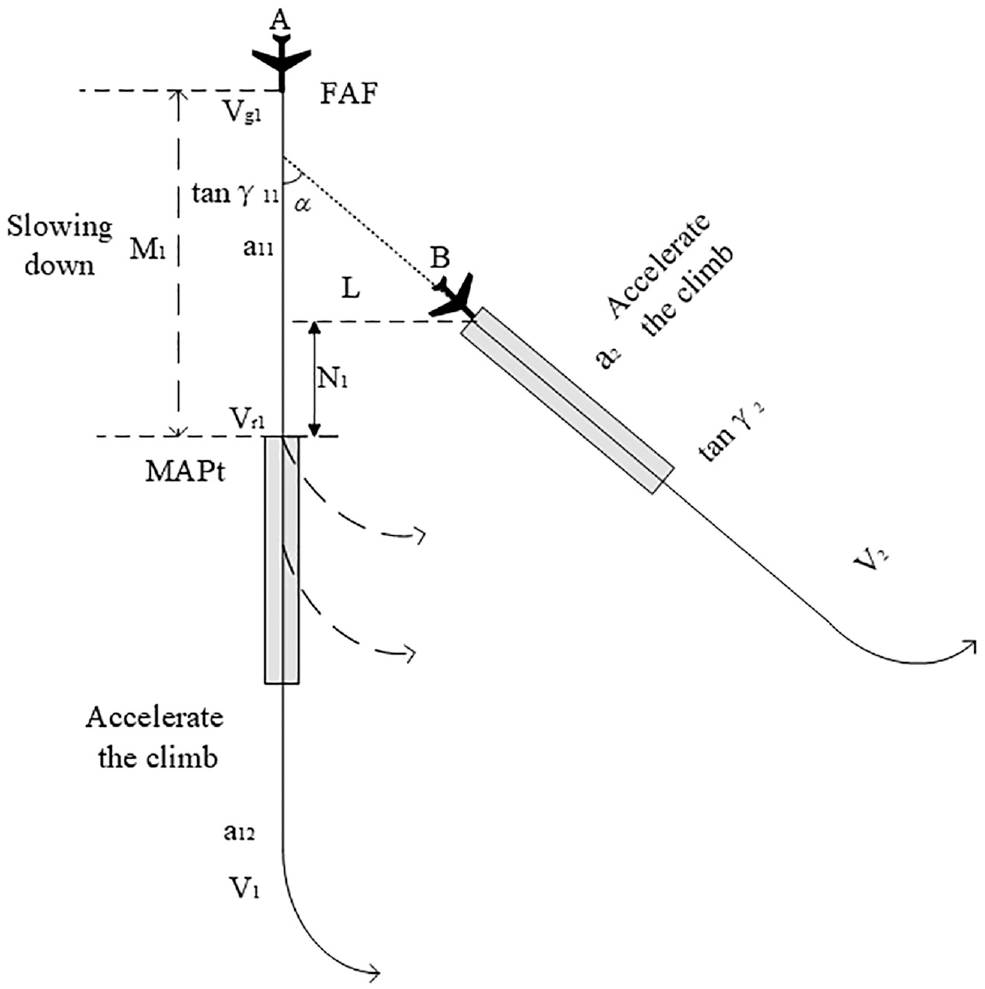
The theoretical trajectory of southward aircraft.
As shown in Figure 3, if the lateral runway threshold is in front of the landing runway threshold, the staggered distance between the two runway thresholds in the longitudinal direction (N1) is positive, otherwise, N1 is negative. The basic environmental conditions are as follows:
Take the landing runway as the criterion, and the lateral runway as the takeoff runway.
There is a possibility that the approach aircraft will conduct missed approach.
Since the flight procedure generally specifies the respective altitude for missed approach turning and departure turning, the two aircraft have already met a sufficient altitude difference at the turning point, so there is no need to consider the conflict risk after the turning point of missed approach.
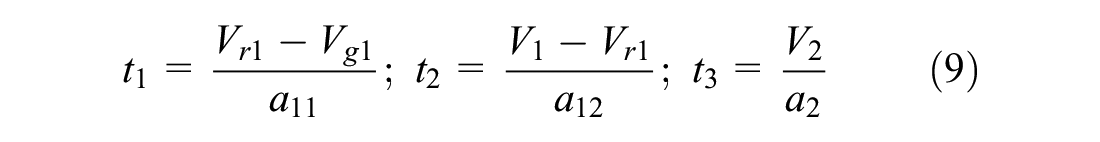
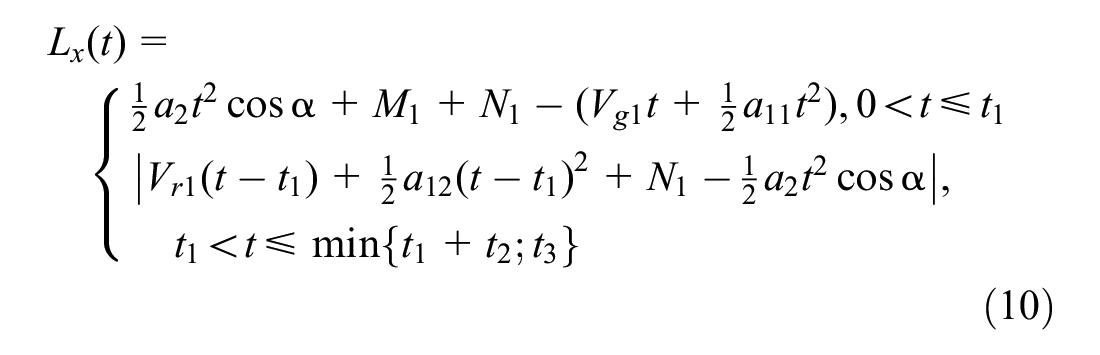
Since different aircraft have different altitudes and speeds when they reach the missed approach point (MAPt), the altitude and speed of the aircraft at the final approach fix (FAF) basically remain the same, so the entire process of the lateral runway system is that an approach aircraft A decelerates and descends from the FAF, accelerates to climb at the MAPt, and turns at the missed approach turning altitude until there is a sufficient altitude difference with the departing aircraft. At the same time, the departure aircraft B starts to accelerate from the lateral runway threshold to the end of the departure turning point. It can be concluded that the dynamic separation between aircraft pairs operating southwards is:


where
The process of the lateral runway system in the north direction is as same as that of the south direction. The difference is that the approach and departure trajectories will converge. The dynamic separation between the aircraft pairs operating northwards are as follows:

According to the operation direction, different dynamic separation formulas are selected and brought to the corresponding Equations 2 to 4 respectively. Then, the results are put into Equation 5 to obtain the collision risk value of the whole process.
AD Window Building Process
In this section, the establishment process of the AD window will be introduced in detail, and the generality of the model under different cases will be explained.
Determine Whether Collision Risk Calculation is Necessary
For the combined operation of each runway, whether the collision risk needs to be calculated should be determined according to the overlap of the protection areas of the flight procedure. The protection area of the flight procedure is an area that covers the 99.6% probability of aircraft occurrence. If there is no overlap between the corresponding flight protection areas of the aircraft operating in a certain combination mode between the lateral runway systems, it can be directly concluded that the collision risk of the aircraft operating in this combination mode meet the minimum safety target level, and there is no need to calculate the collision risk. If the protection area of the lateral runway overlaps with those of other runways, it is considered that the approach or missed approach aircraft and the departure aircraft may appear in the overlapping area at the same time, so the collision risk needs to be further calculated.
Take the southward operation of the lateral runway system of Beijing Daxing International Airport as an example, as shown in Figure 4.
Lateral runway takeoff and landing protection zone.
Calculation of Collision Risk Value
Since the trajectory of final approach aircraft generally aligns with the runway centerline, and the initial departure mostly requires a straight climb segment, the change trend of the aircraft speed is basically the same, so the differences of different lateral runway systems mainly affect the value of the model calculation parameters. Since the position error probability model depends on the navigation method and its navigation accuracy, to ensure the versatility of the model and the correctness of the calculation, the trajectory data of aircraft in each direction of the runway should be collected and the distribution test should be performed to determine the mean and variance of the data which are normally distributed. In addition, model calculation parameters such as speed and acceleration for stable operation should be collected for more than 3 months.
After collecting the relevant parameters, calculate the collision risk according to the collision risk model given in Establishment of Collision Risk Model and Dynamic separation calculation of two aircraft When the calculated collision risk value is less than the specified safety target level
Calculation of Wake Separation
Aircraft wake turbulence refers to the air flow formed in the tail of an aircraft during flight. The wake generated by the front aircraft will affect the flight of the trailing aircraft.
During the construction of the AD window, it is necessary to calculate the wake separation between aircraft pairs in each operation mode. The length of the AD window is the larger value between the operation safety separation and the wake separation. Since the research on the calculation of wake separation is relatively mature, the result of wake separation can be obtained, as long as the appropriate formula is chosen to calculate. This paper will not introduce the calculation of wake separation.
Calculation Process of AD Window Boundary
In view of the situation where the flight collision risk of two aircraft exceeds the specified safety target level, the AD window is established to control the safety risk below an acceptable level. The process of its establishment is as follows.
The positive and negative values of half of the wingspan of the aircraft are taken as the upper and lower limits of the integral of the lateral collision risk, respectively. The positive and negative values of one-half of the airframe length are taken as the upper and lower limits of the integration of longitudinal collision risk. Since the height difference in the vertical direction is difficult to guarantee, based on conservative consideration and to simplify calculation, the collision risk probability in the vertical direction is set as 1, that is, the height difference between the two aircraft is not considered.
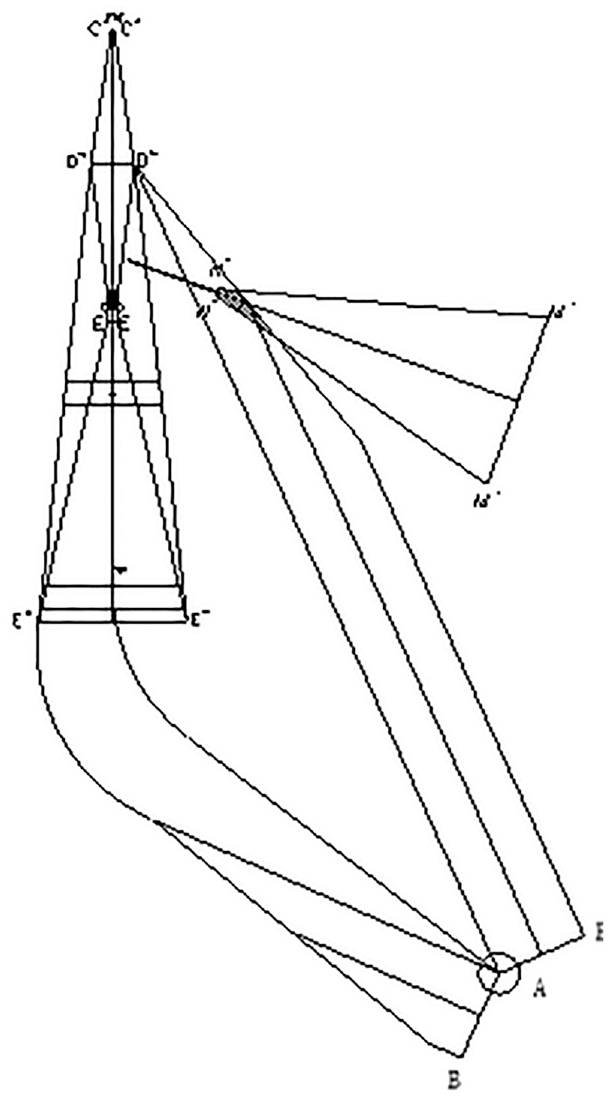
Through the calculation and analysis of the collision risk during the approach and departure process of the two runways, it can be inferred that the collision risk value increases the closer the approaching aircraft is to MAPt (usually at the entrance end of the runway), and then the collision risk value begins to decrease. Until 900 m past the entrance end of the runway, the risk value drops to zero. Therefore, 900 m away from the entrance of the runway is selected as the end point of the AD window. Select any point in the approach direction of the runway—as long as the calculated collision risk value of this point is less than the safety target level, this position can be used as the starting point of the initial AD window interval. This point can generally be selected as the farthest FAF of all flight procedures for the approach runway. Then, the binary method is used to optimize the initial boundary of the AD window. The whole optimization process is shown in Figure 5.
Step 1: Interval initialization. The MAPt point was selected as the end point of the interval, and the FAF point farthest from the runway entrance in the approach procedure was selected as the starting position of the interval to form an AD window interval.
Step 2: Calculate collision risk. Using the established collision risk model, the collision risk value at the center point of the interval is calculated.
Step 3: Determine whether the risk value meets the safety target level. If yes, go to Step 5. If no, go to Step 4.
Step 4: Take this point as the end point of the interval, update the interval range, and return to Step 2.
Step 5: Determine acceptability. Compare the difference between the risk value and the safety target level value to see if it is acceptable. The data difference is set to be acceptable within 1 × 10⁻¹⁰: If the difference between collision risk and safety target level is unacceptable, take this point as the initial value of the interval, update the range of the interval, and return to Step 2 for iterative calculation. If the error between the collision risk and the safety target level is within the acceptable range, this position is output as the final starting position point of AD window.
Step 6: Establishment of the AD window. Take the boundary defined in Step 5 from 900 m after the runway threshold as the AD window area.
Arrival-departure (AD) window boundary determination flow chart.
Practical Example
In this section, the AD window collision risk model is simulated based on the example of Beijing Daxing International Airport.
Determination of Parameters of Beijing Daxing International Airport
The runway configuration of Beijing Daxing International Airport is shown in Figure 6. At present, the West 1, West 2, East 1, and North 1 runways have been constructed and put into operation, among which the North 1 runway and other runways constitute the lateral runway system with open V-shape. This paper mainly studies the conflict of the lateral runway system. Since the spacing between the North 1 runway, the West 1 runway, and the West 2 runway is sufficient and there is no overlap between the approach and departure protection areas, it can be considered that there is no conflict between the North 1 runway and the West 1 and West 2 runways, so the main risk conflicts are concentrated between the East 1 runway and the North 1 runway. At present, the North 1 runway is only used for southbound takeoff; therefore, the case of East 1 and North 1 runways running southward is taken as an example to explain the determination process of the AD window.
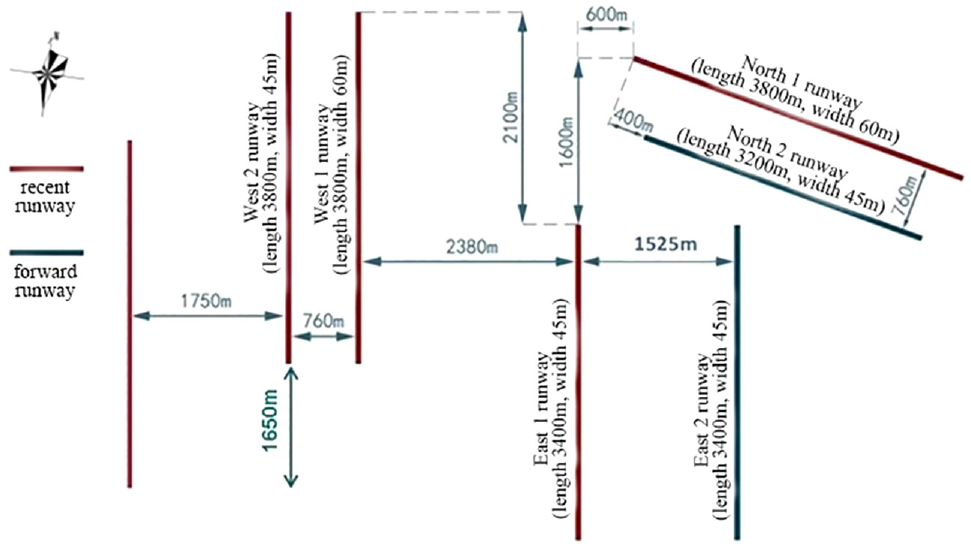
Runway layout plan of Beijing Daxing International airport.
Because of the need to determine the position of the AD window before the operation of Beijing Daxing International Airport, the aircraft position error data during the final precision approach the model required are collected from Beijing Capital International Airport which shares a similar position, and the same ATCs, navigation equipment, and operation procedures. About 14G radar data are collected from June 2016 to December 2017 at the Beijing Capital International Airport. The analysis and the statistical values of the parameters are shown in Table 1. It is verified that the position error distribution of the aircraft radar trajectory conforms to the normal distribution. The error values of the model in the missed approach and departure are conservative data given by the International Civil Aviation Authority (ICAO). On the basis of these data, the established position error model is used to evaluate the collision risk value of the East 1 runway and the North 1 runway at the same time.
Parameter Value of Model

Determination of AD window boundary
Determination of the Initial Interval
According to the algorithm of the AD window, collision risks of two flight position scenarios are simulated respectively:
Scenario 1: Take the time when aircraft A is at the FAF of East 1 runway and aircraft B takes off from the lateral runway.
Scenario 2: Take the time when aircraft A is at the MAPt of East 1 runway and aircraft B takes off from the lateral runway.
Figure 7 shows schematic operating modes for Scenarios 1 and 2.
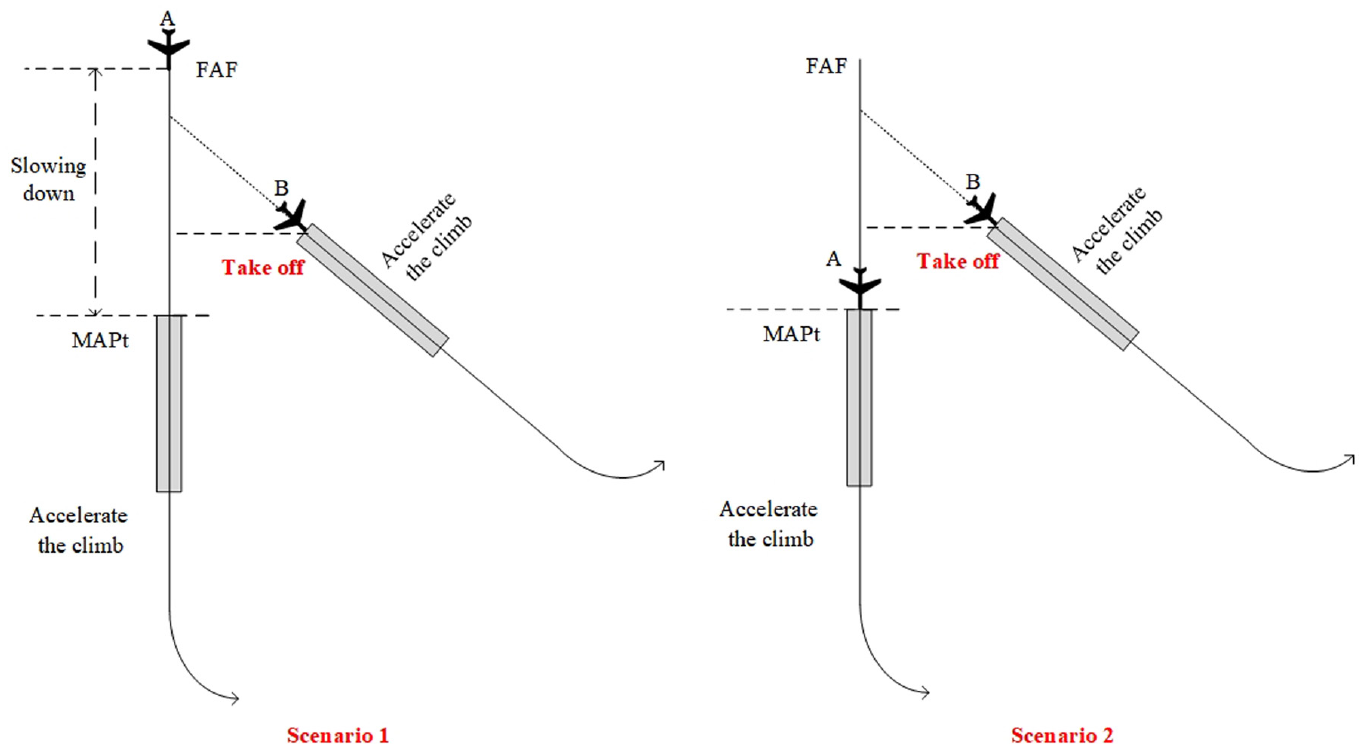
Schematic operating modes for Scenario 1 (left) and Scenario 2 (right).
Figure 8 shows the calculation results of Scenario 1, and the collision risk assessment of aircraft A at FAF when t=0. It can be seen that the longitudinal collision risk is 0 times/flight hour. Since the total collision risk is the product of the longitudinal, lateral, and vertical collision risks, the total collision risk is also 0 times/flight hour, that is, the risk meets the safety target level in Scenario 1.
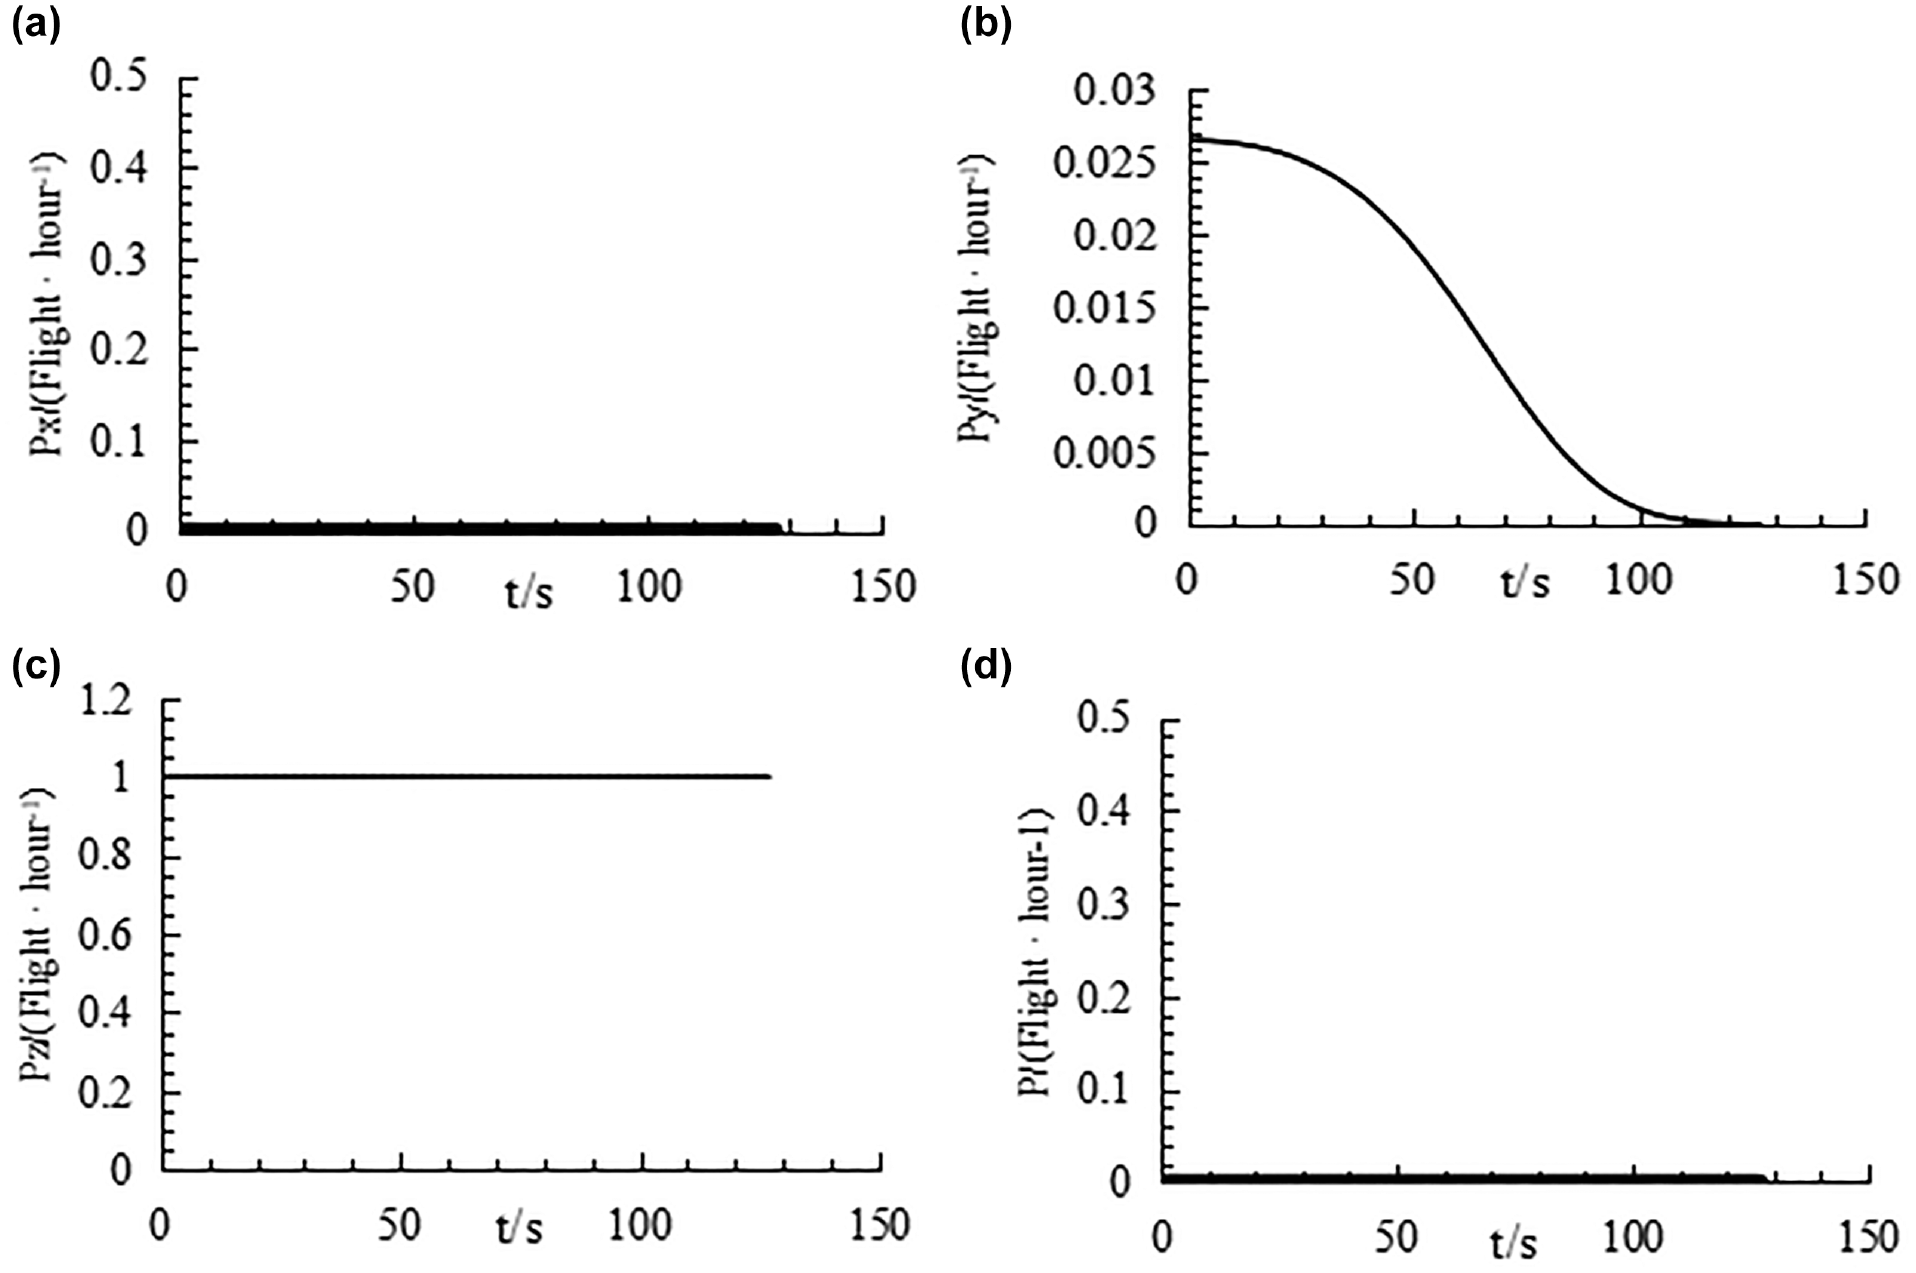
Two-aircraft collision risk of Scenario 1: (a) value of longitudinal collision risk, (b) value of lateral collision risk, (c) value of vertical collision risk, and (d) total collision risk value.
Figure 9 shows the calculation results of Scenario 2. In this scenario, the total collision risk is increasing first in the first 10 s, and then decreasing, reaching a maximum of 0.0175 times/flight hour at 4 s, which exceeds the safety target level specified by ICAO by 5 × 10⁻⁹ times/flight hour. After 20 s, the total risk remains at zero.
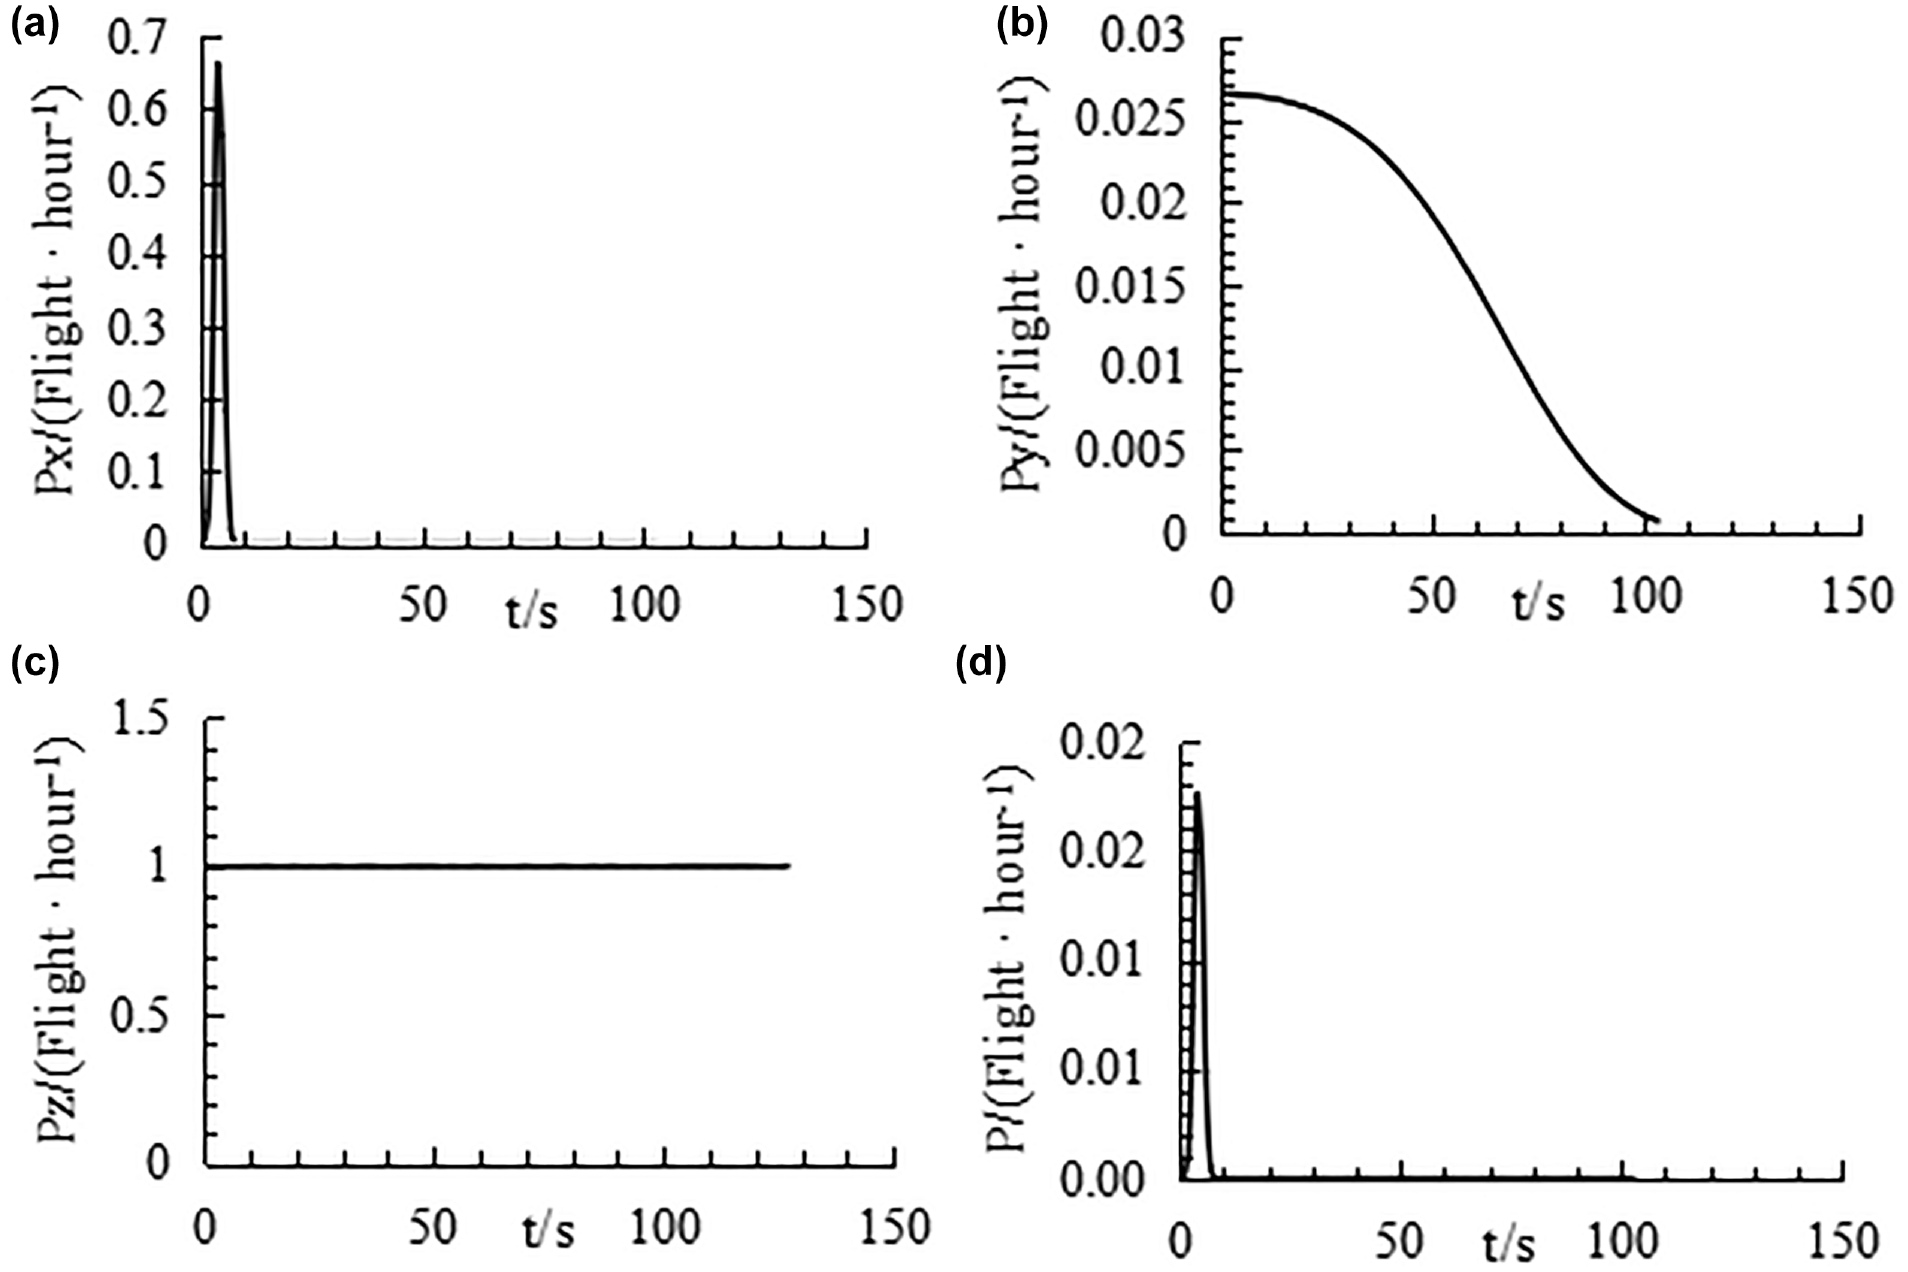
Two-aircraft collision risk of Scenario 2: (a) value of longitudinal collision risk, (b) value of lateral collision risk, (c) value of vertical collision risk, and (d) total collision risk value.
The change trend of longitudinal collision risk is similar to that of total collision risk (see the left-hand diagram in Figure 7). It first increases and then decreases in the first 10 s of the process, and the longitudinal risk is the largest at 4 s, which is 0.6607 times/flight hour. Referring to Figure 5, it can be seen that at 4 s, aircraft A is in the deceleration phase, and at the same time aircraft B has a low takeoff speed and a short distance from the end of the runway. The longitudinal distance between the two aircraft is the closest in 4 s, so the risk of longitudinal collision appears at a peak. For lateral collision risk, see the right-hand diagram in Figure 7; since the two runways are in an open V-shaped layout, as the movement time increases, the lateral distance between the two aircraft also increases, and the risk of lateral collision is negatively correlated with the lateral distance and gradually decreases over time. The maximum value of lateral collision risk appears at the beginning of the simulation, which is 0.0265 times/flight hour.
It can be seen that, between the FAF and the MAPt, there is a certain position that meets the total collision risk below the safety target level. The FAF and the MAPt form the initial interval of the AD window boundary. Next, the boundary position of the AD window will be determined according to the process in Figure 4.
Determine the Boundary of the AD Window
The dichotomy is used to narrow the interval, approach the safety target level specified by ICAO in accuracy, and further determine the AD window boundary.
Figure 10 shows the change of collision risk at the final AD window boundary position. At this time, the boundary of the AD window is 8,021 m away from the runway threshold. The maximum risk of total collision risk is 4.9371 × 10⁻⁹ times/flight hour, which meets the safety target level. The difference reaches the ideal acceptability.
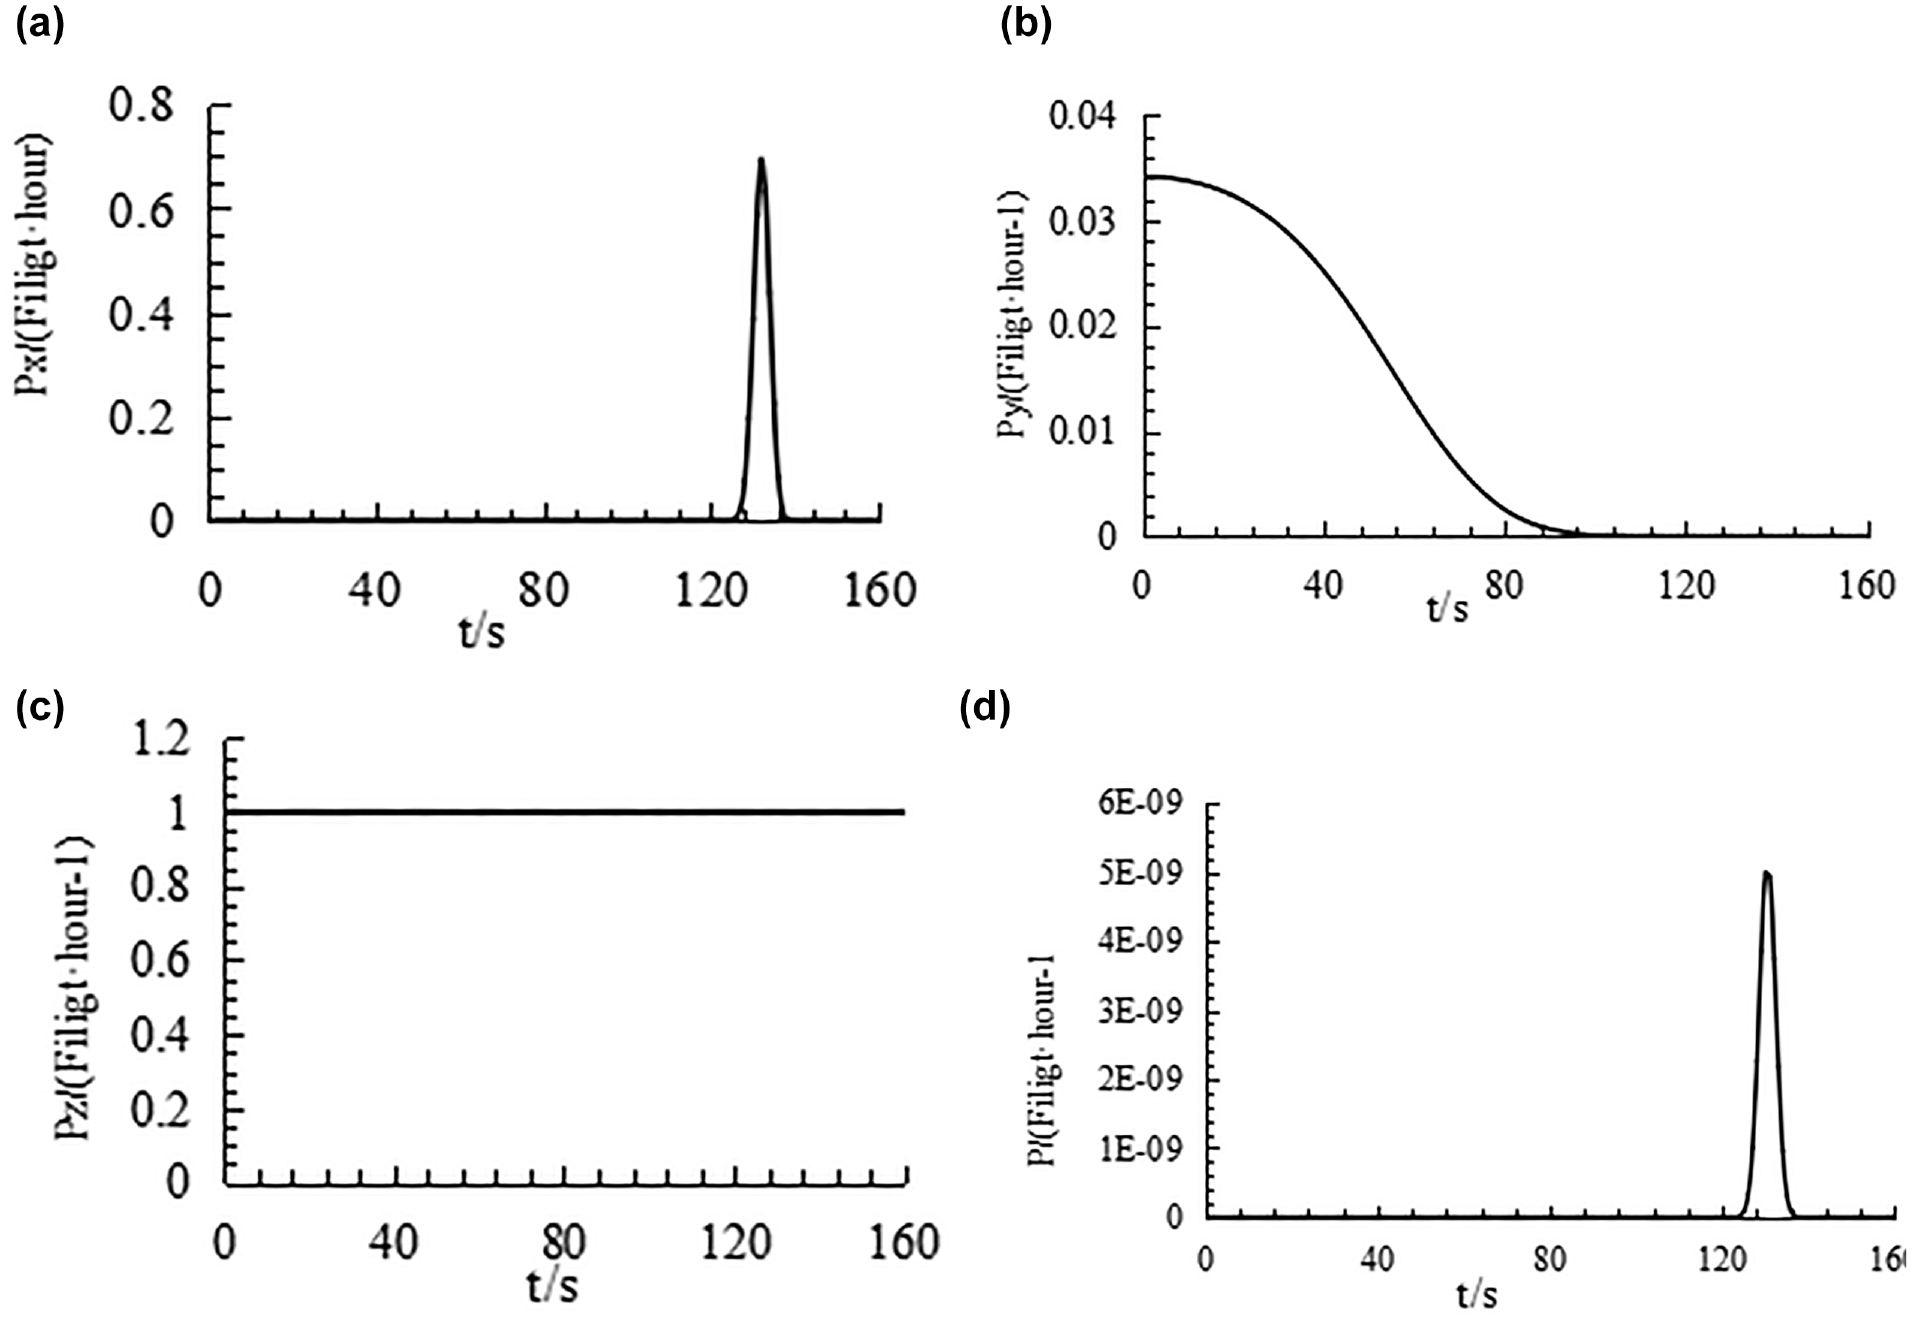
Two-aircraft collision risk of the arrival-departure (AD) window: (a) value of longitudinal collision risk, (b) value of lateral collision risk, (c) value of vertical collision risk, and (d) total collision risk value.
By analyzing the data of collision risk in all directions, we can get that the timing is 0 when the approach aircraft enters the AD window, and the value of longitudinal and total collision risk reaches the peak at 127 s.
Combined with the wake analysis, the interval required by the wake is smaller than the interval assessed by the safety risk; that is, when running southward, the boundary of the AD window of the East 1 runway is located 8,012 m away from the runway entrance.
The AD window boundary was programmed into the ATC simulator of North China Air Traffic Control Bureau for verification, and it was proved that no flight conflict occurred when the AD window was established. Moreover, as a new automatic ATC tool, the AD window helped to simplify the ATC rules of the lateral runway and improved the work efficiency of the ATCOs.
Recently, the collection and analysis of radar data at Beijing Daxing International Airport proved that the previous parameter values are reasonable.
Conclusions
According to the operation characteristics of the lateral runway system, the kinematic models of aircraft pairs on the lateral runway system were established in different directions. Based on the collision risk theory of position error, the dynamic collision risk assessment model of the lateral runway was established, and the theoretical model and calculation method of the AD window were proposed.
The model considers the operation state of aircraft on the runway by stages, and quantifies the correlation between collision risk and the AD window boundary position by establishing real-time interval algorithm between aircraft pairs, which provides theoretical support for the control department to formulate operation plans.
The simulation results of ATC simulator and the actual operation results of Beijing Daxing International Airport show that the proposed model and method can accurately design the AD window to avoid flight conflicts during aircraft operation. As shown in Figure 11, the AD window (the orange rectangle) has been actually applied on the ATC screen of Beijing Daxing International Airport tower.
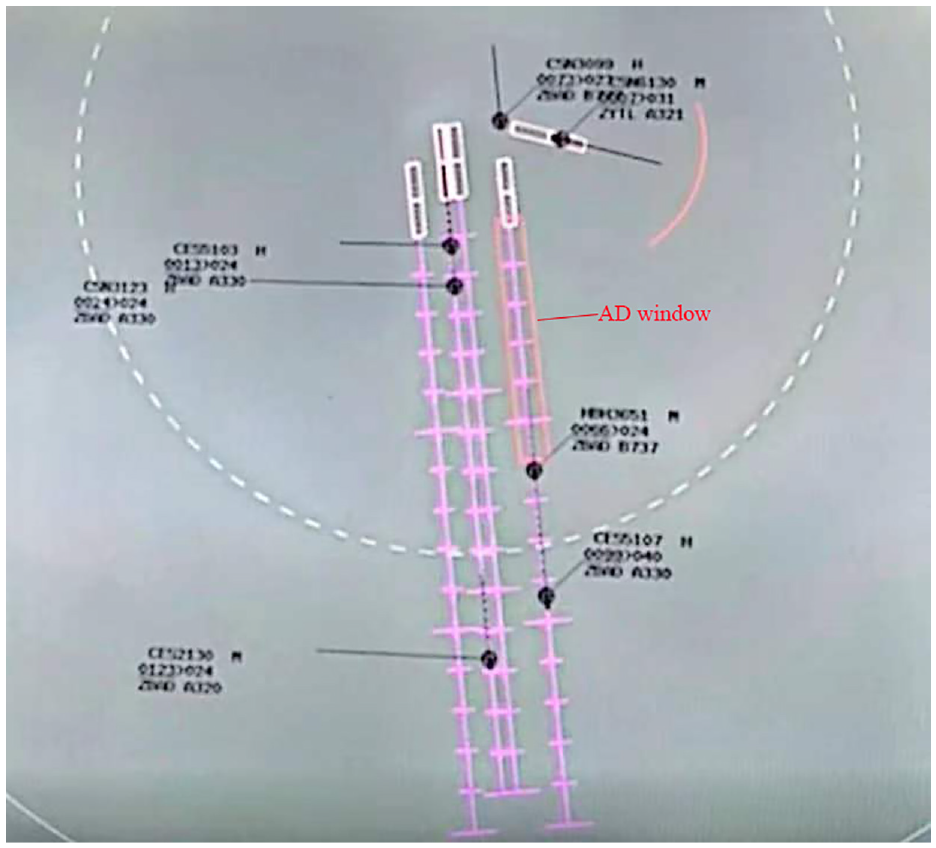
Application of the arrival-departure (AD) window in control simulation.
With the application of new technology, the position error of the missed approach and departure trajectory will reduce. By applying this method to recalculation, the AD window position can be further optimized.
Although the model established can effectively determine the specific boundary of the AD window, it still has the following limitations: to simplify the analysis process, the vertical collision risk is regarded as 1 but, in fact, this risk changes according to different situations. Further research needs to be done in the future: the dynamic wake interval can be considered to establish a dynamic AD window, and a more accurate distribution of the error train in the vertical direction can be obtained, so as to further optimize the range of the AD window. At the same time, the model algorithm should be further optimized to improve the computational efficiency. In the next step, it is necessary to study the influence of uncertain winds on the wake trajectory of an aircraft during takeoff or landing. Since the influence of wind may have an impact on the AD interval of the aircraft, the range of the AD window can be optimized by considering the uncertainty of wind on the wake trajectory of the aircraft.
Footnotes
Author Contributions
The authors confirm contribution to the paper as follows: study conception and design: Lili Wang, Jie Yang; data collection: Jie Ren; analysis and interpretation of results: Lili Wang, Jie Yang; draft manuscript preparation: Jie Yang, Jie Ren. All authors reviewed the results and approved the final version of the manuscript.
Declaration of Conflicting Interests
The author(s) declared no potential conflicts of interest with respect to the research, authorship, and/or publication of this article.
Funding
The author(s) disclosed receipt of the following financial support for the research, authorship, and/or publication of this article: This work was jointly supported by the National Natural Science Foundation of China and the Civil Aviation Administration of China (No. U1633124).