



Abstract
This study analyzed motorist and bicyclist understanding and preference of positive confirmation of detection of a bicycle by the traffic signal infrastructure using a blue light detection confirmation (BLDC). The research analyzed results of an online survey of 1,123 respondents and intercept survey of 337 respondents. The study initially found that participants of the survey did not understand the meaning of the blue light itself, but comprehension of the system rose from 40% to 50% when supplemental signs were used. Respondents overwhelmingly indicated that they preferred the sign option that included symbols, text, and a representation of the blue light, in comparison with the sign options that only included symbol and text, or text and blue dot. Additionally, respondents indicated that they “strongly agree” that the supplemental signage helped with understanding the purpose of the detection confirmation devices, that they would support the system at intersections, and that it made them feel better about waiting at an intersection with light. Including supplemental signage with the symbol, text, and blue dot could potentially improve the riding experience for users, as it was strongly preferred among the alternative sign options that were tested; however, further evaluation of sign configurations may be warranted.
Signalized intersections—which have historically been designed and operated to promote the efficient movement of vehicular traffic—present an increased crash risk for bicyclists and are a location of elevated stress. Currently, at signalized intersections, bicyclists are primarily detected by in-pavement inductive loops, often by the same loops used for vehicle detection. While vehicles are almost always detected because of their size and predictable stopping location, that is not the case for bicycles. If bicyclists do not position themselves for optimal detection, there can be failures in detection resulting in unnecessary delays. These delays lead to a lower quality experience and may lead to increased risk-taking behavior (i.e., signal non-compliance). A blue light detection confirmation (BLDC) system can provide positive confirmation to the bicyclists that they have been detected. In the typical application, a small blue light is placed on the far side of the intersection near the signal head that the bicyclist is monitoring for information (either a vehicular or bicycle signal head). When bicyclists are detected and a call is placed, the blue light illuminates. Because most of the public do not understand how traffic signals operate, it is critical to present a message that is comprehended by most people.
The objective of this paper is to investigate the use and comprehension of a BLDC system in the U.S. context. An online survey and survey of intercepted bicyclists at signalized intersections with various BLDC systems installed were conducted to determine the general public’s comprehension and preference of the BLDC system and three supplemental sign alternatives.
Detection systems have been evaluated and studied by researchers and practitioners to determine their effectiveness and comprehension with both motorists and bicyclists. Boudart et al. first evaluated the impacts of a BLDC at one signalized intersection in Portland, Oregon (OR) ( 1 ). Video data were collected in three phases—before condition, after blue light installation, and after blue light and informational sign installation. In the before condition, bicyclists primarily used the pushbutton to be detected, despite the presence of 9C-7 pavement detector marking (the R10-22 sign was absent). After the blue light and informational sign installation, a statistically significant decrease in bicyclists using the pushbutton was observed ( 1 ). Boudart et al. continued their work and tested the modified UM-Columbia pavement marking (which includes a bicycle symbol, “wait here for green” text, and a green dot) along with the BLDC at two intersections in Portland, OR ( 2 ). A postcard intercept survey was also administered at the two sites, with the postcard containing a link to an online survey. A total of 213 respondents responded to the online survey. The findings of the survey revealed differences in comprehension of the BLDC at the two sites, 86% and 58% ( 2 ). The authors hypothesized that the higher comprehension at one site could be related to the longer length of time the BLDC had been active at that location compared with the other location ( 2 ).
Recently, Oregon Department of Transportation (ODOT) conducted an experiment at the intersection of Commercial and Union Streets in Salem, OR, with the BLDC ( 3 ). In the before test, a bicycle stencil (MUTCD bicycle lane symbol marking) was located on the westbound approach to indicate where bicyclists should position themselves. In phase 1, a BLDC was installed on the eastbound and westbound approaches. In phase 2, an explanatory sign was placed next to the BLDC. In each phase, including the pre-installation phase, 40 bicyclists were observed via video footage. The findings revealed, in phases 1 and 2, higher rates of the call being held until the bicyclist entered the intersection (31% before, 42% phase 1, 47% phase 2). It was also observed that more bicyclists arrived and waited within the video camera’s detection zone after phases 1 and 2. An alternative to far-side BLDC would be to place BLDC on the nearside, perhaps more easily visible to the waiting bicyclist. In Christchurch, New Zealand, a nearside indication device has been in use for some time. As described on the “Cycling in Christchurch” blog, the city adopted the standard pedestrian pushbutton confirmation device to work for bicycles. The button is dark when the call is not active but lights up red when bicycles are detected.
Although crossing an intersection against a red indication can contribute to bicyclist-motor vehicle collisions, there is limited literature on bicyclist compliance at signalized intersections ( 4 ). Some studies have found that non-compliance by bicyclists is considered common behavior by drivers ( 5 – 7 ). Richardson and Caulfield examined the compliance of bicyclists in Dublin City, Ireland, using an observational survey and an online questionnaire ( 8 ). The results from the observational study revealed a non-compliance rate of 61.9%, with males demonstrating a higher likelihood of non-compliance ( 8 ). Overall, 49% of survey respondents stated that they would not comply with the signal indication ( 8 ). This suggests that, without detection feedback, users often indicatedor were observed not complying with the signal indication; however, if technology could be used to provide feedback to users, this could help to improve operations, safety, and the overall cycling experience.
Methodology
This research consisted of an online survey, as shown in Figure 1, and a survey of intercepted bicyclists at signalized intersections that had various BLDC systems installed. The survey, distribution methods, and record handling were reviewed and determined exempt by the Institutional Review Board (IRB) of Portland State University (PSU) (196376-18).
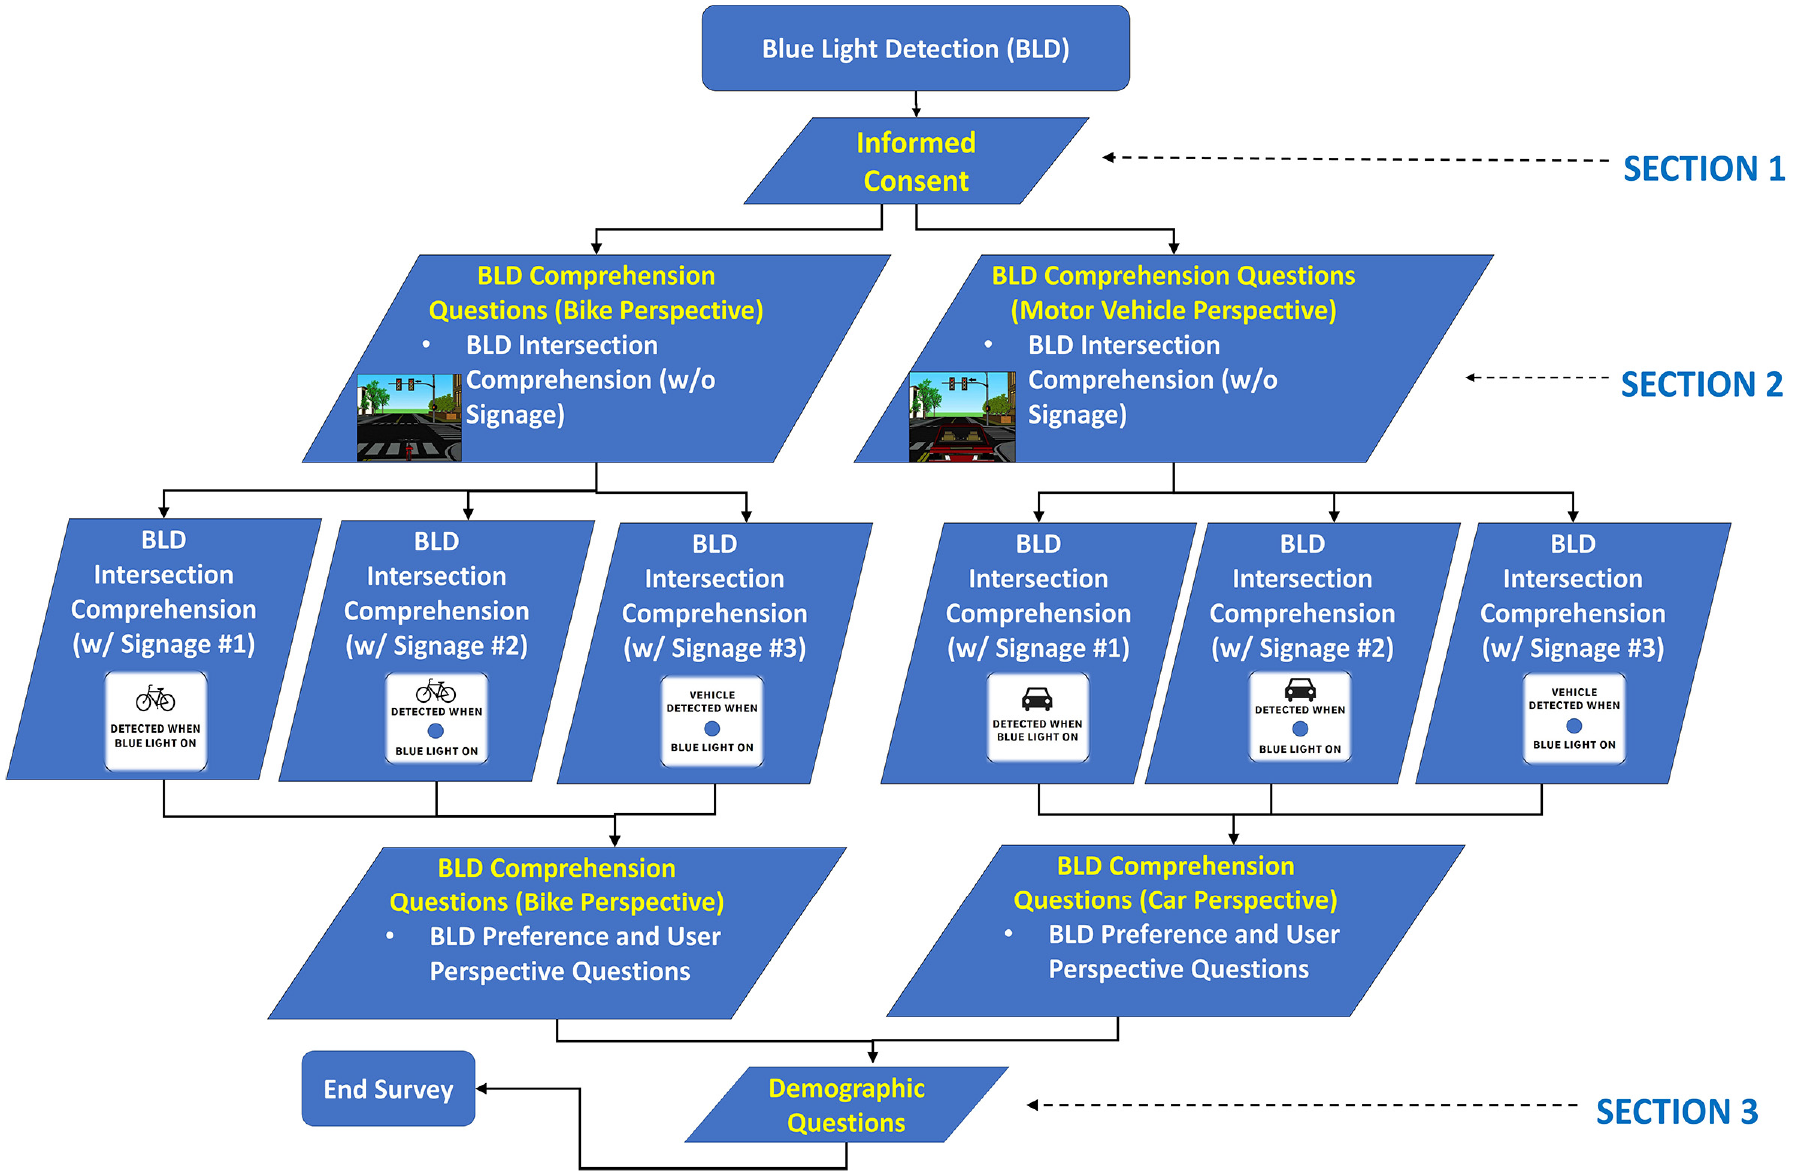
Online survey flow chart.
Survey Instruments
Both surveys began with respondents certifying that they are over 18 years old and acknowledging an informed consent statement. The surveys began with open-ended questions and then presented multiple-choice and Likert-scale questions. Each survey ended with demographic questions on the respondent’s income and education levels, cycling and driving habits, and eyesight.
The online survey began with open-ended questions, which asked participants to report their understanding of a BLDC placed on the backplate of a traffic signal head. In this section, the survey randomly branched into two options: (1) the user was assumed to be a bicyclist (i.e., a bicycle is provided in the foreground of the image) or (2) the user was assumed to be a driver (i.e., a car is provided in the foreground of the image). Participants were initially presented a computer image of an intersection from either a bicyclist’s or driver’s perspective and were asked to indicate their understanding of the BLDC on the signal head, without supplemental signage included (Figure 2: left column). Next, they were asked the same question but this time with signage (Figure 2: right column).
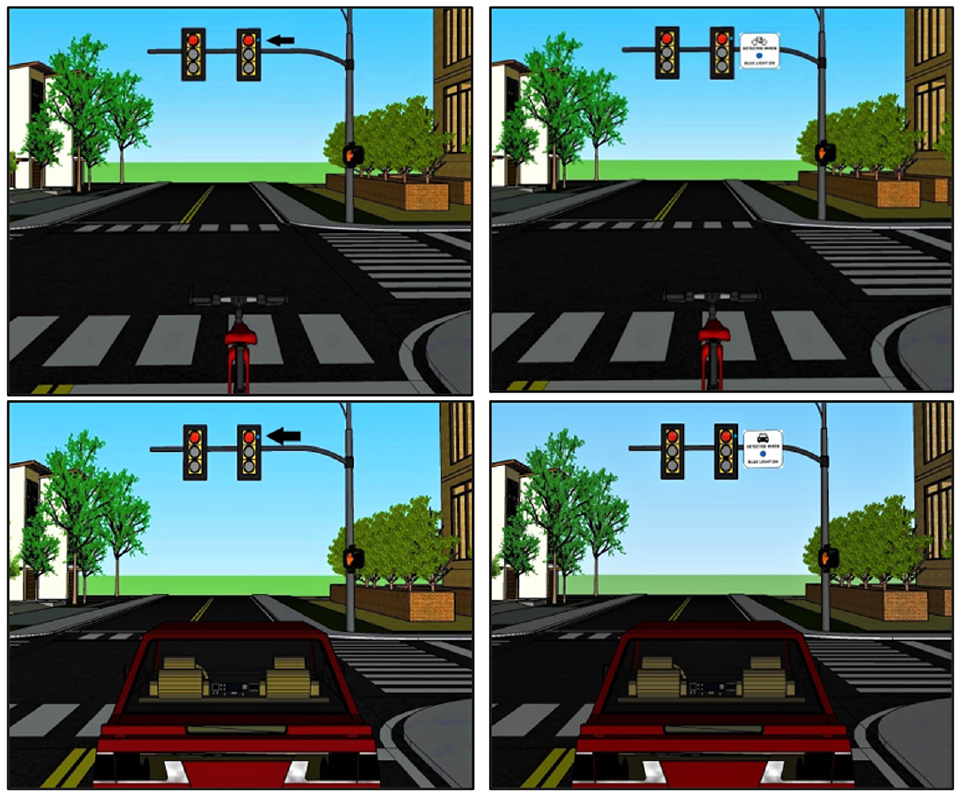
Image used for open-ended question on blue light detection confirmation (BLDC) for bicyclist’s perspective (top row) and driver’s perspective (bottom row) with and without signage.
Three supplemental signs were tested in the survey such that all participants were randomly presented with one version of the three possible sign options. After completing these items, participants were asked to indicate which of the three sign options (shown in Figure 3) conveyed the best meaning for the BLDC and to provide feedback about their perspective of the use of the signage. The closing of the survey consisted of close-ended multiple-choice demographic questions on the participant’s income and education levels, cycling and driving habits, and eyesight.

Images used sign options with blue light detection confirmation (BLDC) for bicyclist’s perspective (left) and driver’s perspective (right).
The intercept survey was conducted to determine the bicyclists’ comprehension of the BLDC at traffic signals equipped with the preferred accompanying sign. Two versions of the signs were designed—one in which the blue light was embedded in the sign, and the other in which the blue light was located in the signal separate from the sign, as shown in Figure 4.
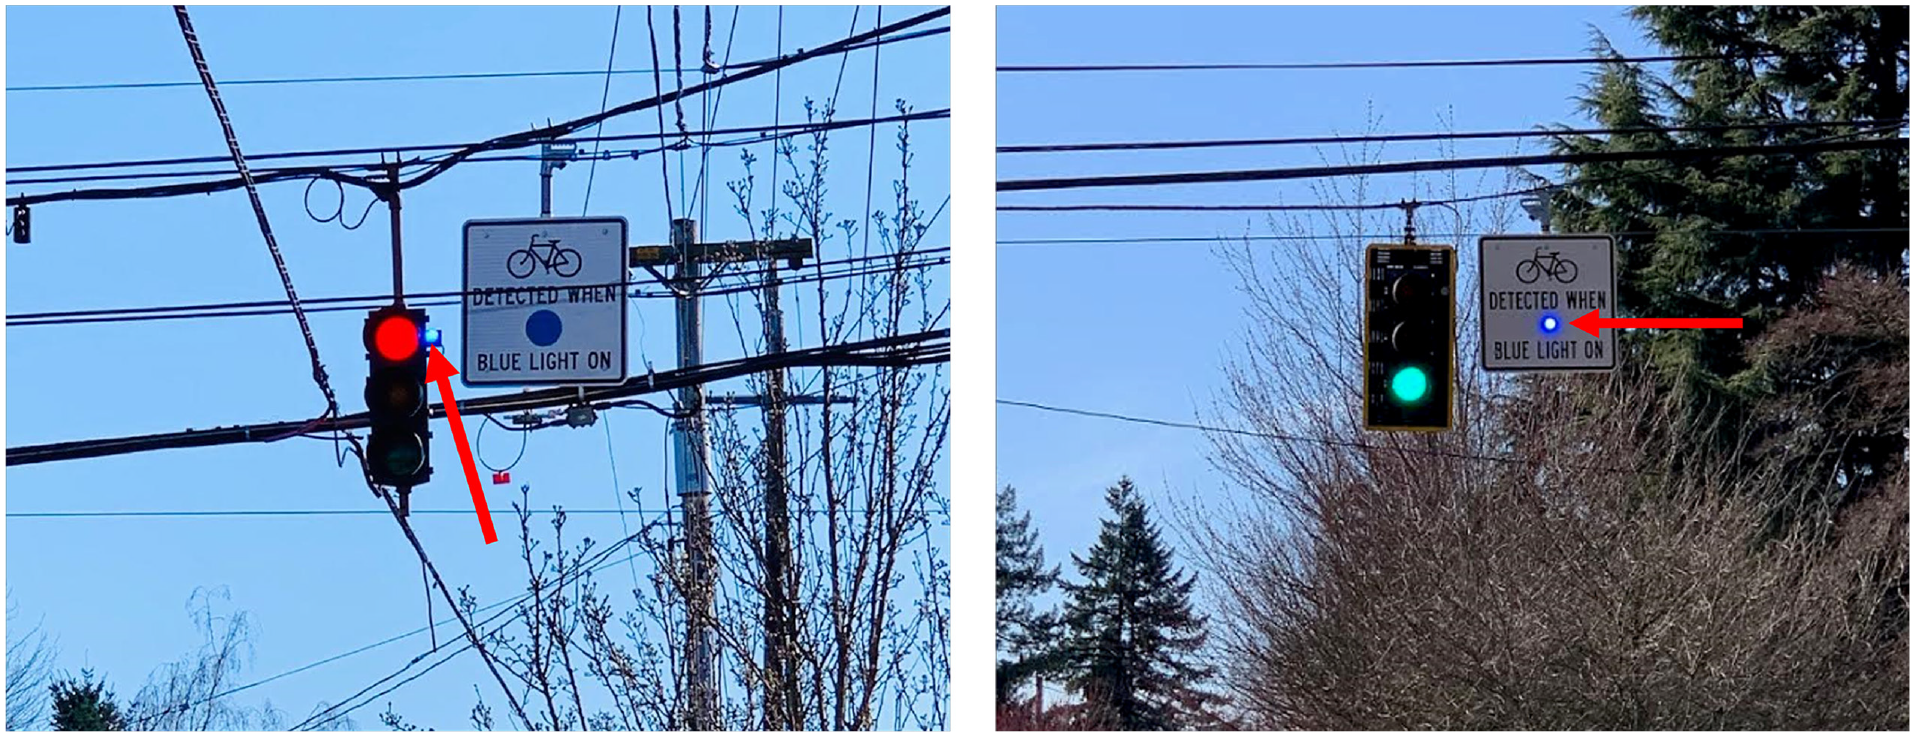
Blue light detection confirmation (BLDC) in traffic signal housing with accompanying sign (left) and BLDC embedded in sign (right).
Table 1 shows the six intersection locations along with the 12 approaches where the BLDC were installed along with the accompanying signs. The intercept survey was administered at these six intersections.
Blue Light Detection Confirmation (BLDC) Locations and Type of Accompanying Sign
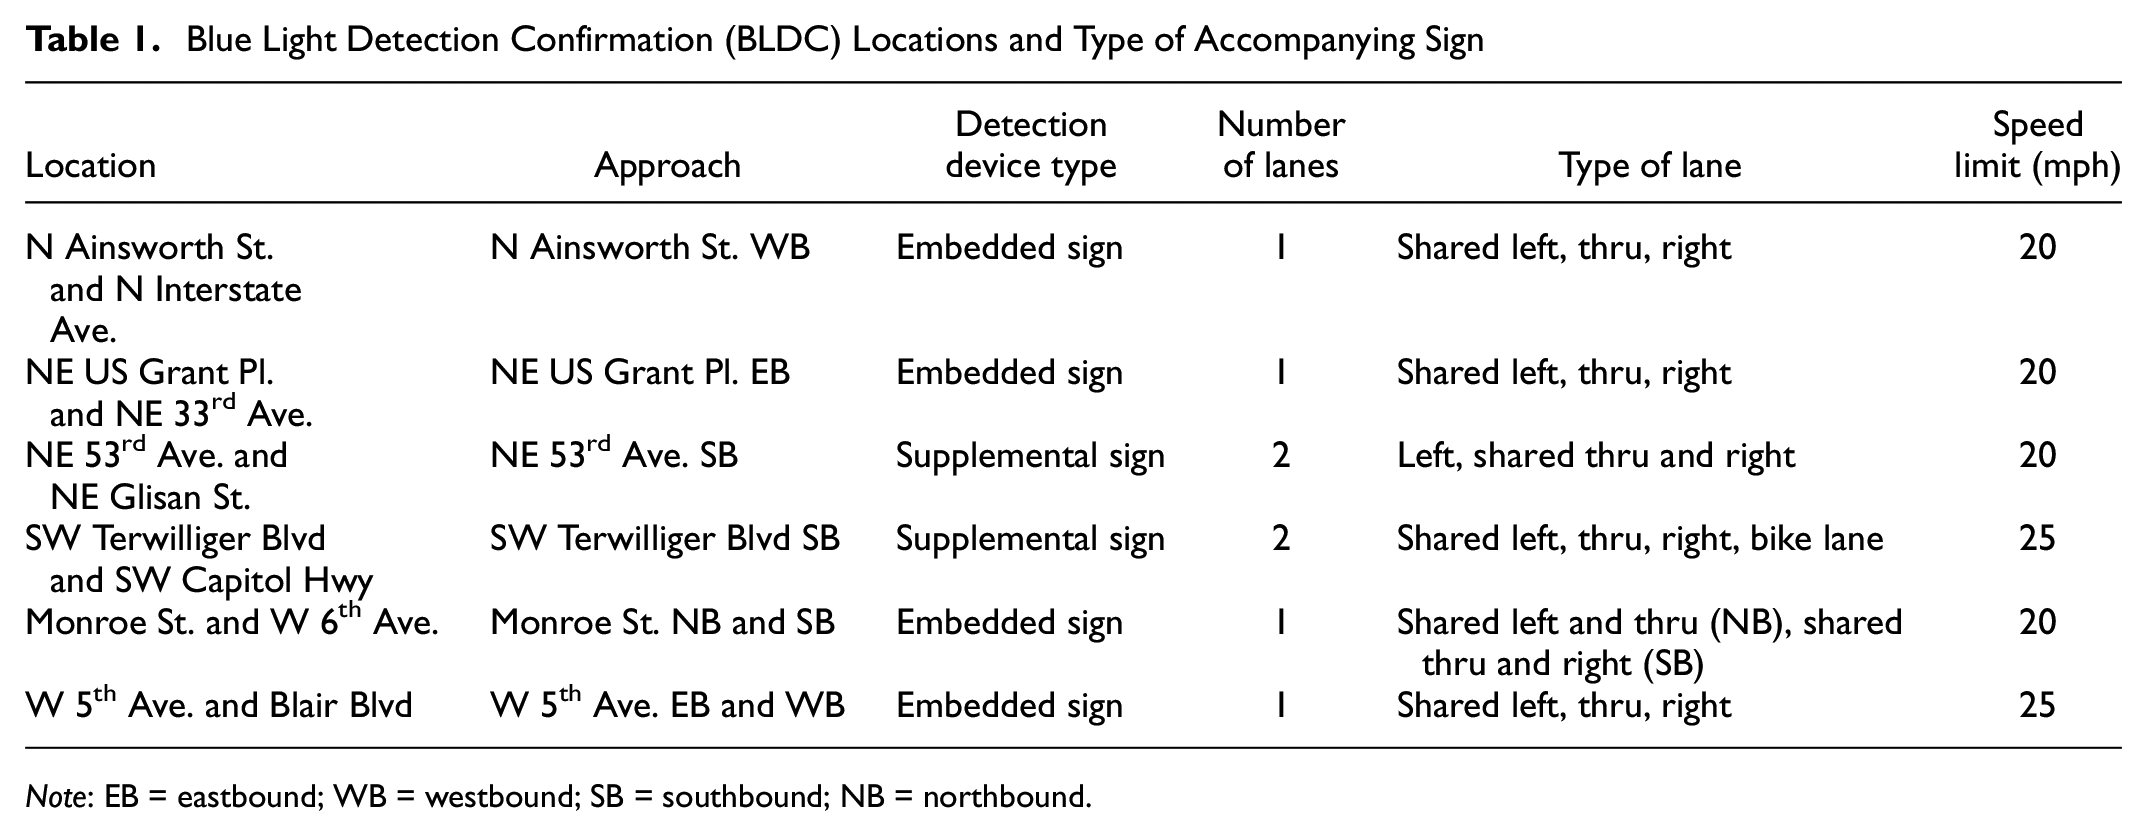
Note: EB = eastbound; WB = westbound; SB = southbound; NB = northbound.
The intercept survey asked the respondents to first enter one of six letter codes (AA–FF) and a number code (001–300) from the postcard that they were handed at the intersections. Two branches of the survey (blue light embedded in the sign or blue light presented separately from the sign in the traffic signal backplate) were developed, depending on the letter code that was entered by the respondent. Within each of these branches, respondents were asked if they had observed the blue light and sign at the intersections previously and whether they had read any media articles about the blue lights. There were also open-ended questions, which asked respondents to report their understanding of a BLDC when it was ON and OFF, with the supplemental sign included. Respondents were also asked to describe how they could activate a blue light and their perspective on the inclusion of BLDC at signalized intersections. Finally, respondents were asked close-ended multiple-choice demographic questions about income and education levels, cycling and driving habits, and eyesight.
Recruitment Methods
Two methods were used to recruit subjects for the online survey: (1) a postcard recruitment to household addresses in Oregon and (2) an online social-media-based recruitment. For the postcards, an expected survey response rate of 6%–8% was assumed, based on a previously conducted postcard/online design on previous research ( 9 – 11 ). A sampling scheme was designed based on the proportion of the population in each medium/large city in Oregon. Only cities were chosen for the postcard mailing because of the higher prevalence of bicycling in urban areas. Postcards were mailed to 10,003 addresses. A total of 568 respondents clicked the online link to respond to the survey. A total of 271 postcards were returned as undeliverable, resulting in a response rate of 5.8%.
A social media post was provided on Facebook with pertinent information about the study and an online link to the survey. A total of 1,550 respondents clicked the online link to begin the survey; 555 respondents completed the survey. The calculated response rate was 35%. Figure 5 shows the geographic distributions of respondents for the postcard and social media surveys.

Geographic distribution of postcard survey respondents in Oregon (left) and social media survey respondents in the U.S. (right).
A recruitment postcard containing information about the survey objectives and an online link was handed out by researchers to cyclists on 12 approaches of the six intersections studied. A total of 337 postcards were handed out, with 151 responses, resulting in a response rate of 45%.
Open-Ended Question Coding
The primary questions in the online and intercept surveys to determine the comprehension of the BLDC were open-ended. In the online survey, respondents were presented with the following wording, with either “bicycle” or “vehicle” interchanged based on the respondent’s branch:
Imagine that you are waiting at an intersection on/in a bicycle. What does the BLUE LIGHT (to the left of the arrow) mean to you? Please type your response in the box below and be as descriptive as possible.
In the intercept survey, respondents were presented two scenarios (i.e., one with the BLDC OFF, one with the BLDC ON) of the location they experienced and were asked the following:
If you are waiting at the intersection and the blue light is ON/OFF, what does the sign pointed to by the red arrow mean to you? Please type your response in the box below and be as descriptive as possible.
Responses to the questions were reviewed and classified as correct, partially correct, or incorrect based on the following error coding of open-ended comprehension responses:
Online Survey: BLDC Intersection Scenario (with/without signage) with car or bicycle ○ Correct: Blue light indicates that either the bicyclist or vehicle has been “detected” at the intersection. ○ Partially correct: Blue light indicates that a car or bike has been “detected” nearby or that that traffic signal has been triggered. ○ Incorrect: Anything else.
Field Installation: BLDC ON ○ Correct: Blue light indicates that either the bicyclist or vehicle has been “detected” at the intersection. ○ Partially correct: Blue light indicates that a car or bike has been “detected” nearby or that that traffic signal has been triggered. ○ Incorrect: Anything else.
Results
Demographics
Of the 1,340 people who responded to the survey (568 postcard, 772 social media), 1,064 people provided some or all the requested demographic information (see Table 2). The responses from the social media survey were further categorized by zip code into those from Oregon versus the rest of the U.S. The type of recruitment method used (postcard, social media, intercept) yielded differences in demographics.
Demographics Summary of Survey Respondents

Note: Percentages for categories may not total 100% because of missing responses; NA = not available
The postcard recruitment resulted in a sample that was overrepresented by older, educated white males compared with the 2010 census estimates for Oregon. Male respondents from the postcard survey had the highest overrepresentation (60% male compared with 49% male for the total population in both Oregon and U.S.). Survey respondents were slightly older than the general population, with overrepresentation in the 55–64 and 65+ years categories, for data collected from Oregon (48.5% postcard survey, 34.4 social media [OR]) compared with census estimates (29.9 [OR]; 27.6% [national]). The social media survey administered nationally yielded a larger representation in the 25–34 year category (32.8%) compared with the census (13.7%). Postcard respondents were 81% White/Caucasian (versus 77% reported in the census) and overrepresentations were seen with both social media national and Oregon data. Proportions of higher income respondents ($100,000 or more) on both postcard and social media surveys were overrepresented when compared with census estimates (34.2% [postcard], 33.3% [social media Oregon], 38% [social media national] versus 26.2% [national] and 23.8% [social media Oregon]). Respondents with a Bachelor’s degree were overrepresented on all forms of the survey compared with the census proportions.
Respondents from Oregon via the postcard tended to cycle far less than 5 mi per week (74%) in comparison with respondents from Oregon on social media who tended to cycle over 10 mi per week (74%). Furthermore, respondents from Oregon via the postcard had a lower propensity to use a bike ride for either fun/exercise or for transportation within the last month (28% for fun/exercise and 15% for transportation), in comparison with respondents from Oregon and nationally on social media who had higher propensity to use a bike ride for fun/exercise or for transportation within the last month (86% for fun/exercise and 73% for transportation for Oregon social media; 65% for fun/exercise and 38% for transportation for national social media).
In the intercept survey, older, educated white males were overrepresented as survey respondents compared with 2010 Census estimates for Oregon. Survey respondents were generally older than the general population, with larger representation in the 55–64 and 65+ years categories, for data collected from Oregon (60.78%) compared with the census estimates (29.9%). The respondents were 89% White/Caucasian (versus 77% reported in the census). Higher-income respondents ($100,000 or more) were overrepresented in the surveys (52.32%) compared with census estimates (23.8%). Respondents with a Bachelor’s degree or higher (Masters and Doctorate) were overrepresented compared with the census proportions.
Respondents on average reported using the bicycle for 22 days in a month. Overall, 93% of respondents possessed a driver’s license. A total of 14% of the respondents reported that they did not drive a car for transportation, and 45% reported driving less than 5,000 mi in a year. A small percentage of respondents (1%) indicated that they were colorblind. The majority of the respondents indicated that they used corrective glasses or contacts for vision (58%).
BLDC Comprehension
Responses were coded following the convention in the Methodology section for both the online and intercept survey. Figure 6 and Tables 3 and 4 present the results of the analysis for the online survey, both without and with signage, and intercept survey at six locations.

Responses to open-ended question on blue light detection confirmation (BLDC) (without signage): bicycle scenario (left) and vehicle scenario (right).
Responses to Open-Ended Question on Blue Light Detection Confirmation (BLDC) (with Signage)

Blue Light Detection Confirmation (BLDC) Comprehension

Results of the online survey analysis of the responses, which was answered by 1,084 respondents (548 with bicycle scenario and 536 with vehicle scenario), are shown in Figure 6. Most respondents—approximately 90% average of all three sources—indicated that they did not know what the blue light meant or provided a response that was not accurate. Of the respondents who correctly answered the question, Oregonians, both from the postcard and social media sources, generally showed higher rates of correctness (7.6% for postcard-OR and 23.3% for social media-OR) compared with the national respondents (4.3% for social media-US). For the social media respondents from Oregon, 29.7% had a correct response to the blue light.
Table 3 summarizes the findings for the same question but with signage presented. For Sign Option #1 (i.e., symbol without blue dot), respondents generally were split between correct and incorrect responses (44% for correct versus 45% for incorrect responses) for the understanding of the BLDC. In comparison, respondents with the bicycle scenario were more likely to correctly respond (47% average of three sources) versus respondents with the vehicle scenario who had a lower propensity to answer correctly (40% average of three sources). Another 10% were coded partially correct because they did not provide additional detail on the location of the detected vehicle or only indicated that the signal was triggered.
Similar to the Sign Option #1, Sign Option #2 (i.e., symbol with blue dot) respondents generally were split between correct (44%) and incorrect (45%) understanding of the BLDC. In comparison, respondents with the bicycle scenario were more likely to correctly respond (48% average of three sources) versus respondents with the vehicle scenario who had a lower propensity to answer correctly (41% average of three sources). An additional 11% were coded partially correct because they did not provide additional detail on the location of the detected vehicle or only indicated that the signal was triggered.
For Sign Option #3 (i.e., text with blue dot), respondents gave more incorrect (49%) responses to correct (41%) responses. However, compared with the first two signs, the use of text indicated a decline in comprehension rates from respondents in both scenarios (41% average versus 44% for Sign Options 1 and 2). An additional 10% were coded partially correct because they did not provide additional detail on the location of the detected vehicle or only indicated that the signal was triggered.
To better understand respondents’ comprehension scores, two binomial proportion tests were used for both vehicle and bicycle scenarios to test whether the additional signage, regardless of the sign option (e.g., symbol without blue dot, symbol with blue dot, text with blue dot) and survey mode (e.g., postcard versus social media), could increase the probability of getting less incorrect responses ( 3 , 12 ).
For respondents who were presented the vehicle scenario, results showed that the proportion of correct responses by participants increased from 6% when the sign was not presented to approximately 51% when it was presented, which is statistically different and significant (P-value < 0.001). However, for respondents who received the bicycle scenario, a similar test was used, and the results showed that the proportion of correct responses by participants increased from 6% when the sign was not presented to approximately 47% when it was presented, which is statistically significant (P-value < 0.001). Based on these results, there is evidence that the additional signage helped participants understand the meaning of the BLDC.
For the intercept survey, overall, most of the respondents understood the purpose of the BLDC correctly and comprehension rates were high regardless of whether the blue light was ON or OFF (Table 4). Comprehension was higher at the intersections of N Ainsworth Street and N Interstate Avenue and NE US Grant Place and NE 33rd Avenue compared with the other locations when the blue light was ON.
Respondents were asked if there was anything that they could do as a bicyclist to activate the blue light. Respondents, who chose “yes” as their response, were asked to describe the actions they would take. Overall, 66% thought they could take actions to activate the blue light, while 33% were not sure.
Sign Preferences
Following the comprehension questions in the online survey, respondents were presented all three sign options based on whether they were initially presented the intersection scenario as a bicyclist or vehicle, as shown in Figure 3. Respondents were then asked to choose the sign that conveyed the most comprehensible meaning to them and to provide justification for their choices. Figure 7 summarizes results for this question, which was answered by 1,084 respondents (548 with bicycle scenario signage and 536 with vehicle scenario signage). Respondents who were provided the bicycle scenario signage, as shown in Figure 7, generally indicated that Option #2 (67% for postcard versus 81% for social media-OR versus 68% for social media-U.S.) conveyed the best meaning, followed by Option #3 (24% for postcard-OR versus 8% for social media-OR versus 20% for social media-U.S.). Similarly, respondents who were provided the vehicle scenario signage, as shown in Figure 7, generally indicated that Option #2 (57% for postcard versus 60% for social media-OR versus 55% for social media-U.S.) conveyed the best meaning, followed by Option #3 (35% for postcard versus 60% for social media-OR versus 35% for social media-U.S.). However, overall, there was a higher propensity for respondents with the vehicle scenario signage to indicate that Option #3 was viable, in comparison with respondents with bicycle scenario signage.

Blue light detection confirmation (BLDC) comprehension (percentages selecting a particular sign option): bicycle scenario (left) and vehicle scenario (right).
Experience and Familiarity
Online survey respondents were asked whether they had experienced the BLDC at an intersection before. Figure 8 summarizes results for this question, which was answered by 1,084 respondents (545 with bicycle scenario and 539 with vehicle scenario). Respondents generally had not experienced the BLDC at the intersection before (89% average of all three sources). However, in both scenarios presented, respondents nationally from social media had a higher proportion of “No” (97%) responses for experiencing this system in comparison with the respondents from Oregon via the postcard (86%) and social media (70%).
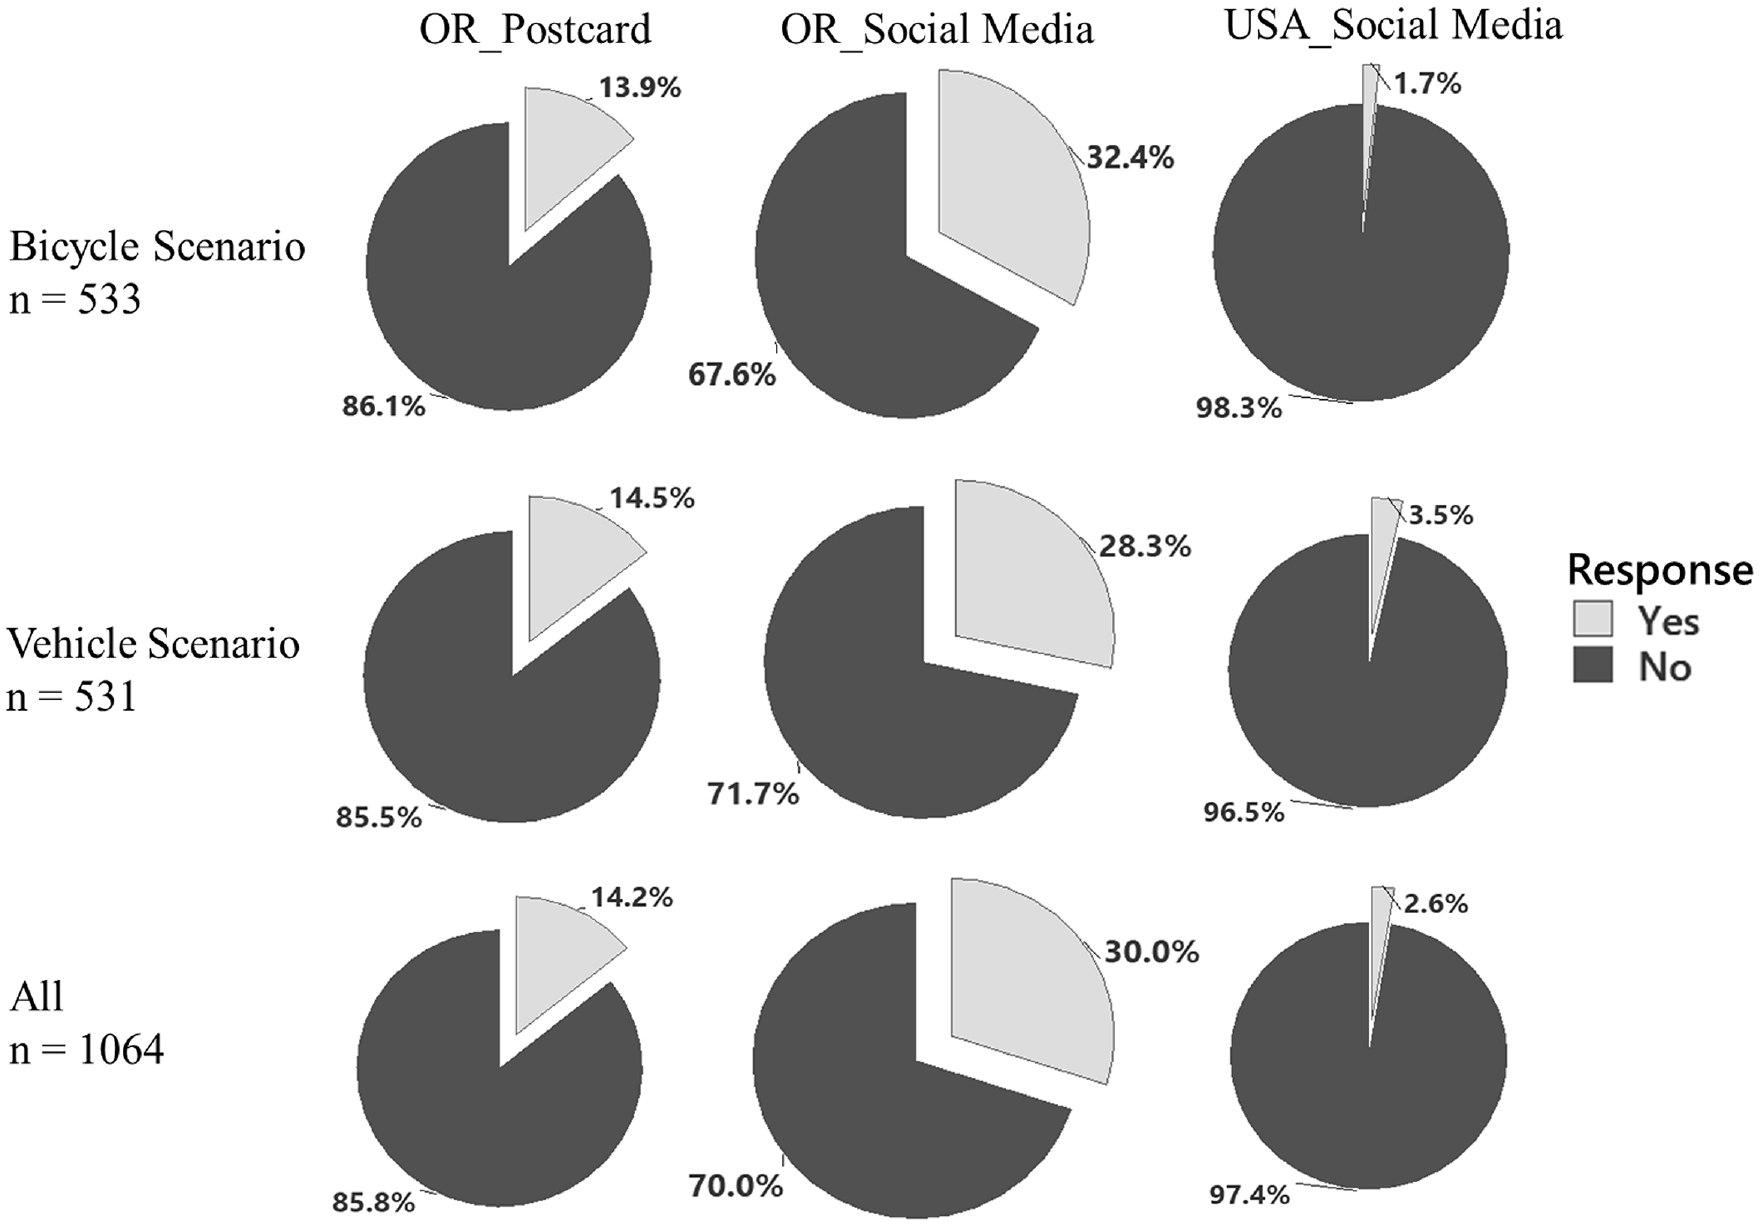
Responses to “experience at intersection” concerning blue light detection feedback.
Intercept survey respondents were shown a photo of an intersection similar to the one where they were handed the postcard and asked if they had noticed the blue light and the sign at the intersection that they traveled through. A follow-up question asked about their familiarity with media articles explaining the purpose of blue lights at intersections. Table 5 shows the responses. Overall, 84% of respondents indicated that they had observed the blue light at the intersection and, generally, the percent of respondents who observed the blue light was higher at the Portland locations than Eugene locations. Additionally, within the Portland locations, the percent of respondents who indicated that they had observed the blue light was higher at the locations where the blue light was embedded in the sign than at locations where it was separate. A total of 70% of the respondents did not read media articles on BLDC.
Blue Light Detection Confirmation (BLDC) Familiarity

The most common response from those who said they could take action to activate the blue light was to reposition their bicycle on/close to the bike pavement marking, if present, or on/close to the loop detector.
Attitudes and Perceptions
Respondents in both the online survey and intercept surveys were then provided a Likert scale to evaluate their level of “agreement” with designated statements.
Table 6 summarizes the results for the three Likert questions in the online survey, which were answered by 1,084 respondents (548 with bicycle scenario and 536 with vehicle scenario). For Question 1, respondents generally indicated that they “strongly agree” (57% average of all three sources) followed by “agree” (27% average of all three sources) that the addition of the sign helped with their understanding of the purpose of the blue light. Similarly, for Question 2, respondents generally indicated that they “strongly agree” (45% average of all three sources) followed by “agree” (29% average of all three sources), that they would support the use of the BLDC at some intersections in their community.
Responses to “Level of Agreement” of Statements about Blue Light Detection Confirmation (BLDC)

For Question 3, respondents were spread evenly, indicating that they “strongly agree” (34% average of all three sources), followed by “agree” (27% average of all three sources) and “indifferent” (21% average of all three sources), that they would feel better about waiting on a bicycle at an intersection if a BLDC was present.
In the intercept survey, each respondent was asked to state their level of agreement with four multiple choice questions to explore their attitudes to and perceptions of the visibility and utility of the BLDC. Overall, 78% of the respondents felt that the blue light and sign were clearly visible to them at the intersection. Two intersections—NE 53rd Avenue at NE Glisan Street and W 5th Avenue at Blair Boulevard—had lower proportions, 57% and 64%, respectively, stating that the blue light and sign were clearly visible. The level of disagreement (either somewhat or strongly disagree) with the statement that the blue light and sign were clearly visible varied between 7% and 26%.
A total of 72% of all respondents either somewhat or strongly agreed with the statement that the meaning of the blue light is easily understood at the intersection, while 24% somewhat or strongly disagreed. The highest levels of disagreement were seen at the intersections of NE 53rd Avenue and NE Glisan Street in Portland (35%) and W 5th Avenue and Blair Boulevard in Eugene (35%). Overall, 81% of the respondents stated that they felt better about waiting at the intersection with the blue light and sign, while 10% either somewhat or strongly disagreed. The proportion of respondents who disagreed with this statement was highest at NE 53rd Avenue and NE Glisan Street in Portland (17%). A total of 88% of the respondents felt that having information that they have been detected by the traffic signal was useful, while 7% somewhat or strongly disagreed with the statement. The high levels of agreement with this statement across all intersections reveals that respondents like having feedback from the traffic signal about their detection status.
Discussion
Concerning the BLDC, the online survey revealed that most respondents (approximately 94% average of all three sources) indicated that they did not know what the blue light meant, or provided a response that was not accurate. The American National Standard Criteria for Safety Symbols, as produced by American National Standards Institute, has indicated a minimum threshold of 85% comprehension for a traffic control device (ANSI Z535.1). Based on this standard, a 94% incorrect response rate falls well below acceptable comprehension rates for traffic control devices. Of the respondents who correctly answered the question, Oregonians, both from the postcard and social media sources, generally showed higher rates of correctness compared with the national sample. This could be a result of respondents in Oregon, particularly in Portland, being familiar with the BLDC systems. In general, the addition of supplemental signage increased the comprehension rates for both bicycle and vehicle scenarios. The correct response rates increased from 40% to 50% with the addition of an accompanying sign. Based on this significant increase in comprehension, supplemental signage would be both beneficial and recommended as part of the traffic control device system. Additional variations of the sign may need to be explored as the word “detection” may not be clear to the public. There was a strong preference for sign option #2 (i.e., symbol with blue dot).
For the intercept survey, overall, 84% of the respondents had observed the blue light and sign at the intersection and, generally, the percent of respondents who observed the blue light was higher at the Portland locations than Eugene locations, barring one exception. This was likely because of the familiarity of Portland bicyclists with the blue light devices. Additionally, within the Portland locations, the proportion of respondents who noticed the sign was higher at the embedded locations than at the locations where the blue light was separate from the sign. Although the sample size is small, this may indicate that the design where the blue light is embedded in the sign is more visible. In relation to educational campaigns, 70% of the respondents also did not read previous media articles on BLDC, although more respondents at the Portland locations read the articles compared with the respondents in the Eugene locations, possibly because of their familiarity with one of the major articles being published on bikeportland.org.
The comprehension of the BLDC and sign was 83% and 81% when the light was ON or OFF, respectively. Overall, 66% thought they could take actions to activate the blue light, while 33% were not sure. A high percentage of respondents (92%) were sure that they could activate the blue light at the intersection of NE US Grant at NE 33rd Place, possibly because they were familiar with the operation of a BLDC, as it was already present at this location before the installation of the embedded blue light in the sign as part of this study. The most common response from the people who said they could take action to activate the blue light was to reposition their bicycle on/close to the bike pavement marking, if present, or on/close to the loop detector.
Conclusion
This paper summarizes the use and comprehension of a BLDC system in the U.S. context. An online survey and survey of intercepted bicyclists at signalized intersections with various BLDC systems installed were conducted to determine the general public’s comprehension and preference of the BLDC system and three supplemental sign alternatives. The online survey was distributed based on a mixed method of postcard and social media and, overall, a more balanced sample was received as a result. This approach reduces the bias that may come from one source that favors specific demographics.
All these results collectively reveal that users strongly prefer to have information from the signal system that they have been detected and feel better about waiting on a bicycle at the intersection equipped with blue light and sign. While comprehension rates are high with the accompanying sign, 24% of the respondents still did not understand the meaning of the blue light and sign easily. Therefore, BLDC and sign installations may help in further increasing comprehension rates.
There were a few limitations associated with these surveys. Both surveys showed an overrepresentation of older, educated white males. In addition to the demographic bias, the surveys were designed in a stated-preference format, which requires respondents to answer questions in non-real-world conditions. While stated-preference surveys serve as an economical, easy, and accessible method to collect data, they are subject to the design of the survey and the questions, which could lead respondents to understand and answer questions differently than how the surveyor intended them to be comprehended and completed. Additionally, the recruitment for social media attracted more persons who cycle. We suspect that many of the respondents are familiar with the blue light through experience or education in Portland.
With regards to the intercept survey, the surveys were conducted at only a few locations in Eugene and Portland, heavily occupied with bicyclists, which could indicate that users are more likely to both adhere to and respond positively to bicycle infrastructure changes.
Additional research is needed to continue to explore how this BLDC system can be implemented and tested in communities that are not currently heavily occupied by cyclists to see how individuals comprehend and react to them. Additionally, it could be beneficial to explore different colors of the indication light, the size of the letters on the supplemental signage, the location of the blue light device (e.g., nearside versus far side), and evaluating it at different roadway contexts (e.g., urban versus rural). Nearside installations are also feasible and can be further explored.
Footnotes
Author Contributions
The authors confirm contribution to the paper as follows: study conception and design: C. Monsere, D. Hurwitz, S. Kothuri, D. Cobb; data collection: D. Cobb, S. Kothuri, H. Jashami; analysis and interpretation of results: D. Cobb, C. Monsere, D. Hurwitz, S. Kothuri, H. Jashami; draft manuscript preparation: D. Cobb, S. Kothuri, H. Jashami, C. Monsere, D. Hurwitz. All authors reviewed the results and approved the final version of the manuscript.
Declaration of Conflicting Interests
The author(s) declared no potential conflicts of interest with respect to the research, authorship, and/or publication of this article.
Funding
The author(s) disclosed receipt of the following financial support for the research, authorship, and/or publication of this article: The research was sponsored by the Oregon Department of Transportation (SPR 825).
