



Abstract
With the growing demand of shared electric scooters (e-scooters) for short-distance trips in urban areas, their safety issues have received significant attention from various stakeholders. In general, e-scooter riders encounter more vibrations compared with users of other transportation modes such as bicycles that typically have larger wheels and better suspension systems. Such riding experience may lead to discomfort, affect riders’ health, and increase riding risk. Intuitively, increasing e-scooters’ wheel sizes may provide safer and more comfortable riding experience. However, this assumption has not been well tested. The main objective of this paper is to curtail this gap by quantitatively assessing the impacts riders experienced, through the use mobile sensing data. Specifically, a mobile sensing platform was deployed on e-scooters with different wheel sizes to continuously measure encountered vibrations. Then, the instrumented e-scooters were ridden on routes with different pavement materials. Finally, the collected data were further processed and analyzed to evaluate various riding issues in each riding scenario. The comparative results suggest that e-scooters with larger wheels can efficiently alleviate vibrations during a ride compared with those with smaller wheels. To improve riding experience and safety, it is beneficial to use larger-wheel e-scooters, given other similar riding conditions.
Keywords
The rapid evolutions of shared mobility systems have drastically changed the urban mobility landscape. Shared electric scooters (e-scooters), as one of the emerging forms of micro-mobility, quickly flooded the streets in many cities. For example, Washington, D.C. was served by four e-scooter vendors (i.e., Lime, Veo, Spin, and Lyft), for a total of 8,220 e-scooters being allowed to zip around the city from January 1, 2023, through December 31, 2024 ( 1 ) The dockless and portable characteristics have made e-scooters a competitive option for short-distance trips (e.g., trip distance ≤ 2 miles), which accounted for about one thrid of vehicle trips based on 2017 National Household Travel Survey ( 2 ). E-scooters can be ridden on sidewalks and streets, which allows riders to flexibly customize their routes. In addition, e-scooters can be picked up or dropped off at various sites (including designated parking spots and open spaces), which minimizes travelers’ walking distances. Amid the pandemic, many travelers used e-scooters as an individualized mode to commute, allowing them to maintain considerable social distances from each other. Such growing demand has brought new challenges to e-scooter vendors of continuously providing greener, healthier, and safer riding experiences.
Despite the convenience, one critical challenge for e-scooter riders is that they always need to navigate a complex riding environment. Unlike vehicles that are often constrained in disciplined lanes, e-scooters need to frequently change routes planned on shared facilities such sidewalks and bike lanes. According to Ma et al. ( 3 ), e-scooter policies and riding guidelines are still evolving in many cities. In many places, e-scooters can be ridden on public roads and mixing with other transport modes can be disruptive ( 4 ). On one hand, e-scooter riders are vulnerable when riding in vehicle lanes; on the other hand, they may hit pedestrians while riding on sidewalks. Meanwhile, because of the lack of crash data, the risk and conflicts of riding e-scooters can be underestimated. According to Yang et al. ( 5 ), fatal e-scooter-involved crashes have been reported in several places. Many of the reported fallings were found on sidewalks with narrow riding space and uneven pavements ( 6 , 7 ). Sidewalks with poor pavement conditions are not recommended for e-scooter riders because the wheels can be easily caught by potholes or cracks. Nevertheless, many cities lack up-to-date information on the quality of the sidewalks for planning the most rational routes for riders.
Besides e-scooter riders and riding environments, the e-scooter devices’ physical structures also play important roles in e-scooter safety. For example, Ma et al. ( 8 ) developed a mobile sensing platform for quantifying vibrations and the approaching obstacles during an e-scooter ride. It is suggested that the abrupt acceleration and frequent vibrations of e-scooters may lead to uncomfortable and risky riding compared with bikes, which traditionally have larger wheels. This raises the question of whether the larger the e-scooter wheels, the more comfortable the riders will feel. Such concerns have also been noticed by e-scooter vendors. For example, according to Toll ( 9 ), Lime introduced new e-scooter devices with 10 in. wheels to provide smoother riding behaviors than previous devices with 8 in. wheels. The impact of wheels on riding experience has not yet been well assessed and the performances might vary across different road facilities. To fill this gap, this study extended the vibration detection methods from previous work by collecting data using mobile sensing technologies. Then, both small-wheel and large-wheel e-scooters were evaluated in multiple sidewalk scenarios with different facility conditions.
Literature Review
Since the rapid distribution of shared e-scooters, it has been widely discussed where and how e-scooters should be ridden. For example, e-scooters are frequently used for short-distance trips. E-scooters can be an option for connecting to metro stations ( 10 ). With their portable and dockless characteristics, e-scooters can be ridden in various places, which brings new challenges in operations and safety concerns ( 11 , 12 ). Gössling ( 13 ) investigated the challenges associated with the introduction of e-scooters in 10 major cities, based on a content analysis of local media reports. Tuncer et al. ( 14 ) analyzed 171 e-scooter riders from camera records and identified risky riding behaviors such as riding opposite traffic flow and running red lights. As less than 15% of riders wear helmets, they can easily get severe injuries in crashes occurring on streets and sidewalks. A survey of 591 responses by Fitt and Curl ( 15 ) sheds lights on how e-scooters can be used. It was found that, compared with main roads, more e-scooter riders prefer quiet sidewalks, to avoid crashing with vehicles. Nevertheless, there are also safety concerns about riding e-scooters on sidewalks. As reported by Sikka et al. ( 16 ), e-scooters may hit pedestrians on sidewalks. Impacted by such incidents on sidewalks, some cities may eliminate or prohibit e-scooters from sidewalks. For example, Ma et al. ( 3 ) examined municipal guidelines in 80 U.S. cities with e-scooter programs, about half of which restricted e-scooter riders from riding on sidewalks. There is a demand for more efforts to explore how to provide safer riding environments for e-scooter riders.
Besides the conflict with other transportation modes, pavement conditions on sidewalks are also closely related to e-scooter safety. Cano-Moreno et al. ( 17 ) identified that e-scooter vibrations primarily affect the human health and comfort of e-scooter riders. Strong vibrations are expected when riding e-scooters on sidewalks with poor pavements. For example, Austin Public Health ( 18 ) interviewed 125 e-scooter riders about their safety concerns with their riding experiences. Among the responses, 50% believed that surface conditions such as potholes or cracks contributed to their injuries. However, the surveying methods can be considered subjective and biased because of the small sample sizes.
Quantitative analysis sheds light on actual performances of e-scooters. Zou et al. ( 19 ) first provided descriptive statistics on e-scooter share trips, followed by an exploratory analysis of trip trajectories conjoined with street link level features. It was found that arterials and local streets with heavy traffic are the most popular facilities used by e-scooters. Besides trip-level analysis, researchers also collect vibration data to provide stronger reasoning on the impacts of pavement conditions. For example, Ma et al. ( 8 ) developed a portable device with motion tracking sensors installed. Vibration data were collected while riding e-scooters equipped with this device. The data were paired with GPS measurements to identify hotspots where riders encountered strong and frequent vibrations.
On the other hand, besides the pavement conditions, the physical characteristics of e-scooter devices may also influence riding experience. Compared with conventional bicycles with large wheels, e-scooter riding is often described as ‘twitchy,’‘wobbly,’ and ‘less stable’ ( 20 ). Wheel size also plays an important role toward safer e-scooter design. Iftakhar ( 21 ) conducted pothole tests between e-scooters with 8 in. and 16 in. wheels. It was found that potholes had less impact on the e-scooters with larger wheels. Nowadays, many e-scooter vendors (e.g., Lime and Bird) have upgraded existing e-scooters from small wheels toward larger wheels. However, no previous research has extensively tested the impact of wheel size when riding e-scooters on sidewalks. To fill this gap, this study takes advantage of mobile sensing technologies to compare the performances between small-wheel and large-wheel e-scooters, to provide a more objective evaluation.
Methodology
First, a framework is designed for identifying the instances when e-scooter riders encounter strong vibrations. Typically, those vibration events occur at potholes, cracks, or slopes during an e-scooter trip. Taking advantage of mobile sensing technologies, vibration and GPS data are recorded. Then, the collected data is processed and vibration events can be detected. Second, the parameters used in this framework are calibrated by testing e-scooters at selected locations. The tuned model is sensitive to vibration events that capture riders’ experienced vibrations. Last, other variables such as speed are also calculated and discussed along with the experienced vibrations.
Capturing Riding Vibration
The research team adopted a mobile sensing application to record naturalistic riding data for each e-scooter trip. As shown in Figure 1a, the mobile device was attached to the e-scooter’s deck. Three-dimensional accelerometer data

Maximum value
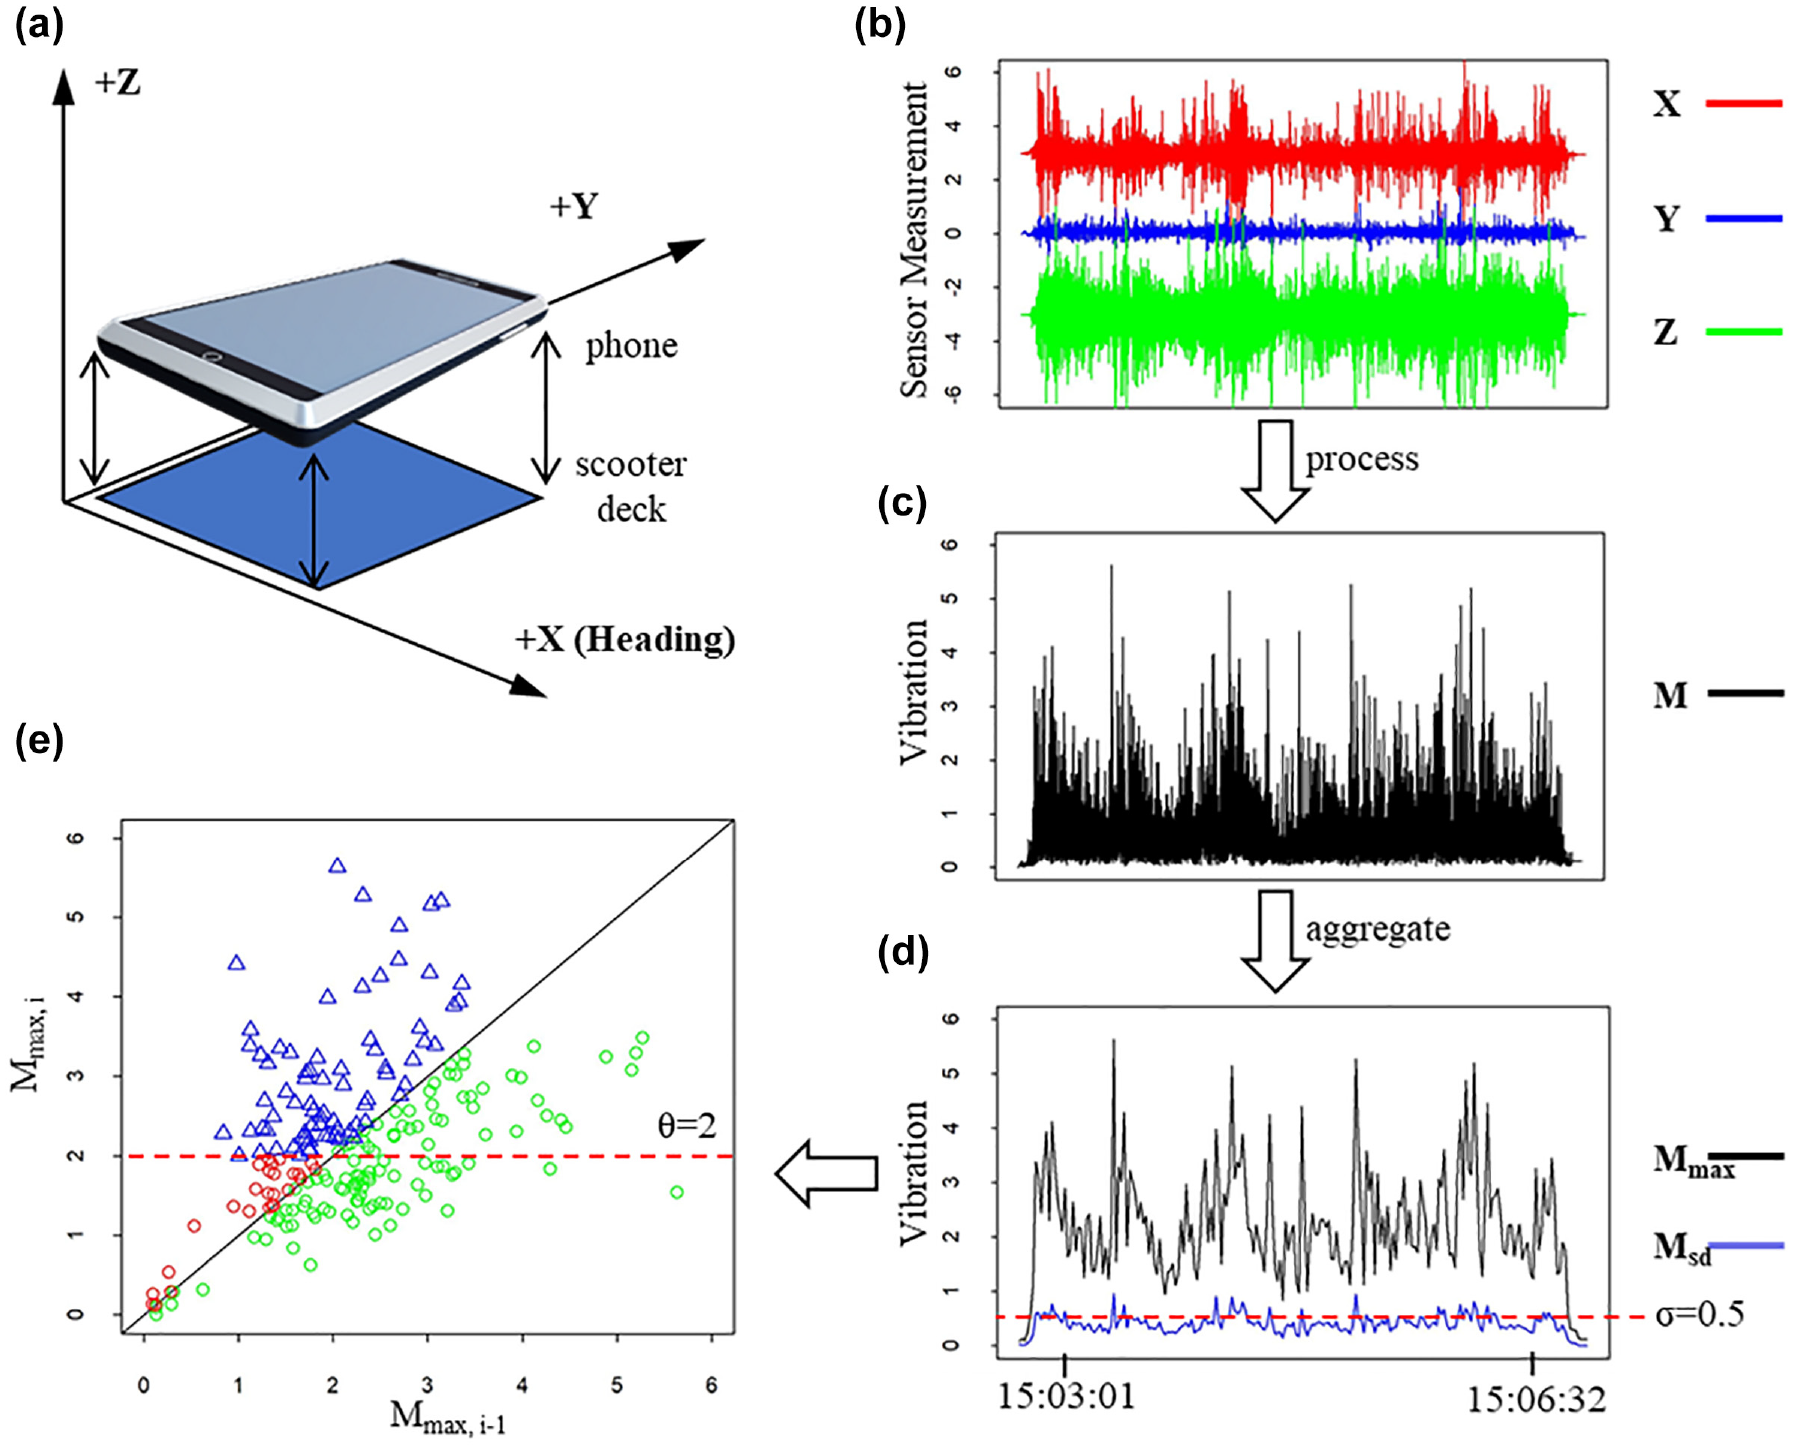
Framework for extracting vibration events: (a) illustration of mobile phone attached the e-scooter deck, (b) raw sensor measurements, (c) computed vibration results, (d) maximum vibration and standard deviation per second, and (e) compare virbration between current and prior timesteps.
Calibrating Vibration Events
The vibration thresholds
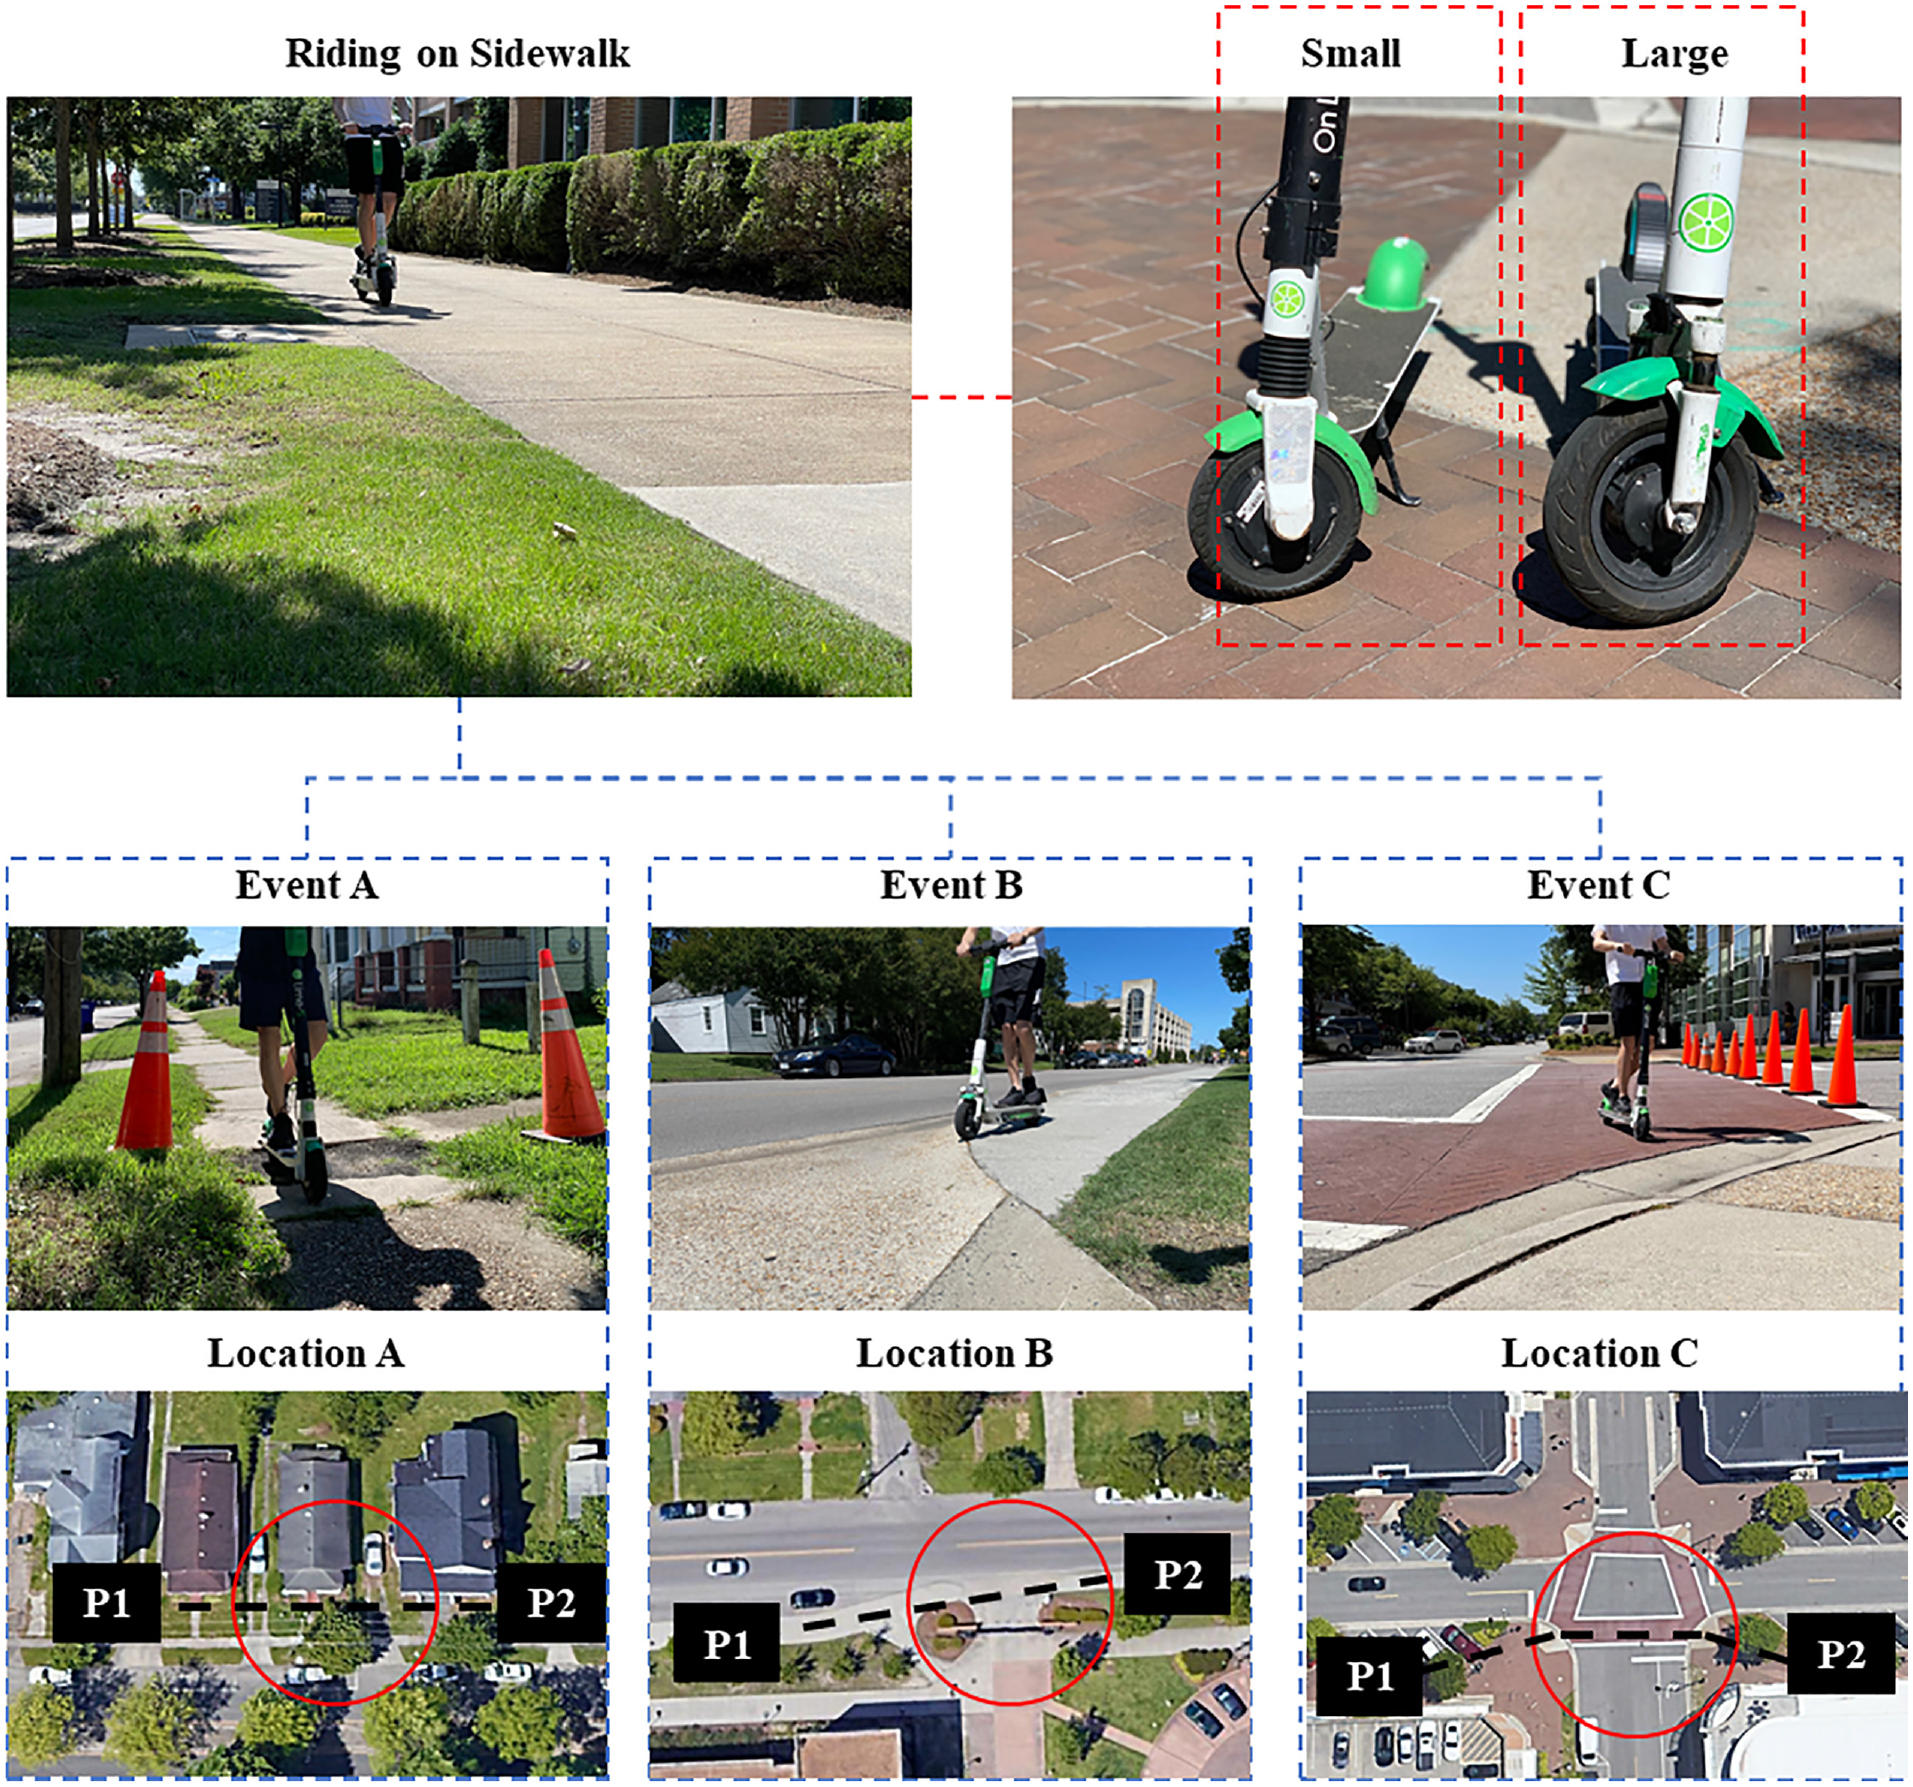
Calibrating vibration events with small- and large-wheel e-scooters.
Measuring Riding Velocity
Riding speed is a critical factor for e-scooter safety. When riding in regions without a speed limit, e-scooters can easily reach a hazardous speed of 15 mph in a short period of time. The e-scooter’s velocity can be tracked and calculated during a trip. In this study, the velocity in each second was calculated using

where
Design of Experiments
Route Design
According to the work by Jiao and Bai (2020) ( 22 ), land use is one of the primary factors affecting the demand for e-scooters. This study is focused on the sidewalks near three typical built environments: (1) sidewalks in neighborhoods; (2) sidewalks near university campus; and (3) sidewalks on commercial streets. The three selected sidewalk routes are shown in Figure 3a, and Figure 3b contains the photos of their pavements. It can be observed that neighborhood sidewalks have comparably narrow lanes, where large cracks with weeds can be frequently observed. Campus sidewalks are wider and smoother than the neighborhood sidewalks. Both of them have concrete pavement. The pavement of the commercial streets primarily consists of bricks, where different vibration patterns are expected.
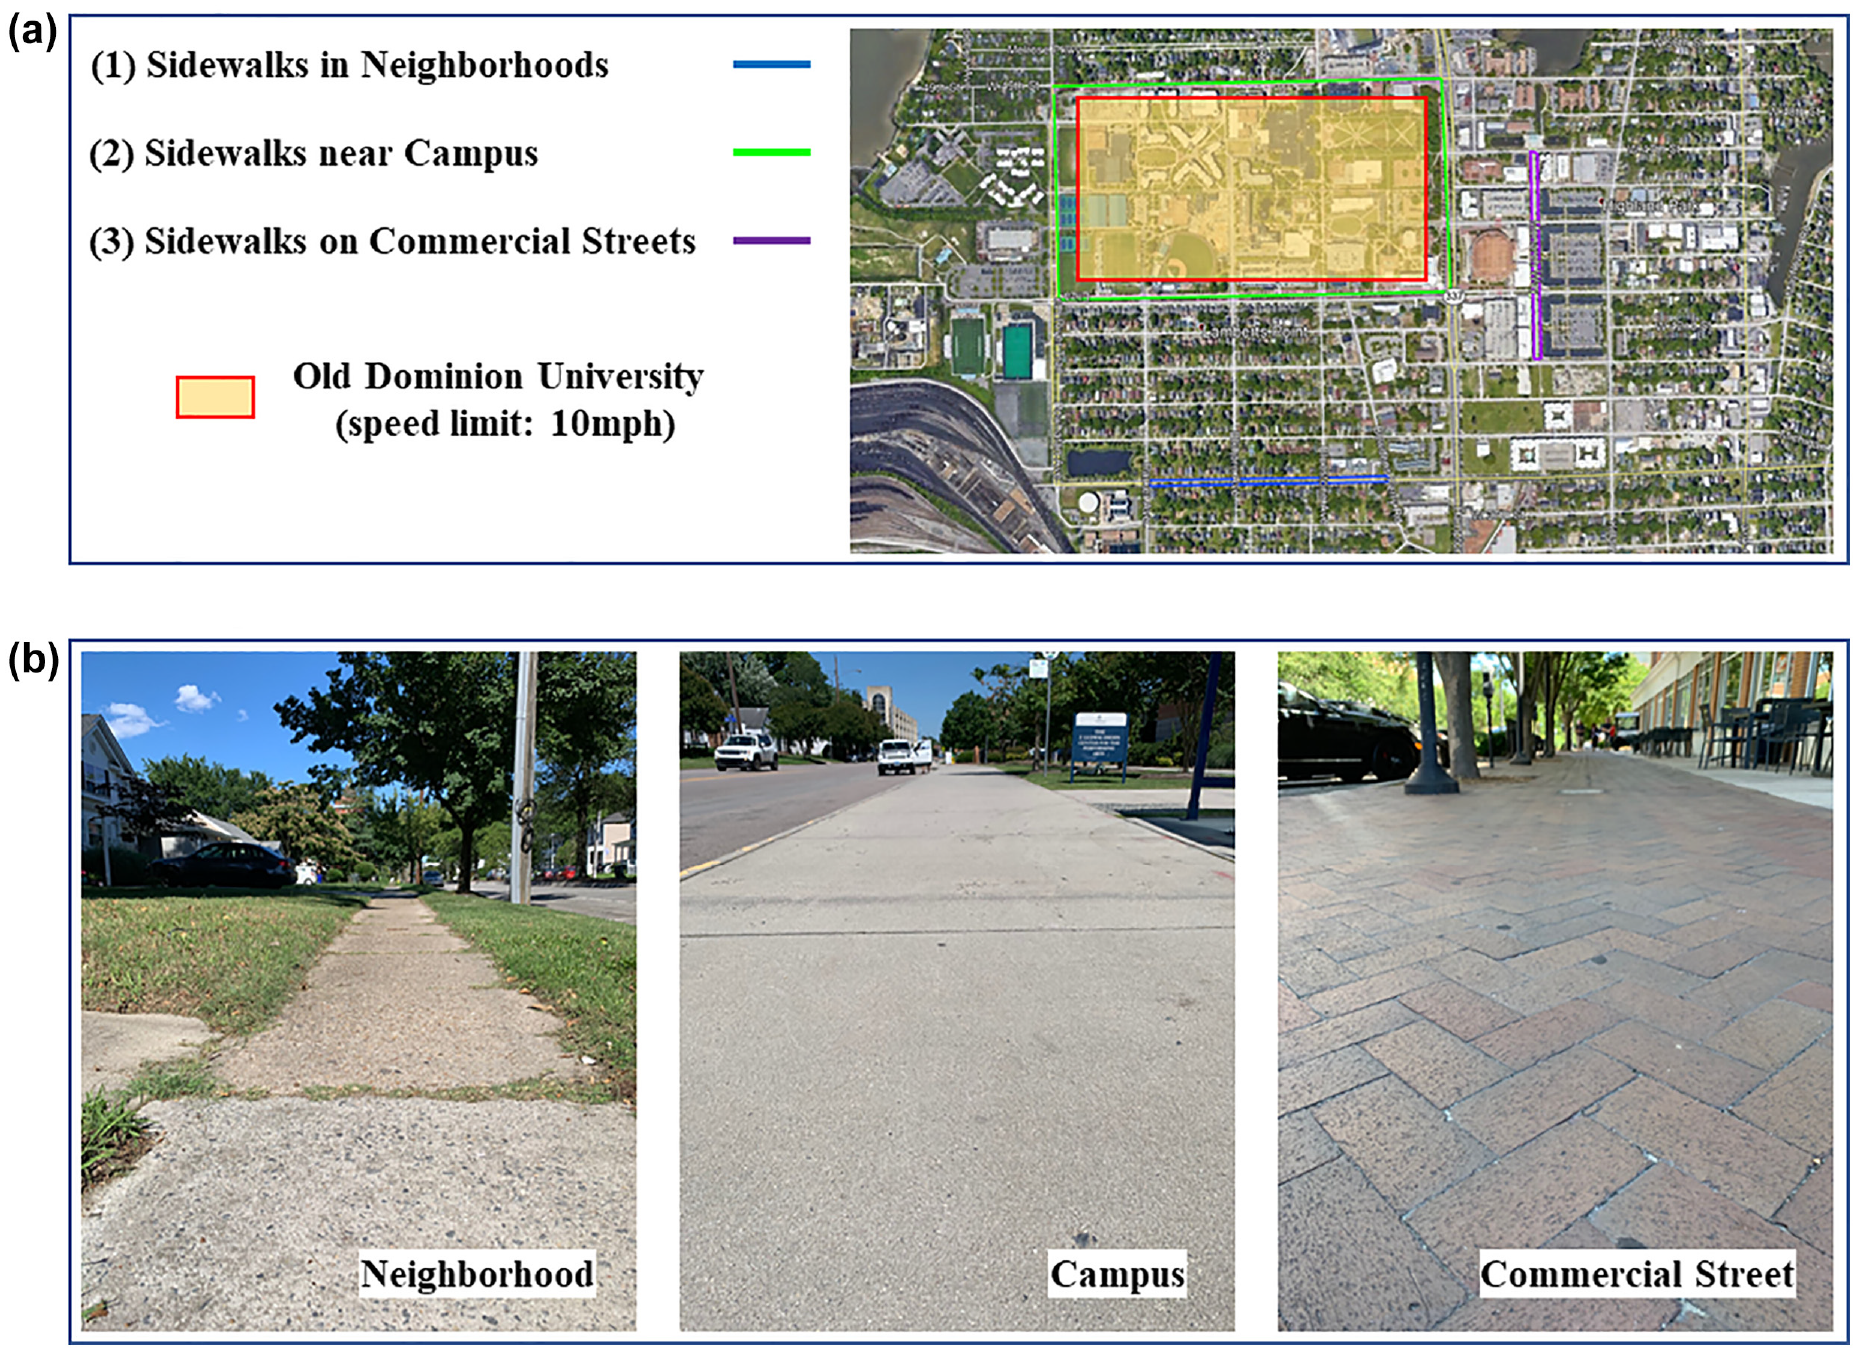
Selected sidewalks for conducting experimental tests: (a) test routes and (b) examples of given conditions.
Scenario Design
Two members from the research team acted as riders and conducted the relevant experiments. It should be noted that this study does not focus on the impact of human factors on riding risk. Instead, it focuses on quantifying vibrations during e-scooter trips. Arguably, the vibration patterns should be similar between the two under each scenario. This assumption was tested with statistical methods, described in later sections. Two types of e-scooter distributed by a major service provider in the City of Norfolk were tested: (1) type A has small wheels (diameter: 8 in.); and (2) type B has large wheels (diameter: 10 in.). Both types of e-scooter were ridden on the three designed routes. Meanwhile, the distributions of detected vibration events were statistically compared between the two types of e-scooter.
Calculating Vibration Indexes
After applying the calibrated model, vibration events were identified in each scenario. Then, sets of vibration indexes were calculated: (1) number of events; (2) e-scooter trip length; and (3) vibration density. The vibration density was equal to the number of events divided by the trip length, which describes the density of encountered vibration events during an e-scooter ride. The higher the vibration density, the less suitable that particular type of facility was for riding e-scooters on.
Mann Whitney Wilcoxon Rank Sum Test
The Mann Whitney Wilcoxon (MWW) rank sum test has been widely used for comparing whether two sample values are from the same population ( 23 ). The MWW test is given by

where
In this study, the detected vibration events were aggregated every 0.1 mi along the route. Then, the MWW rank sum test was applied for testing whether the performances between two riders were similar with the same experimental configuration, and if the performances were similar between the two types of e-scooter.
Experimental Results and Analysis
Vibration Event Calibration Results
As illustrated in Figure 2, a large-wheel e-scooter and a small-wheel e-scooter were ridden back and forth 10 times at selected locations. After collecting and processing vibration data, the maximum value and standard deviation of vibration magnitude are shown in Figure 4. Then, the parameters for identifying vibration events were calibrated. As a result,

Vibration calibration for typical events: (a) flat surface with small wheel, (b) flat surface with large wheel, (c) event A with small wheel, (d) event A with large wheel, (e) event B with small wheel, (f) event B with large wheel, (g) event C with small wheel, and (h) event C with large wheel.
Based on the calibration, Figure 5 shows the maps for detected vibration events on selected testing routes. Because of the possible disturbance of GPS signals, the events are located within a 10 m range of the potholes/slopes. For each testing scenario, a scatter plot was drawn with the X-axis indicating event speed and Y-axis indicating calculated vibration. The correlation values between the X and Y axes were close to zero for all testing scenarios. The weak correlation suggests that the speed and vibration variables are not highly related to each other.
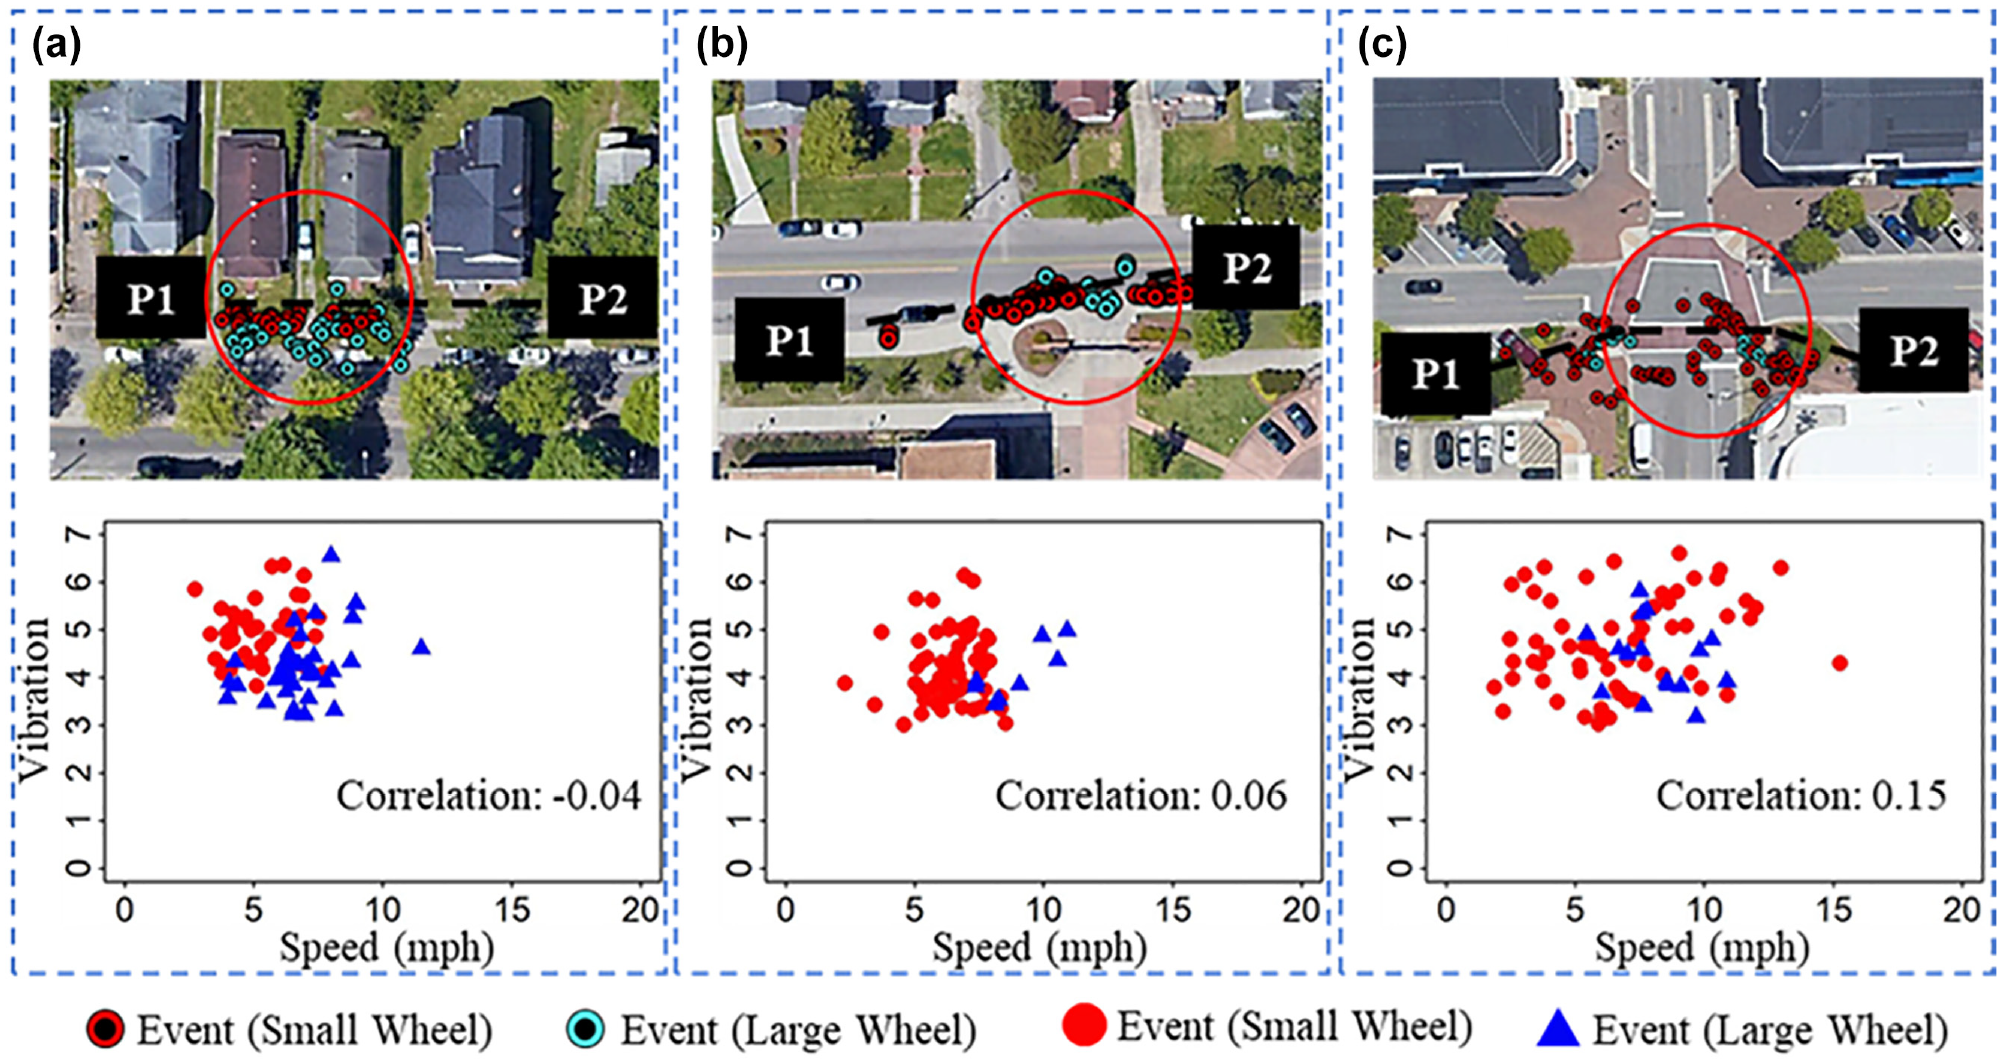
Vibration events on selected test routes: (a) location A, (b) location B, and (c) location C.
Comparative Analyses for E-Scooters with Different Wheel Sizes
After applying the calibrated model with
Vibration Indexes for Small-Wheel and Large-Wheel Scenarios
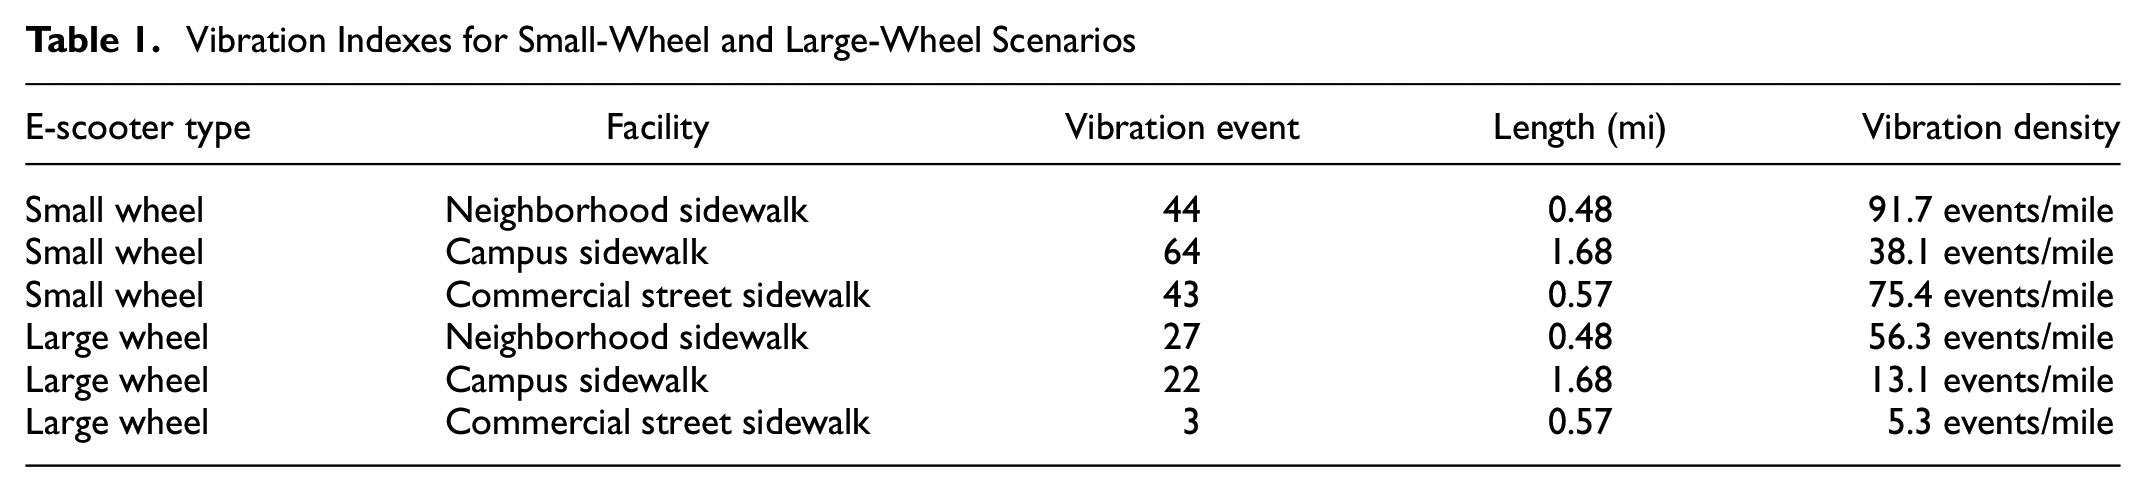
Figure 6 shows the vibrations in each second and the detected vibration events. It provides a straightforward illustration of the distributions of the events. Moreover, those spatial data can be used for developing an alerting system for e-scooter riders. Determined by the type of e-scooters, the riders can be notified when vibration events are near their riding paths.

Comparative analyses of vibration for e-scooters with small and large wheels: (a) samll wheel on route 1, (b) large wheel on route 1, (c) samll wheel on route 2, (d) large wheel on route 2, (e) samll wheel on route 3, and (f) large wheel on route 3.
MWW Rank Sum Testing Results
Two-Rider Comparison
Table 2 shows the results of MWW tests by pairing two e-scooter riders in the six designed scenarios (three routes by two e-scooter types). All p-values presented are larger than 0.1. Therefore, the null hypothesis on both riders experiencing the same vibrations failed to be rejected. The testing results indicate that the differences between the two e-scooter riders can be ignored.
Mann Whitney Wilcoxon Rank Sum Test Between Two Riders

Large-Wheel and Small-Wheel Comparison
Similarly, the MWW tests were applied to compare whether there is a statistical difference between the trips with small-wheel e-scooters and those with larger wheels. The p-values for the three selected routes are 0.0439, 0.0008, and 0.0043, respectively. The small p-values indicate that there is significant difference in detected vibration events when using e-scooters with different wheel sizes.
Discussion
The above comparative analysis indicates that different facilities have different impacts on the riding experience. Riding on sidewalks with poor pavement conditions can be a risk because of the increased vibration events. E-scooters may bump up at some unidentified potholes shown in Figure 7a. Facility maintenance engineers are expected to find such hidden hazards promptly and efficiently and provide necessary treatments. Before repair, such cracks can be marked to warn users, as in Figure 7b. Traffic cones shown in Figure 7c can be placed at a hazardous crack and temporarily protect e-scooter riders before any other engineering treatment is implemented. Even for repaired sites, if they were not as flat as the new one, it would be helpful to mark them with additional visual clue to raise the awareness of e-scooter riders (e.g., Figure 7d). Nevertheless, as many factors can lead to the degrading of sidewalk quality, timely identification of potholes and cracks in large areas can be challenging. As a mutual supporting solution, the mobile sensing procedures developed in this study can be used for gathering data and locating sites with issues. If such mobile sensing systems were deployed on existing e-scooter fleets, it will be beneficial to crowdsource the notable vibration events and quickly map the facilities with issues. The mapping results can be used to guide maintenance engineers to allocate resources for timely treatment of higher priority sites.
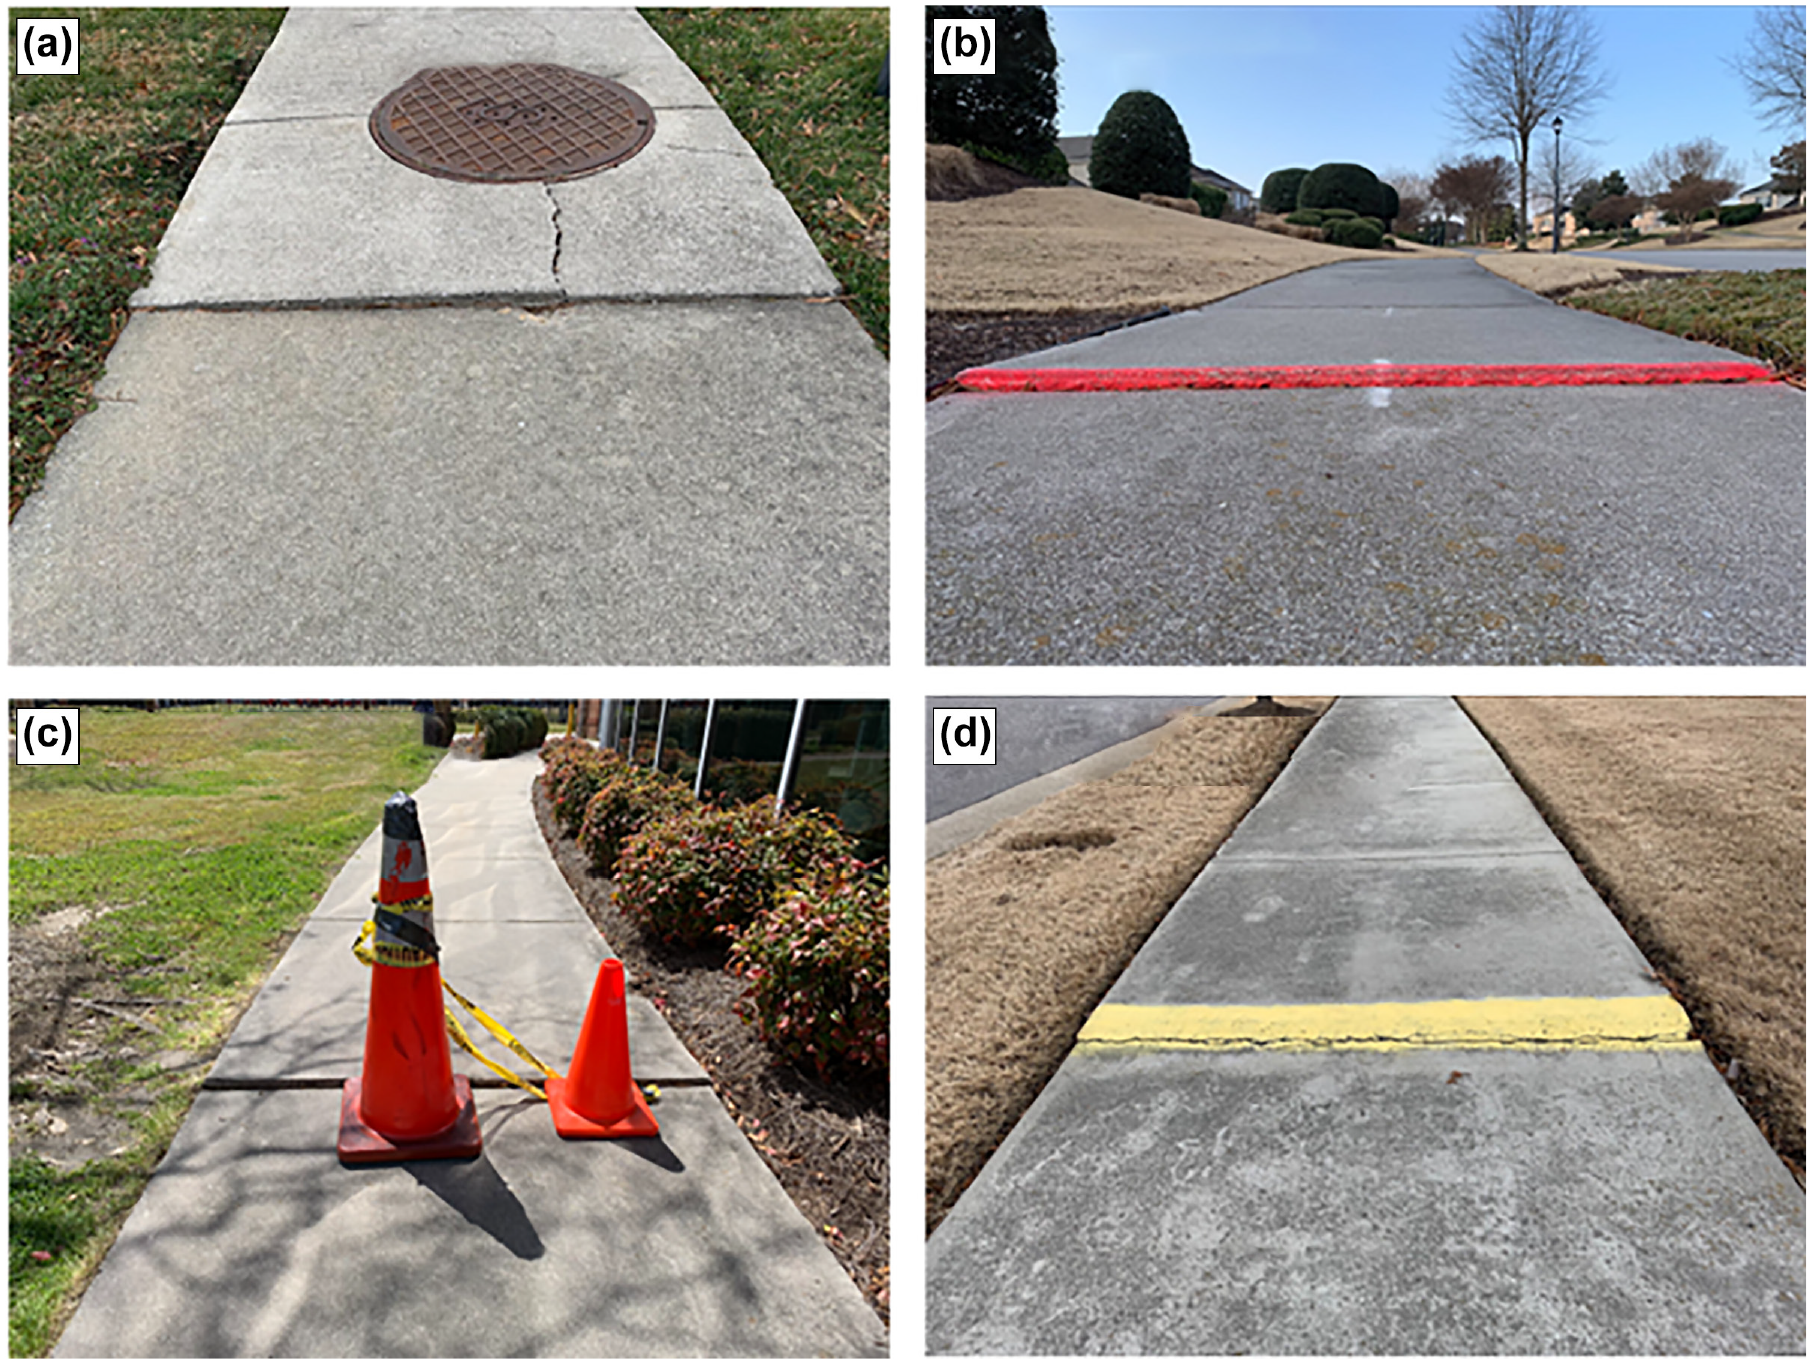
Sidewalk cracks and treatments for safety improvement: (a) unidentified, (b) identified crack, (c) block hazard crack, and (d) fixed crack.
Conclusions
The rapid rise of e-scooter programs provides riders a new option for short-distance travel. By sharing facilities with other transport modes, no dedicated road resources have been allocated to e-scooters. Consequently, many cities do not have clear guidance on where and how to ride e-scooters safely. Besides the complex naturalistic environments, e-scooter riders can feel strong vibrations on sidewalks with low-quality pavement conditions. Urgent efforts are necessary to support safer e-scooter operations by understanding riding behaviors. As emphasized by Ma et al. ( 8 ), e-scooter riders encounter strong vibrations because of the small wheel size compared with bicycles with relatively larger wheels. Meanwhile, the vibration patterns vary across different types of pavements (e.g., concrete or asphalt). However, no sufficient work has explored the vibrations of e-scooters with different wheel sizes. To shorten this gap, this study used mobile sensing technology to collect vibration data for three designed routes. With both statistical analysis and in-depth data mining, it was found that e-scooters with larger wheels have significantly improved comfort over those with small wheels, campus sidewalks with great pavement conditions offer a good riding condition for both types of e-scooter, and large-wheel e-scooters worked better on commercial streets with brick pavement. Thus, it is suggested that the deployment of e-scooters should consider both the riding infrastructure and the vehicle characteristics to provide users with a better riding experience.
Future Scope
This study has developed procedures to quantitively assess the performances of e-scooters with different wheel sizes. The experiments were conducted on typical routes frequently used by e-scooters. It has revealed that e-scooters with larger wheels can better alleviate vibrations than those with small wheels. The vibration detection workflow with mobile sensing technologies is also portable and extendable for additional related studies. For example, e-scooters with vibration sensors installed can be used for evaluating pavement conditions. Vibration event density (VED) can be calculated as an important indicator. The lower the VED values, the better the road conditions. When the VED values reach a pre-defined threshold, necessary maintenance or on-site inspection can be considered.
Besides the contributions and possible future applications, this study is limited in several aspects. First, besides the wheel size, the two types of e-scooter involved in this study also have different structures for damping springs. Therefore, the wheel size may not be the only reason for the experiment results. Further experiments are necessary if the damping spring structures were considered. Second, it should be noted that because of the availability of the e-scooters in the study area, only two types of e-scooter were tested. As more models of e-scooters emerge (e.g., e-scooters with portable batteries and e-scooters with different front and rear wheels), extension of the experimental study to additional types of e-scooters will further strengthen the understanding of their possible riding issues. Finally, the proposed vibration evaluation method requires researchers to attach mobile devices to e-scooters. This method is difficult to scale without vendors’ support. Thus, collaboration with e-scooter vendors is encouraged to deploy such sensors on e-scooters for a broader understanding of riding behaviors as well as providing data for timely assessment of facility conditions.
Footnotes
Acknowledgements
The study design, experiments, and data collection work have been performed while the first author was at Old Dominion University. We thank the previous undergraduate students A. Mayhue and R. Sun for their help in this research project. The authors appreciate the reviewers for their great comments that helped improve the paper.
Author Contributions
The authors confirm contribution to the paper as follows: study conception and design: H. Yang, Q. Ma; data collection: Q. Ma, Z. Yan, H. Yang; analysis and interpretation of results: Q. Ma, H. Yang, Z. Yan; draft manuscript preparation: Q. Ma, H. Yang, Z. Yan. All authors reviewed the results and approved the final version of the manuscript.
Declaration of Conflicting Interests
The author(s) declared no potential conflicts of interest with respect to the research, authorship, and/or publication of this article.
Funding
The author(s) disclosed receipt of the following financial support for the research, authorship, and/or publication of this article: This work was partially supported by a Program for Undergraduate Research and Scholarship (PURS 2020) grant from the Office of Research and Perry Honors College at Old Dominion University, Norfolk, Virginia, USA.

Data Accessibility Statement
The data used in this study were obtained based on individual riding tests. For privacy reasons, the data will not be publicly released. However, the data can be made available based on rational request and necessary data desensitization.
The contents of this paper only reflect views of the authors who are responsible for the facts and do not represent any official views of any sponsoring organizations or agencies mentioned in this paper.