
Abstract
The impact of various operational and design alternatives at roundabouts and traffic circles can be evaluated using microscopic simulation tools. Most microscopic simulation software utilizes default underlying models for this purpose, which may not be generalized to specific facilities. Since the effectiveness of traffic operations at traffic circles and roundabouts is highly affected by the gap rejection–acceptance behavior of drivers, it is essential to accurately model drivers’ gap acceptance behavior using location-specific data. The objective of this paper was to evaluate the feasibility of implementing an artificial neural network (ANN)-based gap acceptance model in SUMO, using its application programming interface. A traffic circle in New Jersey was chosen as a case study. Separate ANN models for one stop-controlled and two yield-controlled intersections were trained based on the collected ground truth data. The output of the ANN-based model was then compared with that of the SUMO model, which was calibrated by modifying the default gap acceptance parameters to match the field data. Based on the results of the analyses it was concluded that the advantage of the ANN-based model lies not only in the accuracy of the selected output variables in comparison to the observed field values, but also in the realistic vehicle crossings at the uncontrolled intersections in the simulation model.
Keywords
Controlling flow at intersections significantly affects the overall performance of a traffic network. Unsignalized intersections, specifically, are more prone to traffic hazards, delay, and congestion ( 1 ). Accurate models of such facilities are necessary to measure the efficiency of various safety countermeasures or alternative operational scenarios.
Roundabouts are popular uncontrolled traffic intersections because of their safety, capacity, and environmental advantages ( 2 ). One of the key factors in assessing the safety and operational performance of roundabouts is drivers’ gap acceptance behavior. The gap acceptance decision-making process depends on various external and internal parameters, such as vehicular characteristics, intersection characteristics, type of control, opposing flow, the psychological and socioeconomic status of drivers, the weather, pavement and light conditions, and factors related to vehicle occupancy.
As mentioned in the Literature Review section, the impact of various operational and infrastructure changes at roundabouts is evaluated using computer tools that employ analytical or simulation-based methods. There are a wide variety of computerized analysis tools that offer efficient and detailed analysis of transportation facilities. The choice of which computer tool to use depends on the scope of the project and study area. While deterministic tools offer an efficient and detailed analysis of roundabouts and estimate the capacity and delay at approaches, high-fidelity simulation tools can estimate the impact not only at the roundabout but also in the surrounding network, therefore providing a more comprehensive impact analysis of various safety and operational measures. However, the development of an accurate simulation model is a challenging issue because of the complexities in human-nature behavior and traffic flow dynamics. Most microscopic simulation tools utilize default underlying models for this purpose, developed based on some specific traffic condition, location, or both. These default models may not be generalized to other facilities because of the heterogeneity in driver behavior, demographics, cultural norms, and so forth. Since the effectiveness of traffic operations at traffic circles and roundabouts is highly affected by the gap rejection–acceptance behavior of drivers ( 3 ), it is essential to accurately model drivers’ gap acceptance behavior using location-specific data.
To that end, this paper aims to demonstrate the viability of using an artificial neural network (ANN)-based gap acceptance model in microscopic traffic simulation in lieu of the default gap acceptance model embedded in the simulation package. Collingwood traffic circle in New Jersey was used as a case study. The facility had an unconventional geometric and operational design before being reconstructed as a roundabout. The previous design of the circle was used for the simulation analyses as it presented a more viable test bed for demonstrating the need for location-specific gap acceptance behavior models for microscopic simulation analyses, especially for facilities with complex geometric and operational designs. The simulation model of the circle, for the morning peak period (7–9 a.m.) was developed in Simulation of Urban Mobility (SUMO) simulation software. The gap acceptance models were developed using a back-propagation (BP) neural network trained by the field data, collected as part of an earlier study by Bartin et al. ( 3 ). Then these intersection-specific models were applied in SUMO using its application programming interface (API), namely the Traffic Control Interface (TraCI). The validation of the simulation model was then conducted by comparing the selected simulation outputs with those from the field data. The analysis results showed that the ANN-based model was able to produce more realistic vehicle crossings at these uncontrolled junctions compared to the calibrated default SUMO model.
The remainder of this paper is organized as follows. In the next section, a literature review on gap acceptance is presented. The research methodology is described in the following section, which explains the ANN model development and its implementation in the SUMO API. Then, the case study is explained, followed by data collection and analysis results. Finally, the conclusion and future work are presented in the last section.
Literature Review
The critical gap parameter is commonly used to understand gap acceptance behavior at unsignalized intersections and to conduct intersection-related safety and operations analysis. It refers to a gap threshold that determines whether a minor-road vehicle should be able to cross the intersection. By definition, the critical gap is the minimum time headway (TH) in the mainstream that is acceptable to a driver on the minor road ( 4 ). It is not possible to observe the critical gap directly; instead, it can be estimated by analyzing the accepted and rejected gaps. The value of the critical gap depends on various parameters, such as the traffic conditions, driver characteristics, weather conditions, vehicle type, waiting time, and so forth ( 5 – 10 ). Unsignalized intersections, specifically roundabouts, can be modeled and analyzed using analytical or simulation-based methods. Analytical method employs the critical gap as a key variable to evaluate the safety, delay, and capacity performance of intersections ( 11 ). There are two ways to model the critical gap: the deterministic approach and the probabilistic approach ( 12 ). The deterministic approach assigns a single average value to the critical gap, assuming that gaps larger than the critical gap are accepted and those smaller are rejected. On the other hand, the probabilistic method takes into account the inconsistency and heterogeneity in the gap acceptance behavior of drivers in the minor stream and treats the critical gap as a random variable. There are different methods of calculating the critical gap in the literature, which includes Raff’s method, the clearing time method, the binary probit model, the maximum likelihood method, and so forth, as well as machine learning methods, such as the decision tree (DT), random forest (RF), support vector machine (SVM), and ANN methods ( 13 – 27 ). For example, Sangole and Patil ( 21 ) applied an adaptive neuro-fuzzy interface system (ANFIS) to model drivers’ gap acceptance behavior at a limited priority T-intersection. It should be noted that the estimated critical gap value may vary for each of these estimation approaches ( 22 – 25 ). For instance, Ashalatha and Chandra ( 5 ) proposed a new method to estimate the critical gap, known as the clearing time method, which is suitable for mixed traffic conditions. In this method, the clearing time is defined as the time it takes for a minor approach vehicle to enter the intersection and exit. The intersection of the cumulative frequency distribution of the accepted gaps and clearing time indicates the critical gap. Amin and Maurya ( 26 ) concluded that the clearing time method produces the most accurate results in heterogeneous traffic situations. They also claimed that the main assumption in most of these statistical models is that the traffic condition is consistent and heterogeneous, and thus they are not suitable for mixed traffic conditions. Dutta and Ahmed ( 27 ) concluded that the estimation of the critical gap at a three-legged unsignalized intersection obtained better results by the logit method than the clearing time method. In another study conducted by Maurya et al. ( 25 ), 10 different methods for calculating the critical gap were compared, including Raff’s method, the logit model, the acceptance curve, and the clearing time approach. The results indicated that the most significant difference was between Raff’s method (2.65 s) and the clearing time method (5.0 s) for passenger cars. In addition, the critical gap value in the logit method was estimated to be 1.9 s less than that of the clearing time method. Nagalla et al. ( 18 ) applied three machine learning models, the SVM, RF, and DT, to evaluate the gap acceptance behavior of drivers in a left-turning maneuver in an unsignalized intersection. Their results indicated that both the SVM and RF techniques produced roughly similar results, while the RF model performed better than the two others with respect to prediction accuracy and computational costs. In addition, the machine learning techniques proved to be more advantageous than the statistical techniques because, firstly, they can resolve the outliers and missing values problem and, secondly, they are non-parametric tools that do not need any predefined correlation between independent and target variables ( 16 ). Pawar et al. ( 17 ) compared the SVM model and binary logit model (BLM) to predict the critical gaps. Based on the categorical statistics and skill scores, they stated that the SVM performed reasonably well in comparison with the BLM method. As indicated by Dutta and Ahmed ( 27 ), both the clearing time method and logit method produced roughly similar critical gap values in the analytical method and simulation-based method.
In the simulation-based method, the analysis and modeling of complex traffic scenarios could be accomplished using off-the-shelf traffic simulation packages, such as Paramics, MATSim, VISSIM, SUMO, and so forth. These tools provide users with the capability to implement and evaluate various operational and capacity changes and their impact at a network level. However, most simulation packages are based on empirical models, which necessitate modifying the default underlying models to match the location-specific driving behavior based on ground truth data. Therefore, accurate replication of traffic behavior models, such as gap acceptance, car following, lane changing, and so on, necessitates performing a calibration and validation process with the objective of minimizing the difference between simulated and observed outputs ( 28 ). There is rich literature focusing on assessing the impact of various design and operational alternatives using simulation models ( 3 , 19 , 27–31). Leite et al. ( 31 ) examined the performance of a roundabout under various operational conditions, such as changing the speed and acceleration within roundabouts as well as the minimum distance between vehicles, with the application of the SUMO simulation tool. The main conclusion drawn from this study is that a balance between the minimum safe distance and adequate acceleration could be achieved through an accurate calibration of the underlying simulation functions, such as the car-following or lane-changing models. Bartin et al. ( 3 ) modeled and simulated the gap acceptance behavior of drivers in two unconventional roundabouts, located in New Jersey, using the binary probit model and the API of Paramics software based on ground truth data. They claimed that the default gap acceptance model of Paramics may not be suitable for some specific locations; thus, the binary probit model performed better in Paramics with respect to predicting the gap acceptance decisions at these two unconventional traffic circles. In addition, Bartin ( 29 ) applied the same observed data used by Bartin et al. ( 3 ) to reproduce the gap acceptance decision-making process in a stop-controlled intersection with the application of a Q-learning reinforcement algorithm (RL). The study showed that the RL could be promising with respect to reproducing the drivers’ gap acceptance decision in microscopic simulation with a high level of validation accuracy. Arafat et al. ( 32 ) used simulation modeling to investigate the performance of the Signalized Left Turn Assist (SLTA) system, a connected vehicle (CV)-based application, at signalized intersections. The calibration of the microscopic simulation model was accomplished according to real-world gap acceptance distribution to better assess real-world driver behaviors at permissive left-turn signals. The results showed that the impact of SLTA could be beneficial with respect to increasing the left-turn capacity and safety, as well as reducing the delay time, depending on the SLTA gap time parameter setting. Further, Arafat et al. ( 33 ) evaluated the impact of the Stop Sign Gap Assist (SSGA) system, a CV-based application at unsignalized intersections, on the mobility and safety performance of an intersection using a calibrated microscopic simulation model. Their study demonstrated a clear trade-off between safety and capacity. This is to say, the SSGA model holds the balance between capacity and safety by adjusting the time gap setting within the intersection: the smaller the time gap the higher the capacity, and the larger the time gap the higher the safety.
In summary, simulation-based approaches are more beneficial than analytical methods because of their ability to analyze various operational and design alternatives not only at an intersection independently but at a larger scale to determine their overall impact on the surrounding network.
There has been increasing interest in the application of the ANN within the traffic and transportation domain ( 34 – 38 ). The main popularity of the ANN method is because of its capability to model complex scenarios and nonlinear problems such as heterogeneous vehicle characteristics with nonlinear and discontinuous interaction ( 39 ). An ANN model comprises input, hidden, and output layers that are linked by neurons. Generally, an ANN model is able to capture the interrelationship between input and output variables using the activation function of hidden neurons, and its prediction accuracy can be enhanced by tuning the connection weights of each neuron with the objective of reaching the maximum correlation coefficient or minimum mean square error based on field data. The critical challenge of building an ANN model is to establish an architecture with optimum performance values and several hidden layers and several neurons with suitable activation functions. Various studies have utilized the ANN method for modeling different types of driving behaviors. Kadali et al. ( 40 ) applied the ANN model to evaluate the pedestrians’ gap acceptance behavior under mixed traffic circumstances. The study showed that the ANN model could accurately emulate pedestrians’ gap acceptance decisions in heterogeneous traffic conditions. Zheng et al. ( 41 ) modeled driver lane-changing behavior using the ANN and multi-nominal (MNL) models. They reported that the ANN model performed better than the MNL model in predicting the vehicle’s lane-changing decision process. In another study, drivers’ car-following behavior was modeled with the application of an ANN and an alternative model, the Gazis–Herman–Rotery (GHR) model ( 42 ). The study concluded that the ANN model outperformed the GHR model in reproducing drivers’ car-following behavior. Bagheri et al. ( 19 ) evaluated the feasibility of validating vehicles’ gap acceptance decisions in a stop-controlled intersection using the ANN model and microscopic traffic simulation programming in SUMO. The analysis results indicated that the ANN-based SUMO model produced superior results and led to significantly more realistic driving behavior in the major stream compared to the SUMO model with default gap acceptance parameters and the SUMO model with calibrated gap acceptance parameters. Reviewing the previous literature indicated that there is still a research gap with respect to the application of the ANN in the gap acceptance context. This paper intends to close this gap by reproducing the real-world vehicles’ gap acceptance behavior in three different intersections at a traffic circle using the ANN method and implementing it in SUMO through its API capability. This work is an extension of Bagheri et al. ( 19 ), in which only a stop-controlled intersection was modeled independently from the traffic circle and its surrounding network.
Methodology
The methodology used to reach the study objectives is twofold. Firstly, separate ANN models were trained based on collected field data to model the vehicle’s gap acceptance behavior at each of the selected stop- and yield-control intersections within the circle. Then, the proposed ANN-based models were integrated in the simulation with the application of the SUMO API. The output of the ANN-based simulation model was compared with the outputs of the default SUMO model, which was calibrated by tuning its gap acceptance-related parameters. The selected output variables were the wait time of the vehicle at the minor approach and traffic flow at the major and minor approaches.
ANN Model Development
This paper proposes an ANN model that was developed based on a feedforward BP algorithm using the Keras library in Python. As was mentioned before, the input layer, hidden layers, and output layer are the main building blocks of an ANN model. Each of these layers contains a set of neurons with predefined activation functions that are interconnected to each other via a weight value. In the training process the weights and bias are modified through an iteration of feeding forward the network, calculating the difference between the estimated target and the observed target, and then propagating it back to each neuron until convergence of the connection weights and minimization of the error propagation. The gradient descent algorithm was used as the learning rule during each training episode to gradually predict drivers’ gap acceptance decisions from the input and output data. The input layer contains several neurons equal to the number of input variables. The bias and weighted inputs were summed to be the input of the activation function within the next (hidden) layer. The last layer is the output layer, which depending on the nature of the classification problem can include one neuron (binary classification) or several neurons (multi-class classification). An extensive trial and error process is required to optimize the ANN structure (number of hidden layers and neurons) and hyperparameters with the main objective of maximizing the validation accuracy and minimizing the validation loss, taking into account the trade-off between bias and variance.
In this paper, three ANN models were developed for three different intersections, two yield-control and one stop-control, based on field data. The specifics of each intersection are presented in the next section. The ANN model for these intersections comprises one input layer, three hidden layers, and one output layer. The input layer is comprised of following five variables: (i) the TH of the mainstream traffic; (ii) the wait time at the minor stream; (iii) the lane index of approaching vehicles at the major road; (iv) the lane index of vehicles at the minor road for yield-controlled intersections; and (v) the types of vehicles at the minor stream for the stop-controlled intersection. Each hidden layer includes 16 neurons with the rectified linear unit (ReLU) activation function. The output layer includes one neuron with a sigmoid activation function. This function produces a probability output between 0 and 1, predicting the probability of accepting a gap. The proportion of data for training the ANN model was 80% and that for validating the ANN model was 20%. The loss function used for this model is the binary cross-entropy and the optimizer used is the stochastic gradient descent with a learning rate of 0.05.
ANN Model Implementation in SUMO
SUMO was used to implement and evaluate the ANN-based gap acceptance model within the selected traffic circle. SUMO is an open-source, multi-modal, portable, microscopic traffic simulation tool capable of simulating large traffic networks ( 43 ). The API of SUMO, known as the TraCI, provides users with control over the simulation objects, and the ability to adjust the object attributes and implement an improved user-defined model in lieu of the default underlying models.
Figure 1 demonstrates a flowchart of the simulation programming algorithm designed for implementing the proposed ANN-based gap acceptance model in the SUMO TraCI. The required input data to feed the simulation are network topology, traffic signal timing programs, and vehicular demands. At every simulation step (0.1 s), the simulation model requires a series of information from the incoming edges of three selected intersections at the selected circle. Basically, this command is called when there is a leading vehicle at the minor roads. For each approaching vehicle in the minor road, with respect to its control sign (STOP/YIELD), the leading vehicle should stop or slow down before the intersection. If there are no vehicles at the major road, the vehicle at the minor road can proceed and cross the intersection. If the mainstream contains incoming vehicles, the simulation model retrieves and computes an array of the above-mentioned five variables as inputs to the ANN model to predict the vehicle’s gap acceptance decision. Next, the ANN model predicts a probability between 0 and 1. Any value above 0.5 is taken as an accept decision, and values below 0.5 as a reject decision. If the gap is accepted, the vehicle is allowed to enter the intersection; otherwise, it waits for the next gap.
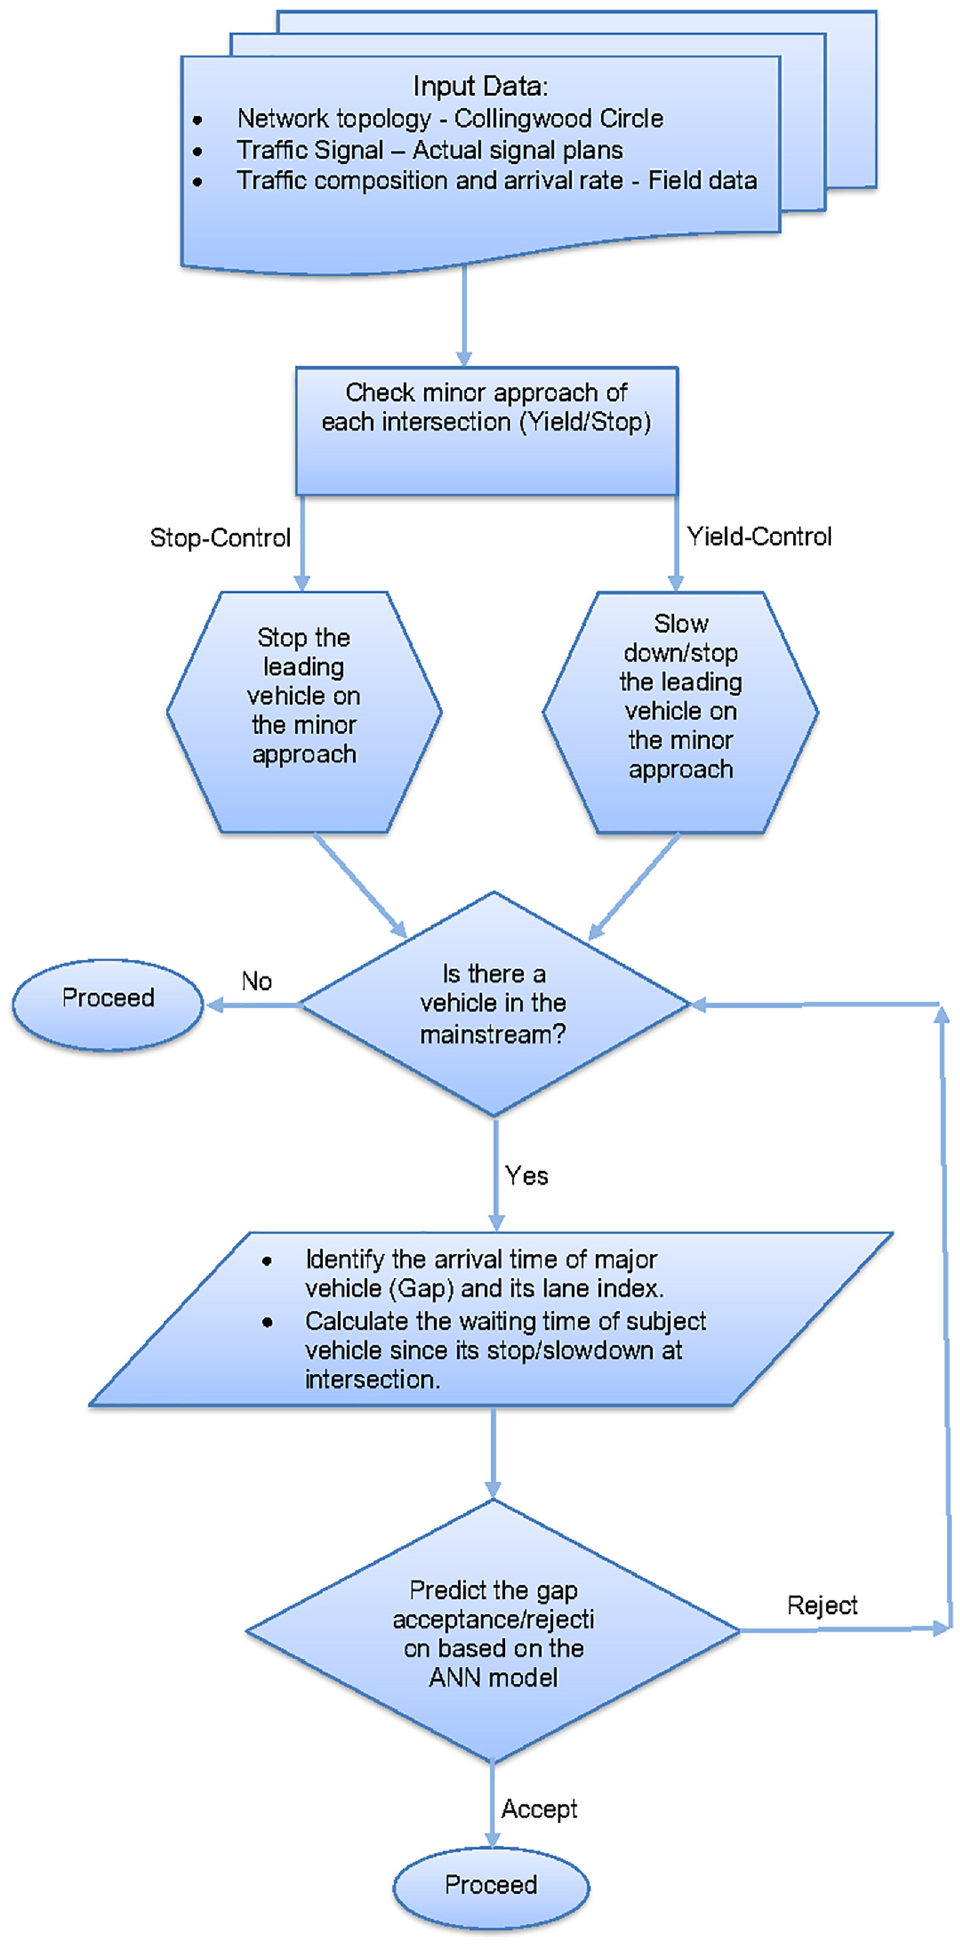
Simulation programming flowchart.
Case Study
Collingwood Circle, studied by Bartin et al. ( 3 ), was used as a case study in this paper. Before being redesigned and reconstructed as a modern roundabout in 2006, the entering traffic had priority over circulating flow and vehicles within the circle (minor approach vehicles) had to yield to the vehicles entering the circle (major approach vehicles). Figure 2 shows the old design of the Collingwood Circle, which contains one cross one-way stop-control intersection and four yield-control intersections, and its simulation model developed in SUMO. However, only three intersections were chosen (Locations A–C) for validation, as they had a significant impact on the performance of the circle. Note that all links except movements 7, 10, and 11 in Figure 2 are two-lane roads.
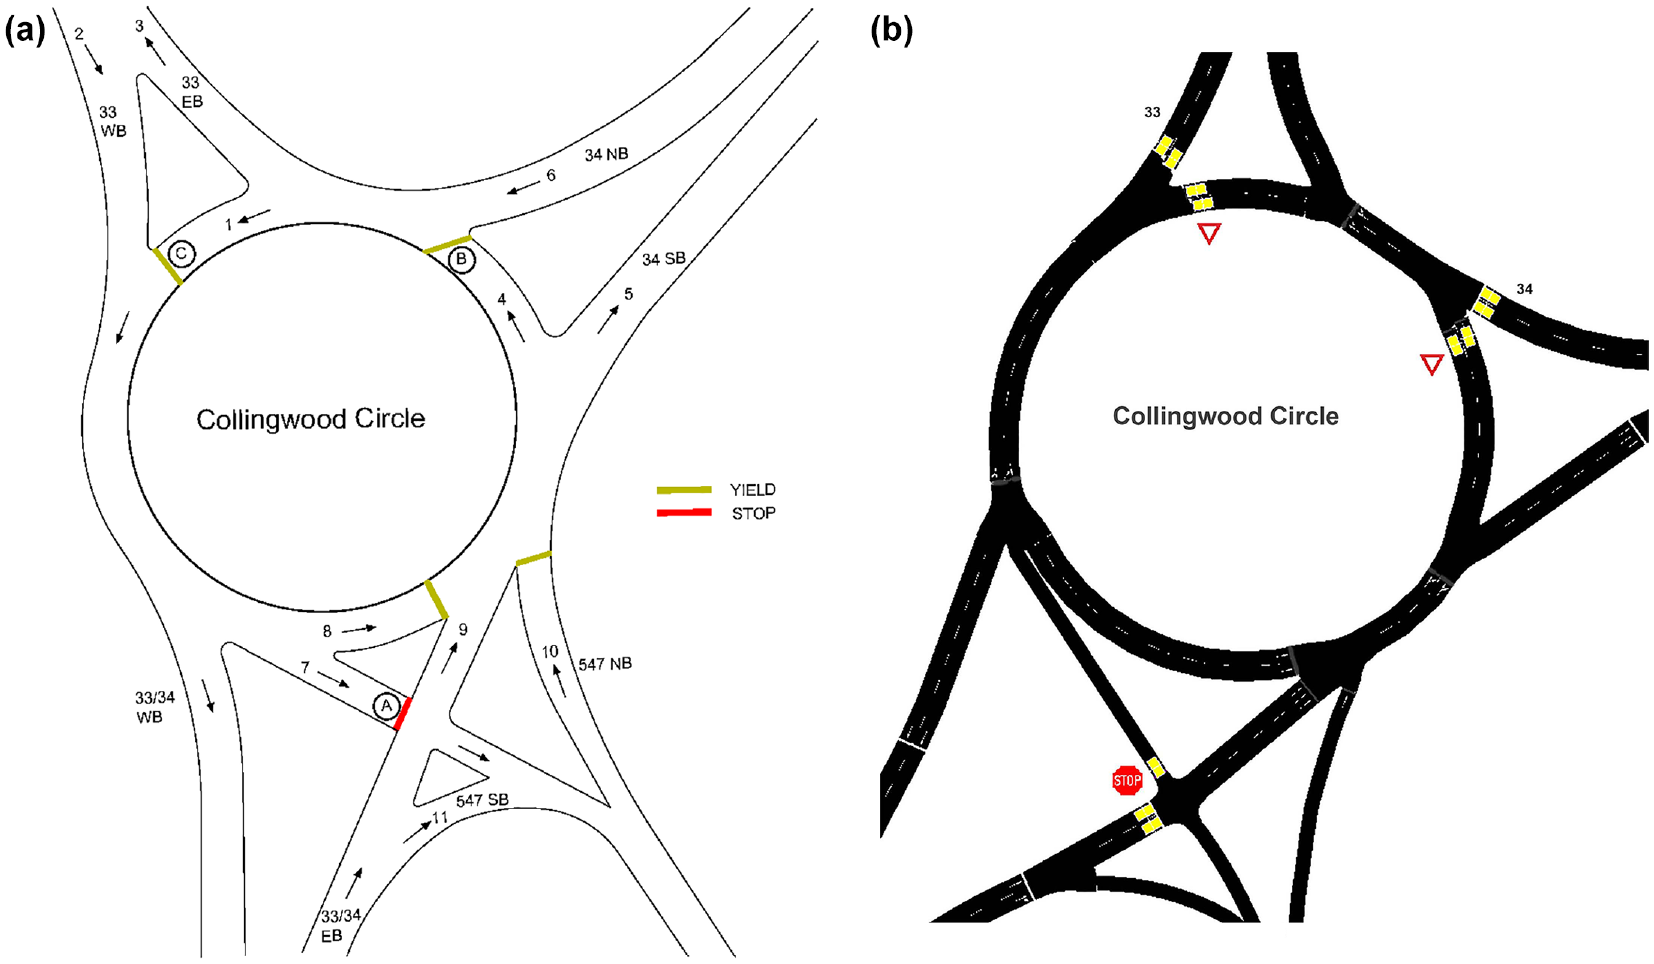
(a) Geometric and operational design of Collingwood Circle. (b) Simulation model in SUMO.
In this study, the observed data were borrowed from Bartin et al. ( 3 ), which was collected by capturing the time stamps of the vehicles entering and exiting the intersection using video recordings. The TH (gap) was defined as the difference between consecutive vehicles in the major approach when crossing the intersection at each entry point. The cumulative wait time was calculated as the time difference when a minor approach vehicle arrives at and departs from the intersection. After the data preparation for the morning peak period, 7–9 a.m., the following key variables were extracted: (i) vehicle counts with percentage composition of trucks and passenger cars; (ii) vehicle interarrival times at the major road; (iii) vehicle wait times before the stop/yield sign on the minor road; (iv) the lane index of vehicles at the major/minor road; and (v) gap acceptance/rejection times at the stop/yield sign.
Analysis Results
Two gap acceptance behavior models were compared at each selected intersection: (1) the proposed ANN-based model; and (2) the default SUMO model, which was calibrated based on the available gap acceptance parameters in the software tool.
The ANN-based model was calibrated by altering the ANN structure (number of neurons, number of layers) and hyperparameters (activation function, number of epochs, and learning rate) to reproduce certain observed output variables in SUMO with a 95% confidence interval. The ANN models were run for 700 epochs. The performance of the developed models is presented in Table 1 for each intersection within the circle. As mentioned earlier, these models were incorporated in SUMO using the TraCI.
Performance of the Artificial Neural Network Models

The calibration process in the SUMO-calibrated model was conducted by manipulating various parameters. These parameters play an important role in the gap acceptance behavior and intersection modeling in SUMO. Modeling the realistic intersection dynamics in SUMO follows certain criteria, such as no deadlock, no collision, efficient use of the intersection, realistic acceptance gaps, approaching unprioritized links without stopping, and qualitative dynamics independent of the simulation step length. Generally, when a vehicle approaches an intersection (entry link), it computes the time window in which it occupies the intersection and then checks against all approaching vehicles in all conflict links of its entry links. If the time window does not intersect with the approaching conflicting time slots, the vehicle can enter the intersection. Otherwise, it should decide based on various attributes defined for the vehicle type and intersection type in SUMO. The attributes selected for the calibration purpose of this study include the following: (i) the minimum time gap when passing ahead of a prioritized vehicle; (ii) vehicles’ acceleration/deceleration ability in both approaches; (iii) the speed limit in the major approach; and (iv) the impatience of vehicles in the minor traffic stream. For example, the minimum time gap when passing ahead of a prioritized vehicle is a parameter related to the car-following model that allows the vehicle to maintain a safe distance with other vehicles, and the impatience of a vehicle is a parameter that represents the drivers’ degree of aggressiveness (a real value between [0, 1]), which grows while waiting to pass the intersection, that is, the more vehicles wait, the smaller gaps they tend to accept. Vehicles with an impatience value of 1 will enter the intersection while disregarding the approach of the high-priority stream, provided that they will not force the high-priority vehicles to perform an emergency braking maneuver. If it cannot be guaranteed that the high-priority vehicles can brake normally, the gap will not be accepted. On the other hand, the impatience of 0 implies that vehicles do not enter the intersection until they find an acceptable gap. These parameters are specific to the individual vehicle’s characteristics, such as the car-following model, waiting time, deceleration ability, speed, and so forth, and can be customized in SUMO to reproduce the gap acceptance behavior in the real-world. In other words, these parameters were adjusted in SUMO until the error between the simulation and observed output variables converged with a 95% confidence interval. Detailed information about intersection modeling and the gap acceptance mechanism in SUMO is given by Erdmann and Krajzewicz ( 44 ).
Three output variables were selected for validation. These are the (i) the average wait time at the minor approach and (ii) the traffic flow at the major and (iii) minor approaches. The simulation network was run iteratively based on the following formula ( 45 ):
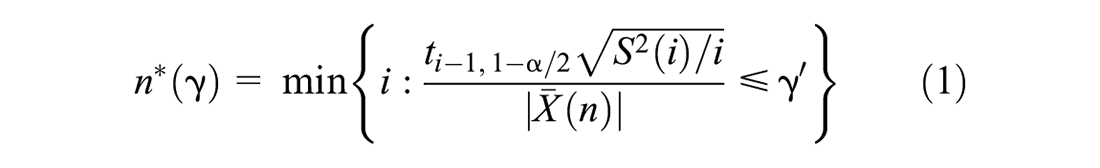
where
The observed and simulation system outputs for each selected location are shown in Table 2. The observed average wait time of vehicles at the minor approach and traffic flow at the major and minor approaches are compared with the corresponding values of the ANN-based and calibrated SUMO simulation models. Note that the queueing time was not considered when computing the wait time. According to Table 2, the 95% confidence interval for the average wait time at Locations B and C does not cover the corresponding field averages. However, such slight deviations should be expected considering that these are yield-controlled intersections where most vehicles roll past the intersections, and that the output collection of SUMO and the analyst’s data extraction methods from video recordings are never identical. Furthermore, Table 2 indicates that none of the simulated output values are substantially out of range. It can also be seen that the calibrated SUMO model produced similar results to the ANN-based model, as the observed average wait times are very close but outside the 95% confidence level. The results shown in Table 2 also show that the confidence interval for the number of vehicles processed at the major and minor approaches by the ANN-based and the calibrated SUMO models cover the observed values.
Observed and Simulation Output During the Morning Peak Hours (7–9 a.m.)

Note: ANN = artificial neural network; TraCI = Traffic Control Interface.
In a recent work, using the same ANN-based approach, Bagheri et al. ( 19 ) analyzed Location A in SUMO for the afternoon peak period, independently from the other intersections at the study circle. This study observed that in the calibrated SUMO model, the vehicles on the major road frequently decelerated at the intersection, often coming to a full stop as the vehicles on the minor approach accepted unrealistically low gaps. This was because of the impatience parameter used by SUMO: as vehicles wait more than a certain threshold, they start ignoring the priority rules. To inspect this deceleration behavior, the speed and acceleration trajectories of vehicles on the major approach were generated for both simulation models, as shown in Figures 3 and 4. These figures demonstrate the average speed and acceleration profiles of major vehicles within one standard deviation range when approaching the selected intersections at the circle. The positions of the intersections are shown by a vertical dashed line in the figures. The figures indicate that both simulation models show consistent behavior with respect to speed and acceleration, which means that the minor vehicle does not make a sudden decision to cross the intersection causing the major vehicles to decelerate or slow down.

Speed trajectory at major approaches: (a) artificial neural network-based model and (b) calibrated SUMO model.
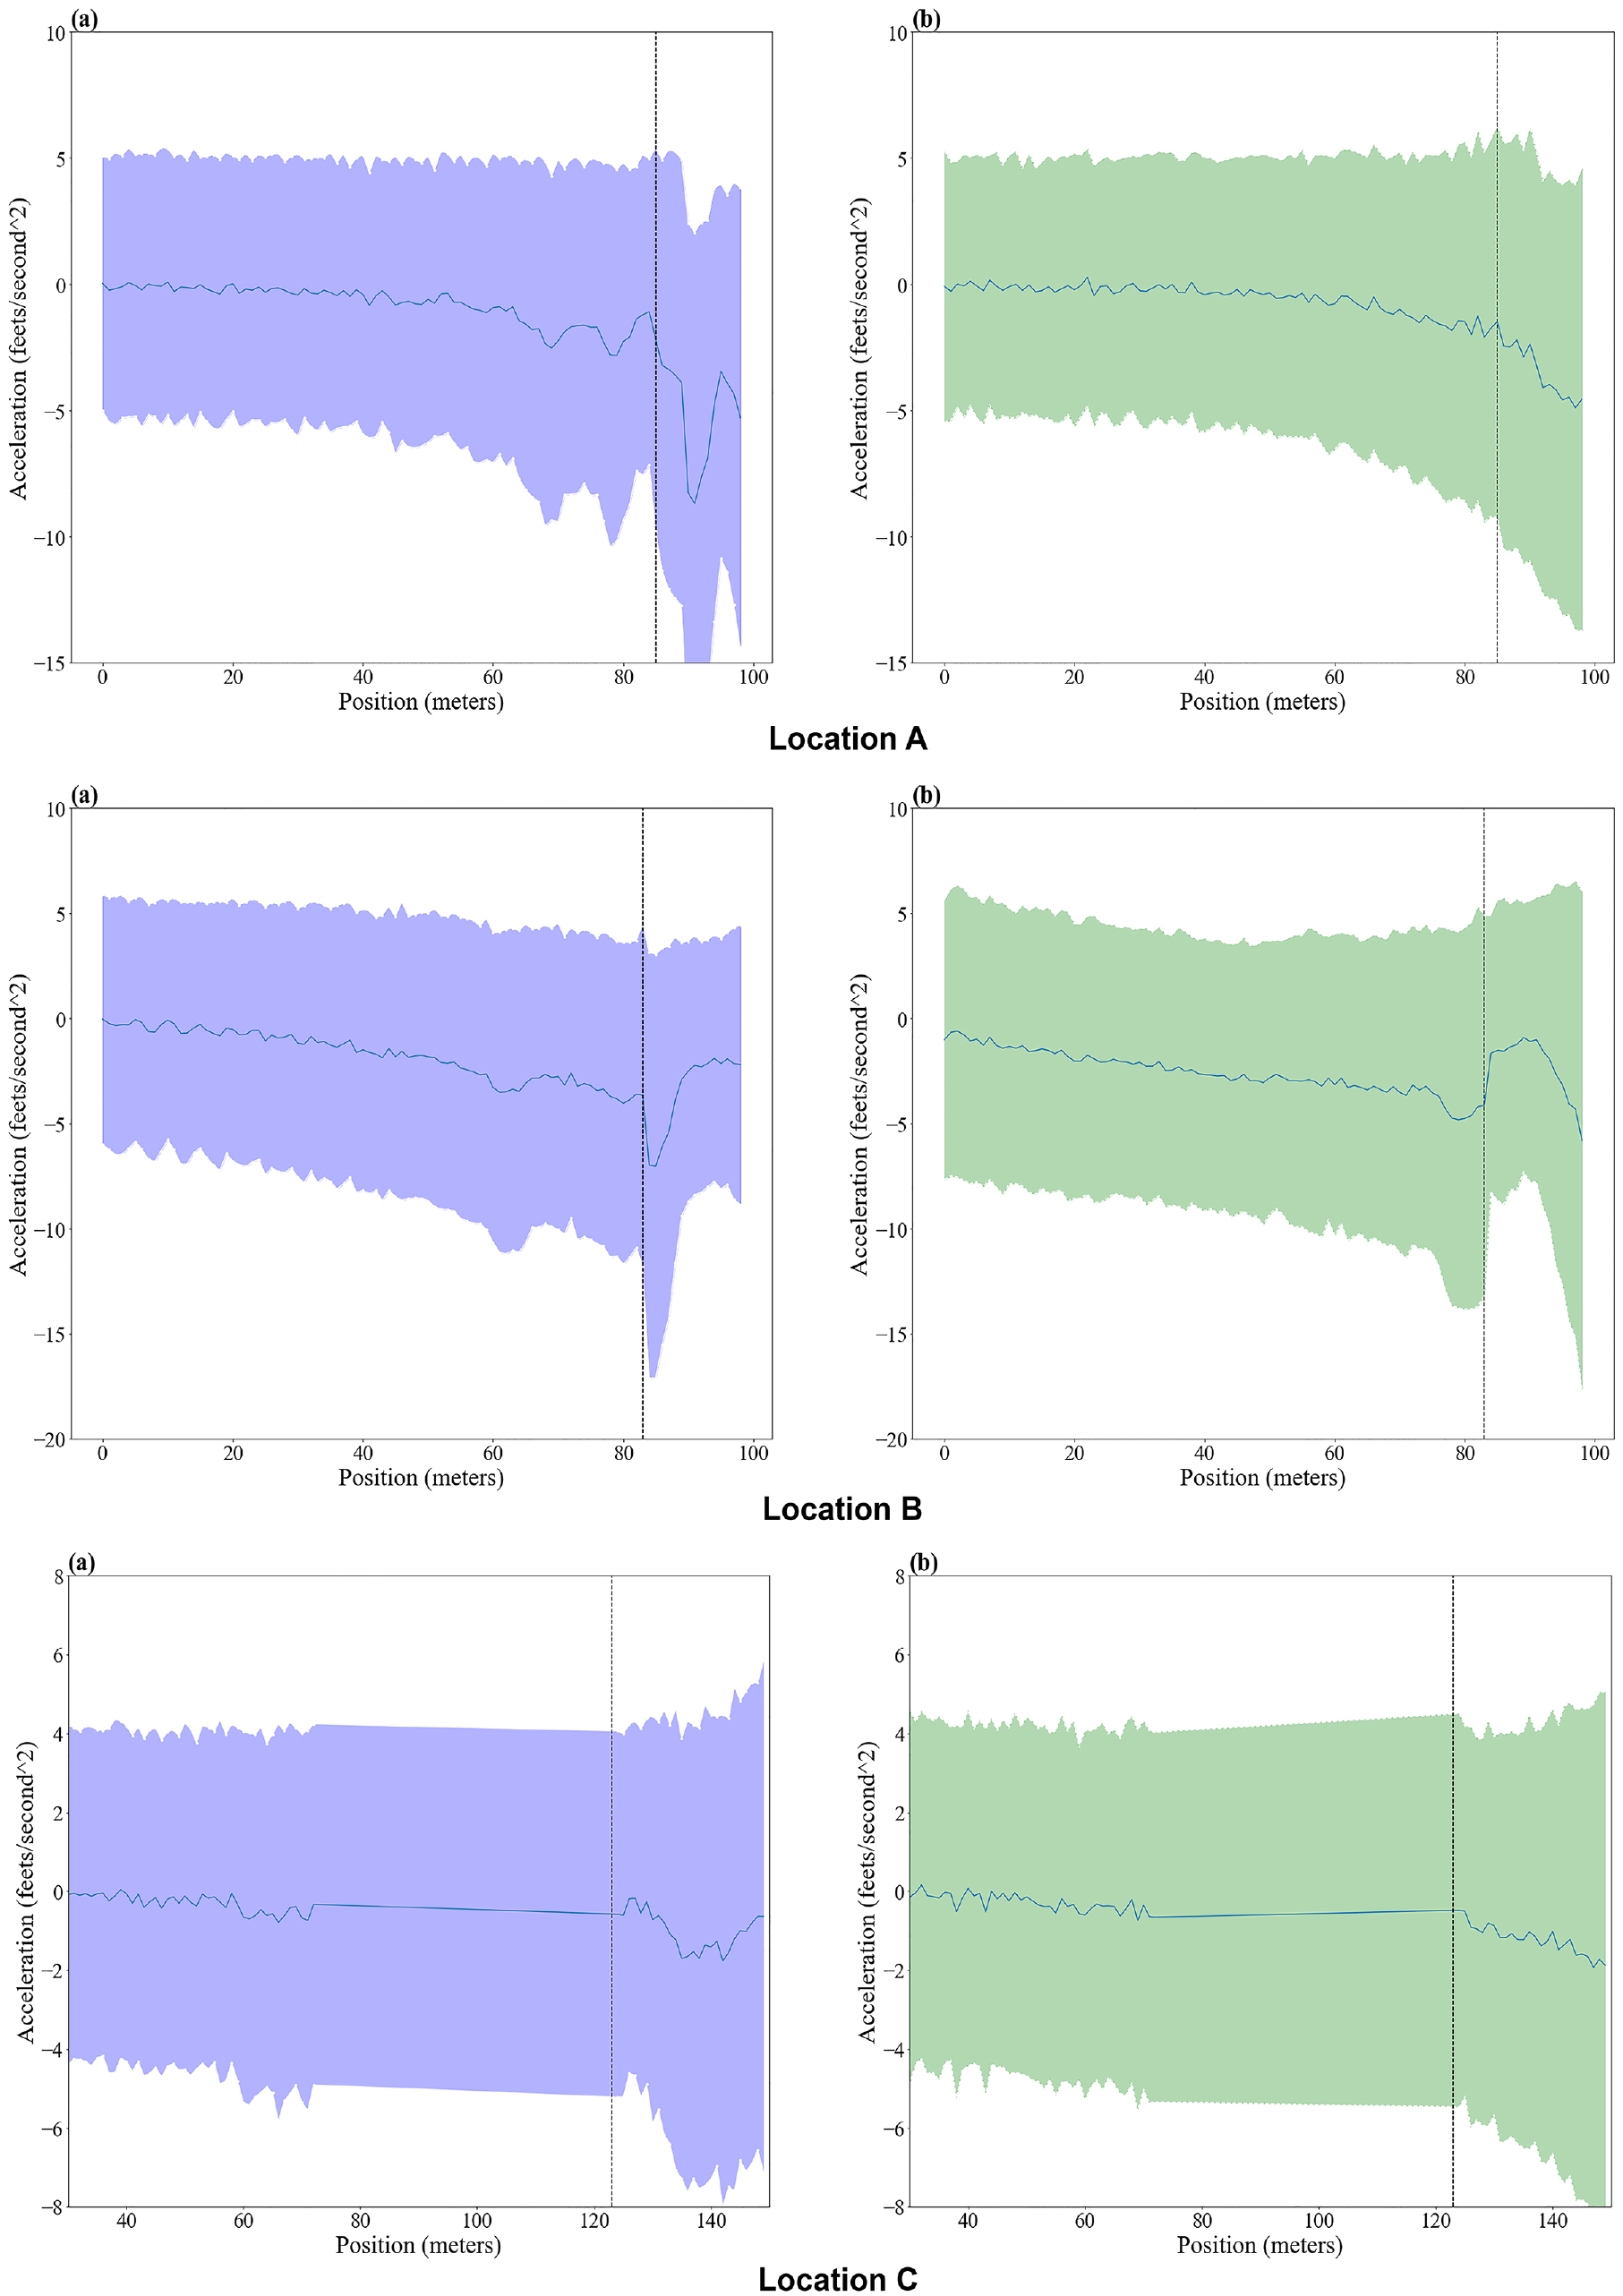
Acceleration trajectory at major approaches: (a) artificial neural network-based model and (b) calibrated model.
However, further visual verification of the simulation runs revealed some vehicles at the yield-controlled approaches accepting unrealistically small gaps when moving in the inside circle lanes (e.g., movements 1 and 4 in Figure 2) when faced with major vehicles approaching in the outside lane of the major approaches (e.g., movements 2 and 6 in Figure 2). As their paths do not intersect in such circumstances, SUMO does not enforce deceleration for the major vehicles, as evidenced from Figures 3 and 4. Further analysis of accepted gap values at the selected intersections was deemed necessary to understand what percent of minor vehicles exhibit such behavior. Figure 5 shows the frequency plots of accepted gaps from the ANN-based and the calibrated SUMO models compared with the observed values. The distributions of accepted gaps shown in these figures verify the findings of the visual verifications of the simulation runs. For instance, at Location B, the calibrated SUMO results show that 22.4% of minor vehicles accepted gaps that are less than 2 s, compared to 7.2% in the field observations. When accepted gaps of less than 6 s are considered, the cumulative percent of minor vehicles in the calibrated SUMO model is 78.6 at Location B, while the observed cumulative percentage is 57.4%. Similarly, at Location C, the percent of minor vehicles accepting gaps that are less than 2 s is 24.3% in the calibrated SUMO results compared to 5.6% in the field observations. When gaps less of than 6 s are examined, the cumulative percent of minor vehicles in the calibrated SUMO is 65.5% compared to 55.5% in the field data. Figure 5 indicates a better overall fit of accepted gaps by the ANN-based model. It can be concluded that the advantages of the ANN-based model lie not only in the accuracy of the selected output variables in comparison to the observed field values, but also in the realistic vehicle crossings at these uncontrolled junctions.

Comparison of accepted gap histograms for the artificial neural network (ANN)-based and calibrated SUMO models.
Conclusions
Intersections, specifically roundabouts, are important traffic facilities that can affect the overall performance of a traffic network. Gap acceptance is one of the influential driver decisions that affect the safety and operational performance of an intersection. Analytical and simulation-based methods are two ways of analyzing gap acceptance behavior at intersections. Simulation-based methods are more popular because they can be used to estimate the impact not only at the roundabout but also in the surrounding network, therefore providing a more comprehensive impact analysis of various safety and operational measures. However, a valuable simulation model requires an extensive and accurate calibration and validation process to reproduce real-world traffic conditions. Most underlying models embedded in simulation packages may not be generalized to specific locations. Therefore, it is often necessary to replace the underlying default models to match the location-specific conditions data using the API features of the simulation packages.
In this paper, the feasibility of an ANN-based gap acceptance model was evaluated and compared with the default SUMO model with calibrated parameters based on the minor vehicles’ wait time and traffic flow at the major and minor approaches. An ANN-based gap acceptance model was implemented in SUMO using its API capability. The Collingwood Circle in New Jersey was used as a case study with the corresponding gap acceptance data to train the proposed ANN model. Three intersections at the circle were chosen, two yield-control and one stop-control intersections, as they have critical impact on the performance of roundabout. These models were incorporated in SUMO using the TraCI.
The analysis results showed that both the calibrated SUMO and ANN-based models produced satisfactory results compared to those observed in the field. One exception was the unrealistically low accepted gaps at yield-controlled intersections in the calibrated SUMO model, which was related to the way in which SUMO implements gap rejection decisions. That is, minor vehicles are allowed to cross the intersection when the paths of major and minor vehicles are not expected to cross. This is a similar case when a vehicle moving in the inside lane is faced with an approaching major vehicle moving in the outside lane. Field observations did not support this behavior, as minor vehicles are wary of leaving the intersection even when the major vehicle is traveling in the outside lane. Between 22.4% and 24.3% of the vehicles at these intersections accepted gaps smaller than 2 s in the calibrated SUMO, compared to between 5.6% and 7.2% observed in the field data. It should be noted that this behavior did not affect the overall wait time averages in the calibrated SUMO model. Therefore, while the analysis results suggest that a calibrated SUMO model with a default gap acceptance model can be used to analyze various operational strategies at roundabouts and circles, a more realistic gap acceptance model should be used when, for example, surrogate safety measures need to be extracted from the model for comparing different safety measures at these facilities.
Footnotes
Author Contributions
The authors confirm contribution to the paper as follows: study conception and design: M. Bagheri, B. Bartin; data collection: B. Bartin, K. Ozbay; analysis and interpretation of results: M. Bagheri, B. Bartin; draft manuscript preparation: M. Bagheri, B. Bartin, K. Ozbay. All authors reviewed the results and approved the final version of the manuscript.
Declaration of Conflicting Interests
The author(s) declared no potential conflicts of interest with respect to the research, authorship, and/or publication of this article.
Funding
The author(s) disclosed receipt of the following financial support for the research, authorship, and/or publication of this article: The study is supported by Ozyegin University and partially by C2SMART, a Tier 1 UTC at New York University funded by the USDOT.
The contents of this paper only reflect the views of the authors, who are responsible for the facts, and do not represent any official views of any sponsoring organizations or agencies.