
Abstract
The aim of this study is to assess whether railroad operational performance indictors translate into service quality. We achieved this by using the nonparametric Mann-Whitney test to compare grain shippers’ perceptions of rail service with a pooled cross-section of survey data between 2008 and 2018 in North Dakota, U.S., involving six service dimensions: marketing and sales, timely delivery of equipment, car ordering alternatives/process, condition of equipment, availability of order information, and access to marketing personnel. The analysis is undertaken with an underlying assumption that shippers’ expectations about rail service are low. Results indicate that differences in freight rail service quality can be better explained by differences between railroads compared to differences within railroads over time. Gaps exist between shippers’ expectations and perceptions of freight rail service. It appears that some freight railroads have been able to exceed shippers’ service expectations by providing higher freight service quality than would be expected. Results suggest that the service quality of a shortline freight railroad is affected by its affiliated Class I freight railroad when comparing service quality as perceived by shortline freight railroad shippers. Although operational performance indicators including dwell time and train speed are frequently used to reflect service quality because of the dearth of knowledge about rail freight service quality, these operational performance indicators do not necessarily reflect service quality. The quality of freight rail service should be based on shippers’ perception or the gap between shippers’ perceptions and expectations.
Keywords
An efficient freight transportation system that facilitates the movement of goods and services domestically and to ports for export is critical to U.S. competitiveness and economic vitality. The system consists of several modes, including rail, truck, and waterways. According to the Bureau of Transportation Statistics of the U.S. Department of Transportation in 2018, the transportation system moved an average of about 51 million tons of freight daily with an estimated annual value of $52 billion ( 1 ). On average, rail represented about 9% of the tonnage and 3% of the value of all commodities transported by all modes between 2014 and 2018 ( 1 ).
Unreliable and unpredictable rail service has adverse economic effects—including the loss of revenue—on shippers, carriers, and other supply chain participants. Shippers in the U.S. rural Midwest and Great Plains regions have historically complained about rail services, including railcar availability, shortage, and lack of shipment information ( 2 ). Many shippers in the region that are limited to rail and truck access are often described as “captive” partly because of actual or perceived lack of intermodal or intramodal competition and longer distances from the closest barge facilities or waterways that directly compete with rail ( 2 ). In fact, service complaints from shippers in the Great Plains region partly played a role in the 1887 formation of the Interstate Commerce Commission (ICC) that regulated the freight railroad industry until deregulation in 1980 ( 3 ). The Surface Transportation Board (STB) replaced the ICC in 1995.
Railroads are less inclined to undertake the necessary investments to provide high quality service in a freight market with limited transportation options where railroads dominate traffic ( 4 ). An argument could be made that shippers’ expectations about rail service in such a freight market are low ( 2 , 4 ). Shippers historically have low expectations or underestimate the quality of rail service ( 5 ). Furthermore, the level or quality of service provided by a transportation carrier is reliant on the carrier’s perception of the shipper’s expectations ( 6 ).
On the other hand, it is reasonable to argue that railroad service innovation in the post-deregulatory Staggers Rail Act (SRA) era has transformed rail freight transportation in a manner that has positively influenced shippers’ views so much that their perception of rail service is higher than would be expected despite reported service disruptions. The argument could also be made that railroads have been quick to address problem areas to enhance the level or quality of service provided to shippers. It was reported at the end of 2014 that a $400 million project to upgrade track and sidings to improve service was completed by a major Class I freight railroad operating in North Dakota ( 7 ). In 2019, Class I freight railroads were those with $943.9 million or more in revenues, while Class II are those earning $42.4.63 million or more in revenues but less than the Class I revenue threshold. Class III are those earning less than the Class II threshold of $42.4 million according to the STB. Both Class II and Class III are generally referred to as “shortline” railroads. Recent evidence has shown the linkage between shippers’ choice of rail and higher perception of rail service quality ( 4 ). Service quality reflects the quantitative and qualitative factors with respect to the requirements and expectations of a shipper ( 8 ).
Despite service disruptions and changes in rail freight services facilitated by innovation, few studies have explicitly examined service quality in rail freight transportation. Indicators that are often used to facilitate assessment of some aspects of rail service quality include terminal or origin dwell time and train speed. However, these indicators are often a reflection of operational performance or network efficiency rather than quality of service ( 2 ). The principal aim of this study is to examine if operational performance or network efficiency indictors translate into service quality as perceived by shippers. To do this, we compare grain shippers’ perceptions of the quality of service provided by freight railroads. Specifically, we examine freight railroad service quality for six service dimensions: marketing and sales, timely delivery of equipment, car ordering alternatives/process, condition of equipment, availability of order information, and access to marketing personnel. The service quality evaluation is done by comparing freight rail service quality for two Class I freight railroads before and after the rail service challenges experienced in 2013–2014 and between Class I and shortline freight railroads for all six service dimensions. The 2013–2014 period saw rail service challenges that included substantial delays in railcar delivery and rail shipments for grain shippers originating in the Great Plains region. These delays, which had ripple effects on other commodities and shippers nationally, renewed concerns about rail service in general, and specifically in markets limited to rail and truck transportation.
Our analysis is undertaken with the assumption that shippers’ expectations about service are low ( 2 , 4 ). We test hypotheses about shippers’ perceptions of rail service quality using the nonparametric Mann-Whitney tests with a unique pooled cross-section from a survey conducted annually eliciting shippers’ views of rail freight service in North Dakota between 2008 and 2018. Survey respondents represent a cross-section of bulk grain shippers. Results from this paper will provide management insights to freight railroads on areas requiring improvement, as well as identify the likely dichotomy between the level or quality of service perceived by shippers and that which is expected or provided by railroads. One way this divide can arise is if market participants, including shippers, have a better understanding of the functionality of the market compared with that perceived by the public or non-market participants. For example, the railcar allocation process, via the secondary railcar market, is not widely understood ( 9 ). Results overall will also provide insights on whether improvements in key operational performance or network efficiency indicators translate into superior quality of service as perceived by shippers. These are all critical in the framing of freight transportation policy.
This paper proceeds as follows: the next section provides background on rail freight service quality followed by a discussion of service innovation in freight rail transportation. The methodology including research hypotheses are then presented, followed by description of the data. The statistical analysis results are presented next. We conclude by discussing implications for shippers, railroads, and policymakers.
Rail Freight Service Quality Literature
Modes of transportation have different service attributes that influence shippers’ expectations and perceptions. For example, the need for an access point limits the ability for rail and barge to provide door-to-door services, a feature that shippers expect from trucks. Moreover, rail and barge benefit from economies of shipment size and distance, resulting in a cost advantage over truck in transporting bulk commodities. The level or quality of service perceived or expected by shippers is, to an extent, reliant on modal attributes. Service quality in freight transportation represents the spectrum of service dimensions, both quantitative and qualitative, ranging from transit time, level of service, dependability, and good customer service ( 8 ).
The foregoing suggests that service quality from the shippers’ perspective is driven by other factors beyond quantitative determinants, and includes qualitative factors such as perception. For example, differences in customer service may cause two shippers located in the same vicinity to view the same level of service provided by different carriers differently. Owing to its consideration in the mode selection process, service quality in rail freight transportation is often examined within the mode choice context ( 3 , 8 ). Others used gap analysis to explore differences between shippers’ expectations and perceptions of transportation services ( 6 ).
A recent study estimated a transportation cost function using data on individual grain shipments from the U.S. Great Plains region to examine whether shippers’ choice of rail or truck is based on observable market prices, or whether service quality consideration causes a deviation from such choices ( 4 ). Results indicated that shippers use rail more than they would if their decision was based on minimizing total transportation cost, revealing their choice of rail stems from a perception of higher quality of service. Annual grain shipper surveys showing improvement in shippers’ perception of rail service were used in support of results ( 4 ). The analysis in this study utilizes a pooled cross-section of the disaggregated data from this annual survey from the Upper Great Plains Transportation Institute (UGPTI) ( 10 ). Conceptual economic engineering-based models showed improvements in freight rail quality of service reflected in quicker delivery of grain shipments from North Dakota attributed to shuttles rail services ( 11 ).
Both qualitative and quantitative approaches involving in-depth interviews and econometric models have been used to examine factors that influence freight mode choice in the U.S. ( 8 ). Results showed that the need for high-quality service and a negative perception of rail leads shippers to prefer truck over rail. Apart from rates, increasing reliability, which reflects both transit time and its variability, was more important to shippers than reducing transit time ( 8 ).
Previous research used a modified version of the gap model to evaluate service quality in the U.S. transportation industry ( 6 ). The gap model was intended to identify discrepancies between shippers’ expectations and perceptions of freight carrier services using a survey of shippers and carriers of air, truck, rail, and sea freight. Results of hypothesis testing showed that gaps existed between shippers’ expectations and perceptions of freight transportation services ( 6 ). Gaps were attributed to a host of reasons amongst which is carriers’ lack of understanding of shippers’ service quality expectations. Internal failures included carrier marketing and sales departments overpromising and failing to deliver on service promised to shippers ( 6 ).
Service Innovation in Rail Freight Transportation
The pricing freedom provided to railroads following deregulation has promoted technological innovation with implications on the quality of service provided to shippers. While benefits, including rate reduction, were predictable, an unpredictable and significant outcome of deregulation was improvements in service quality ( 12 ). Freight railroads have spent more than $740 billion in capital expenditure and maintenance to enhance service since 1980, according to the Association of American Railroads ( 13 ).
Despite observations of improvements, accrued benefits associated with deregulation have been realized to a lesser extent by shippers in regions with few transportation options, such as those in the U.S. Great Plains, compared with shippers in more competitive freight markets ( 14 ). Most innovations in rail freight transportation were aimed at bulk commodities such as grain and coal ( 15 ). Specifically, adoption of shuttle train services, institution of railcar allocation instruments, and shortline railroads are major innovations that have resulted in improved service in grain shipping ( 16 ). Shuttle services involve the use of dedicated single-commodity trains of 100 or more railcars that cycle between a single origin and a destination. They are perceived as more efficient, offer lower rates to shippers, and provide better service quality than all other rail services including unit rail, multi-car, and single-car services ( 4 , 11 , 17 ). These advantages stem from the reduced need for decoupling of locomotives and railcars at rail yards as is necessary with other rail services ( 11 , 18 ).
Another service innovation adopted by some Class I railroads is precision schedule railroading (PSR). In contrast to dedicated services provided by shuttle rail services, PSR emphasizes the use of general purpose or manifest trains that transport a mixture of traffic in a single train of 150 railcars long, in some instances. Except for Burlington Northern Santa Fe (BNSF) which has only recently adopted some PSR principles including limited switching, six of the other Class I freight railroads have adopted PSR. Canadian Pacific (CP) and Canadian National (CN) were the earliest adopters of PSR ( 19 , 20 ). Two of the outcomes of PSR implementation are the marked improvements in key operational performance or network efficiency indicators including reduction in terminal dwell time and increased train speeds ( 19 , 20 ). Better performing terminals or lower terminal dwell times lead to an efficient railroad network and improved service reliability ( 21 ). Higher or increased average train speed are common measures of operational performance or network efficiency ( 21 ). Table 1 shows estimated average terminal dwell time in hours for the 10 highest volume classification terminals for each railroad and train speed in miles per hour for grain, coal, and manifest trains by Class I freight railroad for 3-year intervals between 2014 and 2022 based on data from the STB.
Terminal Dwell Time and Train Speed for Class I Freight Railroads, 2014–2022
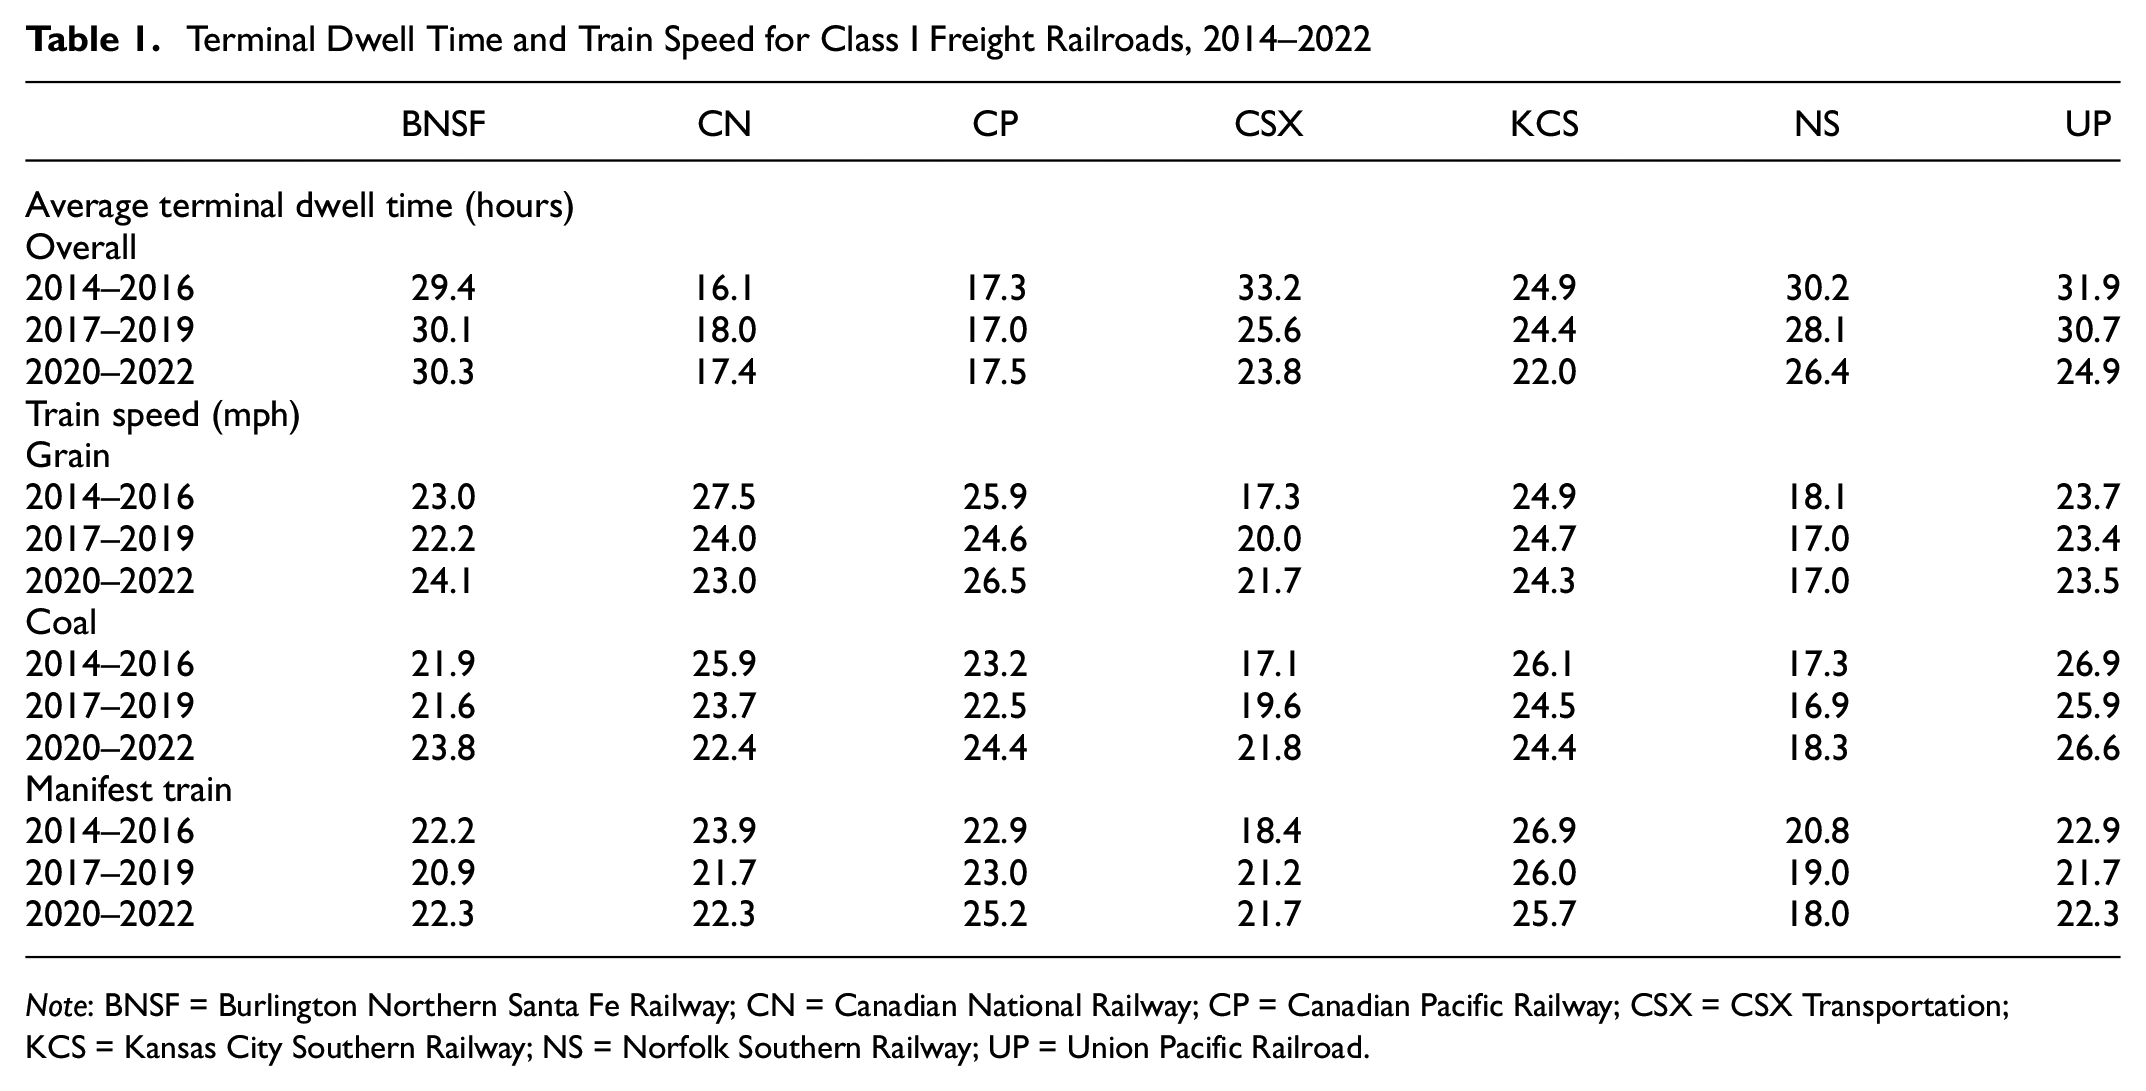
Note: BNSF = Burlington Northern Santa Fe Railway; CN = Canadian National Railway; CP = Canadian Pacific Railway; CSX = CSX Transportation; KCS = Kansas City Southern Railway; NS = Norfolk Southern Railway; UP = Union Pacific Railroad.
The 2020–2022 interval in Table 1 encompasses Covid-19 pandemic disruptions, while the other two are the pre-pandemic periods. Overall, CP and CN had the lowest terminal dwell in comparing all three intervals. Average terminal dwell time in hours shows a declining trend from the pre-pandemic to the post-pandemic period, except for BNSF, CN, and CP that exhibit increases in terminal dwell time. Although CP witnessed a 1% increase in terminal dwell time between the 2014–2016 and 2020–2021 periods, CP’s average terminal dwell times are notably lower than those for BNSF. Train speed in miles per hour varies widely between Class I freight railroads and by commodity type. There is no consistent pattern in train speed between the pre-pandemic and the post-pandemic periods. A few of the Class I freight railroads and commodities witnessed an increase in train speed, while others saw a decline. For example, grain train speeds for BNSF and CP in general are higher than coal and manifest trains for all corresponding periods. However, CP train speeds are generally higher than those for BNSF across all three train types. This raises the question of whether these differences in operational performance portend differences in the quality of rail service from the shippers’ perspective.
Strategies for railcar allocation have evolved from the first-come, first-served basis during the pre-SRA era to forward guaranteed services post-SRA ( 22 ). Before SRA, the absence of demurrage charges led to inflated orders from shippers attempting to secure railcars ( 22 ). This complicated planning, with subsequent misallocation, led to deterioration in service ( 22 ). Forward guaranteed services that included demurrage charges discouraged inflated or phantom orders ( 22 ). These changes eventually led to the development of the primary and secondary markets that represent a market-oriented process for optimal railcar allocation that assigns priorities among differentiated shippers, enhancing service ( 9 ). The primary market is the railroads’ initial allocation of trains to individual shippers, while the secondary market represents a transaction where a shipper with a primary railcar instrument sells it directly or through a third-party to another shipper ( 9 ).
Another strategy adopted by Class I freight railroads is the abandonment, sale, or lease of unprofitable branch lines ( 23 ). This spurred the growth of the shortline railroad industry. While the Class I freight railroad industry has become more concentrated, with seven rail carriers presently, compared with more than 40 in the early 1980s, the number of shortline railroads carriers doubled from 220 before the SRA to 562 after. At the same time, miles of track operated rose from 8,000 miles pre-SRA to 47,500 miles between 1980 and 2017, providing rail services to many rural shippers that would have otherwise lost access ( 24 – 26 ). Shortline railroads provide gathering services that channel railcars onto main lines operated by Class I railroads, reducing operational cost and enhancing services to shippers ( 22 , 26 ).
Methods
Transportation Service Quality Model
The model depicted in Figure 1 shows a modified version of a gap model developed to evaluate service quality and service quality gaps in the transportation industry ( 6 ). A shipper’s expectation about transportation service is influenced by word of mouth, past experiences, and the needs of the organization or shippers. Gaps illustrate discrepancies in service expectations and perceptions in shipper, carrier, and shipper-carrier interactions.

Model of transportation service quality.
This paper is specifically concerned with the fifth gap, Gap 5 (shown by the dotted circle in Figure 1) which shows that a significant discrepancy exists between shippers’ expectations of service quality and their perceptions of the quality of service received. This discrepancy relates to some of the direct and indirect adverse effects associated with Gap 1 to Gap 4 on the carrier side. Gaps can inhibit the offering of a level of service that shippers view as high-quality service ( 6 , 27 ).
The first gap, Gap 1, shows the level of discrepancy between a shipper’s expectations about service and a carrier’s perceptions of the shipper’s service expectations ( 5 ). Some have argued that business practices associated with PSR force shippers to adapt to a carrier rather than the carrier providing services that shippers need ( 19 , 20 ). The ensuing mismatch would lead to a breakdown or a further widening of Gap 1, reflected in poor service provision by the carrier. Gap 2 and Gap 3 reflect a measure of the difference between the carrier’s understanding of what the shipper wants and the level of service delivered, while Gap 4 shows the difference between the level of service a carrier delivers and external communication from the carrier to the shipper. External communication includes the level of service promised by a carrier’s marketing and sales department to a shipper, among other factors.
Gap 4 is caused by two main factors: a lack of horizontal communication or a communication breakdown between sales and operations personnel, and a tendency for marketing personnel to overpromise or make promises to shippers that will not be met ( 6 ). For example, shippers were promised and led to understand that PSR implementation would help reduce the size of their fleet with lower costs from fewer operating leases ( 28 ). However, with promised benefits from PSR not materializing, some shippers had to add railcars to their fleet to compensate for poor service ( 28 ).
Because shippers’ expectations about rail service quality are assumed to be low in this freight market, a finding that shippers’ perception of rail service is high, average, or more than average would suggest the existence of a gap like Gap 5 in Figure 1. This would also suggest that railroads have been able to provide a better level or quality of service than widely reported. On the other hand, a finding of lower-than-average perception would suggest that there is no significant discrepancy between shippers’ expectations and perception of service. Differences in service would suggest that key rail operation indicators do not reflect service quality.
Research Hypotheses
Shippers’ perceptions of services provided by a freight transportation carrier can be characterized in three ways ( 29 ). High quality service represents a case where a shipper’s perceived quality of service is greater than expected. Acceptable service quality occurs when perceived quality is equal to that which is expected, while bad service quality occurs when perceived service quality is lower than a shipper’s expectation ( 29 ).
Shippers’ perceptions of rail service quality are likely to deteriorate with major service incidences like those related to the 2013–2014 service challenges. We should therefore observe a significant difference in shippers’ perception of rail service quality before and after the 2013–2014 period. If shipper perceptions of rail service quality are significantly higher after the rail challenges compared with before, or if their perceptions are higher in either period than their assumed low expectations, that would suggest the existence of a gap. This will further suggest that railroads have been able to improve service quality. We therefore hypothesize that:
Railroads offer a variety of services under different business practices to accommodate the variability in shippers’ characteristics and needs. The effect of these business practices could influence shippers’ perception of the quality of service provided by a rail carrier. For example, CP uses PRS that involves an extensive use of general-purpose or manifest trains, whereas BNSF relies on dedicated trains to move bulk commodities. Consequently, shippers’ perceptions of rail services potentially vary by railroad.
Railroad services such as shuttles run on mainlines operated by Class I railroads. The gathering services that feed railcars into mainlines are operated by shortline railroads. Shortline railroads also originate and terminate freight, often within states, for relatively short hauls. Therefore, shippers’ perceptions of rail services would differ between Class I railroads such as BNSF, and CP between shortline railroads such as Red River Valley and Western (RRVW) and Northern Plains Railroad (NPR), as well as between both types of railroads. Given that shortline railroads often act as independent affiliates to Class I freight railroads, it is likely that the business practices of a Class I freight railroad will have a spillover effect on the shortline affiliate. Shortline freight railroads depend on Class I freight railroads for rolling stock, including freight cars, to effectively provide services. In fact, historically, one of the concerns expressed by shortline freight railroads in their relationship with Class I affiliates is the inadequate supply of freight cars, especially during seasonal shortages ( 30 ). Therefore, we hypothesized that:
Statistical Test
For our analysis, we use the nonparametric Mann-Whitney test—an alternative to the parametric independent t-test. This procedure, proposed by Mann and Whitney, tests the null hypothesis of equal population location parameters ( 31 ). Unlike similar procedures such as the Wilcoxon test which consider only the cases of equal samples, Mann and Whitney proposed the test to deal with the case of unequal sample sizes ( 31 ). The Mann-Whitney test has the following five underlying assumptions:
The data consist of two random samples of observations
The two samples are independent.
The observed variable is a continuous random variable.
The measurement scale is ordinal.
The distribution functions of both populations are different only with respect to location.
The two-sided form of the hypothesis for the Mann-Whitney-Wilcoxon test is shown in Equations 1 and 2 and the test statistics in Equation 3:


where
S = the sum of the ranks of the sample observation from population 1.
We reject
Rail Freight Market and Grain Shipper Profile
The North Dakota rail freight transportation market is comprised of two Class I freight railroads: BNSF and CP, and four shortline freight railroads: Dakota Missouri Valley and Western Railroad (DMWV); Dakota Northern Railroad (DNR); RRVW; and NPR. According to the North Dakota Department of Transportation (NDDOT), there are 3,481 freight railroad miles in North Dakota ( 32 ). Both Class I freight railroads operate about 63% of the overall mileage, with BNSF accounting for about 75% of Class I freight railroad mileage and about 47% of the overall mileage. About 17% of the overall mileage is operated by RRVW, which represents the second most mileage behind BNSF.
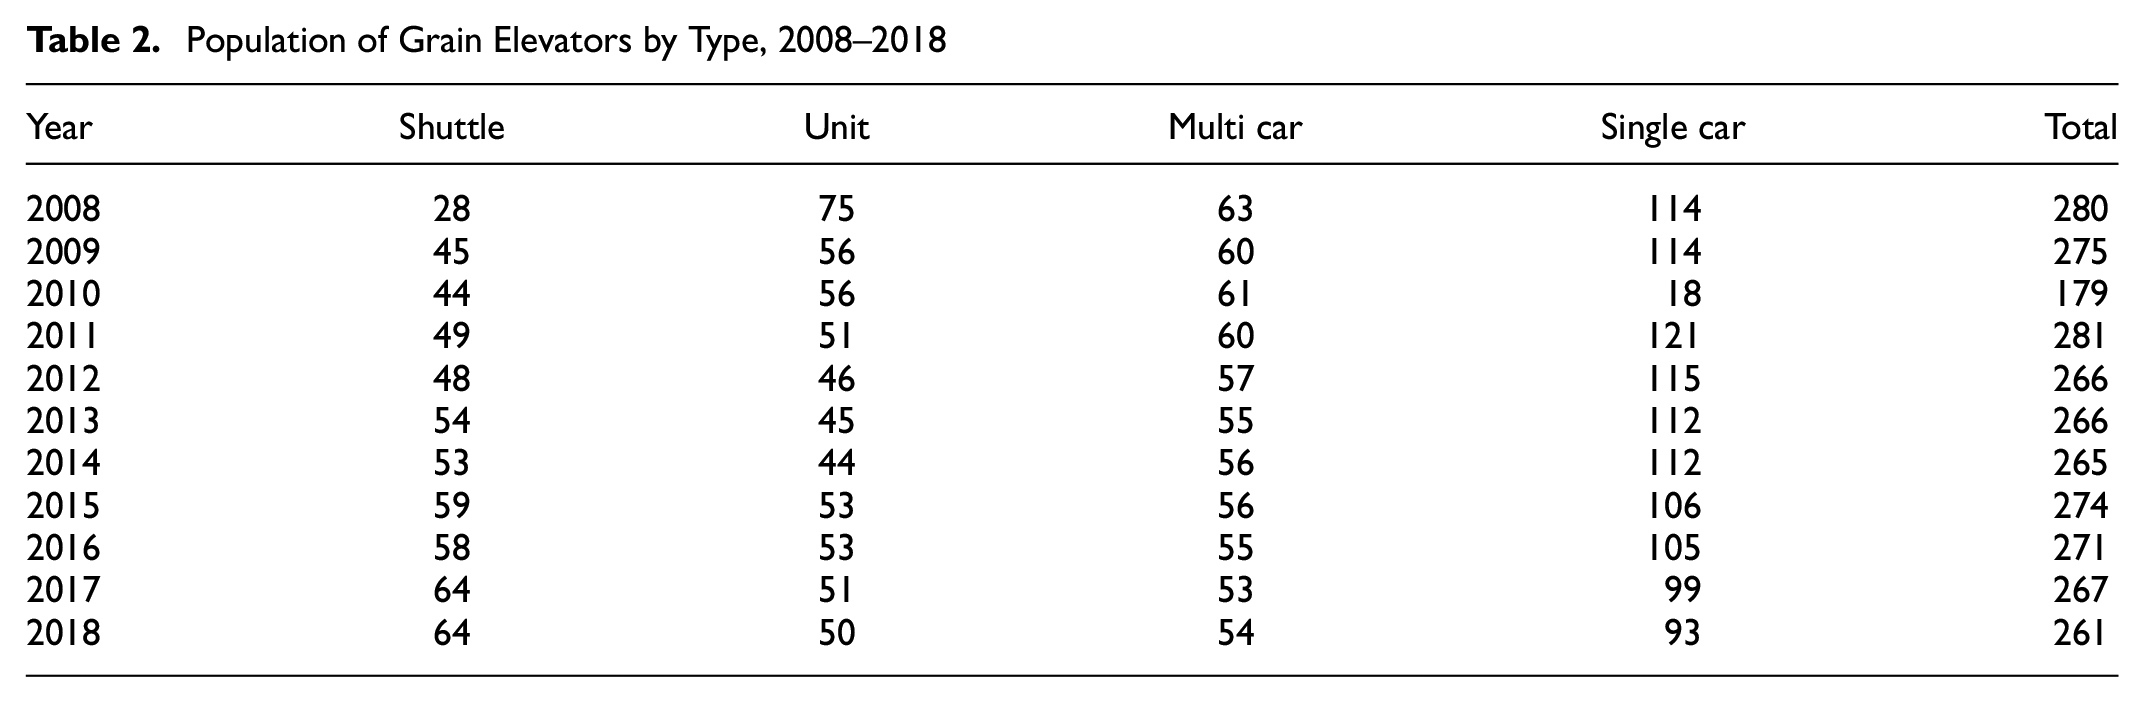
Freight railroads provide four types of rail services according to the sidetrack capacity of a grain elevator, which is based on the number of freight cars a grain elevator can assemble for loading without switching. Single-car grain elevators have the track space to load 1–24 railcars, while multi-car grain elevators have the sidetrack space to assemble 25–49 freight cars for loading. Unit and shuttle grain elevators have sidetrack lengths to accommodate and load 50–99 freight cars and 100 or more freight cars, respectively. According to NDDOT, a shuttle grain elevator capable of handling 110 freight cars requires a total sidetrack length of more than 7,000 ft to handle freight cars, associated locomotive power, and extra clearance ( 33 ).
The number of grain elevators by type has changed over the years as the wave of network consolidation persists among Class I freight railroads, with an increasing emphasis placed on larger-capacity elevators. Consolidation in the grain logistics market is an attempt by Class I freight railroads to reduce operational costs. Longer trains benefit from economies of shipment size which fosters reduction in operational cost associated with transporting bulk commodities such as grain. Rail carriers transfer some of the lower operational cost benefits to shippers in the form of lower shipping rates. Railroads provide discounts and incentives to shuttle grain elevator shippers. In addition to comparatively lower rail rates relative to other types of grain elevators, shuttle grain facilities have contributed to improving the quality of rail services provided to grain shippers in North Dakota, a freight market perceived as captive in theory ( 4 , 18 ). These shippers often pay higher rates and receive inferior service compared with shippers in competitive markets or those that have access to the full range of freight transportation options.
The benefits associated with shuttle grain elevators have driven shippers to upgrade or build new grain elevator facilities capable of generating longer trains. Consequently, the number of shuttle grain elevators has risen during the study period. The emphasis on larger-capacity grain elevators has led to a decline in the number of other types of grain elevators. Table 2 shows the existing population of grain elevators by type between 2008 and 2018 according to data from UGPTI ( 10 ).
Population of Grain Elevators by Type, 2008–2018
Data
The data used in this study were obtained from UGPTI at North Dakota State University. The data represent independent samples collected from an annual stated preference survey of grain elevator shippers. The survey elicits shipper perceptions of six rail service dimensions. The questions and service dimensions in the survey were developed originally and scripted with the input of small- and medium-sized enterprise businesses and grain elevator managers.
These service dimensions are associated with determinants of service quality: tangibility (marketing and sales and condition of equipment), reliability and credibility (timely delivery of equipment), communication (availability of order information and car ordering alternatives or process), and access and responsiveness (access to marketing personnel). “Marketing and sales” and “condition of equipment” broadly reflect the physical evidence of the railroad providing services. “Marketing and sales” show the different types of services offered and the commodities that a rail carrier is capable of transporting. “Timely delivery of equipment” reflects the trustworthiness and credibility of the carrier. “Availability of order information” and “car ordering process” show how the railroad keeps shippers informed as well as addressing their concerns. “Access to marketing personnel” points to the ease with which shippers can contact the railroad marketing and sales department personnel to address shippers’ inquiries.
Shipper perceptions are for service provided by two Class I railroads: BNSF and CP, and two shortline railroads: RRVW and NPR. The perceptions questions are based on a 5-point ordinal Likert scale: 1 (poor), 2 (below average), 3 (average), 4 (good), and 5 (excellent). Surveys were mailed to registered grain elevators in North Dakota for rail services provided the previous year. Table 3 shows the response rate for the 10-year period 2008–2018 used in this study.
Survey Response Rate over Time

A pooled cross-section between 2008 and 2018 was used because of confidentiality limiting access to individual shipper information. Respondents include shippers served by BNSF, CP, RRVW, and NPR. Despite the concealment of individual shipper characteristics, a unique aspect of the dataset is having shipper perceptions of rail service over time. Responses in the survey are used to generate weighted service ratings for rail service published annually ( 10 ).
Descriptive Statistics
Table 4 shows descriptive statistics including the mode for all six service dimensions by railroad. “Mode” reflects shipper perceptions with the highest frequencies. Among Class I freight railroads, a general observation is that more shippers ranked BNSF services as being at the median or above the median, whereas most of CP’s ratings were poor or below the median except for the car ordering process which was viewed as at the median by most shippers. For shortline railroads, most shippers perceived their services to be average or excellent. Shippers ranked two of RRVW’s service dimensions associated with marketing as excellent.
Descriptive Statistics

Note: 1 = poor; 2 = below average; 3 = average; 4 = good; 5 = excellent; BNSF = Burlington Northern Santa Fe; CP = Canadian Pacific; NPR = Northern Plains Railroad; RRVW = Red River Valley and Western.
Statistical Diagnostic Tests
Before our formal analysis, we perform statistical diagnostic tests for internal consistency and normality. We tested internal consistency of survey questions using the Cronbach’s alpha or tau-equivalent reliability test. Internally consistency reflects how closely related the service dimension questions are as a group. An estimated reliability coefficient greater than 0.7 confirms internal consistency. Normality was tested using the Shapiro-Wilk test. The null hypothesis for the Shapiro-Wilk test is that the variable is normally distributed. These tests were conducted before the nonparametric Mann-Whitney test was performed.
Mann-Whitney Test Results
Table 5 shows results for the first hypothesis which examines potential differences in shippers’ perceptions of freight rail service quality for BNSF for each of the six service dimensions before and after the 2013–2014 service disruptions with 2013 as the break point. The Cronbach’s alpha value of 0.817 indicates that the service dimension questions for BNSF are closely related as a group, affirming internal consistency. The Shapiro-Wilk test statistics, W and p-values, Pr < W shows that the null hypothesis of normality was rejected at the 1% level of significance for all six service dimension comparisons. The p-value for the Mann-Whitney test, Pr > |Z| comparing shippers’ perception of BNSF service quality shows that there is no statistically significant difference at the 5% level of significance for five of the six service dimensions before and after 2013. One of the service dimensions—the condition of equipment—was significantly different at the 1% level of statistical significance. The calculated coefficient of determination,
Mann-Whitney Test—Burlington Northern Santa Fe Service Quality Comparison before and after 2013
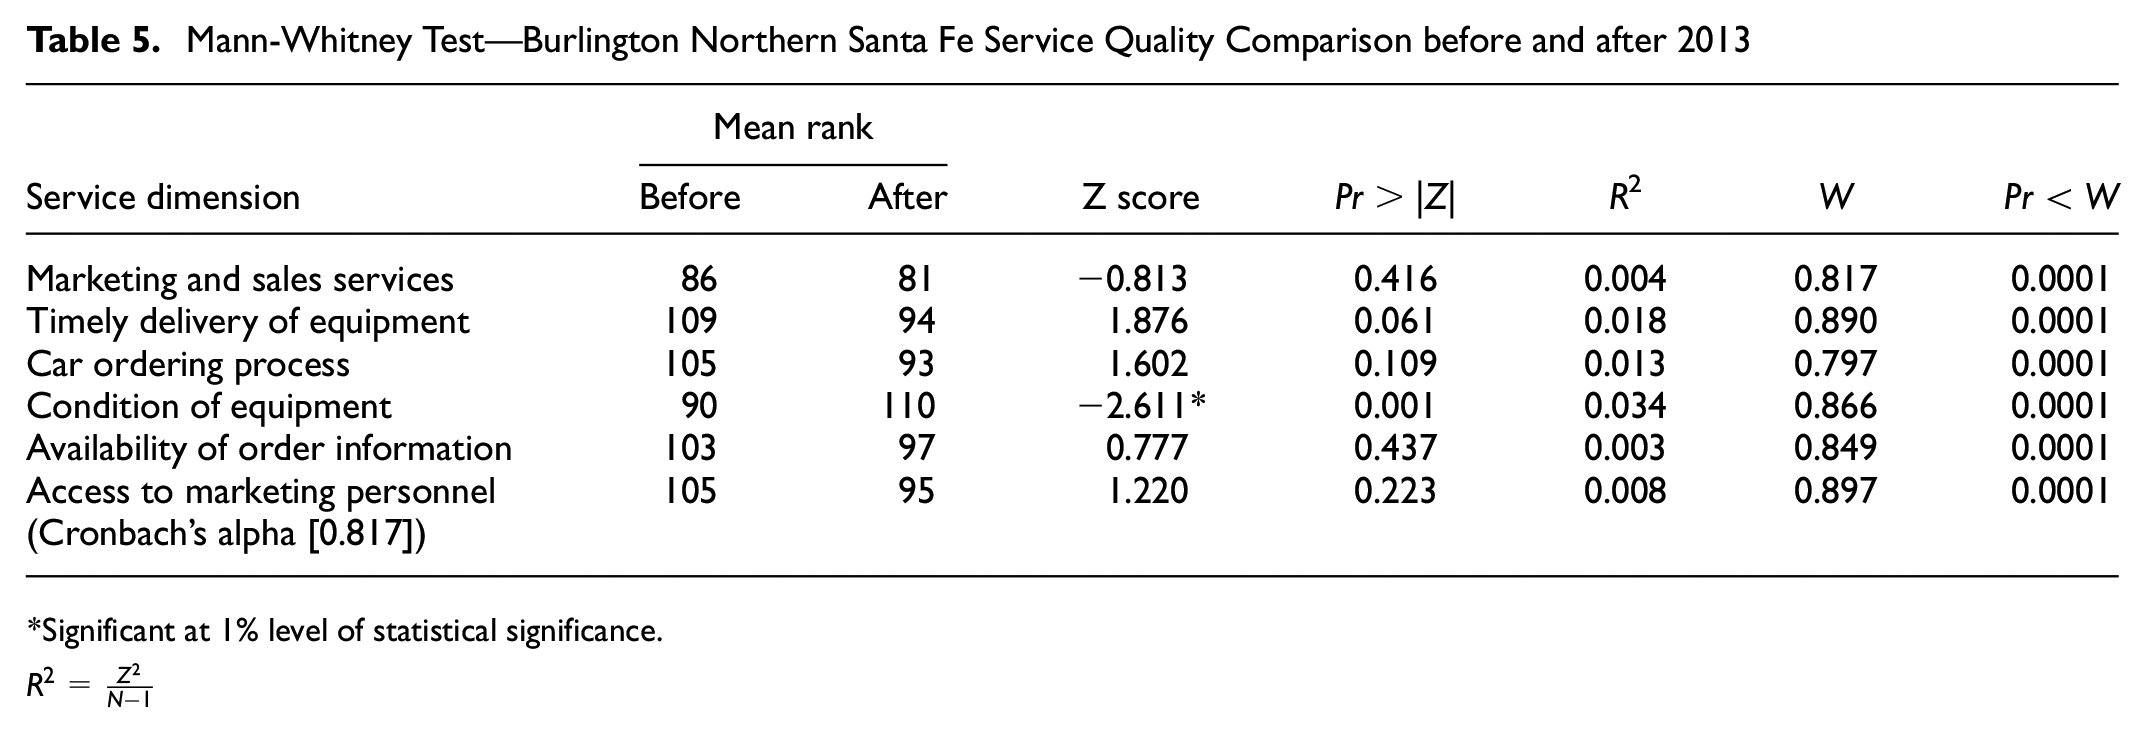
Significant at 1% level of statistical significance.
Table 6 similarly shows results for the first hypothesis to determine whether CP shippers’ perceptions of rail service quality for each of the six service dimensions are different before and after 2013. The reliability coefficient of 0.864 shows that all service dimensions are internally consistent, while normality is rejected at the 1% level of significance in all service dimension comparisons based on the p-value of the Shapiro Wilk test, Pr < W. The p-value for the Mann-Whitney test, Pr > |Z| indicates that five out of the six service dimensions are statically insignificant at the 5% level of significance when comparing services before and after 2013. Access to marketing personnel was statistically significantly different from zero at the 5% level of significance when comparing the before- and after-2013 periods. The mean ranks suggest that shippers’ perception related to the access to marketing personnel service dimension improved after 2013. Based on the
Mann-Whitney Test—Canadian Pacific Service Quality Comparison before and after 2013
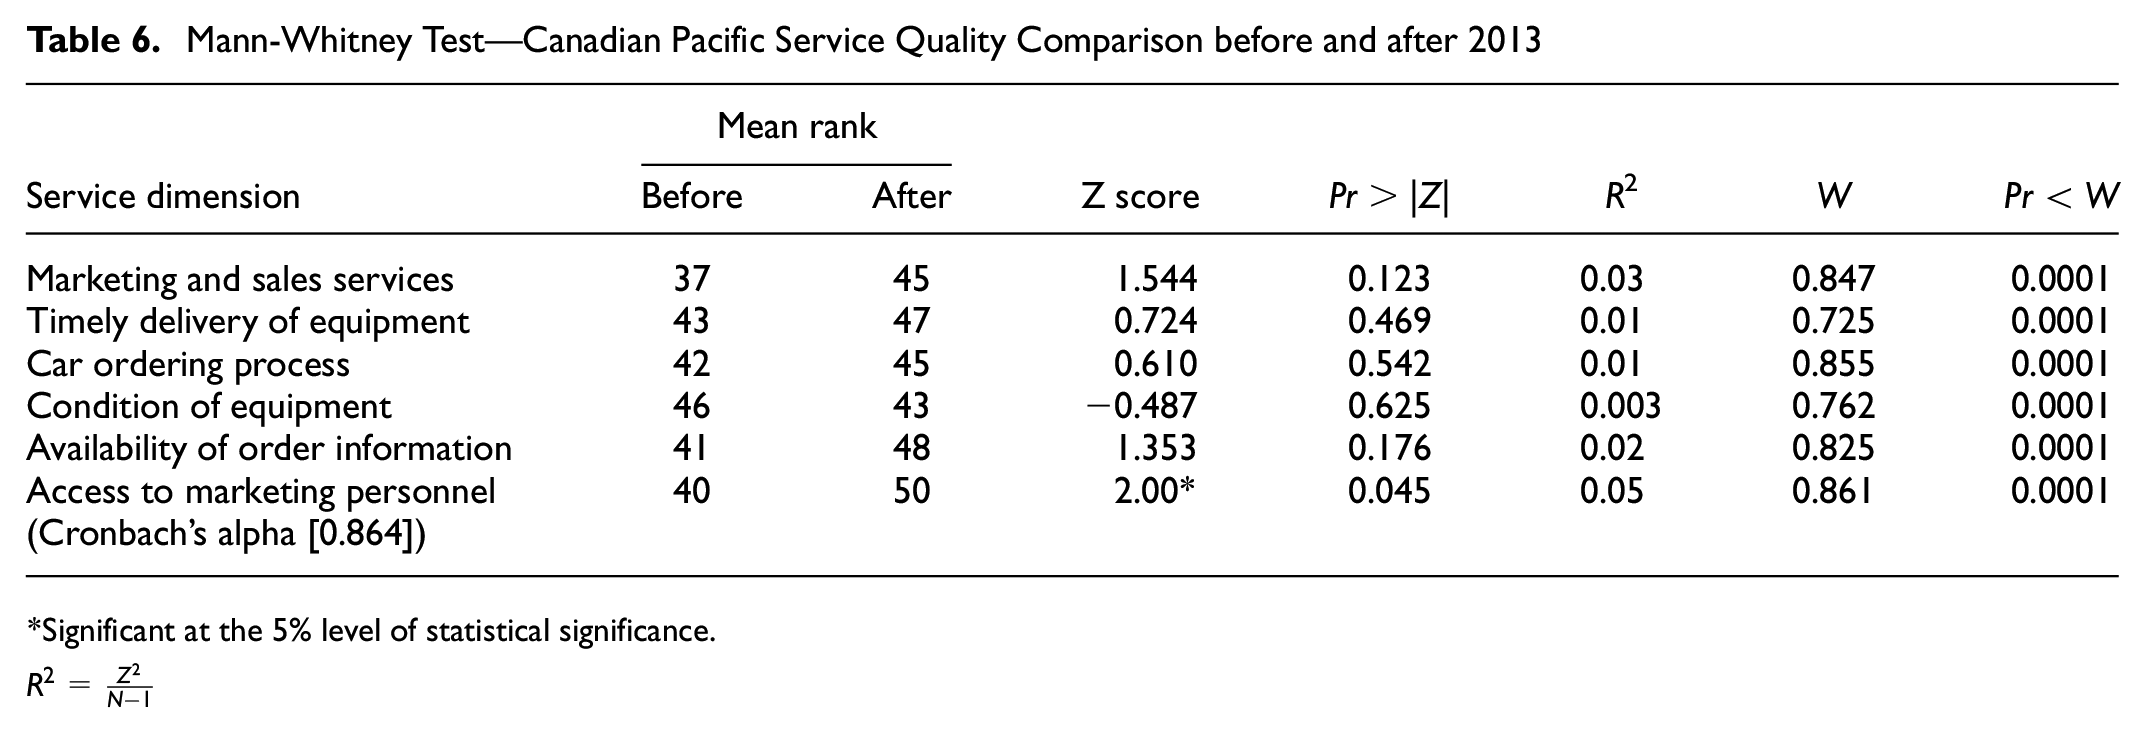
Significant at the 5% level of statistical significance.
Results from Tables 5 and 6 suggest that time, or the before- and after-2013 treatment, only explains a small percentage of the difference in service quality within individual Class I freight railroads over time as perceived by shippers. For the second hypothesis, we examine potential differences in shippers’ perceptions of service quality for each of the six service dimensions between the two Class 1 freight railroads. Results from the comparisons are shown in Table 7. All six service dimensions are statistically different at the 1% level of statistical significance between BNSF and CP. Results indicate that BNSF provides higher service quality for all six service dimensions compared with CP, based on the mean ranks. Also note that a higher proportion of the variation in service quality can be explained by differences between the two Class I freight railroads compared with differences within railroads before and after 2013 based on the calculated
Mann-Whitney test—Burlington Northern Santa Fe (BNSF) and Canadian Pacific (CP) Service Quality Comparison

Significant at the 1% level of statistical significance.
For the third hypothesis, we examine likely differences in shippers’ perceptions of service quality for each of the six service dimensions between the two shortline freight railroads, RRVW and NPR. Table 8 shows results for the Mann-Whitney test. Results indicate that there is a significant difference in service quality between RRVW and NPR for all six service dimensions based on mean ranks. About 20%, and at most 42%, of the differences in service quality for access to marketing personnel and availability of order information, respectively, can be explained by the difference between RRVW and NPR. Results further suggest that, similarly, a higher proportion of the variation in service quality is accounted for by differences in railroads relative to the comparison over time.
Mann-Whitney Test— Red River Valley and Western (RRVW) and Northern Plains Railroad (NPR) Service Quality Comparison
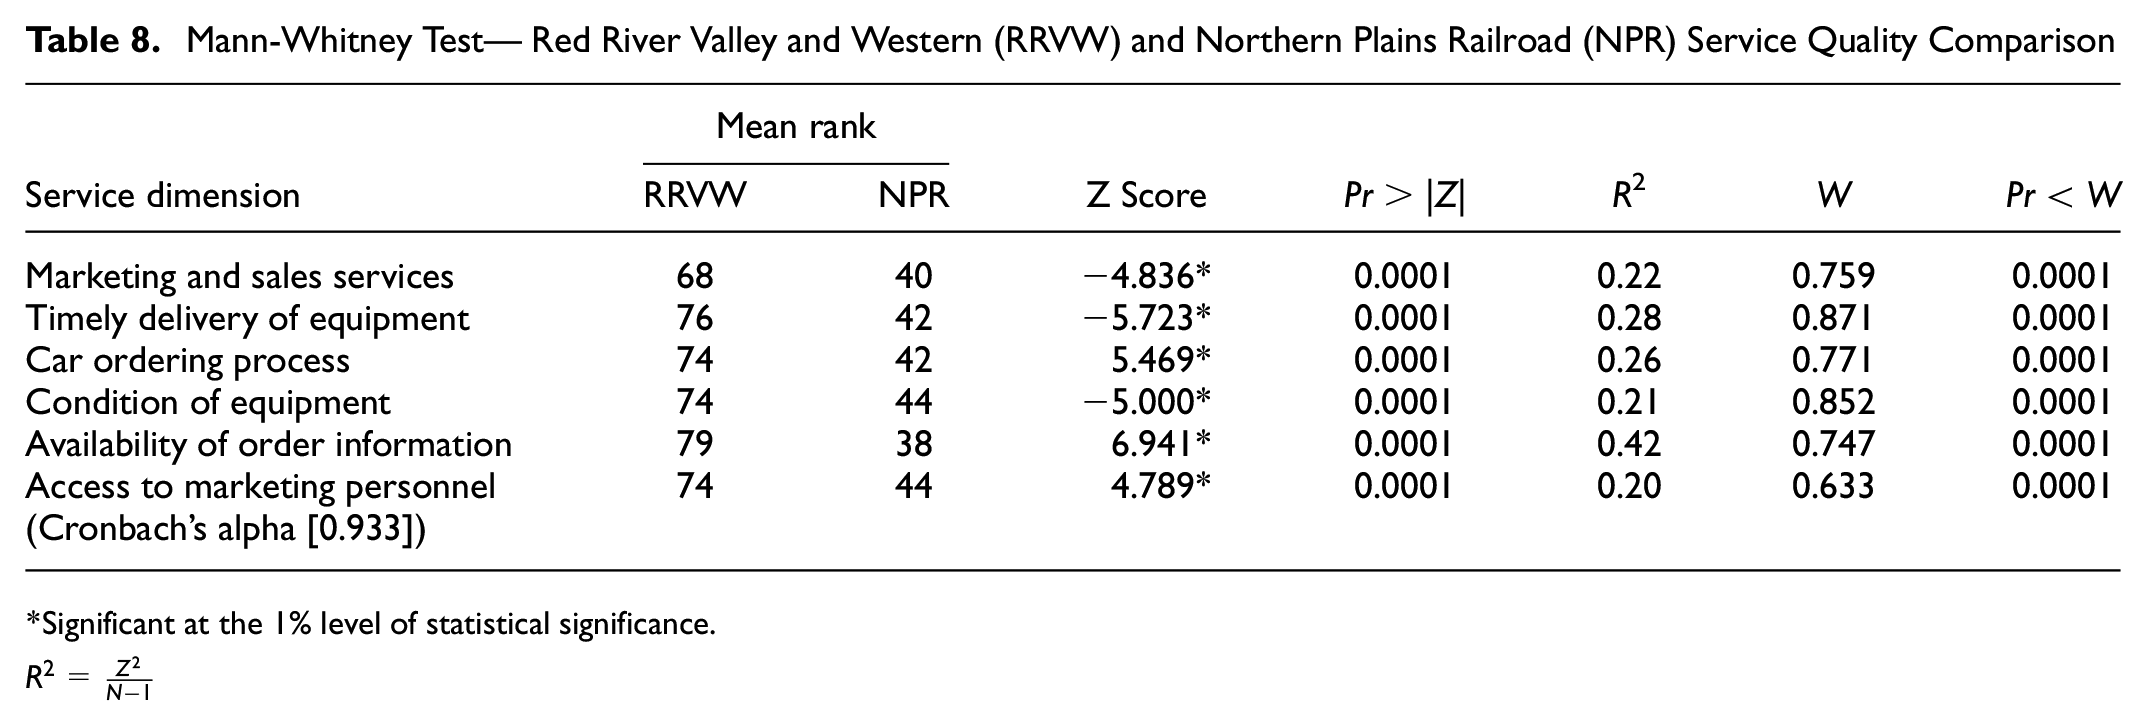
Significant at the 1% level of statistical significance.
Given that RRVW and NPR are independent affiliates of BNSF and CP, respectively, it could be that the service or service quality of a shortline railroad is affected by the operational practices of its affiliated Class I freight railroad when comparing shortline freight railroad service quality as perceived by shippers. Recall that shortline freight railroads depend on their affiliated Class I freight railroad for rolling stock including freight cars. Shippers perceived BNSF to provide a significantly higher service quality compared with CP which could be reflected in the way RRVW’s services are perceived relative to those of NPR.
The fourth hypothesis compares service quality between Class I and shortline freight railroads. As mentioned previously, shortline railroads provide short-haul services including originating and terminating freight in local markets, often within state boundaries. Table 9 shows the Mann-Whitney test results for the comparison. Results show that there is a statistically significant difference at the 1% level of significance for five out of six service dimensions. Condition of equipment is the only dimension that shippers view similarly for both classes of freight railroads. Results show that shortline freight railroads are perceived to provide comparatively higher service quality relative to Class I freight railroads based on mean ranks.
Mann-Whitney Test—Class I and Shortline Service Quality Comparison
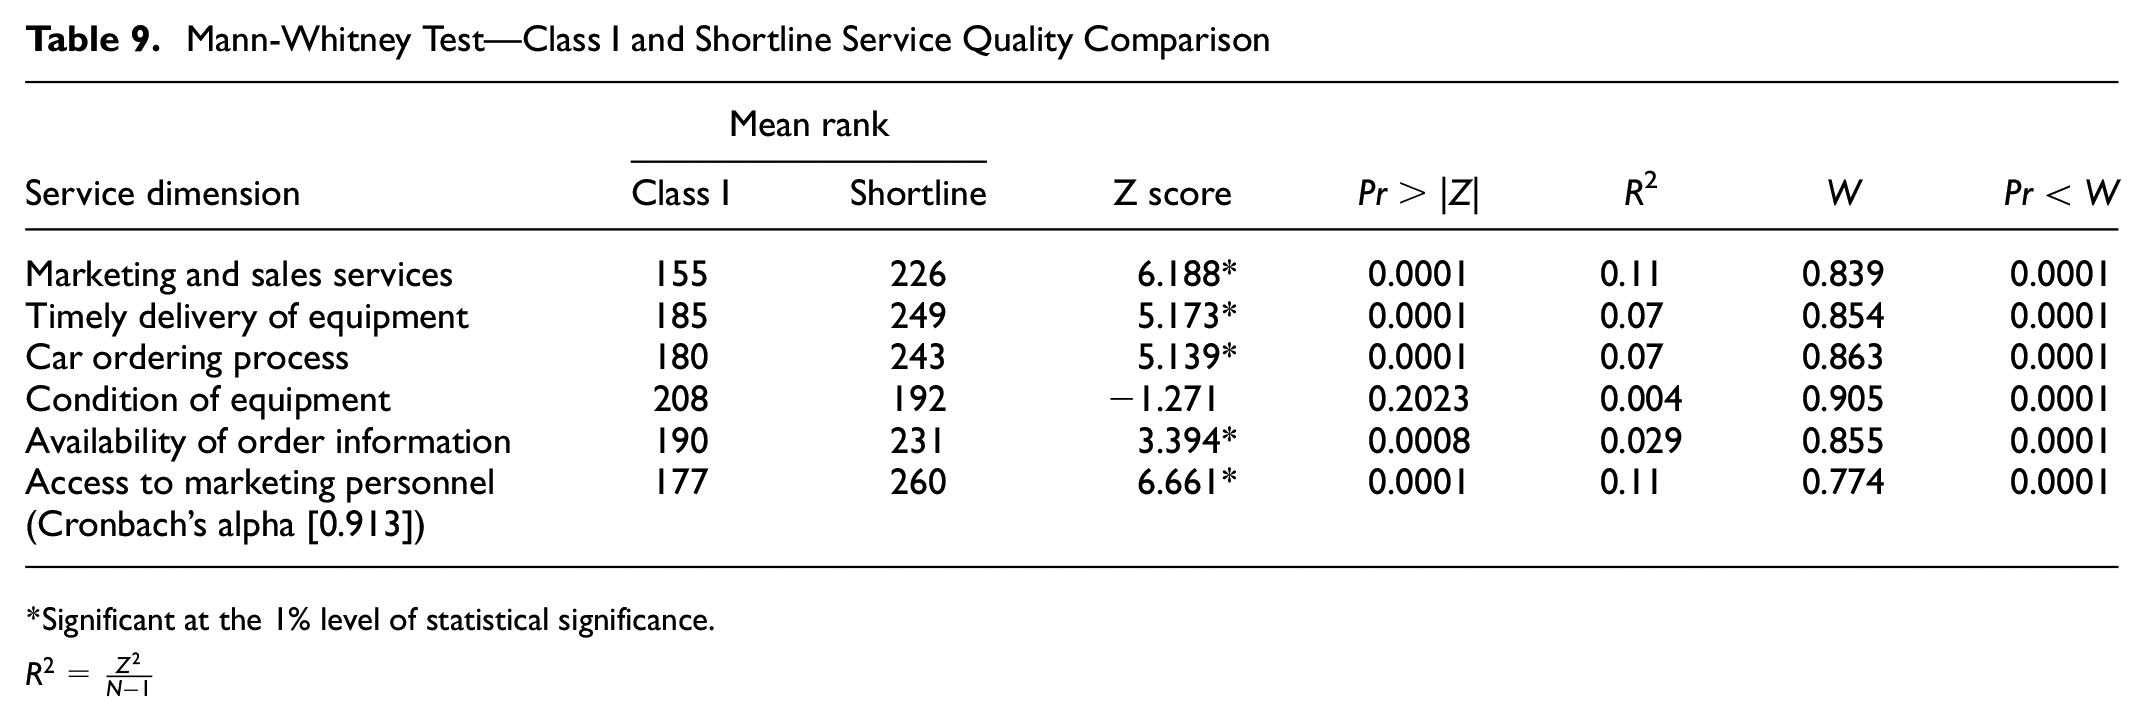
Significant at the 1% level of statistical significance.
Contrary to comparison between railroads in similar classes in Tables 7 and 8, results in Table 9 suggest that service quality difference between Class I and shortline freight railroads explain a relatively lower proportion of the difference in service quality when comparing different classes of railroads, as reflected in the comparatively lower
Discussion and Conclusion
The pricing freedoms provided to railroads by the 1980 SRA and competitive pressures from other modes have fostered innovation in the U.S. freight railroad industry. The resulting productivity gains from innovation have led to declining costs for freight railroads. While rate reductions and improvements in service have been reported as benefits to shippers, recently reported deteriorations in service have called into question the quality of freight railroad services. For example, during the 2013–2014 period, rail service delays in railcar delivery to North Dakota grain shippers caused disruptions and deterioration in freight rail services throughout the U.S. Most recently, shippers’ service complaints associated with supply chain disruptions from the Covid-19 pandemic have brought further attention to and raised concerns about the quality of freight rail services. In response to an April 2022 hearing on freight rail delays, STB chairman Martin Oberman noted that the initial railroad service improvement plans to address Covid-19 pandemic-related service disruptions have not been effective in improving services to shippers ( 28 ).
While service issues persist, there is lack of information and studies on freight rail service quality ( 4 ). Some have argued that widely known measures used to assess service or some aspects of service quality, such as dwell time and train speed reflect operational or network efficiency rather than service quality ( 2 ). The aim of this study is to examine if freight railroad operational performance indictors translate into service quality as perceived by grain shippers in the U.S. Northern Plains. We make this determination by comparing grain shippers’ perceptions of freight rail service quality in North Dakota. The comparison was undertaken using the nonparametric Mann-Whitney test with an underlying assumption that shippers’ expectations about rail service quality are low. This assumption was based on two factors. Shippers in freight markets with limited transportation options, often described as captive, have historically complained about the quality of rail services ( 2 , 3 , 17 ). Furthermore, historical evidence suggests that shippers often underestimate the quality of rail service ( 5 ).
For our analysis, we make use of a pooled cross-section of a stated preference survey data between 2008 and 2018 that involves bulk grain shipper perceptions of six rail service dimensions: marketing and sales, timely delivery of equipment, car ordering process, condition of equipment, availability of order information, and access to marketing personnel. We make comparisons to capture changes in shippers’ perceptions within railroads, over time, and between railroads. For the time component, we compare shippers’ perceptions of rail services for two Class I freight railroads: BNSF and CP, separately before and after 2013 to capture likely differences associated with the 2013–2014 rail service challenges. Service quality comparisons were done between Class I freight railroads, between shortline freight railroads, and between Class I and shortline freight railroads.
We use improvements in operational efficiency measures associated to PSR, a business practice adopted by some Class I freight railroads, to reduce cost and enhance operation to explore if improved or better measures of operational performance or efficiency reflect improved or higher rail freight service quality based on our analysis. That is, does the Class I freight railroad with better operational indicators provide better or higher service quality as perceived by shippers? One of the two Class I freight railroads in our sample, CP, was an early adopter of PSR, while BNSF is the only Class I freight railroad that is reported not to have adopted PSR but recently adopted some PSR principles, especially reducing the amount of switching associated with longer trains.
Results indicate that shippers’ perceptions of rail service quality, as reflected by the calculated coefficient of determination
Compared to BNSF, the findings in this study suggest that CP needs to improve services in all six service dimensions because CP’s service quality is as low as what shippers would expect or matches the a priori low expectation assumption. Although shippers perceived BNSF as providing comparatively higher service quality, there is still room for improvement. NPR needs to improve its services to at least match the services provided by RRVW. Results suggest that a Class I freight railroads’ performance directly affects the services provided by their affiliated shortline railroad. Shippers’ higher perception of service quality for line haul services provided by BNSF and local services provided by RRVW compared with the assumed low expectations suggests the existence of a potential discrepancy between the level of service quality perceived by shippers and that which is provided by some railroads. It appears some railroads have been able to provide higher-quality of service despite the recurrence of service issues. These findings need to be taken into account in framing policy to address service issues in rail freight transportation. Differences in shippers’ perception of service means inferior quality of service and associated disruptions need to be examined based on the type of service and for each specific railroad.
Overall, results suggest that operational performance or network efficiency indicators such as shorter average terminal dwell time and high train speed used to reflect service quality in the absence of better measures do not necessarily reflect freight rail service quality as perceived by shippers. The implementation of PSR has markedly improved operational performance for adopting railroads without necessarily improving the quality of service as perceived by shippers. In this study, BNSF, one of the major Classes I freight railroads, is viewed by shippers as providing higher service quality compared with CP, an early adopter of PSR. CP has shorter average terminal dwell times and higher speeds, all reflecting better operational performance than BNSF Gain freight rail shippers’ perception of better service quality for BNSF is potentially explained by the six service dimensions used in the study being closely related to the provision of rolling stock capacity including equipment and freight cars. Anecdotal evidence suggests that BNSF has been able to supply requested rolling stock with greater reliability than its competitor. Results are reflective of this idea.
While we do not attribute poor service quality to PSR implementation, STB may choose to evaluate the unintended consequences of innovation and other business practices that are aimed at improving the efficiency of the freight rail transportation system and services provided to shippers. Service quality should be based on shippers’ perception or the gap between shippers’ expectations and perception of the service offered by a rail carrier.
This study comes with limitations. The study scope is limited to grain freight rail shippers in one region using a state in the region for context. Additionally, shippers in sample are nonidentifiable because of confidentiality. Individual shipper characteristics (including location, asset or rolling stock ownership, and elevator capacity) would have facilitated a more disaggregated approach which could have improved the quality of our results. Also, the use of a single group of shippers, grain shippers in this case, could skew our results. This issue is likely mitigated by variation in railroad, railroad carrier class, and time. Further studies are needed to examine service quality in freight rail transportation, for example, comparing the perception for different groups of shippers and freight markets. An understanding of the functionality of the freight rail transportation system is vital in developing strategies to mitigate the impacts of supply chain disruptions. Recent disruptions brought by the Covid-19 global pandemic clearly elevate the need for better understanding.
Footnotes
Author Contributions
The authors confirm contribution to the paper as follows: study conception and design: E. Ndembe; data collection: K. Vachal; analysis and interpretation of results: E. Ndembe, draft manuscript preparation: E. Ndembe. All authors reviewed the results and approved the final version of the manuscript.
Declaration of Conflicting Interests
The author(s) declared no potential conflicts of interest with respect to the research, authorship, and/or publication of this article.
Funding
The author(s) received no financial support for the research, authorship, and/or publication of this article.