
Abstract
Using freight trains is a cost-effective and safe method for transporting numerous products over long distances. However, freight train derailments have significant consequences. Derailment severity, measured by the number of cars derailed per derailment, is an important risk factor. Based on prior literature and Federal Railroad Administration data, this research analyzes and estimates derailment severity of freight railroad transportation using a statistical method: the Truncated Geometric (TG) model. The methodology accounts for three train types: manifest train, loaded unit train, and empty unit train. Train length, speed, and gross tonnage per car are the input features, and the output variable is the number of cars derailed in a derailment incident. The TG model quantifies the influence of these factors contributing to derailment severity and estimates train derailment severity with a performance of the mean square error (MSE) of 68.91 and mean absolute error (MAE) of 6.05. When data outliers such as abnormally high or low severity are excluded, the MSE drops to 36.82 and the MAE drops to 4.22. Overall, the results indicate that the train derailment severity estimation performance based on the given factors is satisfactory. With all other factors being equal, a loaded unit train is likely to derail more cars than a manifest train and an empty unit train. When data outliers are excluded, there is no significant difference between manifest trains and empty unit trains as regards derailment severity, and both are less likely to derail than a loaded unit train.
Railroads are some of society’s most critical infrastructures for transporting goods across great distances. It is essential to manage and minimize railroad safety risks to avoid potentially massive loss of life and public property. Freight railroads account for about 40% of the United States’ long-distance freight volume, which is more than any other mode of transportation ( 1 ). In recent years, there have been several incidents of train derailments on freight railways, some of which were associated with hazardous material leaks. In October 2022, twenty tanker cars of paraffin wax from a 101-car train derailed in Sandusky, Ohio ( 2 ). In January 2023, sixteen total cars derailed from a train and two of them leaked chemicals in Keachi, Louisiana ( 3 ). In February 2023, a total of thirty-eight trains derailed in East Palestine, near the Ohio–Pennsylvania border, and eleven out of twenty tank cars carrying hazardous material subsequently ignited ( 4 ).
Unit trains and manifest trains are the two main types of freight trains in the U.S. Unit trains are designed to carry a single commodity, such as coal or grain, and are shipped from one shared origin to one destination. Unit trains are cost-effective and efficient because of reduced operating expenses, bulk loading, improved asset utilization, and cost savings through increased scale ( 5 – 9 ). Unit trains have been used to transport an increasing proportion of hazmat over the past two decades, and unit trains accounted for approximately 21% of hazmat carloads in 2018 ( 9 ). Manifest trains, as opposed to unit trains, are used for transporting a variety of goods and commodities and typically consist of different types of rail cars for multiple shippers ( 10 ).
According to train derailment data from the Federal Railroad Administration (FRA) rail equipment accident database, there were 2,669 unit train derailments and 5,931 manifest train derailments on mainlines from 1996 to 2021 ( 11 ). Zhang et al. conducted an empirical analysis of freight train derailment rates for unit trains and manifest trains using FRA mainline freight train derailment data for the years 1996 to 2018 and found that the weight and length of trains involved in derailments of unit trains are statistically larger than those of manifest trains ( 9 ). Additionally, the average number of cars derailed in unit trains and manifest trains was significantly different, with 11.3 and 7.6 cars derailed on average, respectively ( 9 ). Thus, the derailment risk and severity for manifest trains and unit trains are different.
Train derailment severity analysis is an essential part of hazmat transportation risk analysis. This report belongs to a broader study of the effects of train configuration on railroad hazmat transportation risk. Therefore, estimating the train derailment severity for two major trains and quantifying the relationship between train derailment severity and associated affecting factors are pivotal for comprehending risks associated with freight transportation, including hazardous material by rail, as well as for aiding the rail industry and government to develop, evaluate, prioritize, and implement cost-effective safety-enhancement strategies.
For a train derailment incident, the number of derailed cars is greater than or equal to one and less than or equal to the residual train length, including locomotives and railcars. In this paper, the number of derailed cars following a train derailment is used to measure the derailment severity. Previous studies focused on the probability of a train derailment and developed various methods to measure derailment severity ( 12 – 15 ). The truncated geometric (TG) model is one of the most mainstream and effective of these methods. The TG model can truncate the number of derailed cars starting from one and extending to the residual train length. Although previous research has focused on attributes such as residual train length, derailment speed, and loading factor, relatively few studies have investigated the derailment rates of unit trains and manifest trains on the mainlines of freight networks. There remains a lack of more fine-grained quantity analysis of derailment severity for different types of trains. In this research, we conduct a detailed exploratory data analysis of the most recent train accident data from the FRA and investigate and clarify the corresponding impact of train types and factors, including train length, gross tonnage, and train speed. Based on selected train derailment data from the FRA, the TG model is utilized to estimate derailment severity for different types of freight trains. There might be a significant difference between loaded unit trains, empty unit trains, and manifest trains in train length, gross tonnage, and train speed, which might inversely affect derailment severity. Ultimately, the relationship between train derailment severity and train types and related affecting factors can be quantified for the government and railroad industry to develop more cost-effective accident-prevention strategies.
Literature Review
Statistical models have been developed using historical accident data to estimate expected severity based on associated factors such as train speed, position of the derailment, and the proportion of loaded and empty cars within a train ( 12 – 15 ). These models are effective at estimating train derailment severity as well as identifying risk factors that influence train derailment severity.
For instance, Liu et al. developed zero-truncated negative binomial regression and quantile regression models to estimate the conditional mean of freight train derailment severity based on residual train length, derailment speed, and loading factor, using data from historical derailments on U.S. Class I railroad mainlines from 2001 to 2010 ( 12 ). Additionally, Saccomanno and El-Hage developed a TG model to estimate the mean number of cars derailed as a function of derailment speed, residual train length, and accident cause ( 16 , 17 ). Martey and Attoh-Okine developed a joint mixed copula-based model to estimate derailed cars and monetary damage, and conducted a combined analysis of their relationship with a set of covariates that might affect both outcomes ( 13 ). Martey and Attoh-Okine employed a vine copula quantile regression model, an interval estimation approach, to predict conditional mean and quantiles of derailment severity outcomes, considering derailment speed, residual length, loading factor, derailed cars, and monetary damage ( 14 ). Bagheri used a TG model to estimate the number of cars derailed per train derailment ( 18 ). Liu built a negative binomial regression model to estimate the number of cars derailed in the United States between 2000 and 2014 based on year, track type, annual traffic volume, and accident cause ( 19 ). Li et al. conducted a quantitative analysis of the derailment characteristics of loaded and empty unit trains to determine the frequency of derailments for both ( 7 ). Kang et al. developed a probabilistic risk analysis model for railroad hazmat transportation risk modeling and presented a practical case study comparing unit and manifest trains transporting hazardous materials ( 20 ).
These studies show that statistical methods can be applied and train types can be considered in train derailment estimation. In the past decade, some researchers have used machine learning to investigate the relationship between train derailment and associated factors ( 21 , 22 ). Lotfi et al. predicted the severity of train derailment utilizing decision tree, random forest, support vector machine, and other machine learning techniques ( 21 ). Song et al. conducted a quantitative analysis of freight train derailment severity with structured and unstructured data by combining latent dirichlet allocation (LDA) and a zero-truncated negative binomial model ( 22 ). Machine learning-based methods are increasingly a research focus and continue to yield valuable insights.
Knowledge Gaps and Our Goals
Previous machine learning-based studies do not show a great ability to quantify and explain the impact of each factor on train derailment. Current methods based on the TG model focus on limited attributes and only estimate the mean of freight train derailment severity. Limited previous research has estimated derailment severity pertaining to the use of different types of trains ( 9 , 23 , 24 ). Even fewer studies have focused on the difference between loaded and empty unit trains versus other types of trains for the same traffic demand. This research addresses these gaps by presenting a comprehensive freight train derailment factor analysis and derailment severity estimation based on the TG model, train types, and other associated factors.
This paper aims to: (1) define and identify factors that influence derailment severity, given a train derailment incident; (2) build a TG model to estimate derailment severity, given a set of influencing factors; and (3) estimate train derailment severity based on the dataset from the FRA using the TG model. The remainder of this paper is organized as follows: the next section describes the data sourced from the FRA and corresponding exploratory data analysis. Following that section is an explanation of the methodology implemented in this work, namely the TG model, to identify factors that influence derailment severity and to estimate derailment severity. Subsequently, the results are interpreted and implications are discussed. The last section concludes the estimation of train derailment severity and analysis of influencing factors, clarifies the contribution of this paper, and discusses future work.
Data Source and Exploratory Data Analysis
Data Source
The Rail Equipment Accident/Incident Form 6180.54 (REA), published by the FRA of the U.S. Department of Transportation (USDOT), records the time, cause, severity, consequence, and contributing factors of each train accident ( 11 ). This research uses freight train derailment data on the main tracks of Class I railroads, the largest railroads by revenue operating in the United States, from 1996 to 2021 for train derailment severity analysis, which covers all available data consistent with our derailment rate analysis.
Many previous studies have used the “number of derailed cars” to measure derailment severity ( 7 , 12 , 16 , 17 ). The generic term “cars” refers to all types of vehicles, such as locomotives, railcars, and cabooses, unless specifically stated otherwise. Monetary damage and the number of casualties are also used to assess derailment severity. However, prior studies have stated that monetary damage is prone to substantial variation because of factors such as the cost difference between locomotives and railcars and differences in repair costs between regular track and special track (like turnouts and crossings), and that casualties are more appropriately included in the measurement of passenger train derailments ( 13 , 25 ). As this research focuses on freight train derailments, this section primarily uses the number of cars derailed as a derailment severity metric in its study of unit train and manifest train derailment severity analysis.
Figure 1 shows the average train derailment severity for each year to demonstrate whether there is a statistical trend over the years from 1996 to 2021. This figure does not show an obvious increasing or decreasing trend in average derailment severity from 1996 to 2021. We use the Mann–Kendall Trend Test to verify the significance of increasing or decreasing trends in derailment severity. The Mann–Kendall Trend Test ( 26 ) is a non-parametric test for analyzing time series data with consistent increasing or decreasing trends. We find that train derailment severity does not have a significant increasing or decreasing trend over time. This is because the p-value (0.895) is greater than the 0.05 confidence level, and we can thus reject the null hypothesis that the data have a significant increasing or decreasing trend. Therefore, we can conclude that, statistically, derailment severity for the 25 years from 1996 to 2021 does not change significantly over time, and we can conduct an integrated analysis of derailment severity for all years from 1996 to 2021 instead of a separate derailment severity analysis for each individual year.

Average train derailment severity each year.
Using the freight train derailment data collected from 1996 to 2021, the distribution of the number of cars derailed is plotted in Figure 2, excluding data with derailment speed equal to “0 mph” or the number of derailed cars equal to “0”. Figure 3 presents the same data separated by train type for the unit trains and manifest trains’ distributions of the number of derailed cars, and the comparison between them. Table 1 presents descriptive statistics for train derailment severity analysis. Most derailment accidents are manifest train derailments (69%), and the corresponding average number of derailed cars is 7.7, whereas the average numbers of derailed cars for all train types and for unit trains specifically are 8.8 and 11.3, respectively. These facts indicate that manifest trains may primarily affect the estimation of train derailment severity.
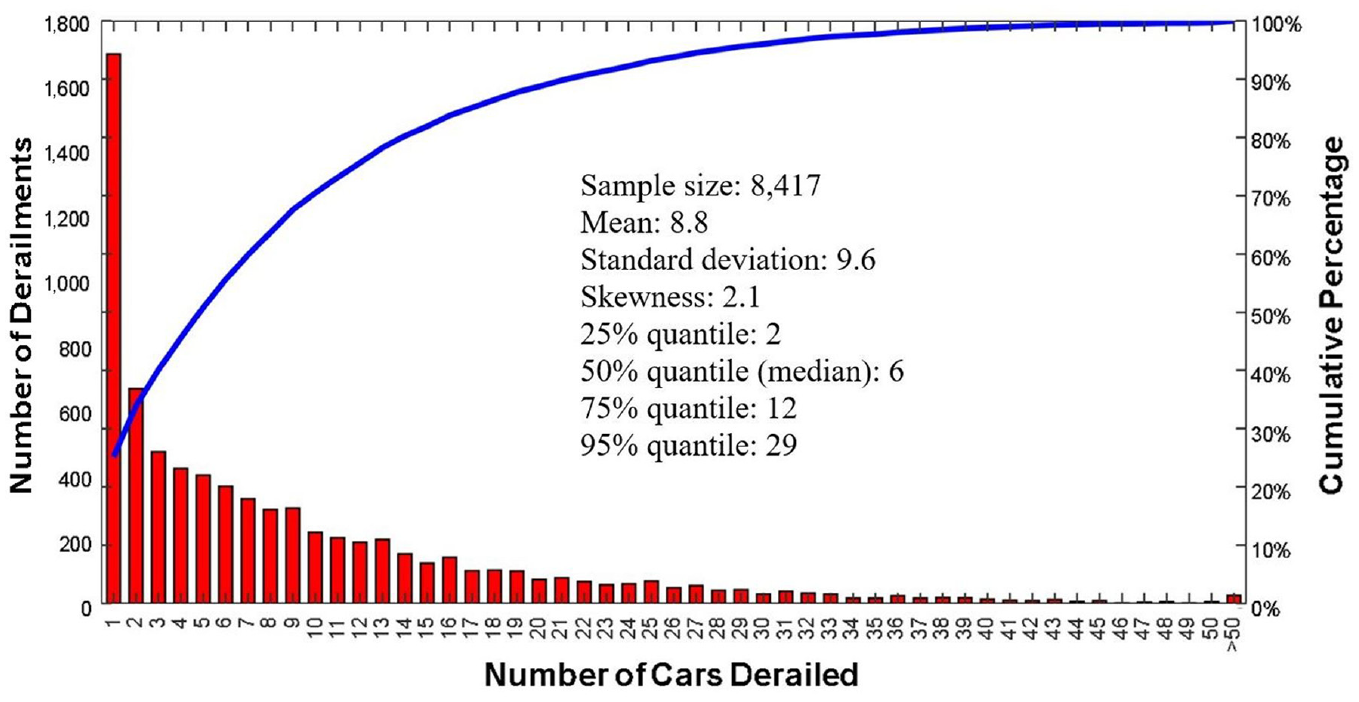
Number of railcars derailed per freight train derailment (all train types) from 1996 to 2021.
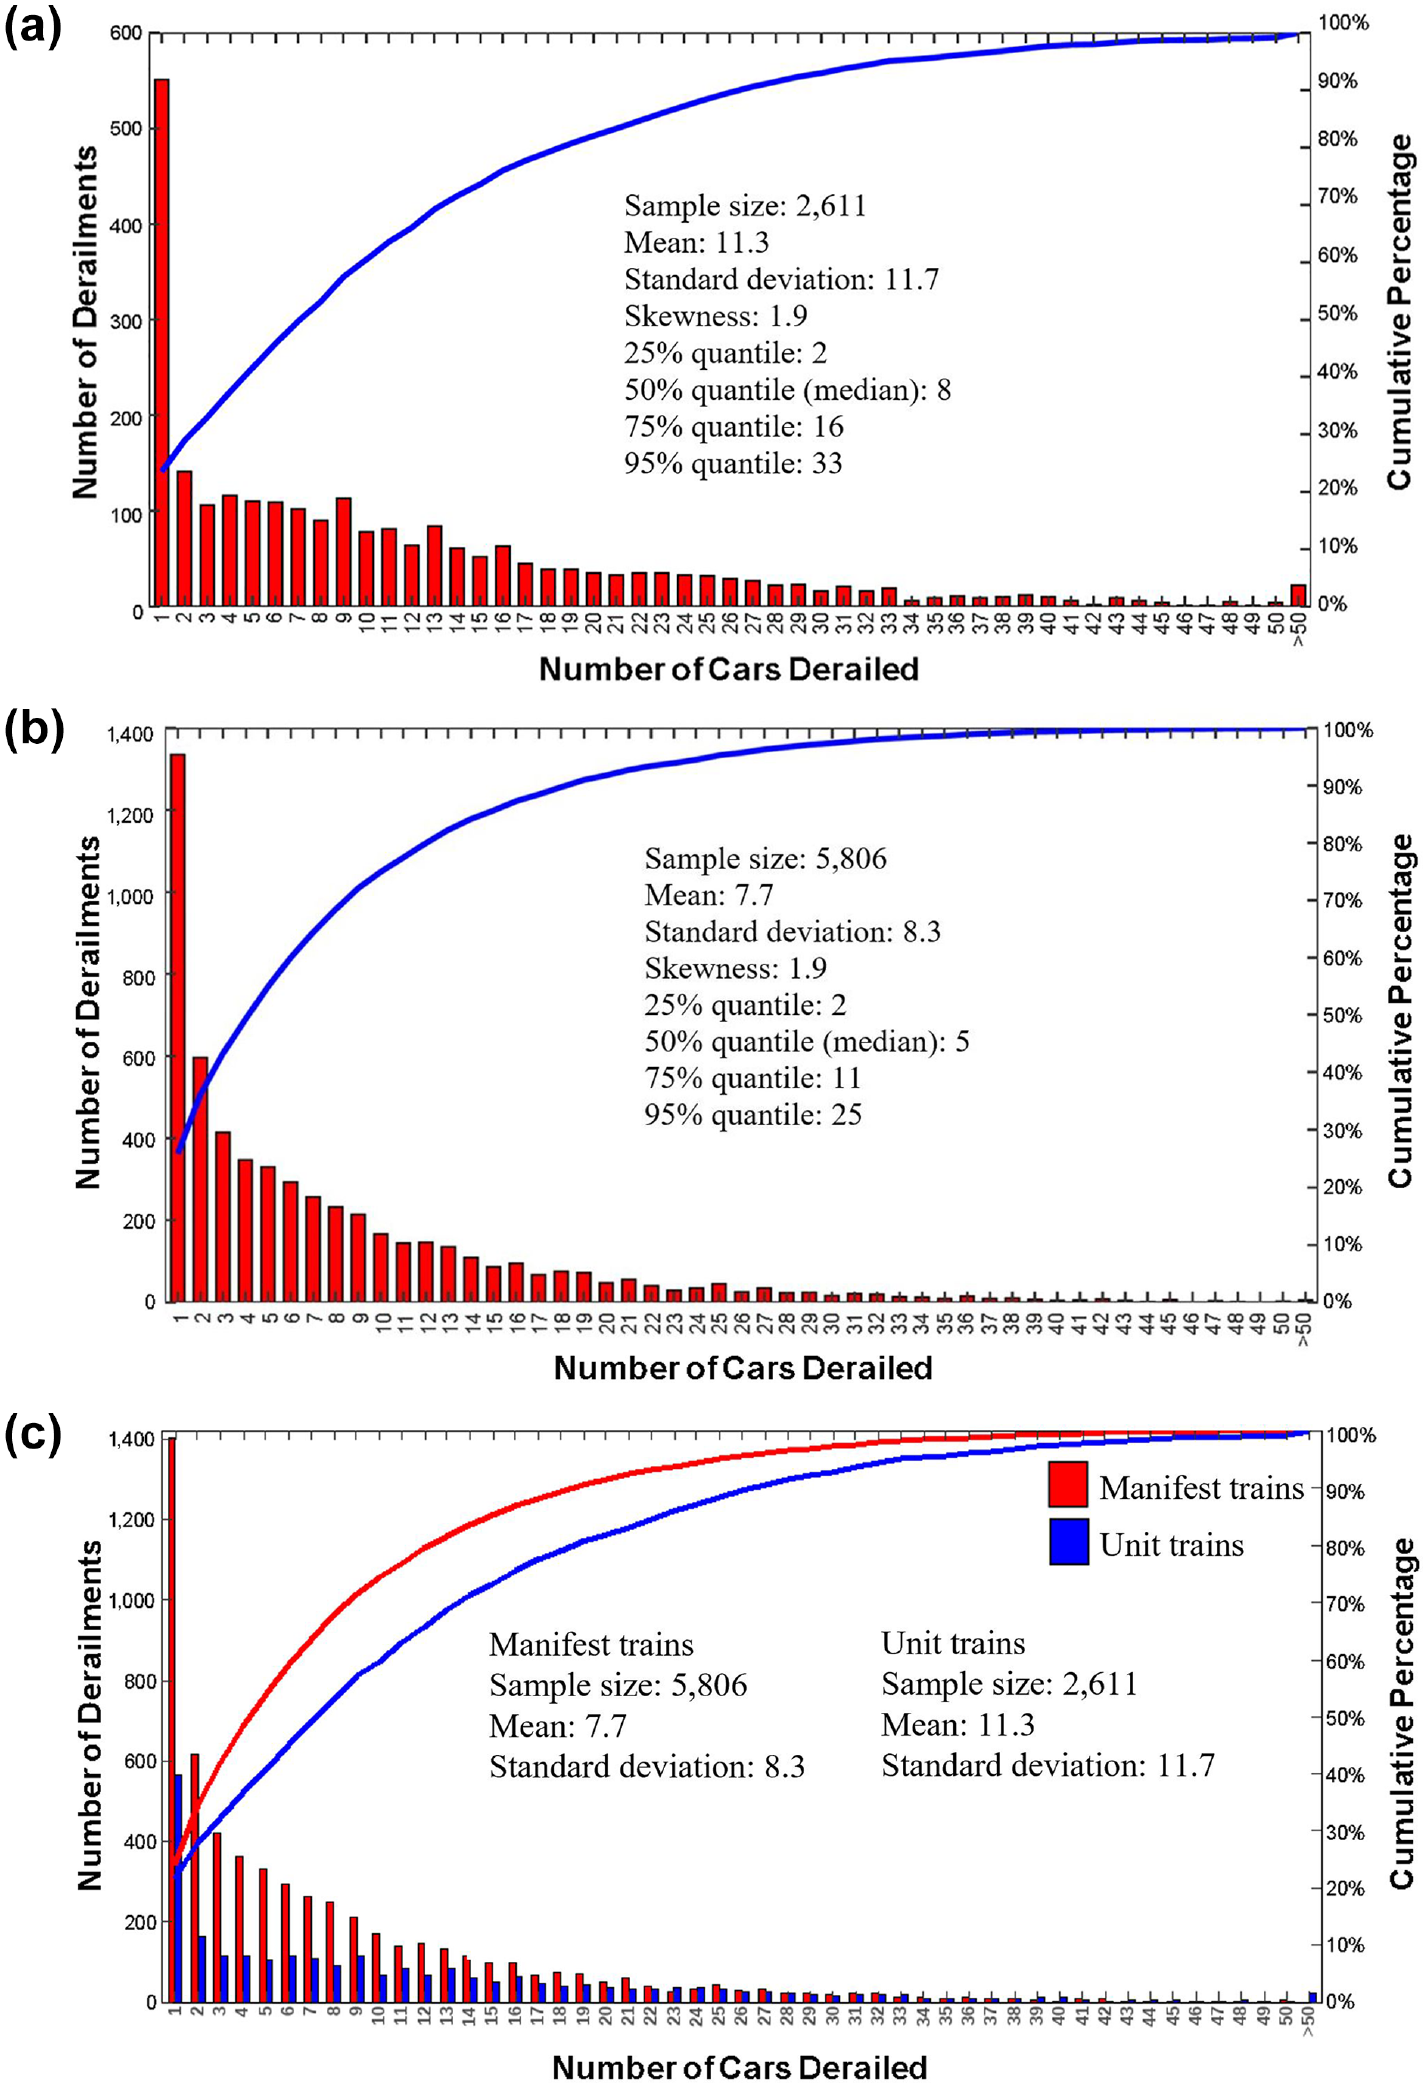
Number of railcars derailed per freight train derailment in: (a) unit trains, (b) manifest trains, and (c) comparison.
Descriptive Statistical Results

Exploratory Data Analysis
Before developing statistical models to estimate train derailment severity, we conduct data screening to exclude data with inappropriate attributes which may degrade the model’s performance. The following screening conditions are applied; 8,160 train derailments (94.88% of all 8,600 derailments) are selected for analysis.
Speed ≥ 1: In the dataset, 145 derailment incidents’ speeds are 0 miles per hour. We assume that a train will not derail when train speed is extremely slow. Thus, we set the lowest derailment speed as “1 mile per hour” and these 145 derailment incidents (1.68% of all 8,600 derailments) are excluded from subsequent analysis.
Number of derailed cars ≥ 1: In the original dataset, some numbers of derailed cars and locomotives were zero. However, when the number of derailed cars is zero, we deem that the train did not derail, and thus the incidents with zero derailed cars are excluded from our analysis. This screening criterion removes sixty-seven derailment incidents (0.78% of all 8,600 derailments) from the dataset.
Number of cars behind the point of derailment (POD) ≥ Number of derailed cars: In this paper, POD refers to the position of the first derailed vehicle (FDV). It is impossible for the number of cars behind the POD to be less than the number of derailed cars, and thus we only consider data with the number of cars behind the POD greater than or equal to the number of derailed cars. In addition, we assume there is only one POD per accident. The POD information is from the FRA safety database and its accuracy could potentially affect the results. In the dataset, there are 179 derailment incidents (2.08% of all 8,600 derailments) whose numbers of cars behind the POD are less than the numbers of derailed cars, and these data are excluded from our analysis.
Other data with apparent errors (seventy-nine data records [0.92% of all 8,600 derailments], e.g., tons per car equal to 0, two data records for one derailment incident) are excluded.
Out of the 8,160 train derailments, 2,120 data points refer to loaded unit trains, 414 data points refer to empty unit trains, and 5,626 data points refer to manifest trains.
The response variable is the total number of railcars derailed, including loaded railcars, empty railcars, and locomotives. Several engineering and operational factors may affect train derailment severity. Based on the literature, estimator variables are identified for statistical analysis, and include train derailment speed, residual train length, gross tonnage per car, and train type.
Train Speed
Train derailment speed is the speed of train operation when the accident occurs. This factor’s effect on derailment severity is most widely studied in the literature ( 12 , 17 , 27 , 28 ). It has been found that, given all other factors are equal, derailment speed is positively associated with the number of cars derailed. This finding is reasonable because speed is an indicator of an accident’s kinetic energy.
Residual Train Length
Residual train length is defined as the number of railcars behind the POD, which is the maximum number of cars potentially subject to derailment. Figure 4 illustrates the POD and residual train length. Saccomanno and El-Hage ( 17 ), Anderson ( 27 ), and Liu et al. ( 12 ) found that a greater residual train length is associated with more derailed cars if a derailment occurs.

An illustrative example of point of derailment and residual train length.
Gross Tonnage per Car
Liu et al. verified the hypothesis that a train carrying a larger proportion of loaded cars is expected to derail more cars ( 12 ). Therefore, we consider the gross tonnage per car as a factor that influences derailment severity. Higher gross tonnage per car in the train may also indicate greater kinetic energy in the derailment, thereby causing more cars to derail, given all else being equal.
Train Type
Train type is the new factor considered in this research. There is no data field in the FRA REA database to directly identify train type (i.e., unit or manifest train). In this research, we classify train types based on previous studies ( 7 , 9 ). We identify unit trains and manifest trains using the railroad code, train symbol ID, causing car reporting mark and number, number of empty cars, number of loaded cars, number of locomotives, and narratives recorded in the REA database. According to several variables extracted from the accident database, including the number of empty cars, the number of loaded cars, the number of locomotives, the length of the train considering the total number of cars and locomotives, and the percentage of loaded or empty railcars in the train, a train is classified as loaded if 95% or more of its cars are loaded, or as empty if 95% or more of its cars are empty (Figure 5) ( 9 ). These percentages were calculated by dividing the number of loaded or empty cars by the total number of cars in the train. The percentage of “95%” of loaded or empty cars is used as the threshold to measure whether a train is a unit train or a manifest train (instead of the percentage of “100%”) because of the buffer cars required by federal regulation ( 29 ) whose loading condition is independent of the loading condition of the rest of the train. This same threshold was used in the previous study ( 7 ) to determine the loading conditions of freight trains. Buffer cars can either be empty or loaded with an inert material. In this research, a train that is not more than 95% loaded or not more than 95% empty is directly defined as manifest train. To determine whether a train is a unit train or a manifest train, further steps are required to identify train type when it is more than 95% loaded or empty, while the remaining trains with partially loaded consists are generally manifest trains. For example, train numbers with prefixes of “C,”“G,” or “U” stand for loaded unit coal trains, loaded unit grain trains, and loaded unit trains carrying materials other than coal or grain, respectively, whereas “M” represents manifest trains, following BNSF Railway’s symbol guide ( 30 ).

Methodology for classifying type of derailed trains ( 9 ).
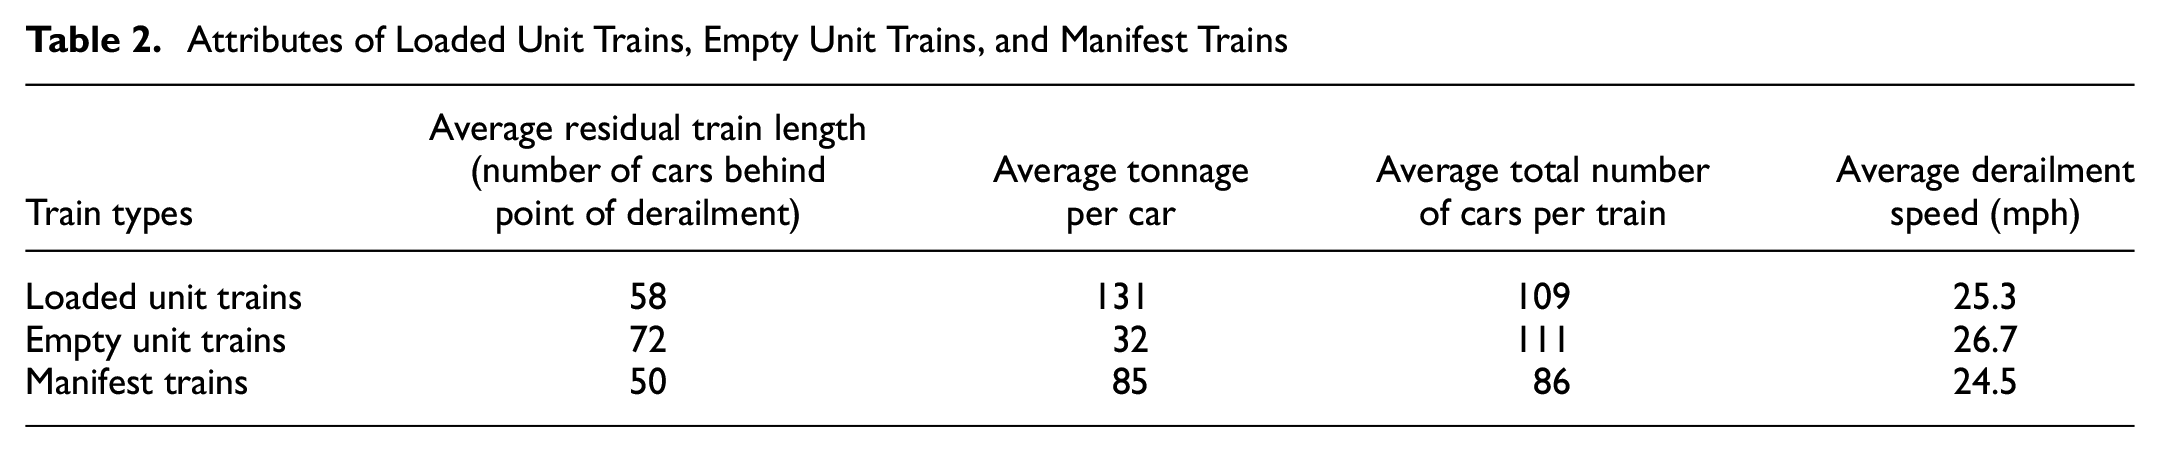
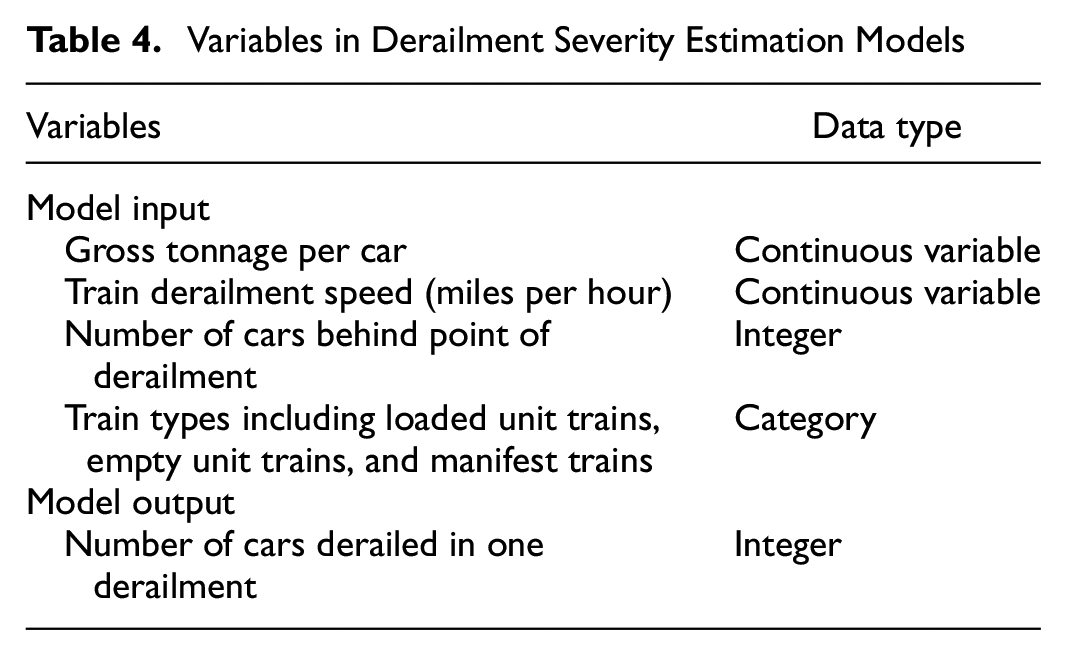
We consider three types of trains: loaded unit trains, empty unit trains, and manifest trains. There may be significant differences in train length, gross tonnage, and train speed for loaded unit trains, empty unit trains, and manifest trains, which may influence derailment severity, as shown in Table 2. The average total numbers of cars per train for both the loaded unit train and empty unit train are greater than the manifest train, with a small difference between the loaded unit train and empty unit train. The average tonnage per car of a loaded unit train is remarkably larger than empty unit trains and manifest trains, which may increase the corresponding train derailment severity. We use the one-way analysis of variance (ANOVA) to analyze the differences between the means of two or more groups. The one-way ANOVA ( 31 ) compares the variance within groups with the variance between groups and, based on the results, it determines whether there is a statistically significant difference between the means of the groups being compared. As shown in Table 3, one-way ANOVAs are performed to evaluate the existence of statistical differences in these attributes among train types. We find that these attributes among train types considered in the one-way ANOVA are significant, with all p-values being less than 0.05. The results indicate that there was a statistically significant difference in these attributes between all three train types. These attributes of all three train types with different distributions indicate that these factors have significant influences on derailment severity. Moreover, train type represents some unobserved, hidden factors besides tonnage, train length, speed, and so forth. Therefore, train type is also treated as a variable. Table 4 summarizes the input variables considered for the severity estimation model.
Attributes of Loaded Unit Trains, Empty Unit Trains, and Manifest Trains
One-way ANOVA Result of Train Types and Attributes
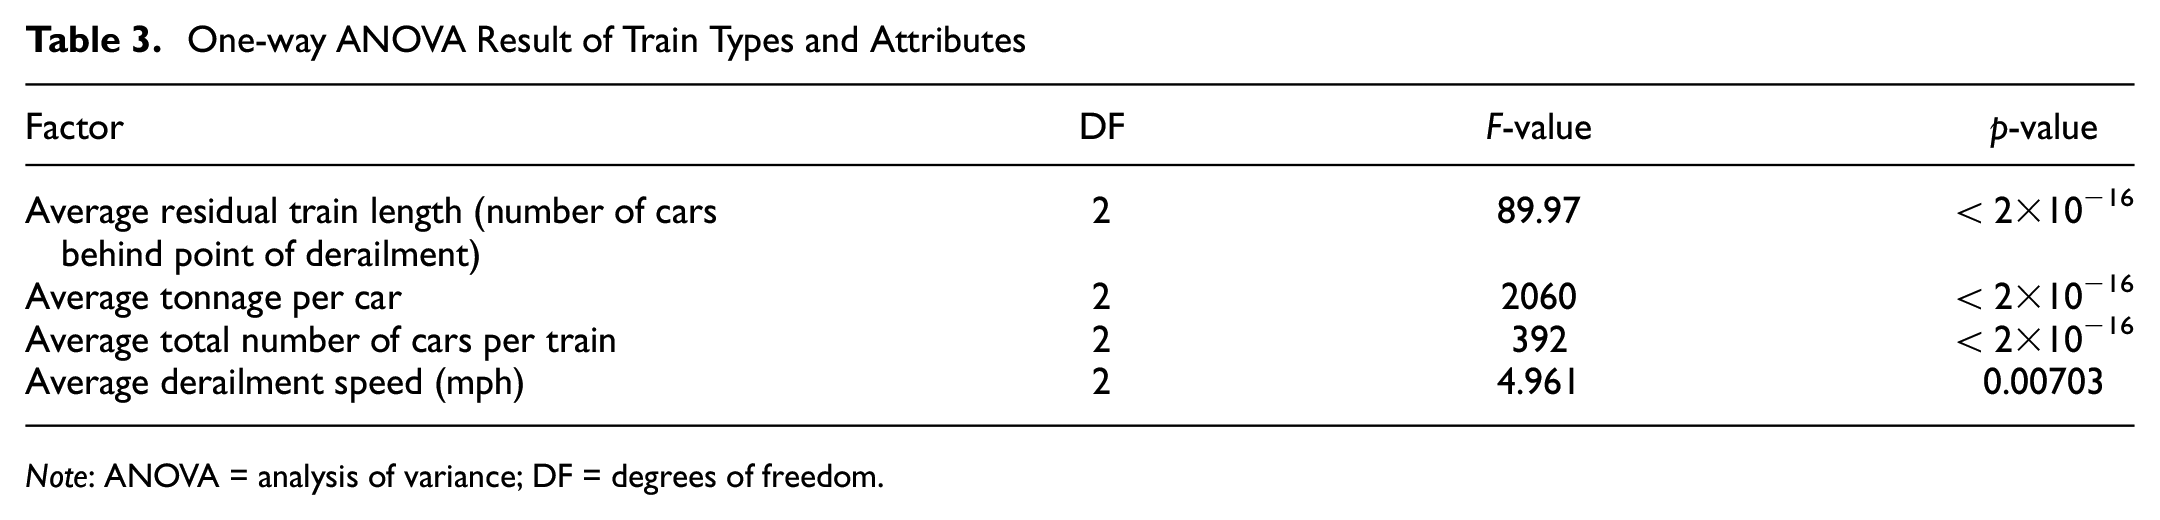
Note: ANOVA = analysis of variance; DF = degrees of freedom.
Variables in Derailment Severity Estimation Models
Methodology
Truncated Geometric Model
Given that a train derailment incident occurs, the number of cars derailed must be greater than or equal to “1” and less than or equal to the residual train length. As verified by Bagheri ( 18 ), the number of cars derailed follows a TG distribution and the TG model can truncate the number of derailed cars beyond the range from “1” to the residual train length. For a train derailment event with train length L and POD j (the residual train length Lr = L – j + 1), the probability of derailing x cars can be calculated by:
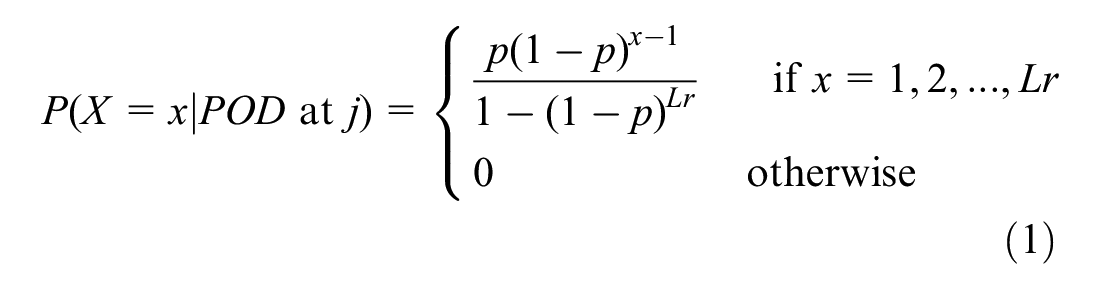
where
Lr: residual train length
x: number of cars derailed
p: the probability of success at each trial, which is a constant probability. In other words, if a derailment has occurred, “x” cars derailing before the first non-derailing car is a geometric distribution and the probability of a car derailing is equal to (1 – p). This probability p is assumed to be related to the factors/covariates through the logit link function:

where Z is a linear function (Equation 3) of influencing factors, including derailment speed, residual train length, gross tonnage per car, and train type.
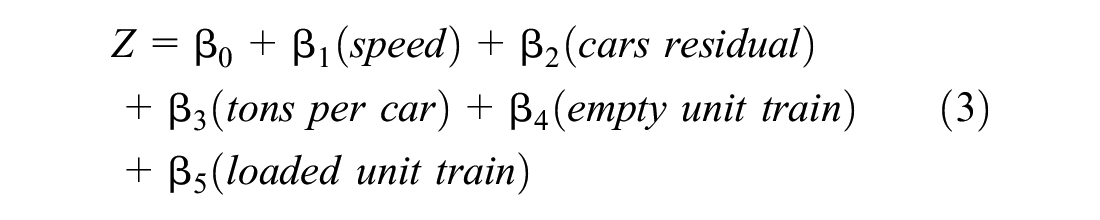
speed: Train derailment speed (miles per hour)
cars residual: Number of cars behind POD
tons per car: Average gross tonnage per car
empty unit train: If the train is an empty unit train, empty unit train = 1, otherwise empty unit train = 0
loaded unit train: If the train is a loaded unit train, loaded unit train = 1, otherwise loaded unit train = 0
The model uses the manifest train as a reference, which means that the manifest train type variable is not included in the model. A detailed introduction of the TG model can be found in Bagheri ( 18 ).
We use the VGAM package in R to fit the TG model. The VGAM package ( 32 ) in R aims to fit Vector Generalized Linear and Additive Models (VGLMs and VGAMs), as well as reduced-rank VGLMs (RR-VGLMs) and quadratic RR-VGLMs (QRR-VGLMs). It is a general program for maximum likelihood estimation. In this research, the VGAM package is able to fit the TG model using the function “truncgeometric()”.
Model Results
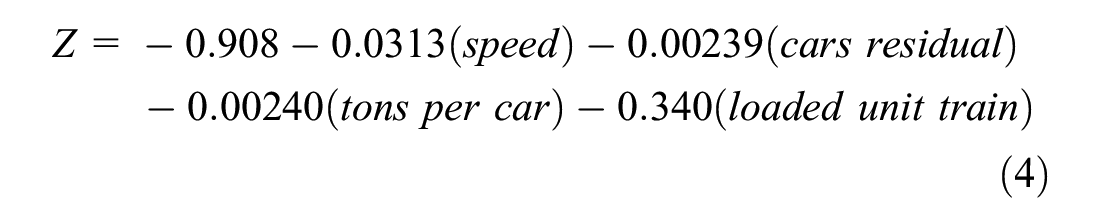
Table 5 presents the results of the model. We find that except for the variable “empty unit train,” all other variables considered in the TG model are significant, with all p-values being less than 0.05. Thereafter, we get the model result of the Z function in Equation 4.
Truncated Geometric Model Results for All Train Types with Outliers
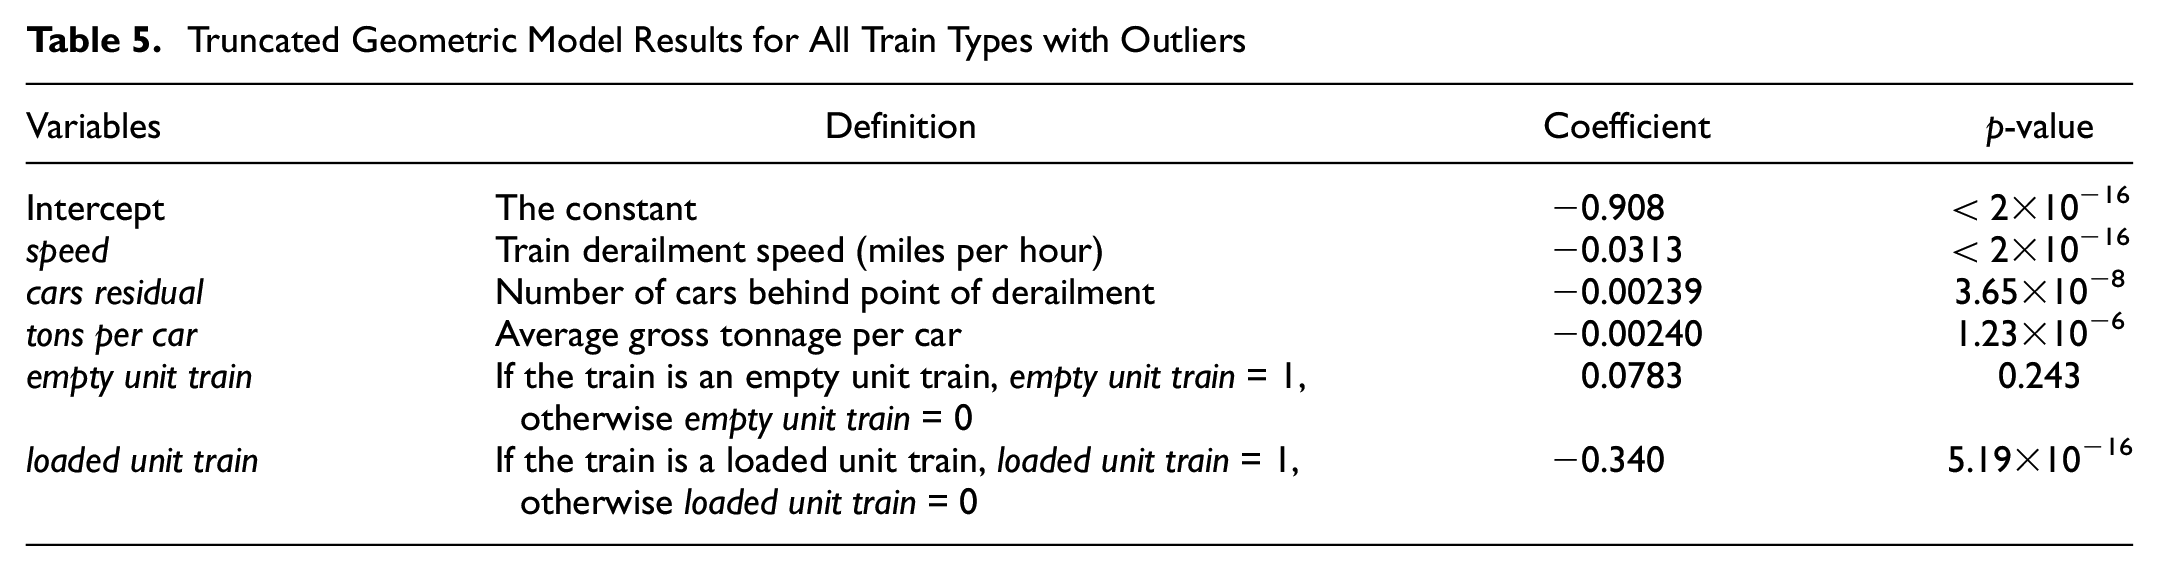
In Equation 4, if the coefficient of a variable is negative, then increasing this variable would tend to increase derailment severity. In contrast, if the coefficient of a variable is positive, then increasing the variable would tend to decrease derailment severity. The reason can be interpreted as follows. Based on Equation 2, the probability of a car not to derail (p) is a monotone increasing function of “Z,” and thus the probability of a car to derail (1 – p) is a monotone decreasing function of “Z.” When a variable is increased, given that its coefficient in Z function is negative, Z decreases and then the probability of a car to derail increases, and thus derailment severity tends to increase, and vice versa. Based on this discussion, we offer the following interpretation of the obtained model.
The coefficient of derailment speed is −0.0313. This indicates that higher derailment speed is associated with increased derailment severity.
The coefficient of residual train length is −0.00239. The negative value indicates that longer residual train length is associated with increased derailment severity.
Similarly, greater gross tonnage per car is associated with increased derailment severity.
The coefficient of “loaded unit train type” is −0.340. This means that a loaded unit train tends to have more cars derailed compared with a manifest train or an empty unit train, given all else being equal.
We use the mean number of cars derailed as the estimated derailment severity, as formulated by Equation 5.
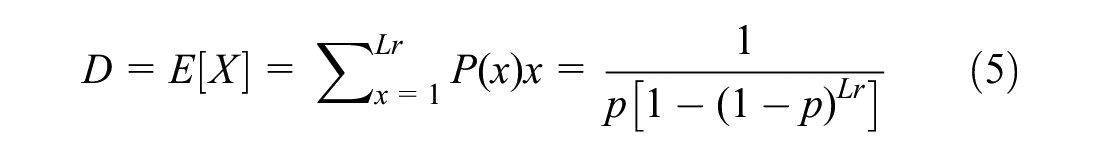
Figure 6 plots the estimated severity versus the observed severity. Because of low-severity outliers (i.e., those incidents where estimated severity is high but observed severity is low) and high-severity outliers (i.e., those incidents where estimated severity is low but observed severity is high), the R square is not sufficiently large (0.61), which indicates that the model does not estimate the severity perfectly.

Estimated severity versus observed severity with outliers.
One of the concerns identified by this result is that there are different types of behaviors in the derailment data and the variation cannot be represented well by this type of model. Thus, we analyze train derailment data through a physical model ( 33 ) that can model typical derailments. For example, the derailment data include a significant number (approximately 20%) of single-car derailments (severity = 1) with a wide range of derailment speeds. These often result from mechanisms like a broken wheel or axle, and are situations where a single truck might derail but the problem is identified and the train is brought to rest by the operator, initiating no larger derailment severity. All cars in the train remain connected and upright, primarily aligned with the track. Liu et al. analyzed the causes of major train derailment and revealed that equipment is the main cause of train derailment at derailment speeds greater than 25 mph ( 34 ).
In other extreme derailments, the train is moving very slowly and an initiating event, such as extreme weather, causes a long string of connected cars to fall over, remaining aligned with the track. According to our findings based on accident narratives in the FRA REA database, we can assume that if there are empty tank cars with double shelf couplers and one of these cars rolls off its tracks in a derailment, the strong rotational coupling between the cars could result in a long line of trailing cars rolling over. These events can have very high severities even at low speeds or no speed.
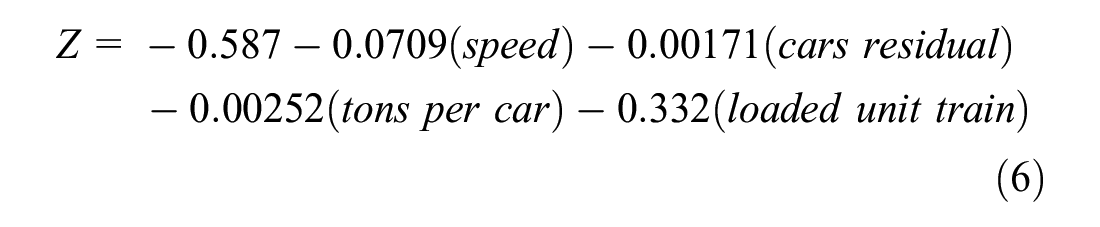
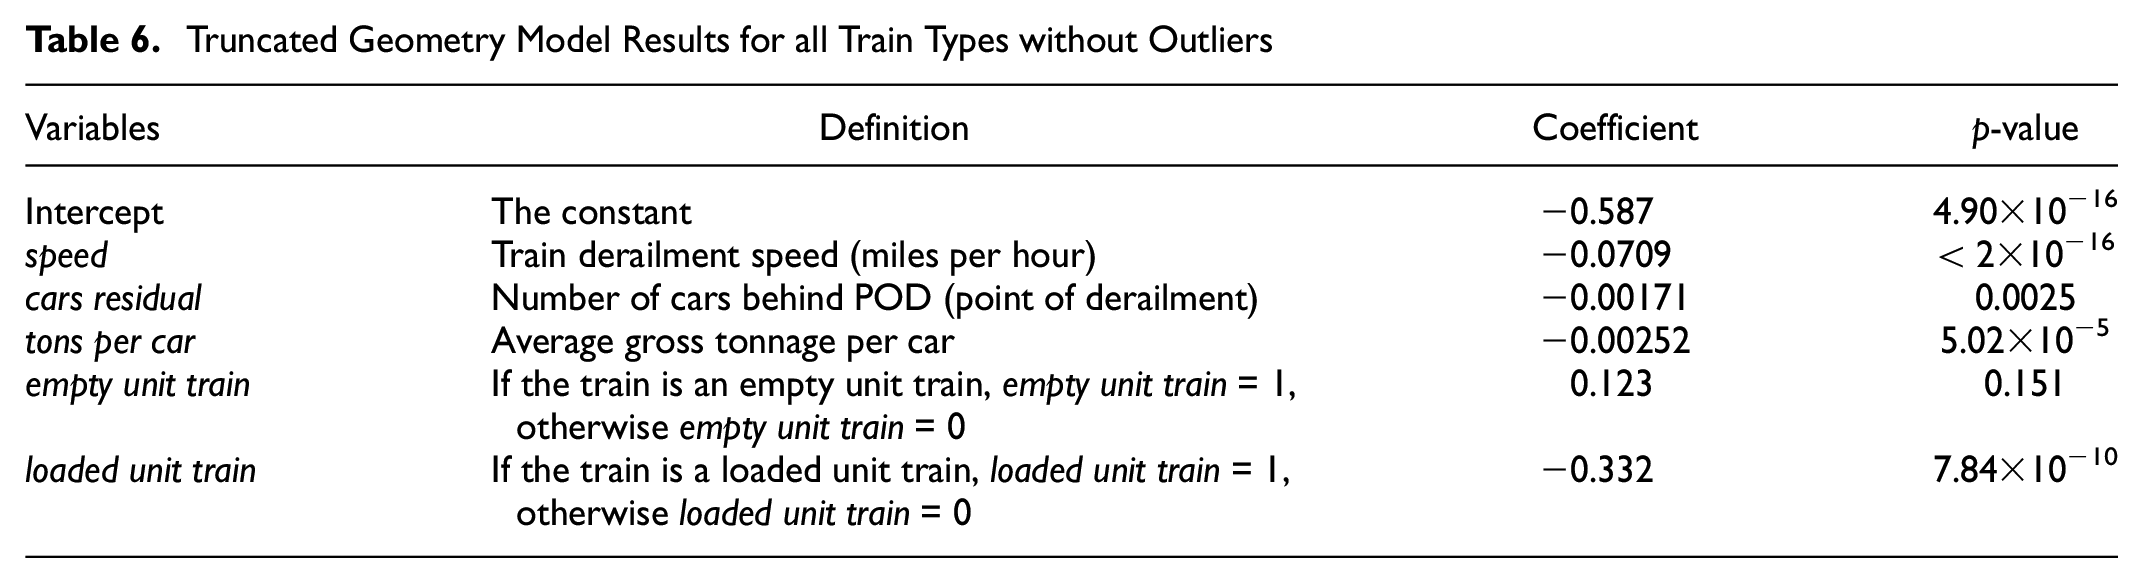
Consequently, we conducted additional analysis of the data where we excluded the high-severity and low-severity outliers. Nayak et al. proposed a positive non-linear relationship between derailment speed and the mean of derailed cars, and expressed the mean number of derailed cars as a function of the square root of the derailment speed ( 15 ). Martey and Attoh-Okine employed a vine copula quantile regression model to analyze the relationship between derailment speed and derailment, which showed the marginal effects of derailment speed in their model with different alpha values ( 14 ). Therefore, we developed a method to exclude these outliers and then used the TG model again to estimate derailment severity. Considering that we covered most of the derailment data and improved the TG model’s performance, we determined the threshold for excluding outliers by inferring from previous research ( 14 , 15 , 33 , 34 ) and several trials. Derailment data outside the range from 0.1 × derailment speed to 1.6 × speed are treated as outliers and are excluded from analysis (Figure 7). The derailments outside these bounds are assumed to have a “unique behavior” compared with typical derailments. Using this outlier elimination method, 5,849 derailment data are selected from the total 8,160 train derailments; 2,311 outliers are excluded, among which 2,004 derailment data are low-severity outliers and 307 derailment data are high-severity outliers. Among the 5,849 train derailments, there are 1,581 data records from loaded unit trains, 299 data records from empty unit trains, and 3,969 data records from manifest trains. The result of the TG model is presented in Table 6 and Equation 6.

Method to exclude outliers.
Truncated Geometry Model Results for all Train Types without Outliers
Mean squared error (MSE, Equation 7) and mean absolute error (MAE, Equation 8) are selected to measure the performance of TG models in estimating train derailment severity. For all data with outliers, the MSE and MAE of the model are 68.91 and 6.05, respectively. For the data without outliers, the MSE and MAE of the model are 36.82 and 4.22, respectively. The MAE indicates that the average gap between the estimated number of derailed cars and the observed number of derailed cars is “6.05” and “4.22” for the data with and without outliers, respectively. Figure 8 plots the estimated severity versus the observed severity without outliers.
The TG regression model is also used to separately fit the derailment severities for the loaded unit train, empty unit train, and manifest train. Equations 9 and 10 calculate the TG model results for loaded unit train derailment severity based on the data including and excluding outliers, respectively. The effect of average gross tonnage per car on the derailment severity for the data both with and without outliers is insignificant.
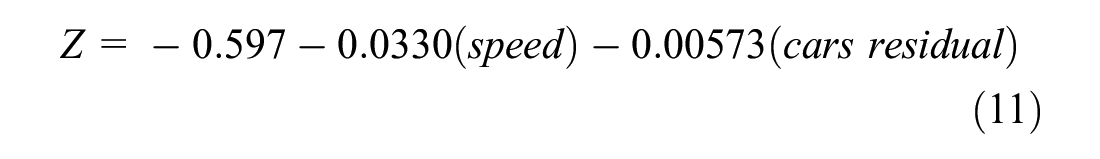
Equations 11 and 12 calculate the TG model results for empty unit train derailment severity based on the data including and excluding outliers, respectively. In the model based on the data with outliers, the effects of average gross tonnage per car on the derailment severity are insignificant. In the model based on the data without outliers, the effects of average gross tonnage per car and residual train length on the derailment severity are insignificant.

Equations 13 and 14 calculate the model results for derailment severity of manifest trains based on the data with and without outliers, respectively. All considered variables and the intercept are significant for both models based on the data with and without outliers.
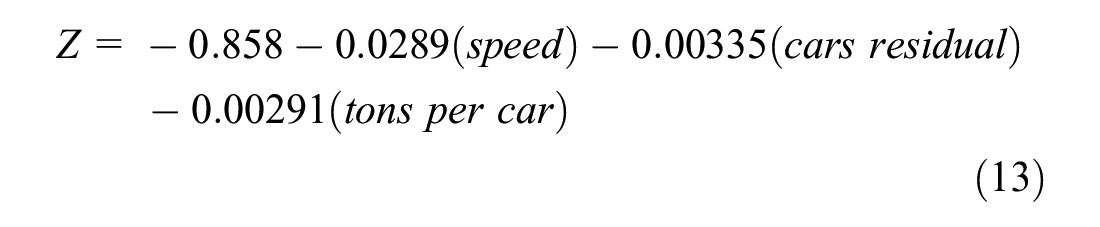
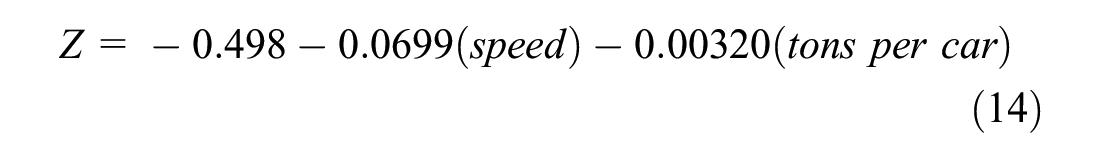
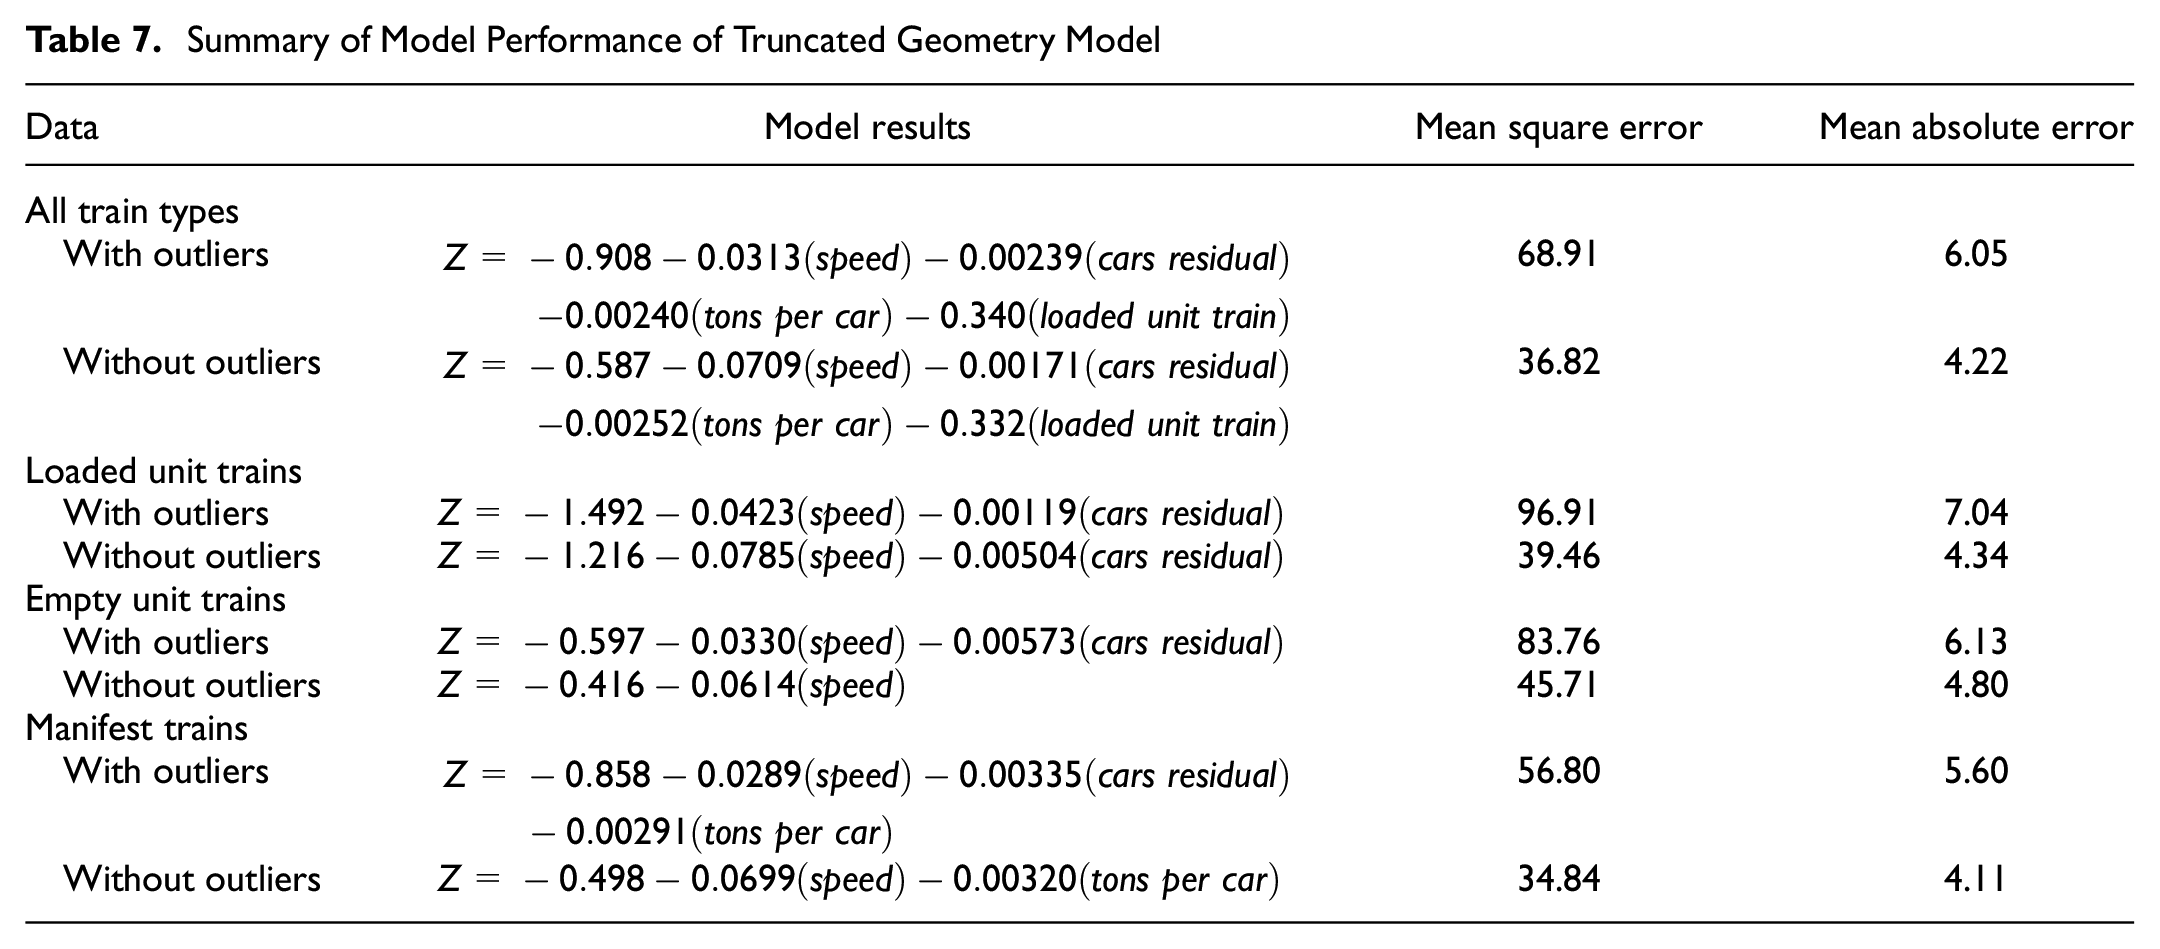
Table 7 summarizes the performance of TG models at estimating train derailment severity for loaded unit trains, empty unit trains, and manifest trains. The MSE (Equation 7) and MAE (Equation 8) are used as criteria to measure performance. We found that the TG model has a better performance when outliers are excluded. Overall, the performance of the TG model is acceptable: the models with outliers all have MAEs less than 7.5, and the models without outliers all have MAEs less than 5. Based on these results excluding data outliers, we propose the following interpretations of the obtained model.
The coefficient of derailment speed is −0.0709. This reveals that higher derailment speed is associated with increased derailment severity.
The coefficient of residual train length is −0.00171, which is also negative, indicating that longer residual train length is associated with increased derailment severity.
The coefficient of gross tonnage per car is −0.00252. Correspondingly, greater gross tonnage per car is associated with increased derailment severity.
Similar to the situation considering the data outliers, the coefficient of “loaded unit train type” is also negative, with a value of −0.332. Given all else being equal, this means that a loaded unit train tends to have more cars derailed compared with a manifest train and an empty unit train.

Estimated severity versus observed severity without outliers.
Summary of Model Performance of Truncated Geometry Model
Concluding Remarks
This research identifies factors that influence derailment severity, given a train derailment incident, and develops a TG model to estimate train derailment severity based on these factors. First, we conduct a comprehensive exploratory data analysis of train derailment severity and select appropriate data from the FRA for statistical analysis. Second, we systematically summarize factors that can significantly influence train derailment severity, with the train types being loaded unit train, empty unit train, and manifest train. Third, we utilize these factors to estimate train derailment severity and quantify the influence of these factors, which provides further insights into train derailment severity.
Based on the severity estimation results obtained by the TG model, factors that can significantly influence train derailment severity are identified; these include train speed, residual train length, gross tonnage per car, and train type. The results indicate that increased derailment severity is associated with higher derailment speed, longer residual train length, and greater gross tonnage per car. Given all other factors are the same, a loaded unit train tends to have more cars derailed compared with a manifest train and an empty unit train.
We conducted additional analysis excluding low and high-severity outliers, and estimated derailment severity using the TG model. The results show that the TG model achieves better estimation performance when outliers are excluded. Given all other factors being equal, a loaded unit train tends to have more cars derailed compared with a manifest train and an empty unit train, whereas there is no significant difference in derailment severity between a manifest train and an empty unit train. For the empty unit train and loaded unit train, the effect of average gross tonnage per car on the derailment severity is insignificant for the data both with and without outliers, whereas the average gross tonnage is significant for the derailment severity of the manifest train.
However, statistical models may have difficulty predicting extreme derailment events that fall outside historical experience. Physical models are able to capture the conditions of a specific train derailment scenario by mathematically describing the physical dynamics of the derailment. In the future, we will leverage physical modeling, which could help in understanding the derailment mechanism determined by train speed, tonnage, train length, and so forth, and compare it with the statistical model to estimate train derailment severity more accurately.
Footnotes
Acknowledgements
The Federal Railroad Administration’s (FRA) Office of Research, Development and Technology sponsored the work leading to this paper. The authors would like to acknowledge Francisco Gonzalez and Dr. Phani Raj from the FRA for their advice and guidance during this research. The authors would also like to thank Zezhou Wang, Xin Wang, Junyan Dai, and Noelle Darling from Rutgers University, and Xi Zhang from the University of Houston for their assistance on this research.
Author Contributions
The authors confirm contribution to the paper as follows: study conception and design: Zheyong Bian and Xiang Liu; data collection: Zheyong Bian and Weitian Li; analysis and interpretation of results: Zheyong Bian and Weitian Li; draft manuscript preparation: Weitian Li. All authors reviewed the results and approved the final version of the manuscript.
Declaration of Conflicting Interests
The author(s) declared no potential conflicts of interest with respect to the research, authorship, and/or publication of this article.
Funding
The author(s) disclosed receipt of the following financial support for the research, authorship, and/or publication of this article: This research was supported by a research grant (693JJ619C000017) from the Federal Railroad Administration of the U.S. Department of Transportation. However, all views, analyses, and errors are solely those of the authors.