
Abstract
Speed harmonization is an active traffic management strategy used to delay traffic flow breakdown and mitigate congestion by changing speed limits throughout a road segment based on prevailing traffic, weather, and road conditions. Traditional implementations rely on fixed roadway sensors to collect traffic information and variable speed signs at fixed locations to display updated speeds. Moreover, most implementations use a reactive rule-based decision tree to activate the control strategy. This set-up faces three challenges: 1) fixed infrastructure sensors provide an incomplete picture of traffic flow dynamics throughout the segment which can reduce the effectiveness of the strategy, 2) the limited set of scenarios in which speed control can be applied given the reliance on fixed road sensors and signs, significantly affecting performance, and 3) the difficulty in predicting future traffic state using data from fixed traffic sensors. To overcome these challenges, this paper puts forward a predictive speed harmonization system that uses the detailed vehicle trajectories broadcast by connected autonomous vehicles (CAVs) and machine learning techniques to predict the location of traffic congestion. The system relies on a traffic management center (TMC) to collect data from CAVs within a road segment, predict traffic congestion, and broadcast updated speed limits to CAVs to mitigate congestion. Furthermore, the system introduces an optimization-based formulation for speed control to maximize performance. Case studies of multiple operational scenarios show that the proposed speed harmonization system can reduce the severity and length of traffic shockwaves, improve overall traffic stability, increase overall speed, and reduce travel time.
Speed harmonization (SPDHRM, also known as variable speed limit in some applications) is an active traffic management strategy that has been widely used across the world to deal with congestion, incidents, or special events. This strategy changes the speed limit throughout the roadway segment of interest, based on prevailing traffic conditions, roadway surface conditions, and weather conditions, to prevent or delay the onset of flow breakdown, mitigate congestion, and dampen shockwave formation. Current implementations of this strategy rely on fixed roadway sensors (e.g., loop detectors, radars, and video cameras) to assess the traffic conditions and inform selection of the appropriate mitigation strategy (selection of speed limits throughout the target roadway segment). Moreover, changes in speed limits are displayed to drivers through variable message signs at fixed locations throughout the target segment. More sophisticated strategies implement lane-based advisory messages (e.g., Seattle, WA variable speed limit system).
The purpose of this paper is to investigate whether accurate congestion prediction can enhance the effectiveness of speed harmonization systems in preventing shockwave formation. Accordingly, this paper puts forward a predictive speed harmonization system that uses the detailed vehicle trajectories broadcasted by connected automated vehicles (CAVs) through V2I communications and machine learning techniques to predict the location of traffic congestion. The system then determines the optimal speed limits to delay or prevent congestion and directly broadcasts those limits to CAVs upstream of the predicted congestion location. The main contributions of this paper are: 1) using a novel shockwave detection method along with machine learning techniques to predict traffic congestion on a freeway segment in real-time; and 2) proposing an optimization method to calculate optimal prediction horizon, broadcasting distance, and the set of potential speed limits to maximize the effectiveness of the speed harmonization system. Using V2I communications to collect detailed vehicle trajectories and to broadcast updated speed limits to CAVs without relying on fixed infrastructure sensors, the proposed speed harmonization system can operate at low market penetration rates of CAVs and in a mixed traffic environment.
The rest of this paper is organized as follows. The next section presents a background on speed harmonization systems in the literature. Then, the details of the proposed speed harmonization system are explained, including congestion prediction and speed limit selection algorithms. Following that, a high-level overview is presented of the microscopic traffic simulation platform used in this study. A detailed discussion on the performance of the speed harmonization system under various operational scenarios is presented next. Finally, the paper concludes with summary remarks and future research needs.
Background
Several speed harmonization models have been proposed and some have been implemented and tested in the field. An innovative example is SPECIALIST ( 1 ) that is focused on resolving moving shockwaves in the system. This algorithm uses the concepts from Kinematic Waves ( 2 , 3 ) and tries to limit the inflow to the shockwave by reducing the speed limit. This algorithm was tested on a Dutch freeway and was able to increase the throughput by resolving the moving shockwaves ( 4 , 5 ). In another study, Hegyi et al. ( 6 ) presented a predictive control model with a rolling-horizon approach to suppress shock waves by optimally coordinating the posted speed limits in a speed harmonization system. Carlson et al. ( 7 ) introduced a cascaded control model to control the main traffic flow by adjusting the speed limits in a speed harmonization system. Chen and Ahn ( 8 ) focused on fixed bottlenecks and developed a speed harmonization system based on shockwave theory. Their algorithm was able (in simulation studies) to increase throughput at fixed bottlenecks and reduce shockwave intensity (smooth speed transitions).
Even though current implementations of speed harmonization (i.e., using fixed infrastructure sensors and communicating via variable roadway signs) may be able to delay flow breakdown and mitigate congestion, they face three key challenges. The first challenge is that fixed infrastructure sensors provide an incomplete picture of traffic flow dynamics throughout the segment of interest. For instance, shockwaves might not be captured until they pass a loop detector, which may be a long way from where they start. Such late detections can significantly lessen the effectiveness of the speed harmonization strategy ( 9 ). The second key challenge is the limited set of scenarios in which speed control can be applied given the reliance on fixed road sensors and signs. The appropriate response to a detected shockwave is key to an effective and efficient speed harmonization system. However, communicating speed limit changes to the drivers at fixed locations via variable message signs can result in an ineffective response. For example, the updated speed limit, if not shown at the right time, may cause unnecessary slow-downs throughout the target segment. The third key challenge is the difficulty in predicting the future traffic state using data from fixed traffic sensors. As mentioned before, those sensors often collect aggregated data that are not detailed enough to track finer traffic flow dynamics, which are essential for effective traffic control.
Recent advances in connectivity provide the opportunity to address the above challenges ( 10 – 14 ). Through V2I communications, vehicles broadcast information about their location, speed, acceleration, and direction to a central traffic management system, which in turn uses this information to capture finer traffic flow dynamics throughout the transportation system. Accordingly, shockwaves can be identified at the onset of formation ( 9 , 15 ) and more accurate prediction of future traffic states becomes possible ( 15 ). Moreover, drivers can receive information from system operators about the transportation system status. Speed harmonization systems can significantly benefit from the introduction of connectivity, especially at high market penetration rates of connected vehicles. In such an environment, shockwaves can be detected more accurately and decisions about the speed limit can be directly transmitted to vehicles at any point along the segment of interest. Accordingly, many studies have investigated the development of speed harmonization systems in a connected driving environment. Grumert et al. ( 16 ) proposed a cooperative speed harmonization system in a connected environment. They used V2I communications to provide individualized speed limits based on the distance from the incident location and showed that such a system can harmonize the traffic flow. In another study, Han et al. ( 17 ) used connected vehicle technology to develop a speed harmonization system with the goal of improving throughput and reducing travel time at fixed bottlenecks. They tested three strategies: 1) one connected vehicle per lane without any variable message signs; 2) one connected vehicle per lane and using variable message signs; and 3) multiple connected vehicles. They showed that speed harmonization could be effective even with a very limited number of connected vehicles. Moreover, their findings suggest that any sudden change in speed limit could result in further shockwave formation and traffic flow instability.
The above and several other studies have illustrated the effectiveness of using connected vehicle technology for speed harmonization. However, achieving the full potential of speed harmonization systems in a connected driving environment requires the development of a reliable methodology for early shockwave detection, future traffic state prediction, and information dissemination strategies. For instance, Talebpour et al. ( 18 ) showed that signal interference and packet loss in a V2I communications system can significantly degrade the performance of the otherwise effective speed harmonization system.
Methodology
The predictive speed harmonization system proposed in this paper relies on V2I communications and machine learning techniques to collect detailed trajectories from CAVs, estimate current traffic properties, predict future traffic states, and broadcast new speed limits to CAVs accordingly. It is different from traditional speed harmonization systems in three key areas:
It relies solely on CAVs to collect traffic information without any need to collect information from road sensors (e.g., loop detectors or radars), potentially reducing the installation and maintenance costs of those sensors.
The system uses machine learning algorithms (data-driven) to predict traffic congestion and prevent/mitigate it. This data-driven approach improves the accuracy of prediction by up to 93% ( 15 ) as it does not rely on strong assumptions about traffic behavior or road geometry.
The system accurately identifies the location of congestion anywhere on a freeway segment as it is not constrained by the location of infrastructure sensors.
The system consists of three main modules: 1) traffic monitoring, 2) congestion prediction, and 3) speed control. The traffic monitoring module is responsible for collecting detailed traffic trajectories from connected and automated vehicles and uses an early shockwave detection method that tracks changes in the speed distribution of CAVs ( 15 , 19 ). The congestion prediction module identifies the location of the potential traffic congestion (i.e., shockwave) along the targeted freeway segment ( 15 ). Finally, the speed control module determines optimal speed limits ( 20 , 9 ) based on prevailing traffic conditions and broadcasts those limits directly to CAVs upstream of a congestion location. This system has three main design parameters: 1) prediction horizon, 2) broadcasting distance, and 3) speed set. Prediction horizon is the duration (in seconds) before congestion is predicted to happen. Intuitively, prediction accuracy is lower at higher prediction horizons. Broadcasting distance is the distance between the predicted congestion location and the upstream point at which CAVs receive updated speed limits before reaching congestion.
Traffic Monitoring
This module monitors the changes in traffic conditions and shockwave formations along the target freeway segment. As a central system, the module collects trajectories from all CAVs within a freeway segment of interest. It uses the early shockwave detection method developed by Elfar et al. ( 15 , 19 ) which tracks the speed distribution of individual CAVs over small road sections (e.g., 200 m) and time intervals (e.g., 10 s). The widening of the vehicles’ speed distribution measures traffic perturbations ( 21 ), a major contributor to traffic congestion ( 22 ), and is an early indicator of flow breakdown ( 15 , 23 , 24 ). The module monitors two main traffic properties: mean speed and the speed standard deviation (SSD). The mean speed is calculated using Edie’s generalized definition of speed ( 25 , 26 ) according to the following formula:

where
The SSD of individual vehicles is calculated in two steps: 1) the arithmetic mean speed of each vehicle is calculated over the monitoring time interval; 2) the SSD of the average speeds is calculated for each vehicle in the section. Both of these properties are key inputs to the congestion prediction module. In the simulations in this paper, a monitoring time interval of 10 s was set, and the highway was cut into 200-m sections.
Congestion Prediction
This module predicts the location of congestion formation within a short time horizon (10–30 s) along the target freeway segment. The module uses the offline data-driven models developed by Elfar et al. ( 15 ). Those models are trained with historical data before being integrated into the speed harmonization system. It predicts traffic congestion at small sections (e.g., 200 m) of a freeway segment at small time steps (e.g., 10 s) ( 15 ). These models use the mean speed and SSD of individual vehicles estimated by the traffic monitoring module. The reason for choosing those properties only, without relying on traffic flow or density, is because mean speed and SSD can be estimated based on the information from CAVs (i.e., a subset of vehicles on the segment). Therefore, the system can be used at the early deployment of CAV technology when traffic streams are only partially connected.
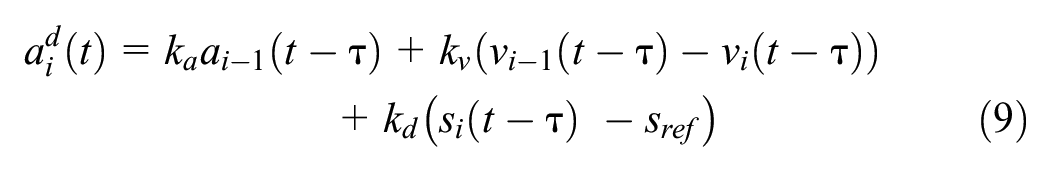
The developed congestion models are temporally lagged models which are a type of time-series model trained to predict future values of the dependent variable by training the model to predict current value using explanatory variable values observed in previous time steps (lagged variables). Therefore, when current values of the explanatory variables are input into the model, future value of the dependent variable is predicted. In this case, the congestion prediction model was built to predict the future traffic state (i.e., a binary variable: congested or not) on a training data set with identified current traffic state and lagged mean speed and SSD values in previous time steps. In addition to temporally lagging SSD, the variable was spatially lagged one section downstream as widening of the speed distribution (increase in SSD) starts downstream of the section where congestion is starting to form. The general formulation of the lagged prediction models is as follows:

where
t denotes time step, and
s denotes section number.
Note that a detailed description of the model can be found in Elfar et al. ( 15 ). In this study, the travel time index (TTI) was used to identify traffic congestion as suggested by Dong et al. ( 27 ). Sensitivity analysis shows that this is a more robust approach to identifying congestion than K-means clustering which was used in the original models by Elfar et al. ( 15 ). The 2016 TTI index of Los Angeles, CA (i.e., 1.7) was used to identify congestion since the original models ( 15 ) were built using actual trajectory data collected in the same city. The TTI for each freeway section is defined as follows:

This study uses the random forests variant of the models. The random forests technique is a variant of the decision-tree supervised machine learning models which predicts the outcome (regression or a classification) by splitting the predictor space into simple regions. This class of machine learning technique is simple and easy to interpret making it a popular choice in data science. The random forests technique improves on the original tree models by building multiple trees (predictors) and inferring the answer from a random sample of those trees, improving accuracy of prediction ( 28 ).
For the purpose of predicting traffic congestion, the technique produces accurate traffic state predictions, needs a relatively short training time, and does not require data scaling or transformation ( 29 ). The random forest models previously tested by Elfar et al. ( 15 ) used actual vehicle trajectories collected through the Next Generation SIMulation (NGSIM) project in Los Angeles, CA ( 30 ). Given the small size of the NGSIM data sample, however, the prediction model used in this study was calibrated using simulated vehicle trajectory data. Those vehicle trajectories were generated for a two-lane highway with one on-ramp at various demand levels (1,000–2,000 vehicles per hour per lane.) using a simulation tool (see the following section for more details). The overall prediction accuracy of the models built for this study ranges from 97% to 99% which is higher than the original models’ accuracy of 89%–93%. This is mainly a result of the larger data set used to train the new models and less heterogeneity in the simulation data. For the simulation in this paper, a prediction horizon of 20 s and a broadcasting distance of 1,000m were used as those were proved to be optimal parameters from the authors’ previous work ( 15 ).
Speed Control
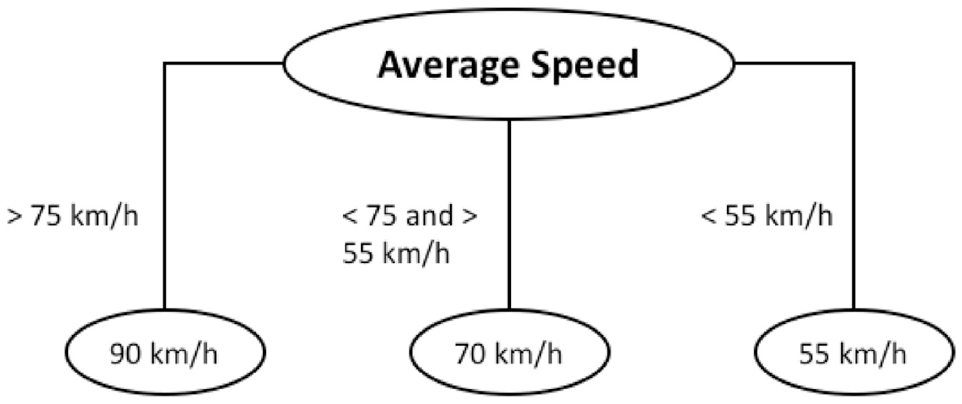
This module determines optimal speed limits to delay or prevent congestion once it is detected by the congestion prediction module and broadcasts the new limits to CAVs at a specific distance upstream of congestion location. For this application, an empirical speed decision tree introduced by Allaby et al. ( 20 ) was adopted. The tree was tested in microscopic ( 9 ) and mesoscopic ( 31 ) simulation applications in previous work. Through this decision tree, the speed is selected based on the mean speed of the freeway section at which congestion is predicted to occur. The original Allaby tree was simplified, as illustrated in Figure 1, to only include the congested case, when the speed control is activated. Note that several more sophisticated speed limit selection algorithms have been introduced. However, this study intends to illustrate that significant improvement in congestion can be achieved, even with a basic speed limit selection algorithm, as long as the congestion prediction model is accurate. Once a new speed limit is set, the module broadcasts it to CAVs at the specified broadcasting distance upstream of congestion location. The potential set of speed limits used in the traffic simulations are 55 km/h, 70 km/h, and 90 km/h.
Fine-Tuning Design Parameters for Optimal Results
The speed harmonization system has three main design parameters: 1) prediction horizon; 2) broadcasting distance; and 3) the set of potential speed limits. The prediction horizon is defined as the time horizon (in seconds) over which traffic congestion is predicted to occur. It is an important because: 1) it determines how early speed harmonization control is implemented; and 2) it affects the accuracy of prediction. Activating speed harmonization too early can slow down traffic unnecessarily and, therefore, offset the expected benefits of the system. Inaccurate predictions, on the other hand, can activate speed harmonization falsely and create additional shockwaves.
The second design parameter is the broadcasting distance which is defined as the distance between the predicted congestion location and a point upstream of that location at which CAVs receive updated speed limits (advisory messages) by the SPDHRM system. While the broadcasting distance itself is fixed, the location of the broadcasting area depends on the location of the predicted congestion, which can occur anywhere on a freeway segment. This parameter is the key to the predictive system’s performance as it affects the distance over which incoming traffic is transitioning to a slower speed (lowering flow rate) before reaching the congestion point and thus, the smoothness of transition. For example, slowing vehicles too far from the congestion location or too close may hinder the effectiveness of the strategy.
The final design parameter is the set of potential speed limits that can be selected by the system to be broadcast to CAVs once congestion is predicted. This parameter affects the rate at which incoming traffic is transitioning to a different speed and the overall speed of traffic.
CAV Traffic Microsimulation Tool
To test the effectiveness of the SPDHRM system for multiple operational scenarios, the system’s logic was integrated into a CAV traffic microsimulation tool that was built using the open-programming language, Python. The tool extends the CAV acceleration framework developed by Talebpour et al. ( 18 , 32–34) by introducing a CAV traffic monitoring component based on the methodology discussed earlier and a congestion prediction component based on the machine learning models developed by Elfar et al. ( 15 ). For the purposes of this study, two distinct driving behaviors were used in the CAV tool: connected/human and automated driving behaviors. Below is a description of the acceleration models that capture those driving behaviors.
Modeling Connected and Human Vehicles
Connectivity extends drivers’ perceptions of their surrounding environment beyond visual scanning of isolated drivers, leading to more responsive driving behavior ( 35 ). The information connected drivers receive can be related to the movement of vehicles ahead (e.g., speed and acceleration) which increases drivers’ awareness and perception. It can also be related to traffic conditions (e.g., congestion or weather conditions) that may affect drivers’ strategic choices such as route choice or departure time. To capture the changes in driving behavior caused by connectivity, the CAV simulation tool uses the intelligent driver model (IDM) ( 36 , 37 ).
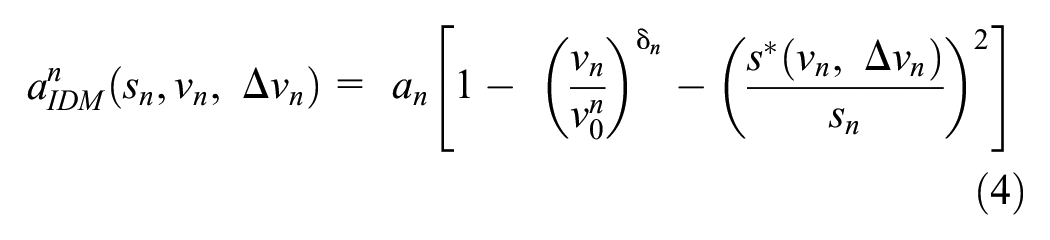
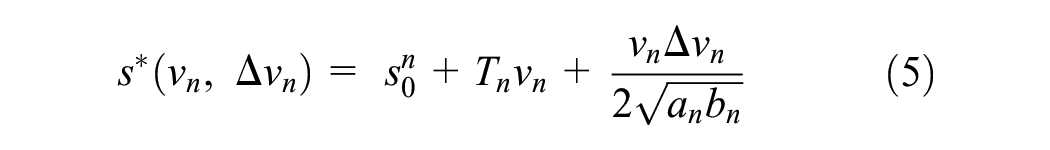
IDM is a deterministic model that defines a vehicle’s acceleration as a continuous function of two parts: 1) the ratio of the vehicle’s current speed to its desired speed; and 2) the ratio of the current spacing to the desired spacing. The first part controls the vehicle’s behavior in free flow traffic situations while the second part controls its behavior in car-following mode. The model also considers perceptive parameters that can vary between drivers such as gap size and comfortable acceleration/deceleration. The IDM formulation is described below:
where
Those are the parameters to be calibrated.
Human vehicles were also modeled using the IDM model described above as this was the main use case when IDM was introduced. The main difference however is that human drivers do not receive any information from the speed harmonization system, and therefore their behavior is solely governed by the information they perceive from surrounding vehicles and traffic conditions. This is unlike connected vehicles that directly receive updated speed limits from the speed harmonization system which affects their behavior (speed, acceleration, etc.)
Modeling Automated Vehicles
Modeling automated vehicles considers two key features of the technology: 1) its ability to monitor other vehicles and entities in its surroundings using in-vehicle sensors, and 2) its ability to respond promptly to any changes in its environment. To capture those features, the CAV microsimulation tool employs a deterministic acceleration model developed by Talebpour and Mahmassani ( 35 ) that takes into account automated vehicle (AV) sensor range. The model formulations are presented below.
The maximum safe speed that is required for an automated vehicle to fully stop once its sensor detects an obstacle is calculated as follows:
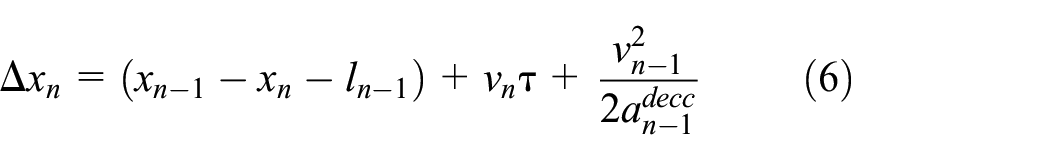


where
The automated vehicle movement is modeled as follows:
where
(
In this study, minimum distance is set at 2.0 m and


Finally, the acceleration of the automated vehicle is calculated using the following equation:

where
Modeling Lane-Changing Behavior
The paper used the general car lane-changing model, MOBIL, developed by Kesting et al. ( 39 ), Treiber and Helbing ( 40 ) and Treiber and Kesting ( 41 ). MOBIL (minimizing overall braking induced by lane changing) provides rules for both mandatory and discretionary lane changes for a wide range of vehicle classes (cars, trucks, commercial vehicles [CVs], AVs, etc.). The model evaluates an incentive to change lanes based on acceleration behavior of vehicles, within a set safety criterion. It also introduces a politeness factor to capture the advantages or disadvantages of lane changes on surrounding drivers. The parameters used for this model are based on the recommendations of Treiber and Kesting ( 22 ): safe deceleration 2 m/s 2 , changing threshold 0.1 m/s 2 , politeness factor of 0.1.
Results and Analysis
This section examines the impact of predictive speed harmonization on traffic flow performance and travel time for multiple operational scenarios of a 5-km long two-lane highway segment with an on-ramp that is located 3 km from the start of the section. The traffic flow volume on main lanes is 3,000 vehicles per hour (vph), and ramp volume is 500 vph. To do so, multiple performance measures were generated for the tested scenarios including flow-density diagrams, travel time distributions, speed distributions, and speed contours. Those graphs were generated for a target segment, a freeway section 500-m upstream of the merging section to capture traffic congestion and stop-and-go behavior. The simulated scenarios below evaluate the effectiveness of the predictive speed harmonization system in fully and partially connected traffic streams. The scenarios also test the system’s performance and mixed traffic conditions (i.e., with automated vehicles). Note that in all of these scenarios, except for the partial connectivity one, all vehicles in the traffic stream are assumed to be connected. Furthermore, market penetration percentages in the simulations represent a combination of compliance rate and CAV availability. For example, if 60% of traffic is connected, but only 50% complies with speed limits, the effective CV market penetration would be 30%. However, only effective market penetration has been reported for simplicity. It is also assumed that AVs fully comply with the updated speed limits given their robotic nature. The authors also added randomness to the simulations by conducting multiple simulations with different seeds. Randomness was introduced for generating vehicles at the start of each simulation (which vehicles are human, CV, and AV), the initial speeds of each vehicles, and which lanes they use to enter into simulation.
Impact of the Predictive Speed Harmonization System on Traffic Performance
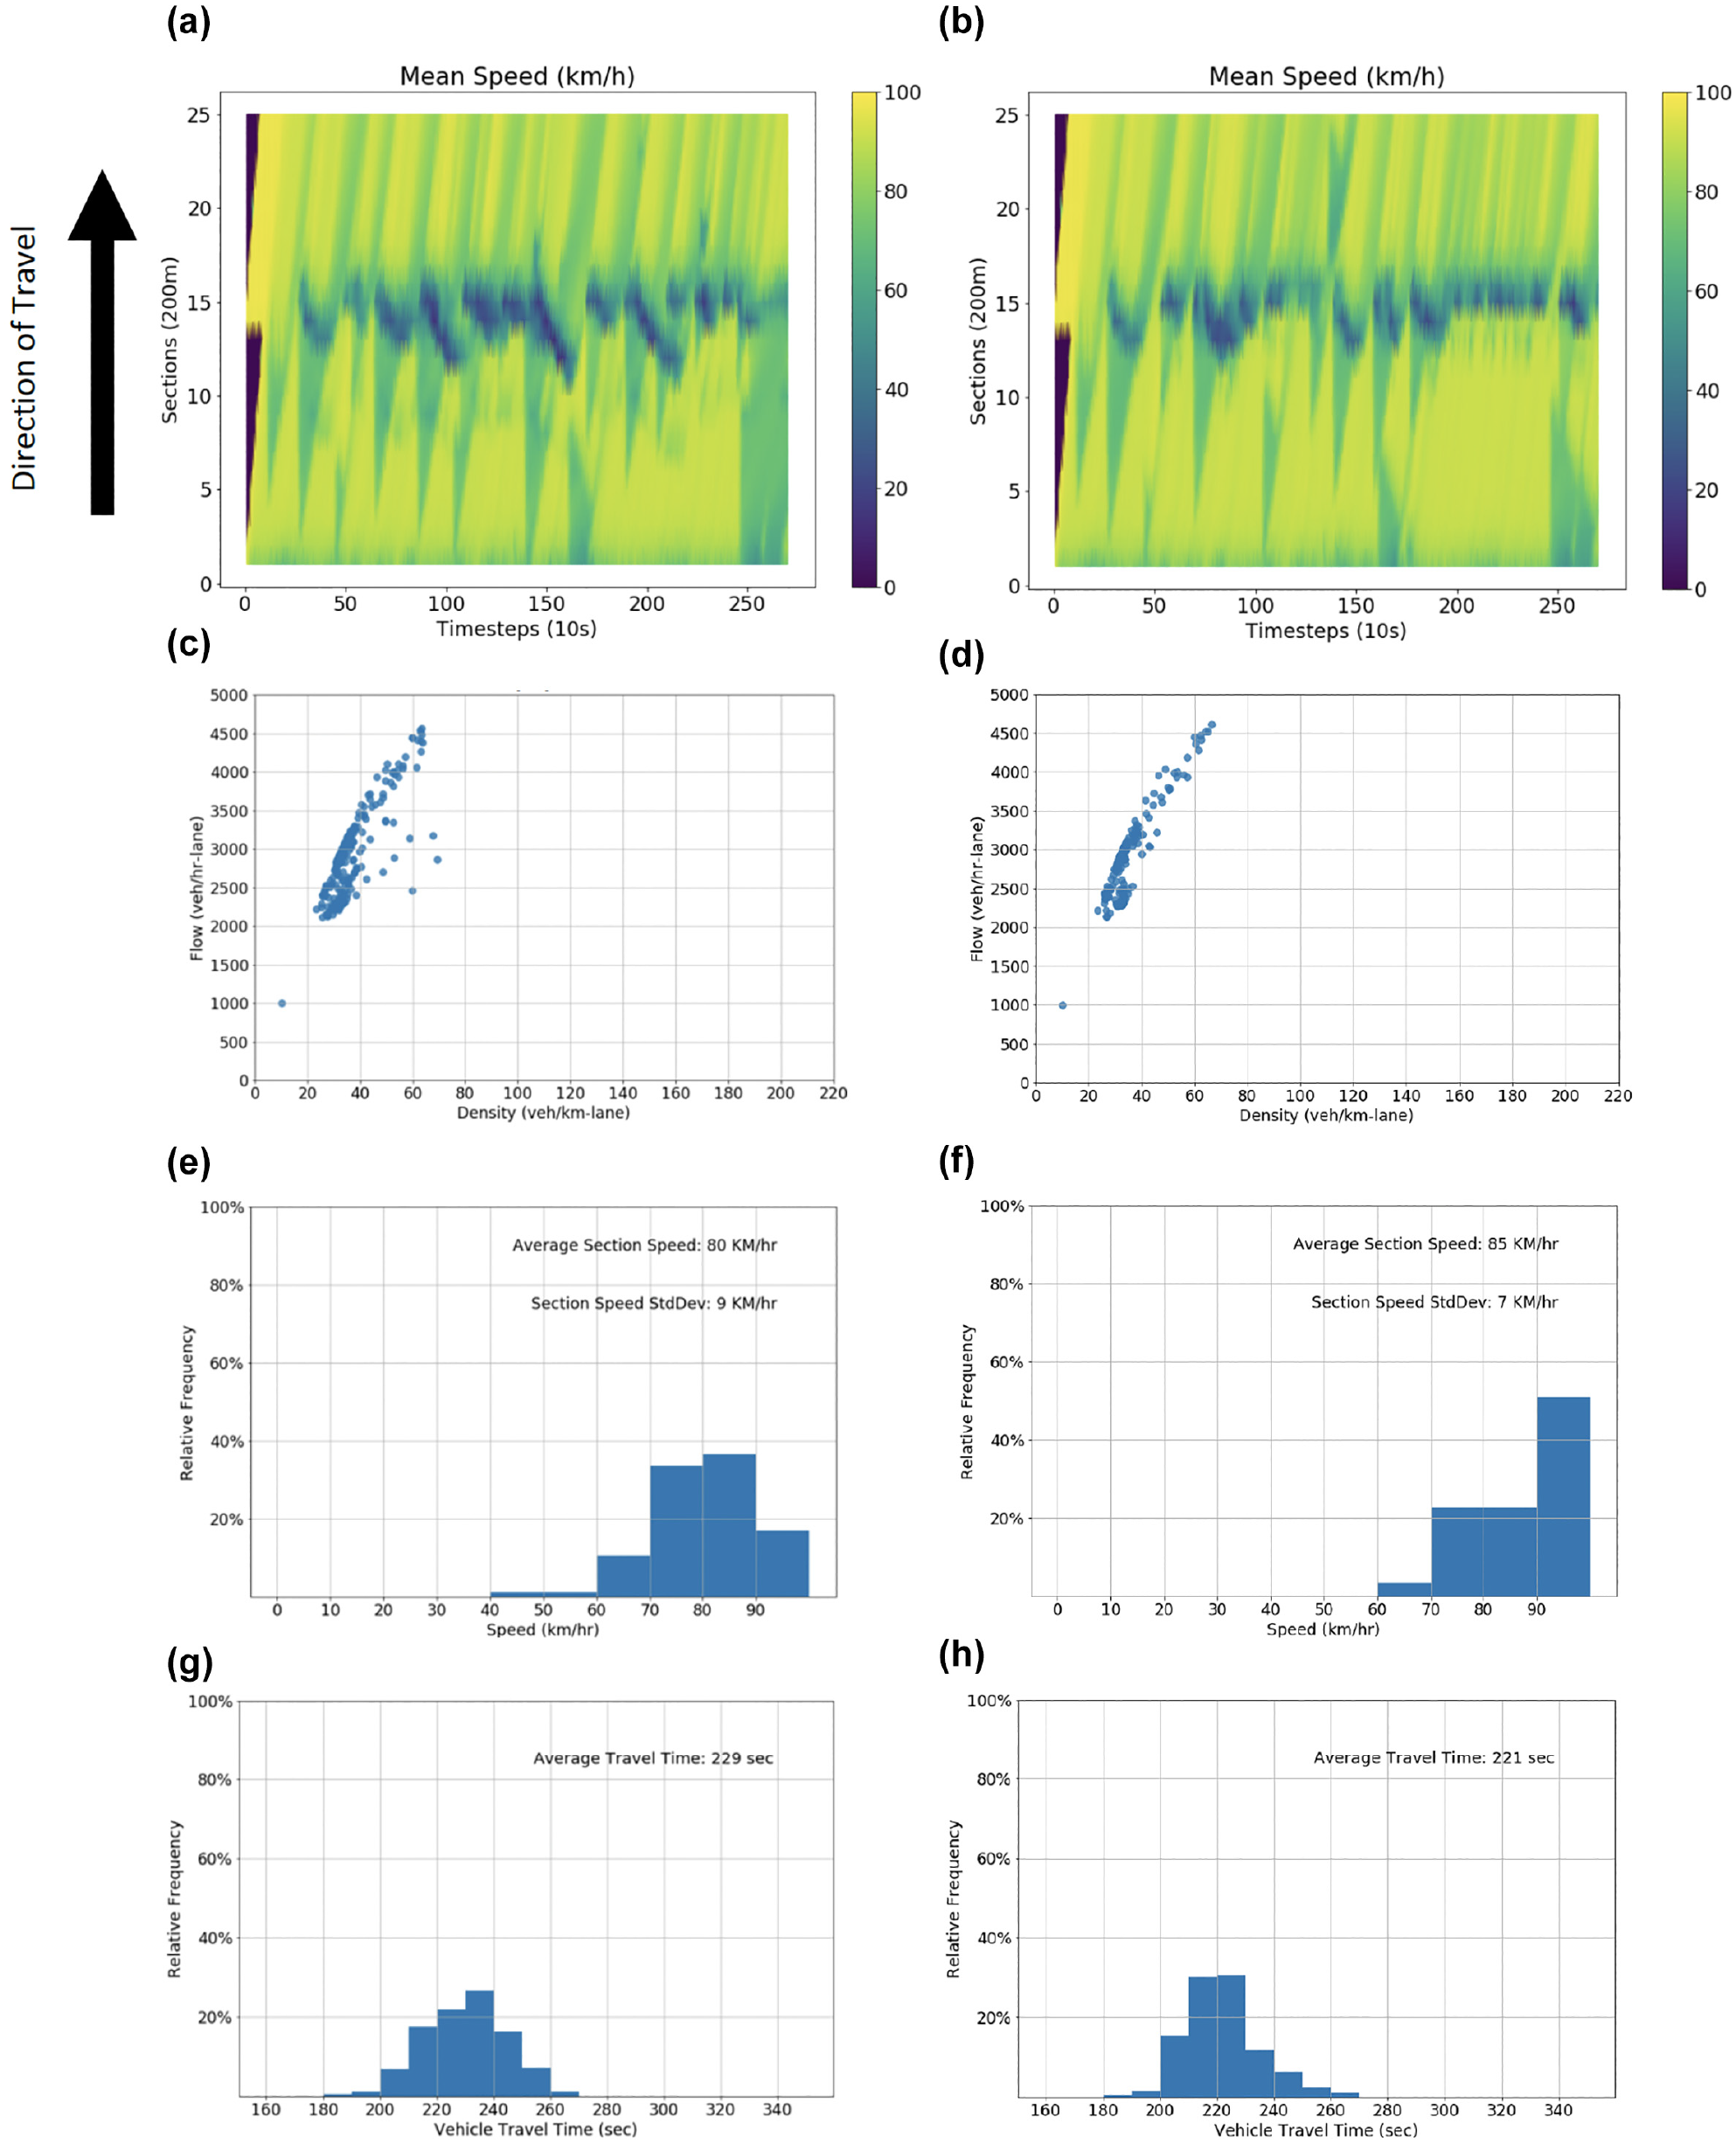
Figure 2, a and b , shows the impact of activating the speed harmonization system on traffic shockwave formation. All vehicles in this simulation are connected human-driven vehicles. The speed-contour graphs illustrate the temporal and spatial evolution of speed in the target segment. As discussed in the methodology, the segment is divided into small sections (200 m each) and speed in each section was measured at 10-s time intervals. The dark blue lines illustrate the formation of traffic shockwaves, a significant drop in speed that propagates (upstream in this case) over time and space. Figure 2a shows the base case scenario where SPDHRM is not activated. As seen in Figure 2, a and b , shockwaves start forming near the merging point in section 16 where traffic is disrupted by the additional volume of traffic entering main lanes from the on-ramp and the difference in speed of merging vehicles. Activating the system reduces the severity and length of traffic shockwaves, as seen in Figure 2b, thereby improving the stability and safety of the traffic stream. This is because the SPDHRM system temporarily reduces traffic inflow upstream of congestion, thereby keeping the flow rate below breakdown point and reducing the variation in vehicle speeds.
Figure 2, c and d , depicts the impact of the SPDHRM system on traffic flow stability and breakdown. The flow-density diagram for the base case in Figure 2c shows that traffic breakdown, referring to the significant drop in flow, occurs around 80 veh/km density. This is caused by traffic perturbations generated at the merging point and volumes reaching segment capacity. Activating the SPDHRM system prevents traffic breakdown in this case as seen in Figure 2d, where significant flow drops are eliminated. The system also improves the stability of traffic as indicated by less scatter in blue dots.
Figure 2, e and f , illustrates the impact of the SPDHRM system on the speed distribution of the target segment. The speed distribution of vehicles in Figure 2f shows that activating the system increases the overall average speed of the segment while also reducing the variation in speed compared with the base case in Figure 2e. This indicates that the SPDHRM system improves speed homogeneity in the segment, the harmonization part of the system, as the continuous updating of speed limits helps vehicles drive at homogenous speeds.
Figure 2, g and h , shows the impact of the predictive SPDHRM system on vehicles travel time in the main lanes of the target segment. The travel time distribution in Figure 2h indicates that activating the system reduces the average travel time per vehicle compared with the base case in Figure 2g. This is an expected reduction given that the overall speed of the segment is improved, and the severity of shockwaves is minimized.
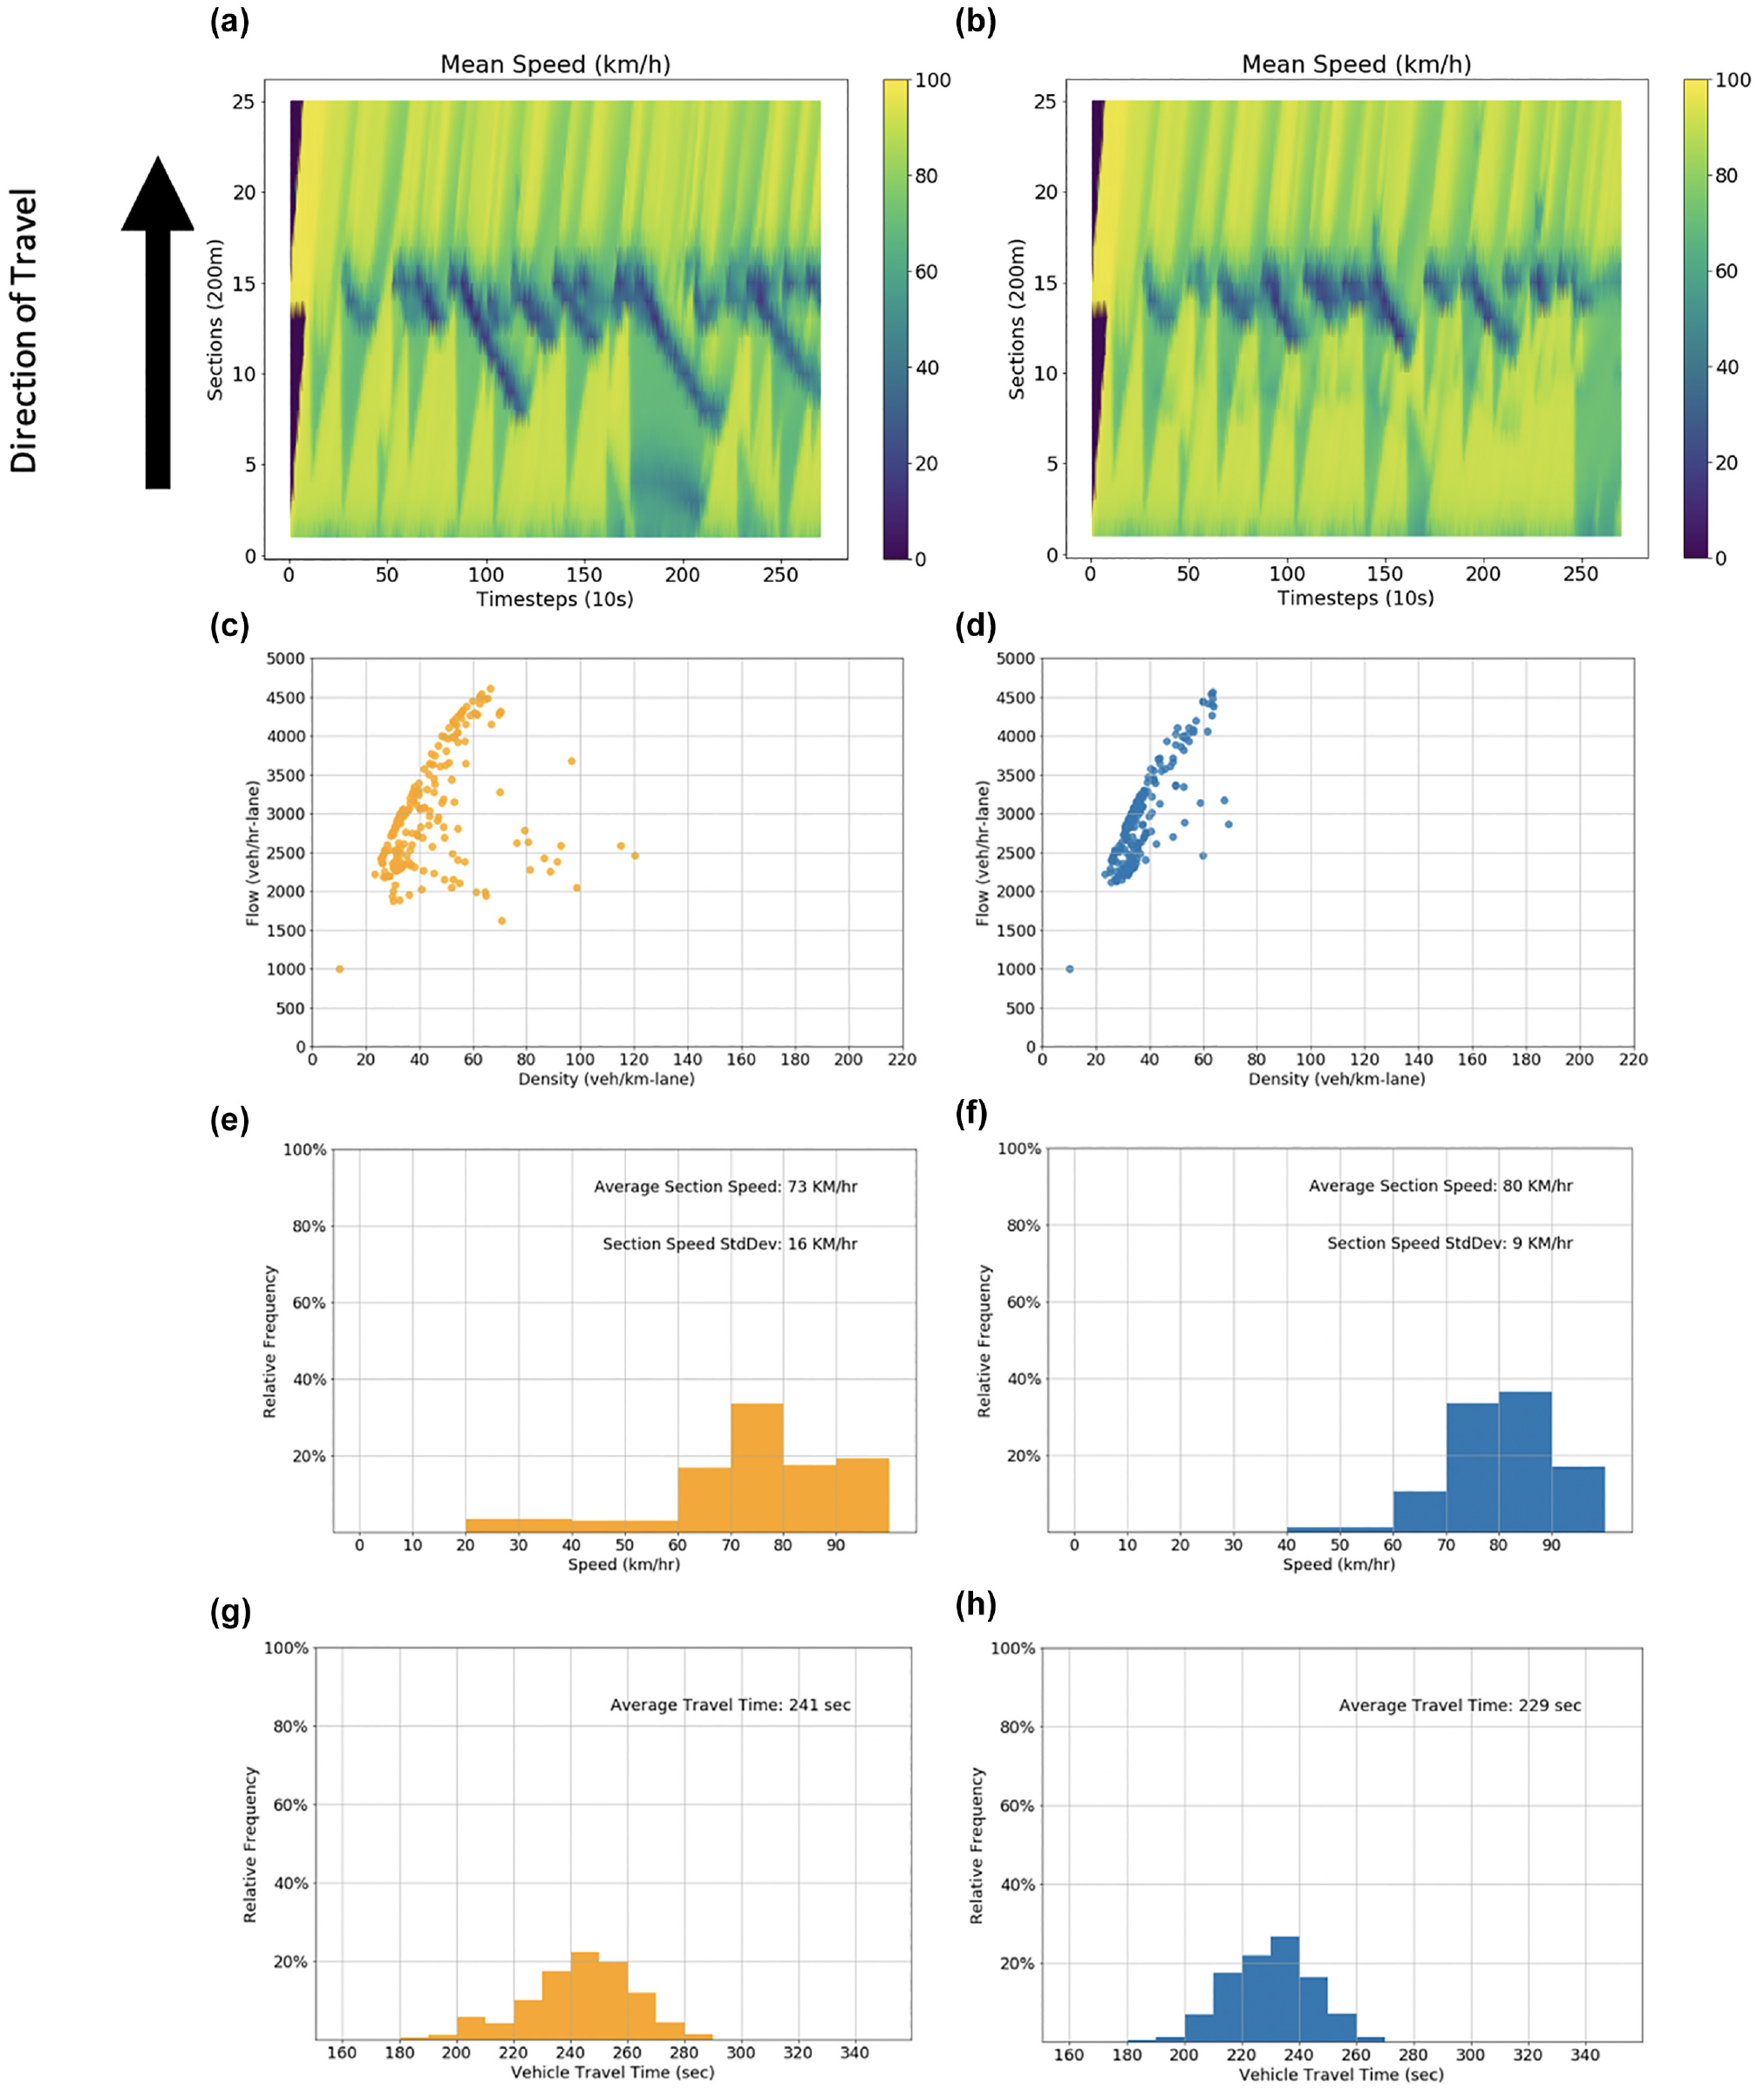
Impact of the speed harmonization system on traffic performance: (a, b) impact on traffic shockwave formation (a) base case, (b) active SPDHRM; (c, d) impact on traffic flow stability and breakdown (c) base case, (d) active SPDHRM; (e, f) impact on segment speed distribution (e) base case, (f) active SPDHRM; (g, h) impact on vehicle travel times (g) base case, (h) active SPDHRM, broadcasting distance 1,000 m, prediction horizon 20 s.
System Performance in Partial Connectivity Conditions
The previous simulations assume that all vehicles are able to broadcast their trajectories and receive advisory messages through the predictive speed harmonization system (full connectivity). In a real-world application, however, the traffic stream will be partially connected, at least at the early deployment of the technology. Therefore, this section tests the performance of the predictive control system for partially connected traffic streams to evaluate its applicability in the short term. Note that similar to the previous case, all vehicles (connected or not) are being operated by human drivers.
Connectivity affects the performance of the system in two major ways: 1) it affects the amount of data received by the traffic management center (TMC) which affects the accuracy of congestion prediction; and 2) connectivity affects the percent of vehicles in the traffic stream that would be able to receive updated speed limits and, therefore, the overall traffic compliance with the new limit can increase. As for prediction, results presented by Elfar et al. ( 15 ) show that the machine-learning–based predictive models require at least 30% connectivity to produce meaningful congestion predictions which generally have an accuracy above 90%. They also show that the marginal prediction improvement at high connectivity levels (market penetrations) is minimal. In this analysis, 30% connected traffic means that only 30% of vehicles are able to send out their trajectories to the TMC and receive updated speed limits throughout the simulation.
Figure 3 shows the implications of partially connected traffic on the performance of the speed harmonization system for three cases: base (0% Figure 3, a and f ), low connectivity (40% Figure 3, b and e ), and high connectivity (80% Figure 3, c and f ). Results show that the effectiveness of the speed harmonization system improves with higher connectivity as indicated by less scatter of the fundamental diagram and the shift toward lower values in the travel time distribution. The reason for this improvement is that more vehicles receive the updated speed limit, which minimizes potential traffic disruption by partially slowing down upstream traffic. These findings confirm previous findings of the impact of connectivity on speed harmonization performance at both facility ( 9 ) and network level ( 31 ).
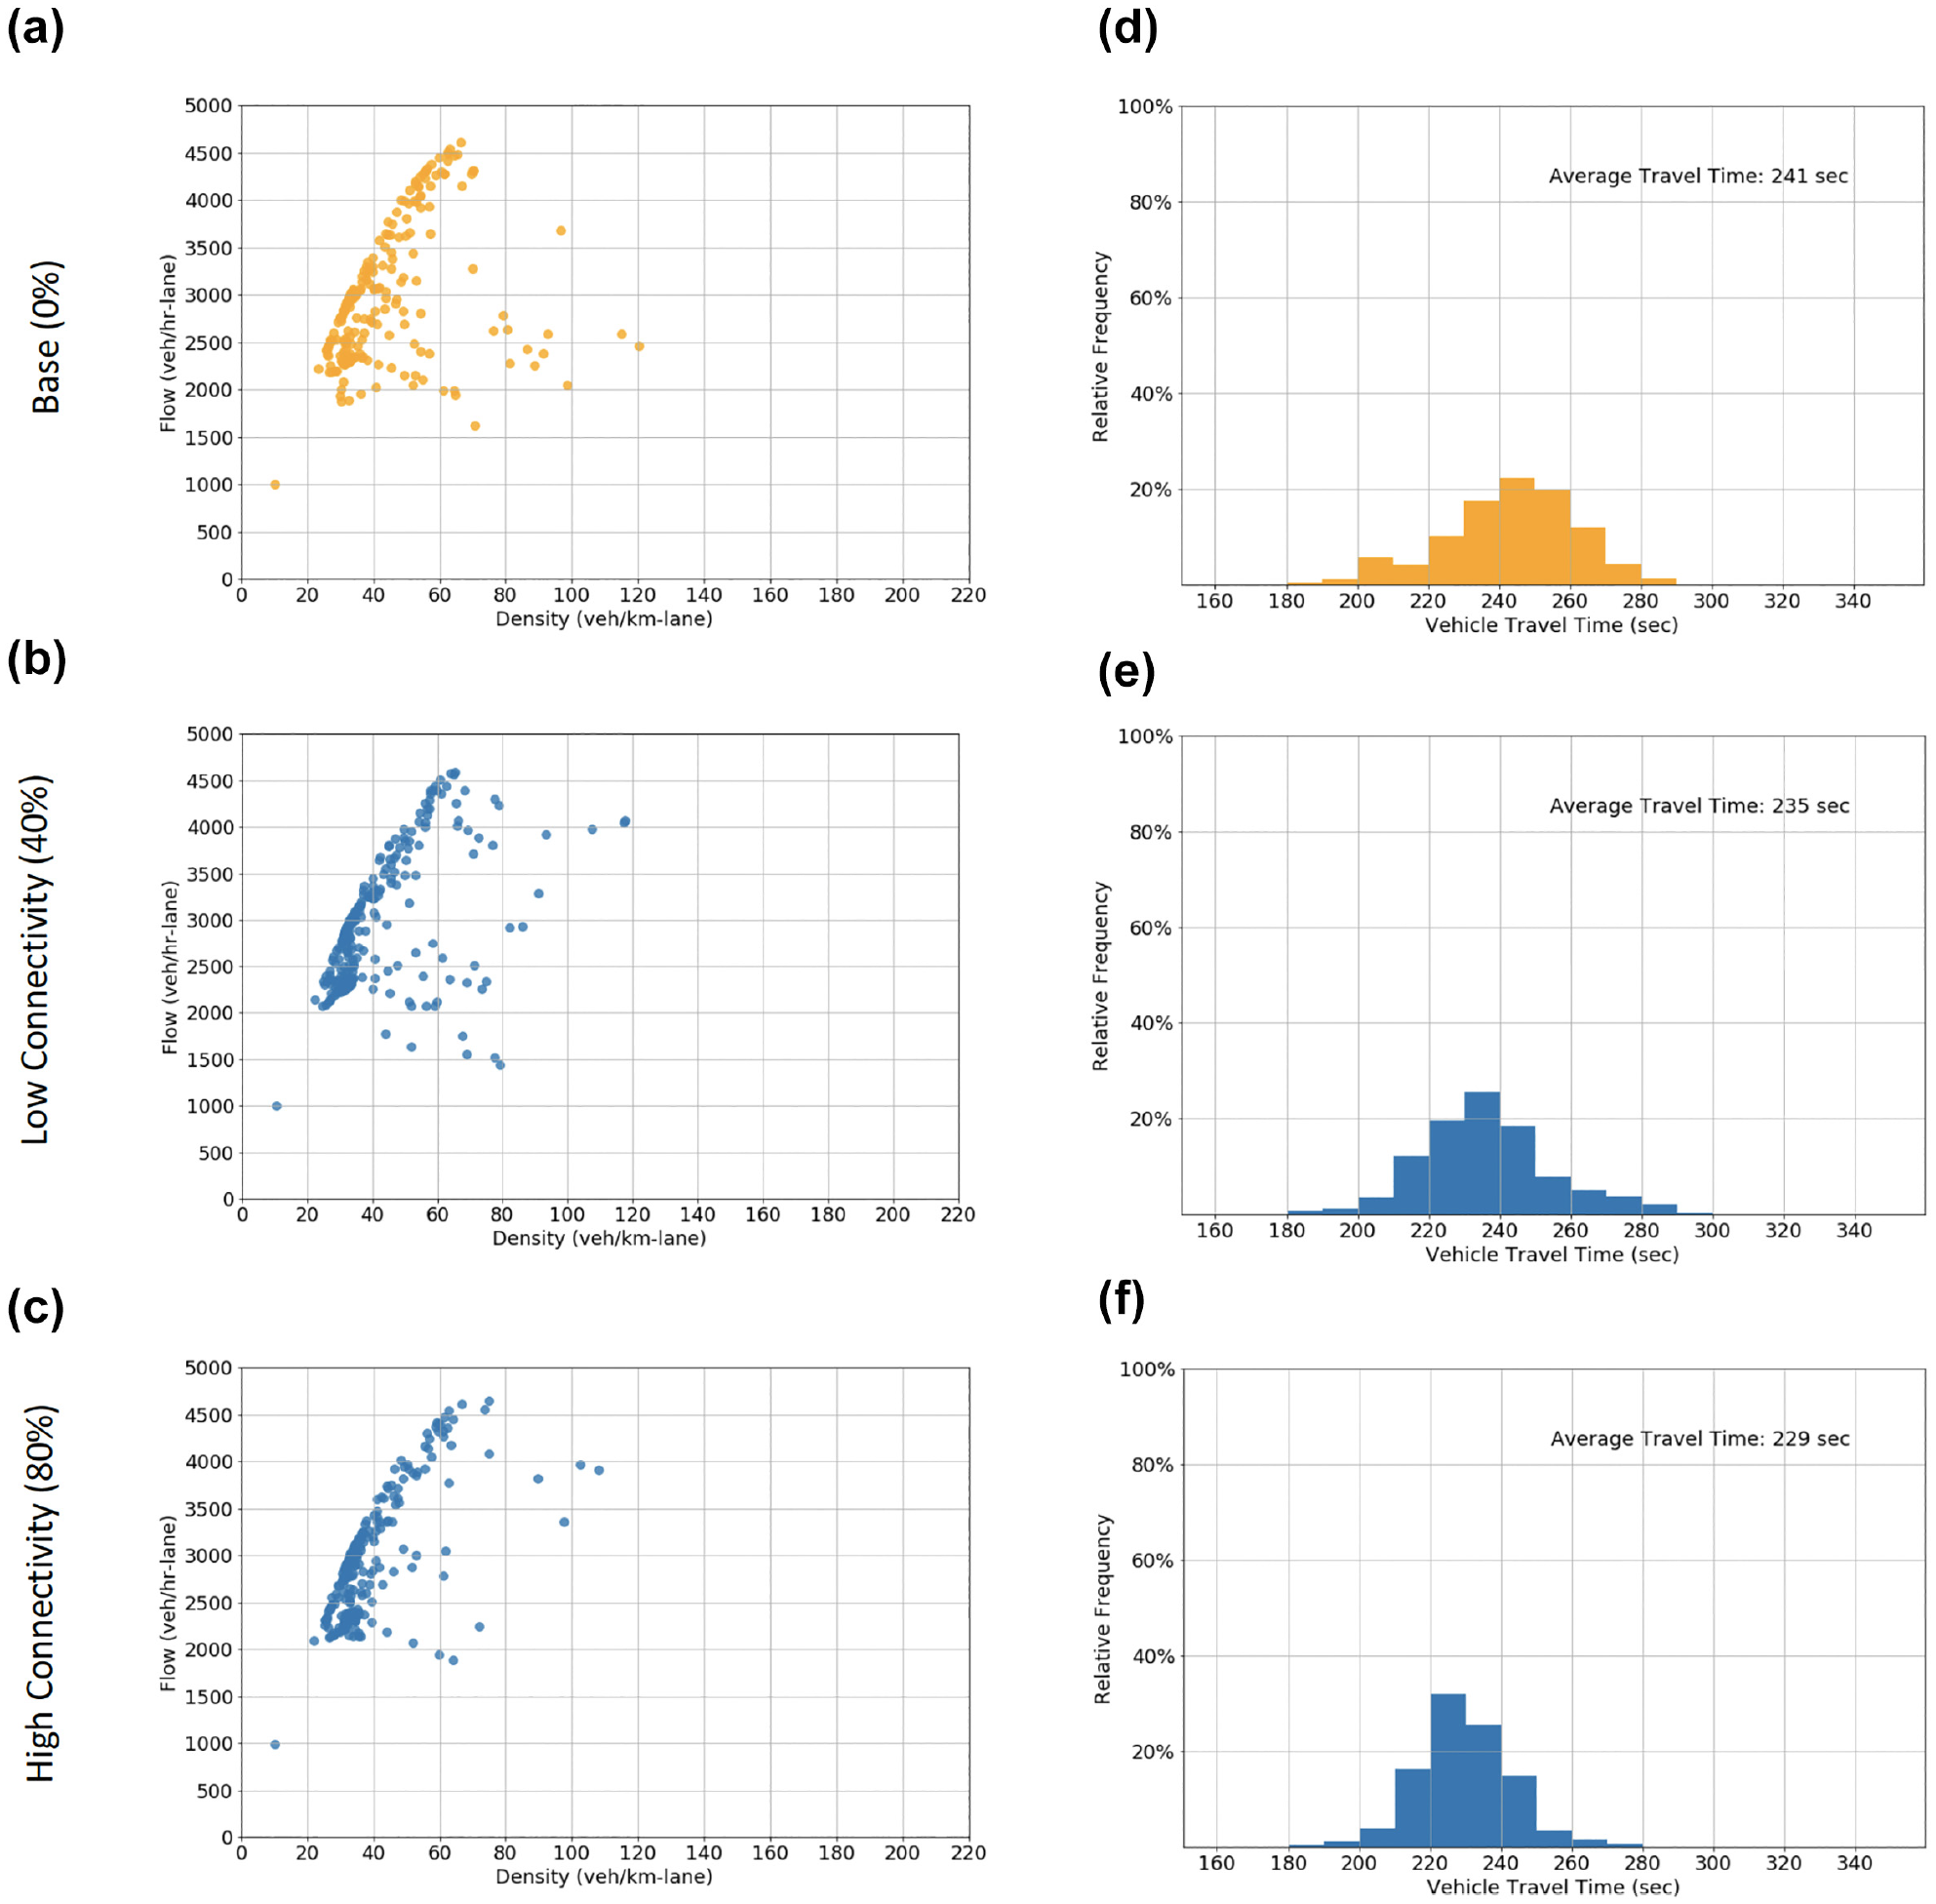
Impact of partial connectivity on the SPDHRM performance: (a–c) flow-density diagrams for 0%, 40%, and 80% CV market penetration respectively; (d–f) travel time distributions for 0%, 40%, and 80% CV market penetration respectively, broadcasting distance 1,000 m, prediction horizon 20 s.
System Performance in Mixed Traffic Conditions
In a connected environment, traffic streams are likely going to be of mixed vehicle classes and driving behaviors especially with the introduction of automated vehicles. The development of CAVs is accelerating at an unprecedented rate; therefore, it is essential for any new traffic control strategy to account for this emerging driving behavior. To that end, this section tests the effectiveness of the predictive speed harmonization strategy at different market penetrations of CAVs: base, no automation (0%), low automation (30%), and high automation (70%).
Automated driving behavior is robotic in nature and, therefore, inherently different from human driving behavior ( 18 , 35 , 42–44). It relies on in-vehicle sensors, high processing power, and programmed rules for environment perception rather than human judgment. This can make it safer and more stable than human driving. The adopted acceleration framework in this study uses a CAV car-following model introduced by Talebpour and Mahmassani ( 45 ). This model is based on previous simulation studies by Van Arem et al. ( 38 ) and Reece and Shafer ( 46 ). The CAV model considers two main factors: 1) the ability of CAVs to constantly monitor other vehicles in their vicinity, which can result in a deterministic behavior in dealing with other drivers’ behavior; and 2) their ability to react almost instantaneously to any changes in the driving environment. Note that, in this simulation set-up, CAVs do not communicate directly with each other (e.g., no cooperative adaptive cruise control system in effect) and communication is limited to infrastructure to receive updated speed limits.
Figure 4 shows the effectiveness of the proposed speed harmonization system in low automation traffic conditions (30% AV). To control for the impact of the more stable driving behavior of CAVs, this figure plots the flow-density diagram and travel time distribution for the low automation traffic case with and without activating the SPDHRM system. This would help show whether the improvement in traffic is a result of the robotic driving behavior of AVs or the speed harmonization system. Figure 4, b and e , shows that CAV driving behavior by itself improves traffic performance by increasing traffic stability (less scatter in flow-density diagram) and lowering travel time compared with the base case in Figure 4, a and d . Activating the speed harmonization system, however, further improves traffic performance as seen in Figure 4, c and f . This improvement is a result of controlling the speed of CAVs to improve congestion and the additional stability that AVs bring to traffic at low market penetrations.
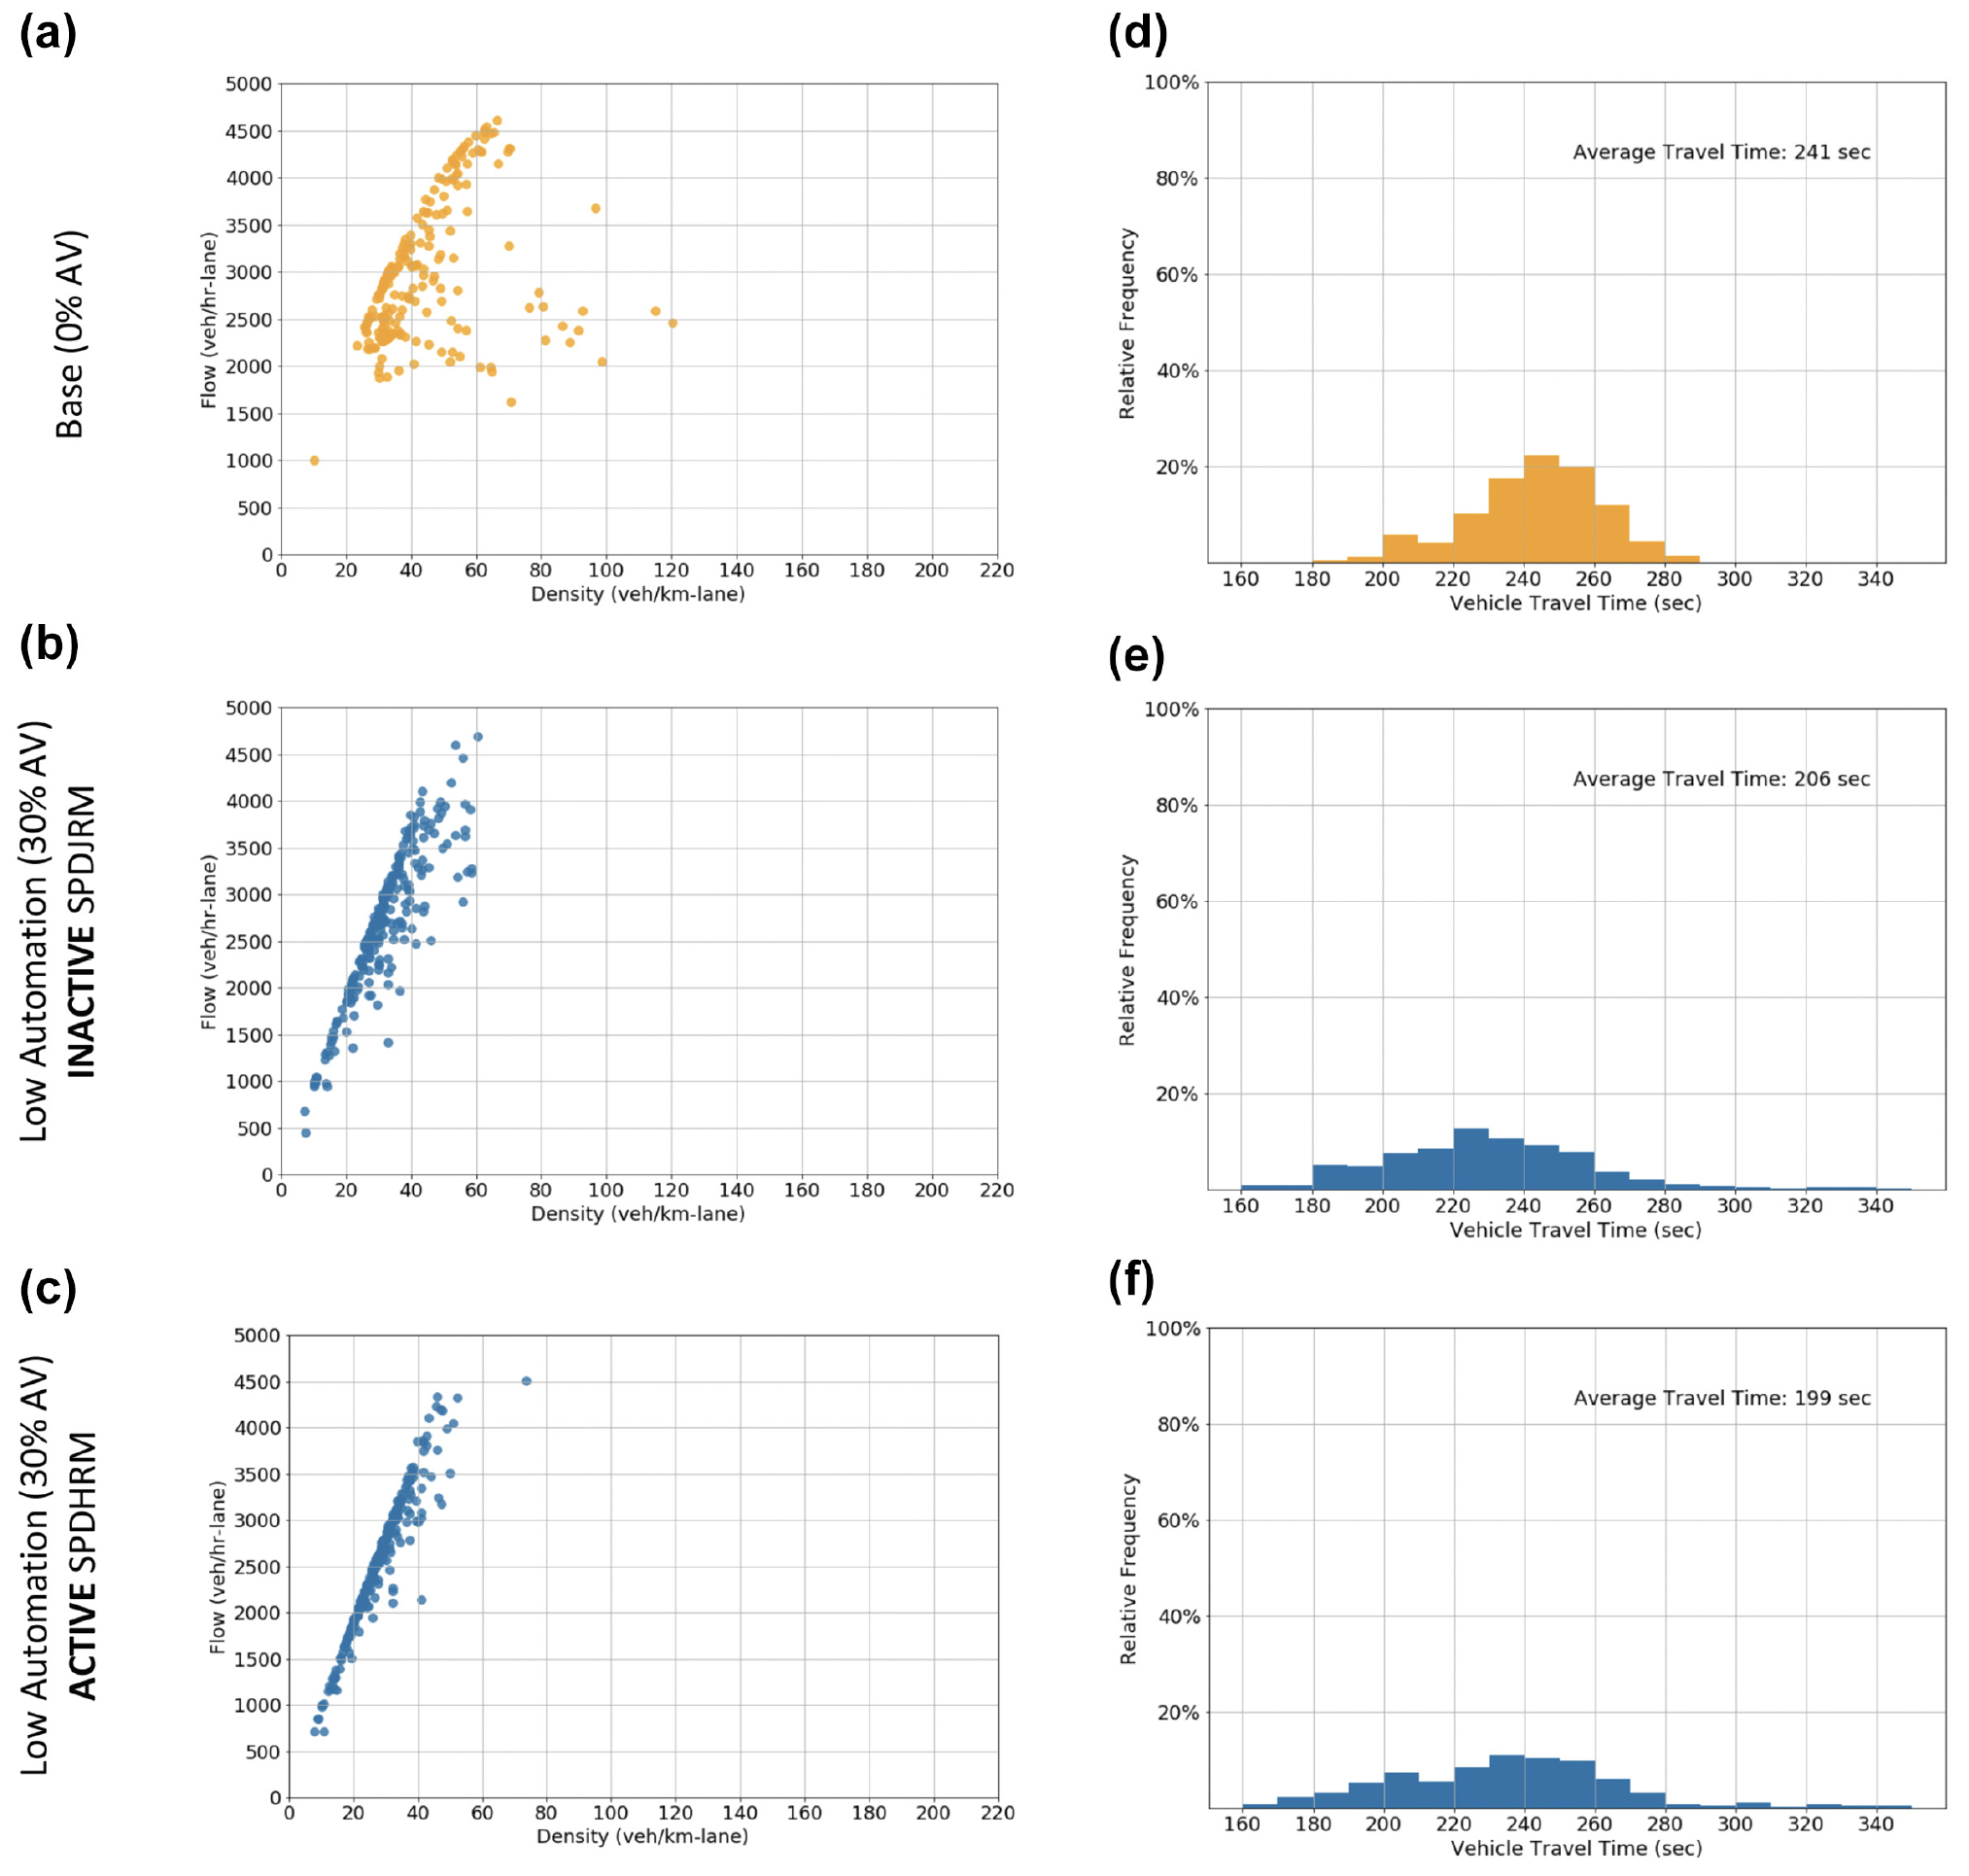
Effectiveness of the SPDHRM system in mixed traffic environment with low automation: (a, d) flow-density diagram and travel time distribution at 0% CAV MPR with INACTIVE SPDHRM; (b, e) flow-density diagram and travel time distribution at 30% CAV MPR with INACTIVE SPDHRM; (c, f) flow-density diagram and travel time distribution at 30% CAV MPR with ACTIVE SPDHRM, broadcasting distance 1,000 m, prediction horizon 20 s.
Figure 5 shows the effectiveness of the predictive SPDHRM system in the high automation traffic case (70% AV). Figure 5, b and e , shows that a high market penetration of CAVs significantly improves traffic stability and reduces travel time without activating the SPDHRM system. Moreover, Figure 5, c and f , shows that the SPDHRM system was not activated at all as seen in the identical graphs to Figure 5, b and e . This is a result of the dominant driving behavior of CAVs, which substantially stabilize traffic and prevent shockwaves.
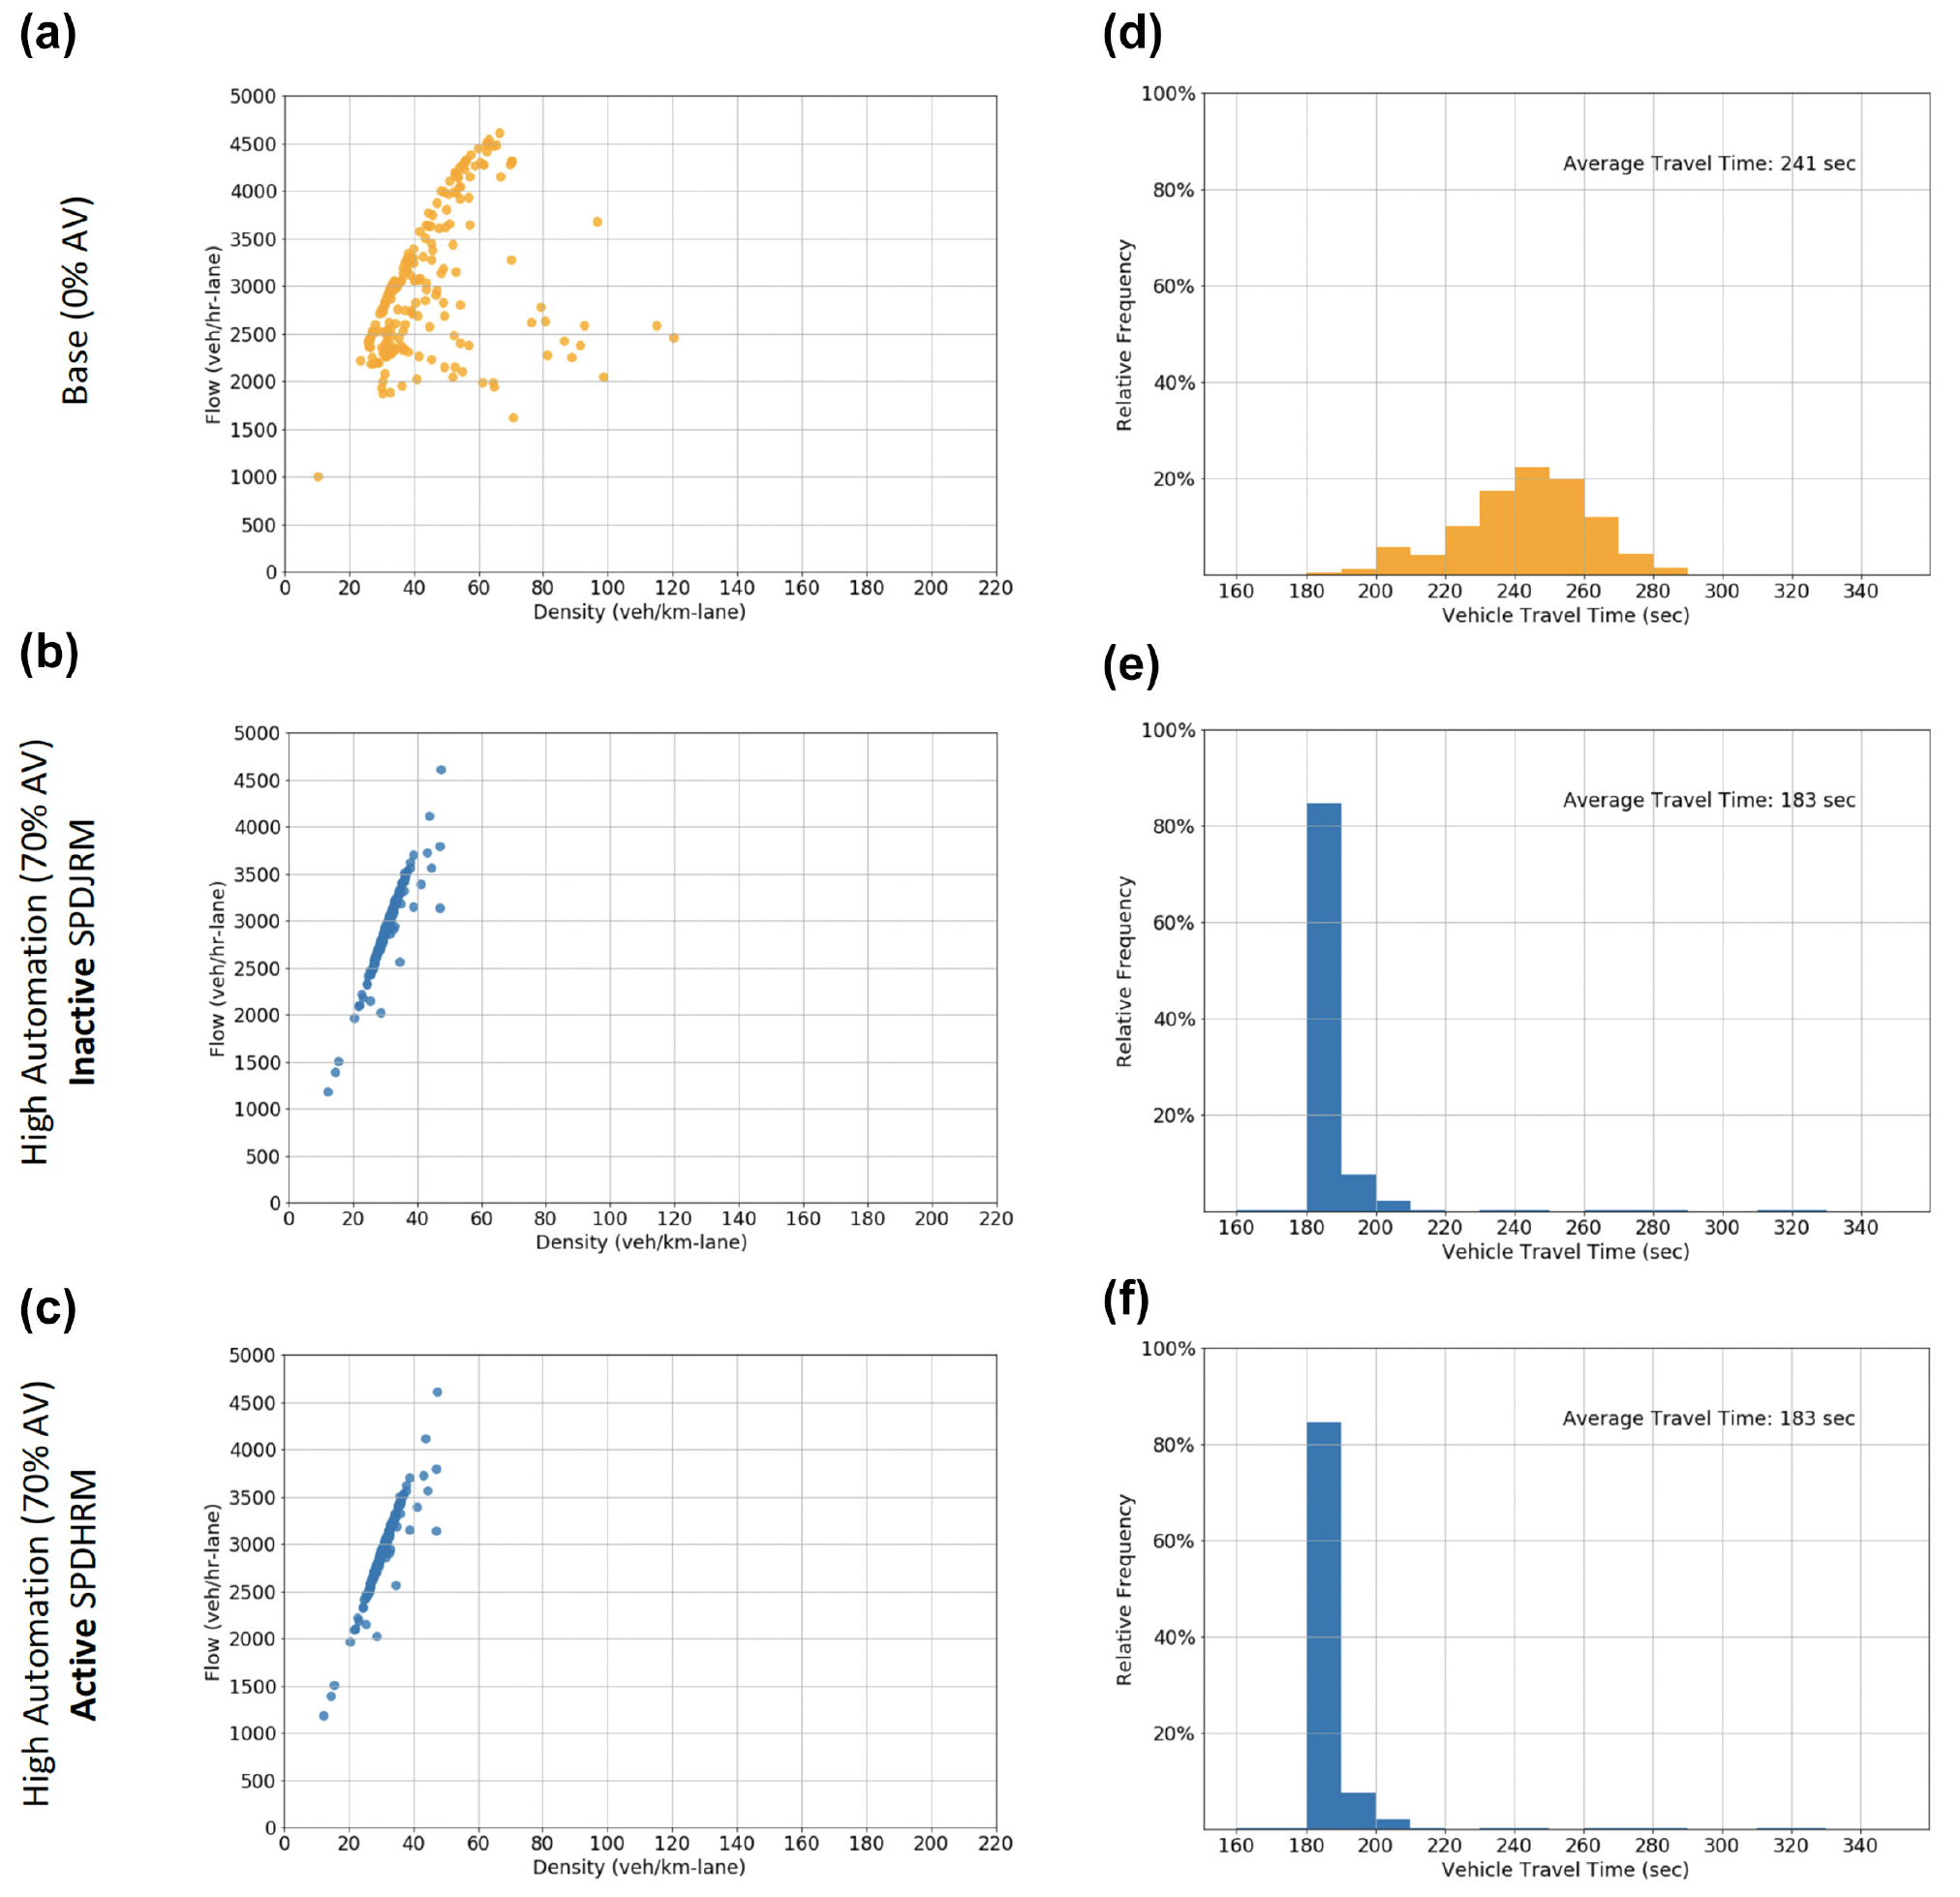
Effectiveness of the SPDHRM system in mixed traffic environment with high automation: (a, d) flow-density diagram and travel time distribution at 0% CAV MPR with INACTIVE SPDHRM; (b, e) flow-density diagram and travel time distribution at 70% CAV MPR with INACTIVE SPDHRM; (c, f) flow-density diagram and travel time distribution at 70% CAV MPR with ACTIVE SPDHRM, broadcasting distance 1,000 m, prediction horizon 20 s.
Optimization-Based Speed Control
In previous tests, the three main design parameters: 1) prediction horizon, 2) broadcasting distance, and 3) the set of potential speed limits were assumed to be fixed throughout the duration of the strategy application (prediction horizon = 20 s, broadcasting distance = 1,000 m, and speeds set = [90, 70, 55 km/h]). Please refer to the methodology section for details on the design parameters. Such a setting, however, does not lead to optimal performance as the effectiveness of those parameters depends on the dynamic traffic conditions. To that end, an optimization-based formulation is introduced below to select speed limits and broadcasting distance to maximize overall traffic speed, which, in this context, minimizes overall travel time. The prediction horizon was set to 20 s since all previous simulations showed that value to be optimal and to simplify the optimization problem.
Optimization Formulation for the Speed Control Module
Maximize:

Subject to:
Speed limit set:

Broadcasting distance set:

The objective function maximizes the distance traveled
Performance Comparison: Optimization-Based versus Decision-Tree Speed Control
Figure 6 compares the performance of the optimization-based control strategy with the performance of the speed decision-tree control strategy. To do so, a two-lane highway with one on-ramp was simulated for both strategies. The predefined speed limits for the optimization-based control were
Figure 6, a and b , shows traffic shockwave formations when the SPDHRM system is activated for both control strategies. Using the optimization-based approach further reduces the severity and length of traffic shockwaves as seen in Figure 6b compared with the decision-tree approach in Figure 6a. There are two reasons for this improvement. First, the optimization-based strategy selects an optimal speed limit from a wider set of speeds which leads to a smoother transition of incoming (upstream) flow to mitigate congestion. Second, the optimization strategy selects an optimal broadcasting distance dynamically which ensures that vehicles have enough distance to transition to different speed values. Figure 6, c and d , compares traffic stability for both control strategies. The flow-density diagram in Figure 6d shows that the optimization-based control improves the stability of traffic as is evident from the less scatter in the diagram compared with Figure 6c. The improvement in stability is a result of the smoother transition of upstream traffic in the case optimization-based control. Figure 6, e and f , compares the overall traffic speed for both control cases. The speed distribution in Figure 6f shows that optimization-based approach increases the overall traffic speed and reduces its variation. This is expected given that the objective function in the optimization formulation maximizes traffic speed. Finally, Figure 6, g and h , shows the impact of both control strategies on vehicle travel times in main lanes. The travel time distribution in Figure 6h shows that the optimization-based approach leads to lower average travel time for vehicles. This is also expected given that maximizing speed leads to lower travel times.
Performance comparison—optimization-based versus decision-tree speed control: (a, b) traffic shockwave formation patterns: (a) speed decision tree, (b) optimization-based speed control; (c, d) flow-density diagrams: (c) speed decision tree, (d) optimization-based speed control; (e, f) speed distributions: (e) speed decision tree, (f) optimization-based speed control; (g, h) travel time distributions: (g) speed decision tree, (h) optimization-based speed control.
Conclusion and Future Work
This paper presented a predictive speed harmonization system that relies on a TMC to collect information from CAVs within a road segment of interest, predict traffic congestion location, and broadcast updated speed limits to CAVs upstream of that location to mitigate congestion. The system consists of three main modules: 1) traffic monitoring, 2) congestion prediction, and 3) speed control. The traffic monitoring module collects detailed traffic trajectories from CAVs and uses the early shockwave detection method that tracks changes in speed distribution of CAVs. The congestion prediction module identifies the location of the predicted traffic congestion anywhere on the targeted freeway segment. Finally, the speed control module determines optimal speed limits to mitigate congestion based on prevailing traffic conditions and broadcasts those limits directly to CAVs upstream of congestion location.
Analysis of multiple operational scenarios showed that activating the predictive speed harmonization system reduces the severity and length of traffic shockwaves and improves the overall stability of traffic. It also improves the overall traffic speed and reduces the average travel time per vehicle. The system performance analysis of partially connected traffic stream indicates that the system’s performance improves at higher connectivity levels. This improvement is a result of the higher number of CAV trajectories collected by the system and the more accurate congestion prediction at higher connectivity levels. The system effectiveness analysis in mixed traffic conditions showed that the speed harmonization system improves traffic performance at low market penetrations of AVs. At medium to high CAV market penetrations, however, the robotic driving behavior of CAVs dominates the traffic stream; therefore, it significantly stabilizes traffic and entirely prevents breakdown. Furthermore, the paper introduced an optimization formulation for the system’s speed control module. Results showed that an optimization-based control outperforms a traditional speed decision tree often used in speed harmonization systems.
For future work, the research team will explore improving the performance of the speed harmonization system. One particular area that can be improved is the traffic state prediction component of the system. The current prediction models assume a binary traffic state: congested and uncongested. By predicting more traffic states, such as Kerner’s ( 48 ) three traffic phases, and applying different control strategies to each of those phases, the overall traffic performance can potentially be improved. The developed strategies can also be improved by expanding their control actions beyond changing vehicle speeds such as changing lanes or routes.
Another area to explore in future work is integrating the developed speed harmonization strategies with other active traffic control strategies such as queue or collision warning. Studies have shown that implementing a combination of active strategies, such as speed harmonization and ramp metering can outperform the implementation of individual strategies ( 9 , 49 ).
Footnotes
Author Contributions
The authors confirm contribution to the paper as follows: study conception and design: Amr Elfar, Alireza Talebpour, Hani S. Mahmassani; data collection: Not applicable; analysis and interpretation of results: Amr Elfar, Alireza Talebpour, Hani S. Mahmassani; draft manuscript preparation: Amr Elfar, Alireza Talebpour, Hani S. Mahmassani. All authors reviewed the results and approved the final version of the manuscript.
Declaration of Conflicting Interests
The author(s) declared no potential conflicts of interest with respect to the research, authorship, and/or publication of this article.
Funding
The author(s) disclosed receipt of the following financial support for the research, authorship, and/or publication of this article: Partial funding for work on which this paper is based was provided through a research grant by the US Department of Transportation, and a dissertation year fellowship provided by Northwestern University to the first author. The authors are solely responsible for the paper’s contents.