
Abstract
At freeway interchanges with high entering flows, implementing two successive merges can improve traffic flow and capacity by distributing the merging maneuvers. The German Guidelines for the Design of Motorways define different types of successive (“double”) merges. According to the quality of service assessment procedure for freeway merge segments given in the German Highway Capacity Manual, successive merge segments can be evaluated separately. However, depending on the distance between the merges, the capacity of the second (downstream) merge might be affected by the entering traffic at the first (upstream) merge, which influences the lane-flow distribution. For a more precise evaluation of traffic flow performance and traffic safety depending on the geometric design characteristics, vehicle interactions, lane changes, the resulting capacity of successive merge segments, accident rates, and crash types were analyzed in the study. The research was based on loop detector data as well as trajectory data obtained from video measurements, which provide an insight into the interactions between mainline and entering vehicles. For the analysis of traffic safety, crash data were evaluated over a period of 3 years. Furthermore, successive merge segments with different geometric and traffic characteristics were modeled with the microscopic traffic simulation tool BABSIM to analyze the influence on traffic flow and capacity. As a result, capacity models and recommendations for the geometric design of successive freeway merge segments are provided.
The quality of traffic flow on freeways is significantly influenced by interchanges. Merging, diverging, and weaving maneuvers can cause conflicts that affect traffic flow and traffic safety. Therefore, the geometric design of interchanges is an important factor to provide efficient and safe operation. To cope with high volumes entering the freeway, successive (“double”) merges can be used if no lane can be added to the mainline freeway carriageway.
The German Guidelines for the Design of Motorways (RAA) define three different types of successive merges ( 1 ). However, depending on the distance between the merges, the capacity of the second (downstream) merge can be affected by the entering traffic at the first (upstream) merge, which considerably influences the lane-flow distribution. Specific knowledge about traffic flow and traffic safety at successive merges is barely available for German freeways.
The aim of this study was to analyze traffic flow and traffic safety at successive merges on German freeways to provide capacity models and recommendations for the geometric design of successive freeway merge segments.
The paper starts with an overview of the existing quality of service assessment procedures for merge segments and their empirical background. In the next section, the methodology and scope of the study are described. The two sections after that provide the main findings from the empirical analysis and the simulations. The traffic safety analysis is given in the penultimate section. Finally, some conclusions are drawn.
Literature Review
The RAA defines standard types for merge, diverge, and weaving segments ( 1 ). A total of five standard types of merge segments (named E 1 to E 5) are given in the RAA, which differ in the number of on-ramp lanes and the use of a lane addition on the downstream freeway carriageway. In Germany, all standard types of merge segments correspond to the “parallel-type entrances” defined in the U.S. Policy on Geometric Design of Highways and Streets ( 2 ). The merge segments provide one or two added lanes of a sufficient length with lane addition or a taper at the end of the added lanes.
In addition to the five standard types of merge segments, three types of successive (“double”) merges (named EE 1 to EE 3) are defined in the RAA ( 1 ). Here, the most common type on German freeways, type EE 1, is a combination of two merges without lane addition, each with a one-lane on-ramp. The standard length of the acceleration lanes is 250 m, which is the same as for single merges with a one-lane on-ramp of the standard type E 1. A nationwide analysis of aerial images revealed that 85% of the 111 successive merge segments in the German freeway network are of type EE 1. For these successive merges, the RAA specifies a minimum distance of 150 m between the two individual merges. However, this recommendation is not based on empirical findings. In practice, the minimum distance is not met in a few cases.
In the German Highway Capacity Manual (HBS), the volume-to-capacity ratio is used as measure of effectiveness for the assessment of traffic flow quality on freeway segments as well as freeway interchanges ( 3 ). For the standard types of merge, diverge, and weaving segments, the HBS provides design diagrams in which the level of service (LOS) can be determined based on the ramp volume and the volume on the mainline carriageway upstream of the merge or weaving area or downstream of the diverge. The HBS assessment procedure for freeway interchanges is based on the model developed by Wu and Lemke ( 4 ). The capacity of the merge segments is represented by the threshold curve between LOS E and F. Thereby, the design capacities are valid for the analysis of 1 h intervals. In the HBS, it is assumed that successive merge segments can approximately be evaluated separately. However, this assumption has not been empirically validated so far.
In the U.S. Highway Capacity Manual, traffic density is used as measure of effectiveness for freeway merge segments ( 5 ). The model for the quality of service assessment of merge segments is based on the findings of Leisch, Roess and Ulerio, and Elefteriadou et al. ( 6 – 9 ).
The U.S. Policy on Geometric Design of Highways and Streets specifies minimum lengths between successive entry-entry ramp combinations ( 2 ). It recommends a minimum distance of 90 m between the end of the taper for the first on-ramp and the painted nose for the succeeding on-ramp. Additionally, there should be a minimum distance of at least 300 m between the two painted noses.
Ray et al. conducted a study to investigate the influence of spacing between successive entry and/or exit combinations ( 10 ). Their findings reveal that the spacing of entry-entry ramp combinations does not significantly affect freeway speed when the freeway volume is 1,500 vehicles per hour per lane or less. However, at higher freeway volumes, reducing the spacing between on-ramps has a notable impact on freeway speeds, with speeds decreasing by up to 16 km/h. Additionally, the traffic safety analysis indicates that the percentage of severe crashes at entry-entry ramp combinations increases as the ramp spacing decreases.
In a study by Guo et al., solutions for bottlenecks at freeway intersections were developed ( 11 ). A solution called “split design” was proposed, which involves modifying ramp designs to create two merge or diverge points, reducing conflicts between mainline and ramp traffic. Using microscopic traffic simulation, it was found that this split design can potentially increase the throughput by 6%–9% and reduce delay by 35%–80% in various scenarios.
The traffic safety of freeway merge segments has been analyzed in many recent studies ( 12 – 16 ). Specific results on successive merge segments are available from an older study by Kraus and Trapp, who analyzed seven freeway interchanges in Germany with a successive merge in at least one direction ( 17 ). At successive merges, accidents on the main carriageway and merging accidents were recorded most frequently. The investigations also revealed that the accident severity of successive merges was about half as high as at merges where the two entering flows were routed through a parallel carriageway and then led together onto the main carriageway. The most frequently registered crash types were crashes in longitudinal traffic and rear-end collisions. Based on the results of the investigation, the more common use of successive merges was recommended for application. In recent decades, successive merges were built at several freeway-to-freeway interchanges in Germany to distribute high entering flows entering the main carriageway.
Methodology
The study is structured in three parts:
– data collection and empirical analysis of traffic flow
– microscopic traffic simulation
– traffic safety analysis
First, 43 successive merges of type EE 1 according to the RAA on freeways with different geometric characteristics were selected for the empirical analyses of traffic flow and traffic safety ( 1 ). A schematic illustration of a successive merge segment of type EE 1 with the respective lengths and traffic volumes as well as the length distribution of the investigated successive merge segments is shown in Figure 1. The research was based on loop detector data, crash data, and work zone data covering a period of 3 years. For the macroscopic traffic flow analysis, the loop detector data were processed and times during work zone operation, crash events, as well as implausible values were filtered.
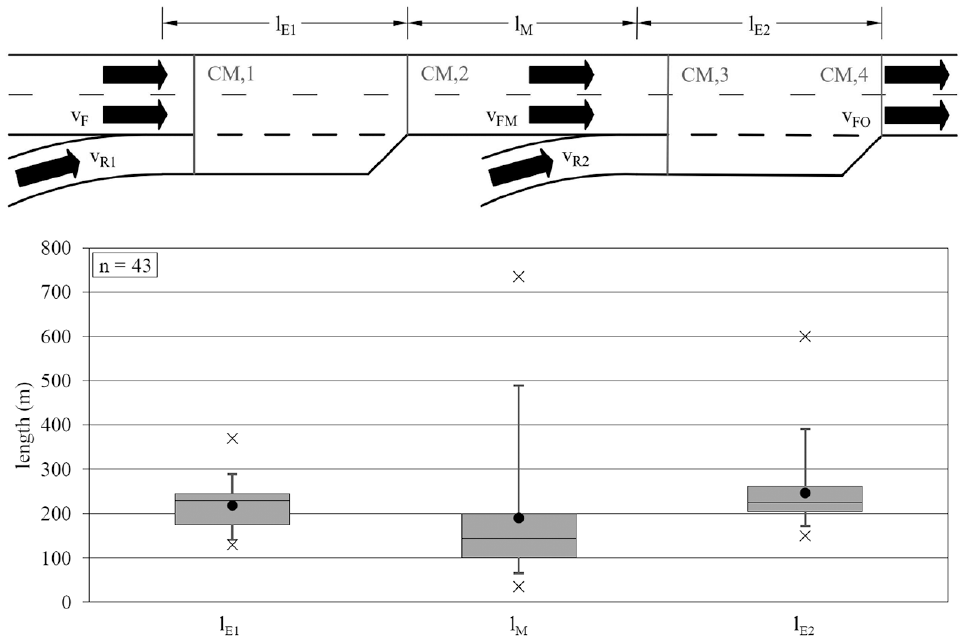
Schematic illustration of a successive merge segment of type EE 1 according to the German Guidelines for the Design of Motorways, and boxplots of the respective lengths of the investigated segments ( 1 ).
Previous studies (cf. literature review) have shown that the following factors can influence the capacity of merge segments:
– the proportion of the entering volume
– the lane distribution upstream of the merge area
– the proportion of heavy vehicles
– the speed limit on the main carriageway
– the use of ramp metering
– the proportion of local traffic
– the geometric design parameters, particularly the length of the acceleration lane
Thus, the aim of the study was to analyze the influence of these parameters on the capacity of successive merge segments.
From all investigated samples, five successive merge segments with high volumes were selected for microscopic analysis (Table 1). Thereby, video measurements were carried out with two drones over a period of 3 h during peak hours. Trajectory data were obtained from the video measurements, which provided an insight into the interactions between mainline and entering vehicles. The traffic volume, lane flow distribution, and headway distribution were determined at four measurement cross-sections shown in Figure 1. Here, a measurement cross-section was positioned at the beginning (CM,1 and CM,3) and the end (CM,2 and CM,4) of the acceleration lane at each of the two merges.
Characteristics of the Successive Merge Segments Selected for the Video Measurements
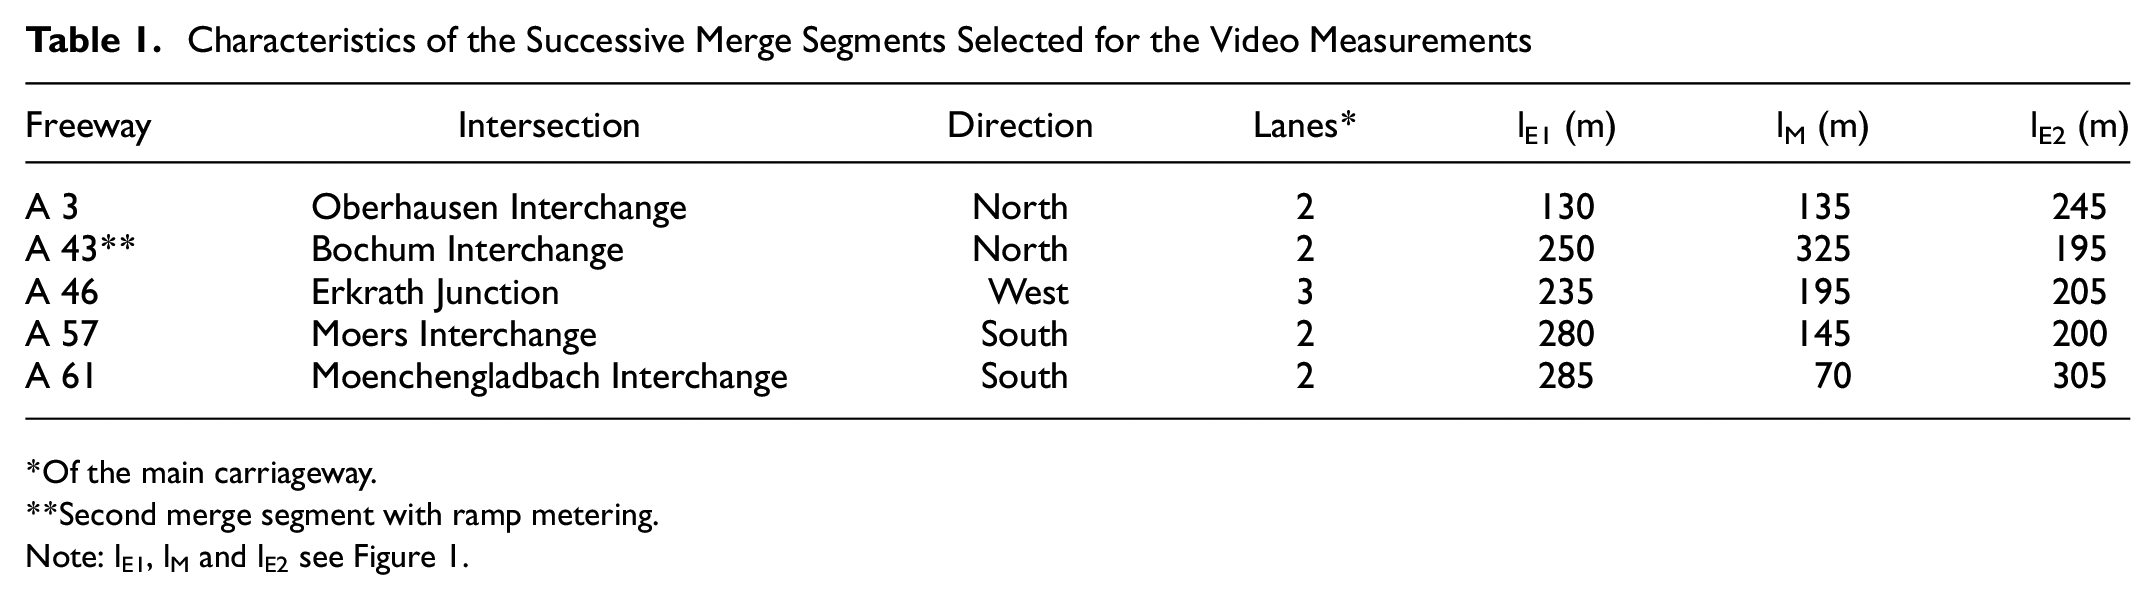
Of the main carriageway.
Second merge segment with ramp metering.
Note: lE1, lM and lE2 see Figure 1.
In the second step, successive merge segments with different geometric and traffic characteristics were modeled with the microscopic traffic simulation tool BABSIM to analyze the influence of parameters that could not be observed in reality. This particularly included merges at uphill segments. The model parameters were calibrated based on the results obtained from the empirical analysis.
Thirdly, crash data for the period from 2015 to 2017 were prepared for the safety analysis. For the evaluation of traffic safety, crash rates and crash cost rates were calculated, and distributions of accident types were determined.
Empirical Analysis
Macroscopic Analysis
The objective of the macroscopic analysis was to verify to which extent the capacity of the second merge differs from the design capacity for type E 1 of the HBS ( 3 ).
First, the pre-breakdown volumes were determined in 5 min intervals. For this, a threshold speed sc on the mainline freeway was estimated for each successive merge segment based on the boundary between fluid and congested traffic flow in the speed-flow diagram. On German freeways, the threshold speed sc is usually between 60 and 80 km/h.
A breakdown of traffic flow was determined based on the following five criteria ( 18 ):
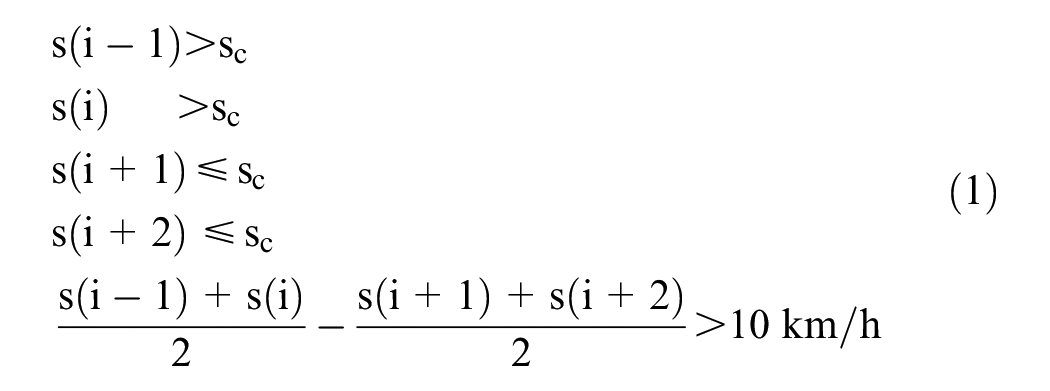
where
s(i) = mean passenger car speed on the mainline carriageway in interval i (km/h), and
sc = threshold speed on the mainline carriageway (km/h).
In addition, downstream loop detector data were used to verify that the breakdown at the merge segment was not caused by a tailback from a downstream bottleneck. The HBS procedures are only valid for dry road surface and brightness. Therefore, only pre-breakdown intervals during daylight on days without rainfall were used for capacity analysis.
The capacity of a merge segment was calculated using the volumes on the mainline freeway upstream of the merge and the on-ramp volume. According to Geistefeldt, the mean value of pre-breakdown volumes in 5 min intervals can be approximately regarded as an estimate of the HBS design capacity in 1 h intervals ( 19 ). The design capacity represents the threshold curve between LOS E and F. Within the capacity analysis, the deviation between the empirical capacity at the second merge and the design capacity for merge type E 1 was determined.
For each successive merge segment at which a sufficient number of traffic breakdowns was observed, the mean pre-breakdown volumes on the on-ramp and on the main carriageway upstream of the merge were determined. The average pre-breakdown volumes, differentiated by the number of lanes of the main carriageway as well as the proportions of entering volumes and heavy vehicles, are shown in Figure 2. In general, it was found that successive merge segments provide a high capacity. The capacity of the second merge at two-lane freeway carriageways usually exceeds the design capacity given in the HBS, which, however, intentionally represents a rather conservative estimate of real-world capacities ( 3 ). At six of eight successive merges at two-lane freeway carriageways, the empirically determined capacity is—in some cases even significantly—greater than the design capacity. The relative deviation for these six merges is within a range of 5.2% to 21.4%. At two successive merges at two-lane freeway carriageways, the empirically determined capacity is slightly smaller than the design capacity with a relative deviation of −1.2% and −2.1%. With lengths of 130 m and 160 m, respectively, the second acceleration lanes of these two successive merges are relatively short compared with the other investigated examples (Figure 1) as well as the standard design of the RAA ( 1 ). For the eight investigated successive merges at two-lane freeway carriageways, the average relative difference between the empirically determined capacity and the design capacity amounts to 9.3%.
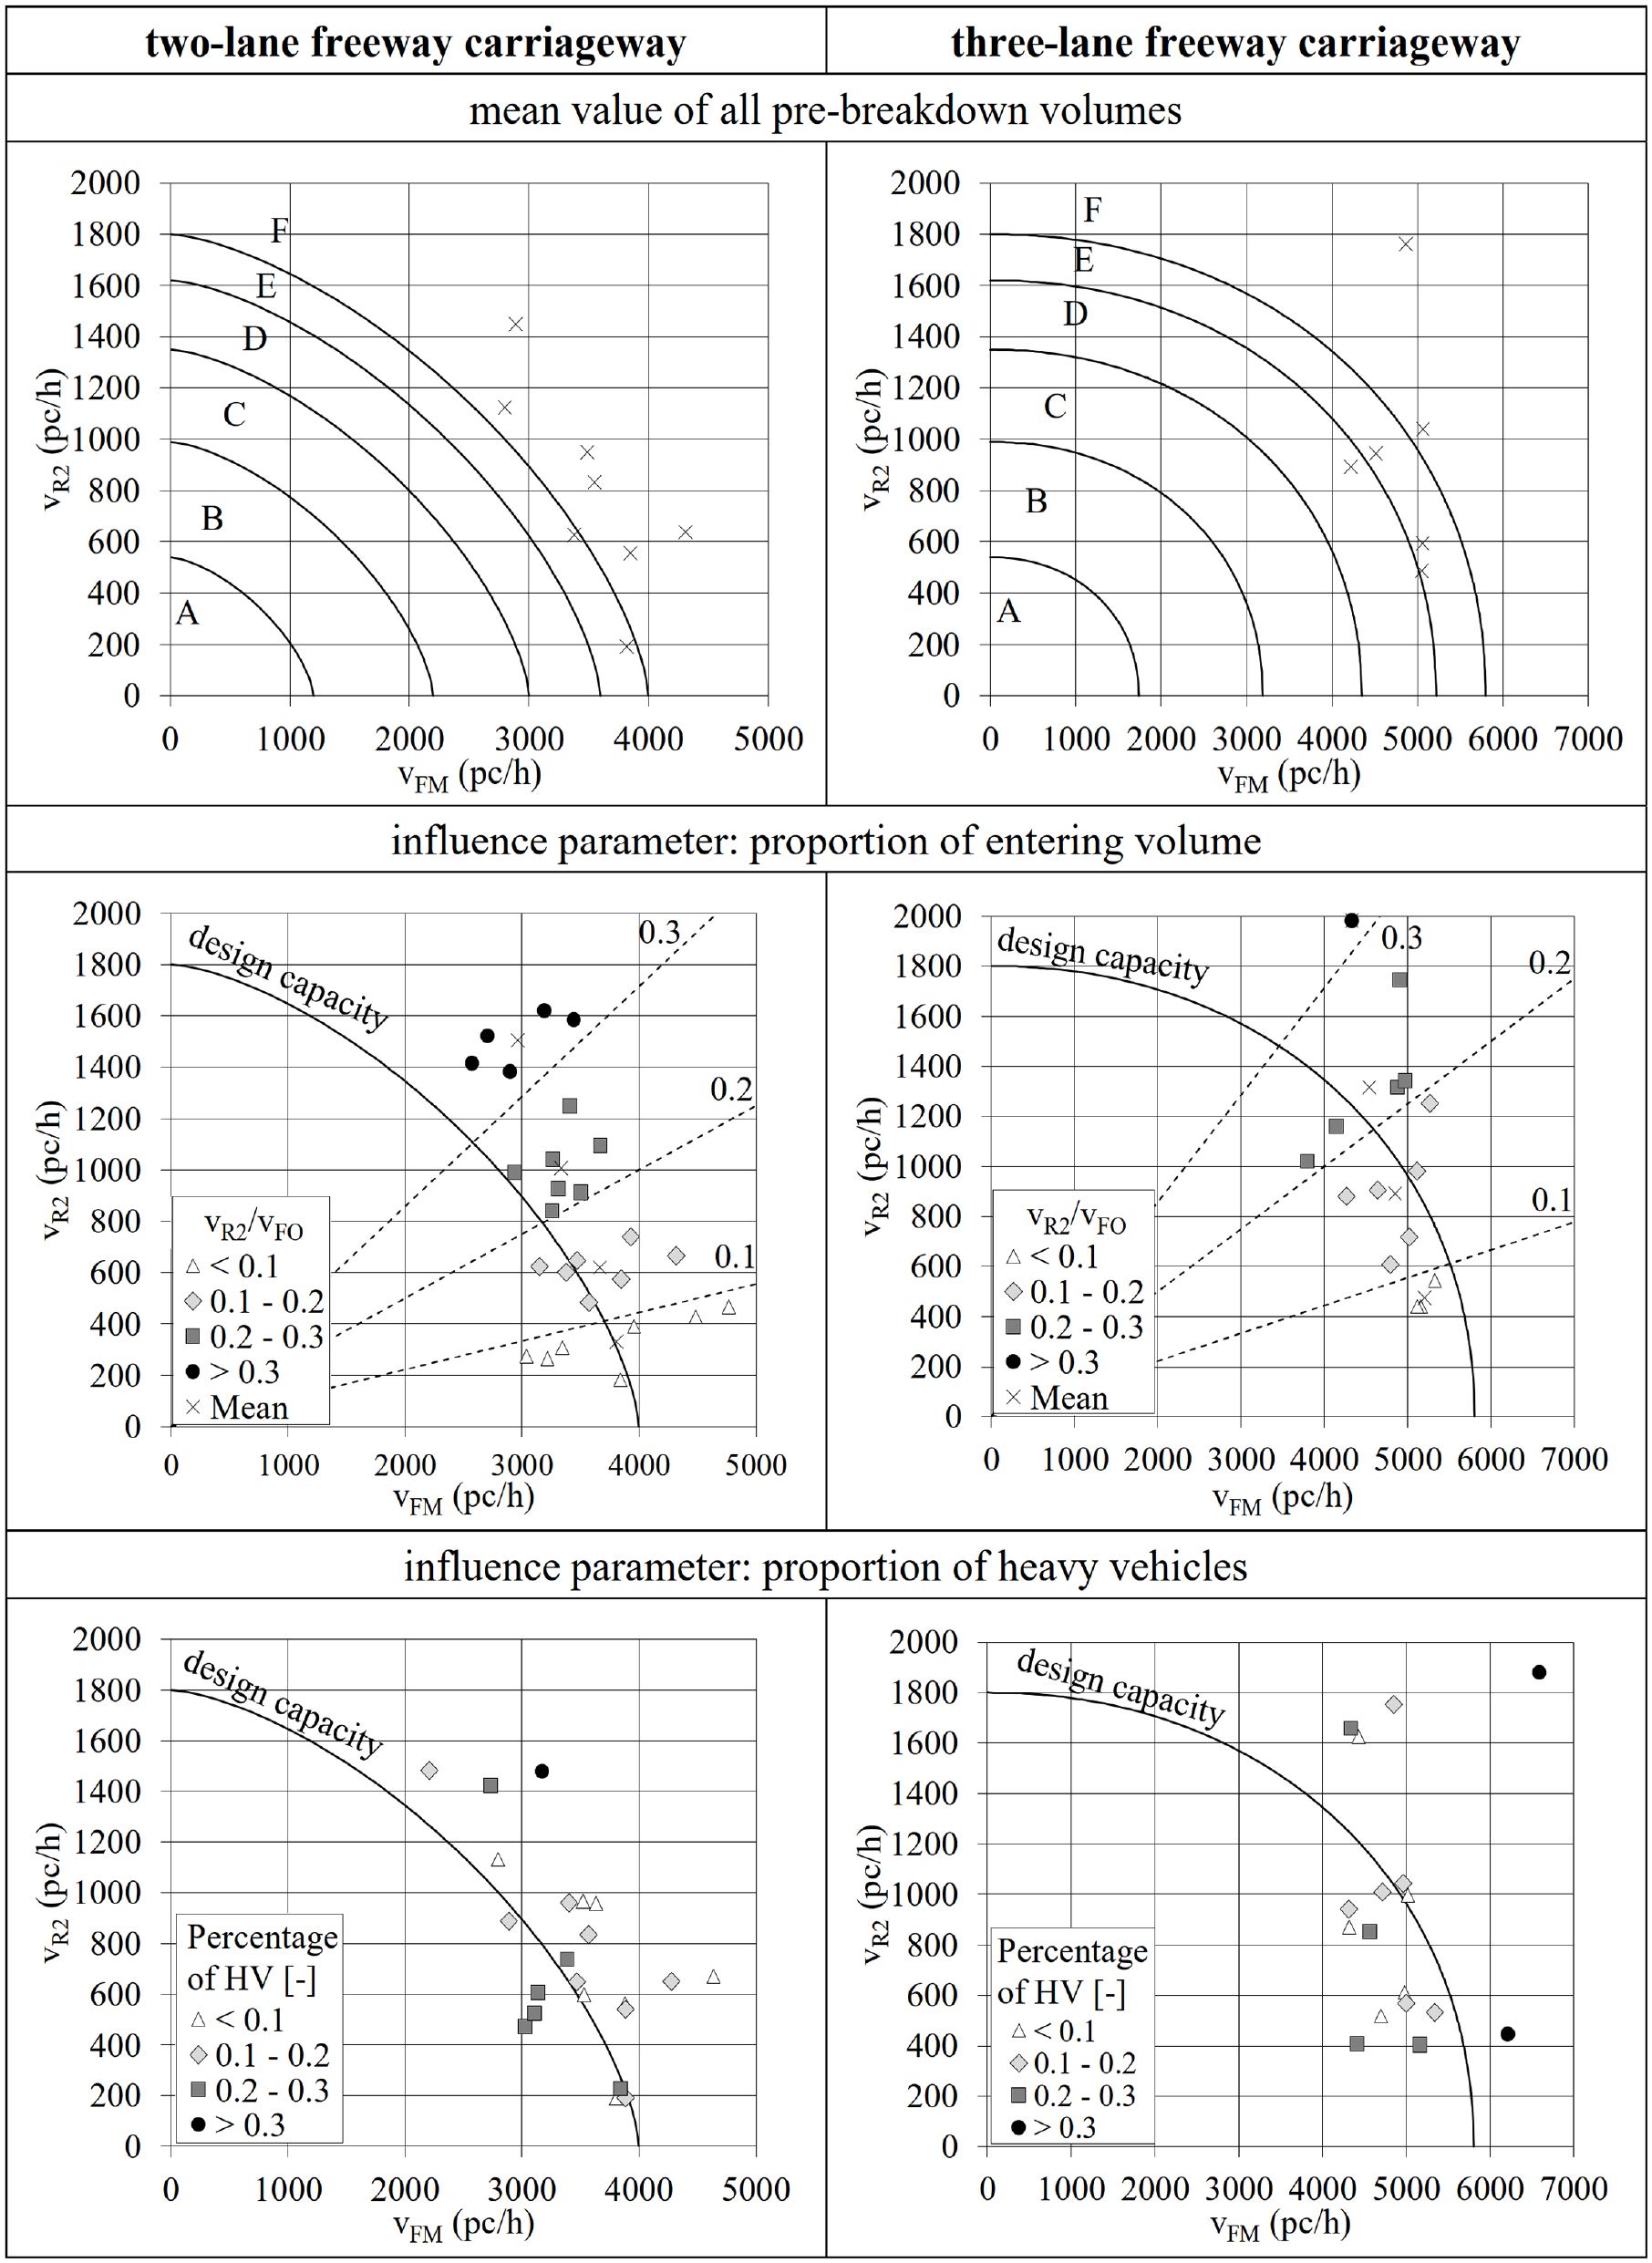
Mean pre-breakdown volumes for the successive merge segments differentiated by mainline freeway lanes as well as proportion of entering volume and heavy vehicles.
The capacity was also determined for a total of six successive merge segments at three-lane directional carriageways. At four segments, the empirically determined capacity of the second merge is slightly below the design capacity for merge type E 1 according to the HBS. Overall, the average difference to the HBS design capacity amounts to −1.3% ( 3 ).
The proportion of entering traffic to the total traffic volume of the merge as well as the proportion of heavy vehicles were analyzed as parameters potentially influencing the capacity. Therefore, the determined pre-breakdown volumes were grouped into classes of traffic volume proportion and heavy vehicle proportion, respectively. A class width of 10% was selected. If a sufficient number of pre-breakdown volumes were assigned to a class, the mean values of the pre-breakdown volumes in the class were determined. Then, for all merge successive segments, a mean value was calculated for each class based on the individual mean values.
The results given in Figure 2 show that, as the proportion of entering traffic increases, the positive distance between the empirical capacity and the HBS design capacity increases, or the negative distance decreases. Furthermore, the results of the individual classes of heavy vehicle proportion vary strongly. However, no consistent trend can be identified. The highest positive deviations between the empirical capacity and the design capacity occur with a proportion of heavy vehicles greater than 30%. This confirms former results by Geistefeldt and Sievers, which revealed that the passenger car equivalent for heavy vehicles at heavy vehicle proportions greater than 20% is less than the standard value of 2.0 ( 20 ).
A significant influence of the speed limit, the proportion of local drivers, the use of ramp metering, and the length of the acceleration lanes could not be derived from the results.
Microscopic Analysis
Within the microscopic analysis, the spatial variations of the lane flow and headway distributions were evaluated. As an example, the results for the successive merge segment at the two-lane carriageway of freeway A 43 at Bochum interchange are shown in Figures 3 and 4. It was observed that many vehicles entering at the first merge immediately change to the left lane, which reduces the percentage of small time gaps on the right lane of the mainline carriageway between the end of the first merge and the beginning of the second merge. This effect was observed at all successive merges investigated except for one example with a small distance of only 70 m between the two merges.
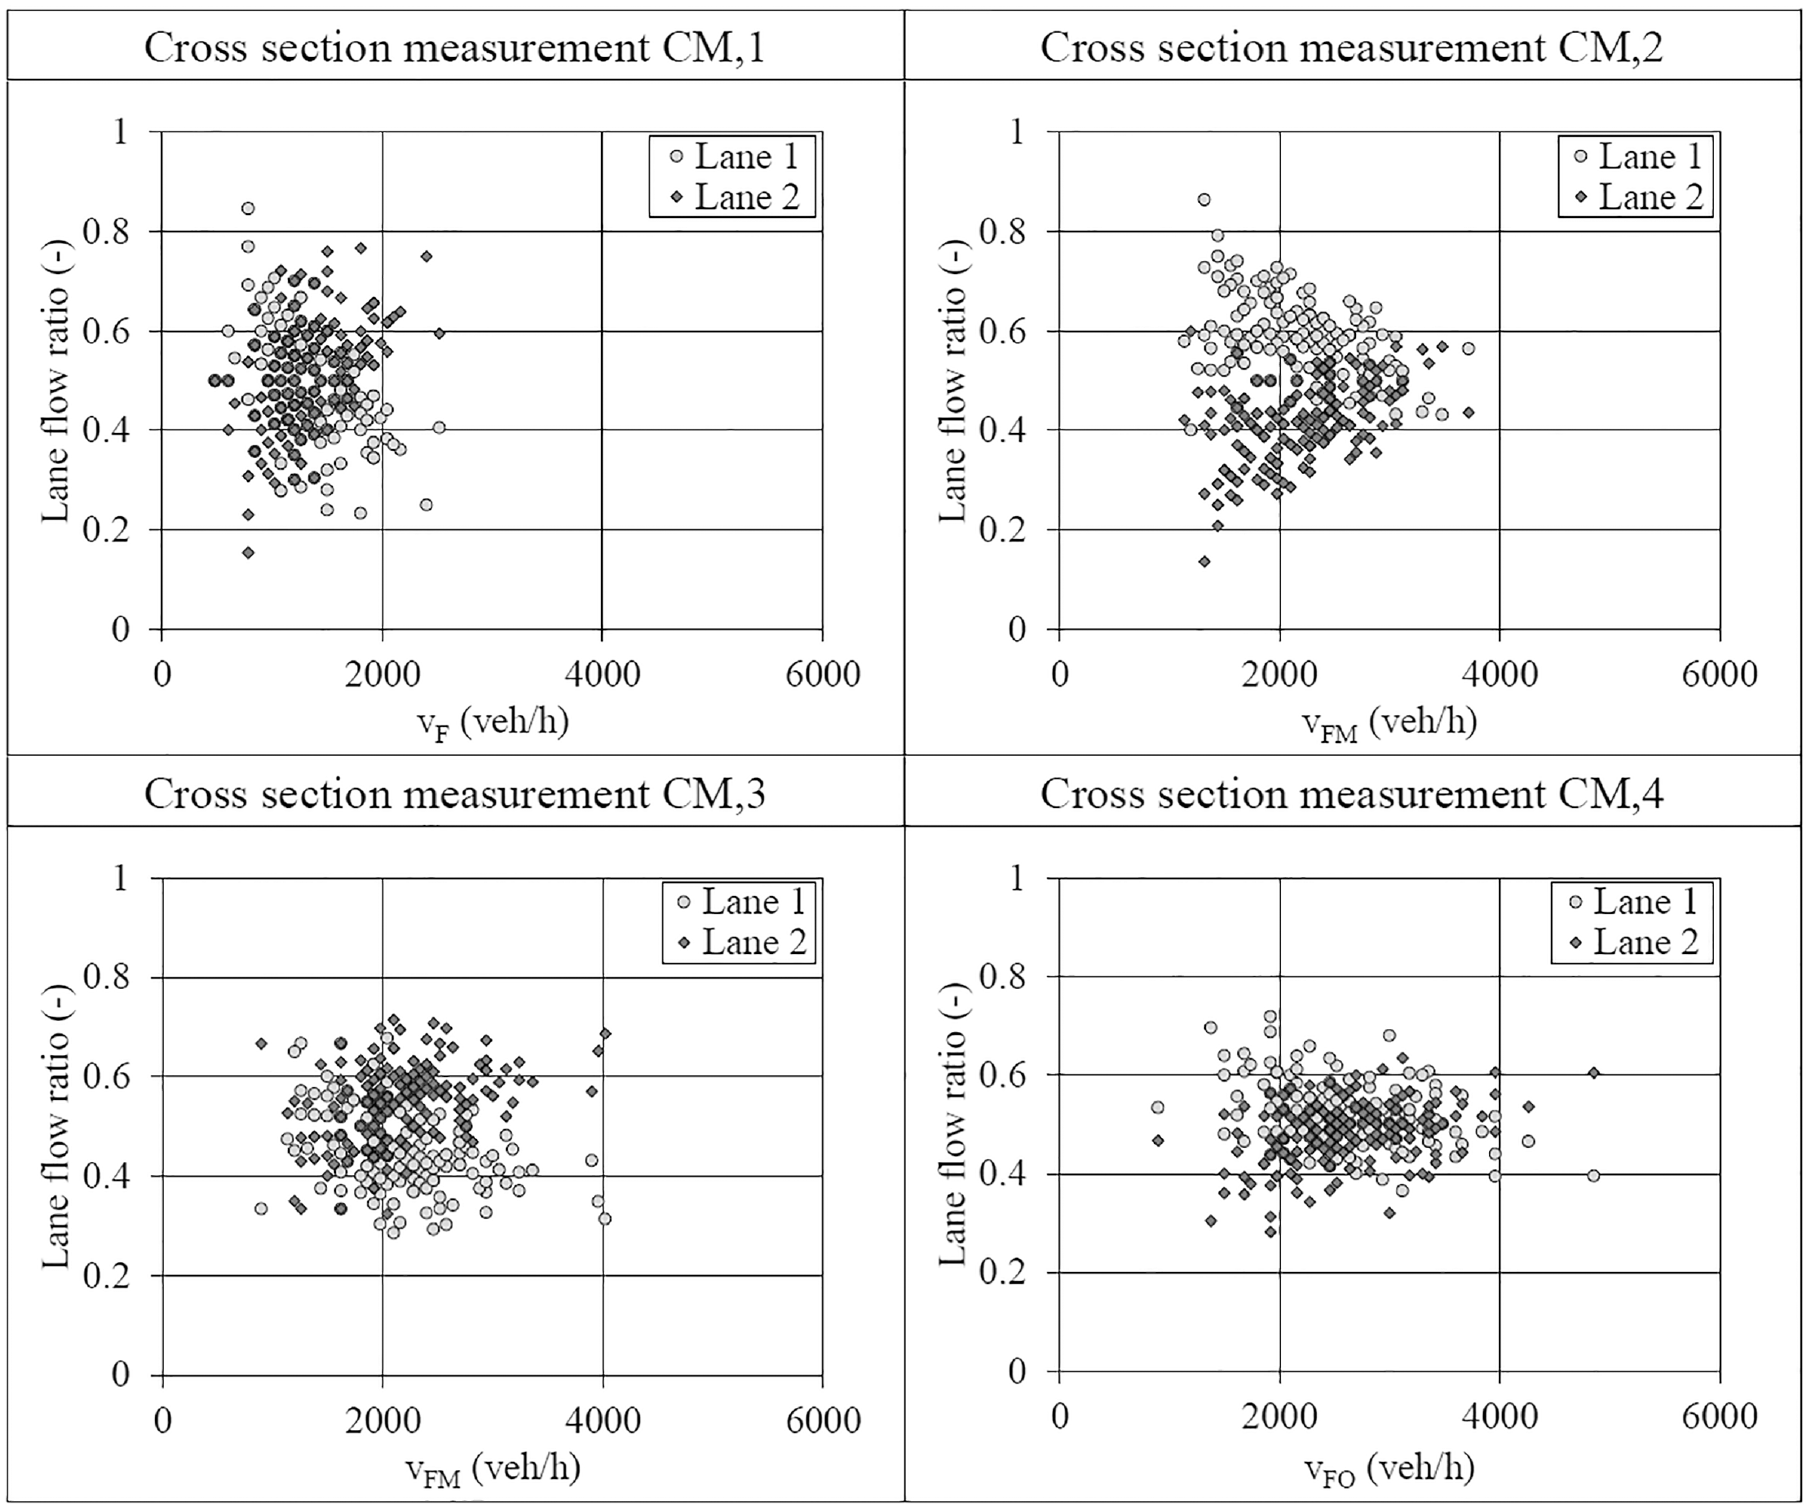
Spatial variation in lane flow distribution at four cross sections on the two-lane mainline carriageway of the successive merge segment at freeway A 43 at Bochum interchange in 1 min intervals.
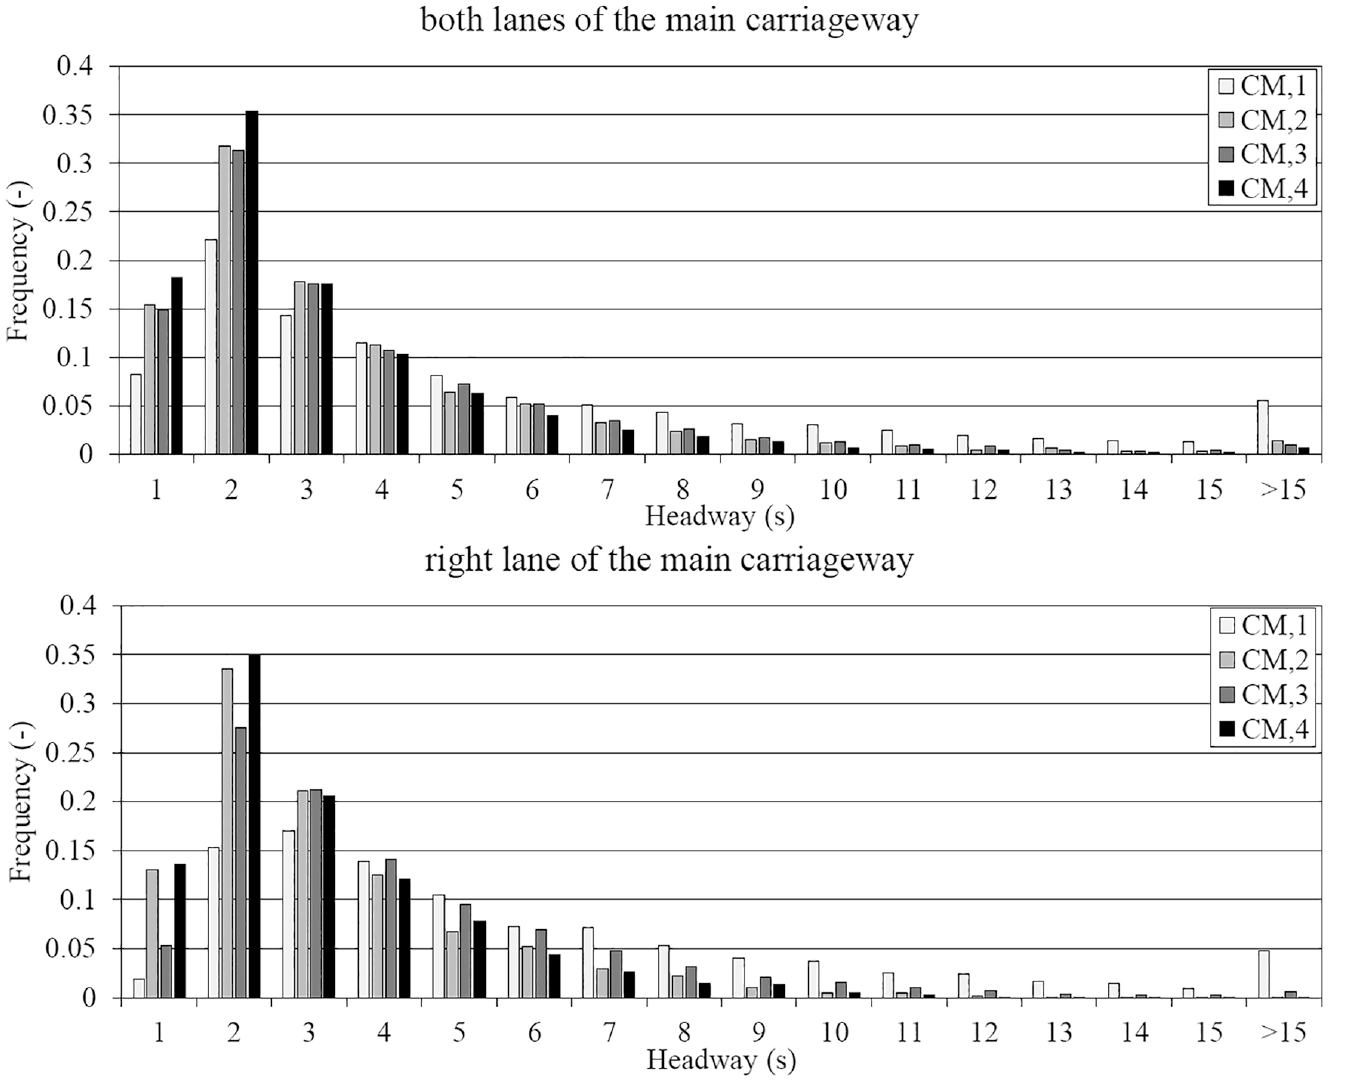
Spatial variation of the headway distribution on both lanes (top) and the right lane (bottom) at four cross sections on the mainline carriageway at the successive merge segment at freeway A 43 at Bochum interchange.
Overall, an almost balanced lane flow distribution was determined at the end of the second acceleration lane at all investigated successive merge segments. Accordingly, the lane changes to the left lead to a mostly even usage of the two lanes at the second merge, which is crucial for the performance of the entire successive merge segment.
Microscopic Simulation
To analyze the influence of the geometric design parameters on traffic flow and capacity, successive merge segments were modeled with the microscopic traffic simulation tool BABSIM, which is a non-commercial freeway traffic simulation tool based on an intention-based behavioral model ( 21 ). A total of four real examples of successive merge segments were modeled to determine the driving behavior parameters. The four simulation models were calibrated with the driving behavior parameters and the desired speed distribution recommended for the HBS-compliant simulation of traffic flow for the entry type E 1 in both entry areas ( 22 ).
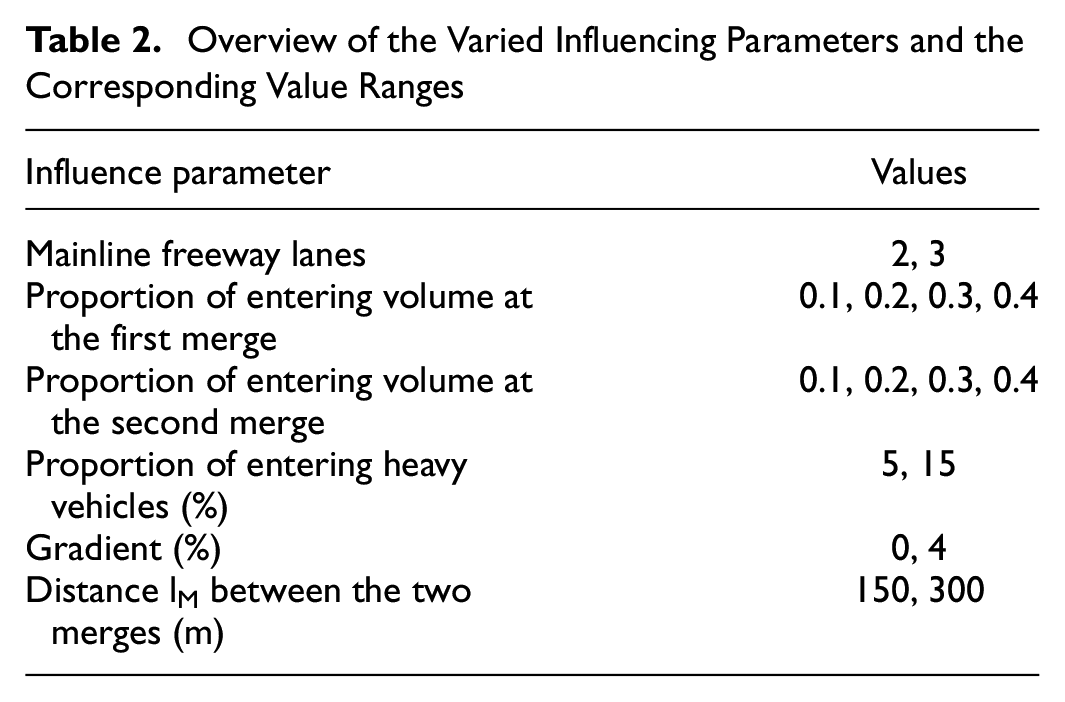
Series of simulations were carried out with the calibrated driving behavior parameters. An overview of the varied influencing parameters and the corresponding value ranges are shown in Table 2. Ten simulation runs were carried out for each parameter combination scenario. Subsequently, the mean pre-breakdown volumes on the on-ramp and on the main carriageway upstream of the merge were determined. The mean pre-breakdown volumes obtained in the simulation scenarios for different geometric parameters of the successive merge segment are shown in Figure 5.
Overview of the Varied Influencing Parameters and the Corresponding Value Ranges
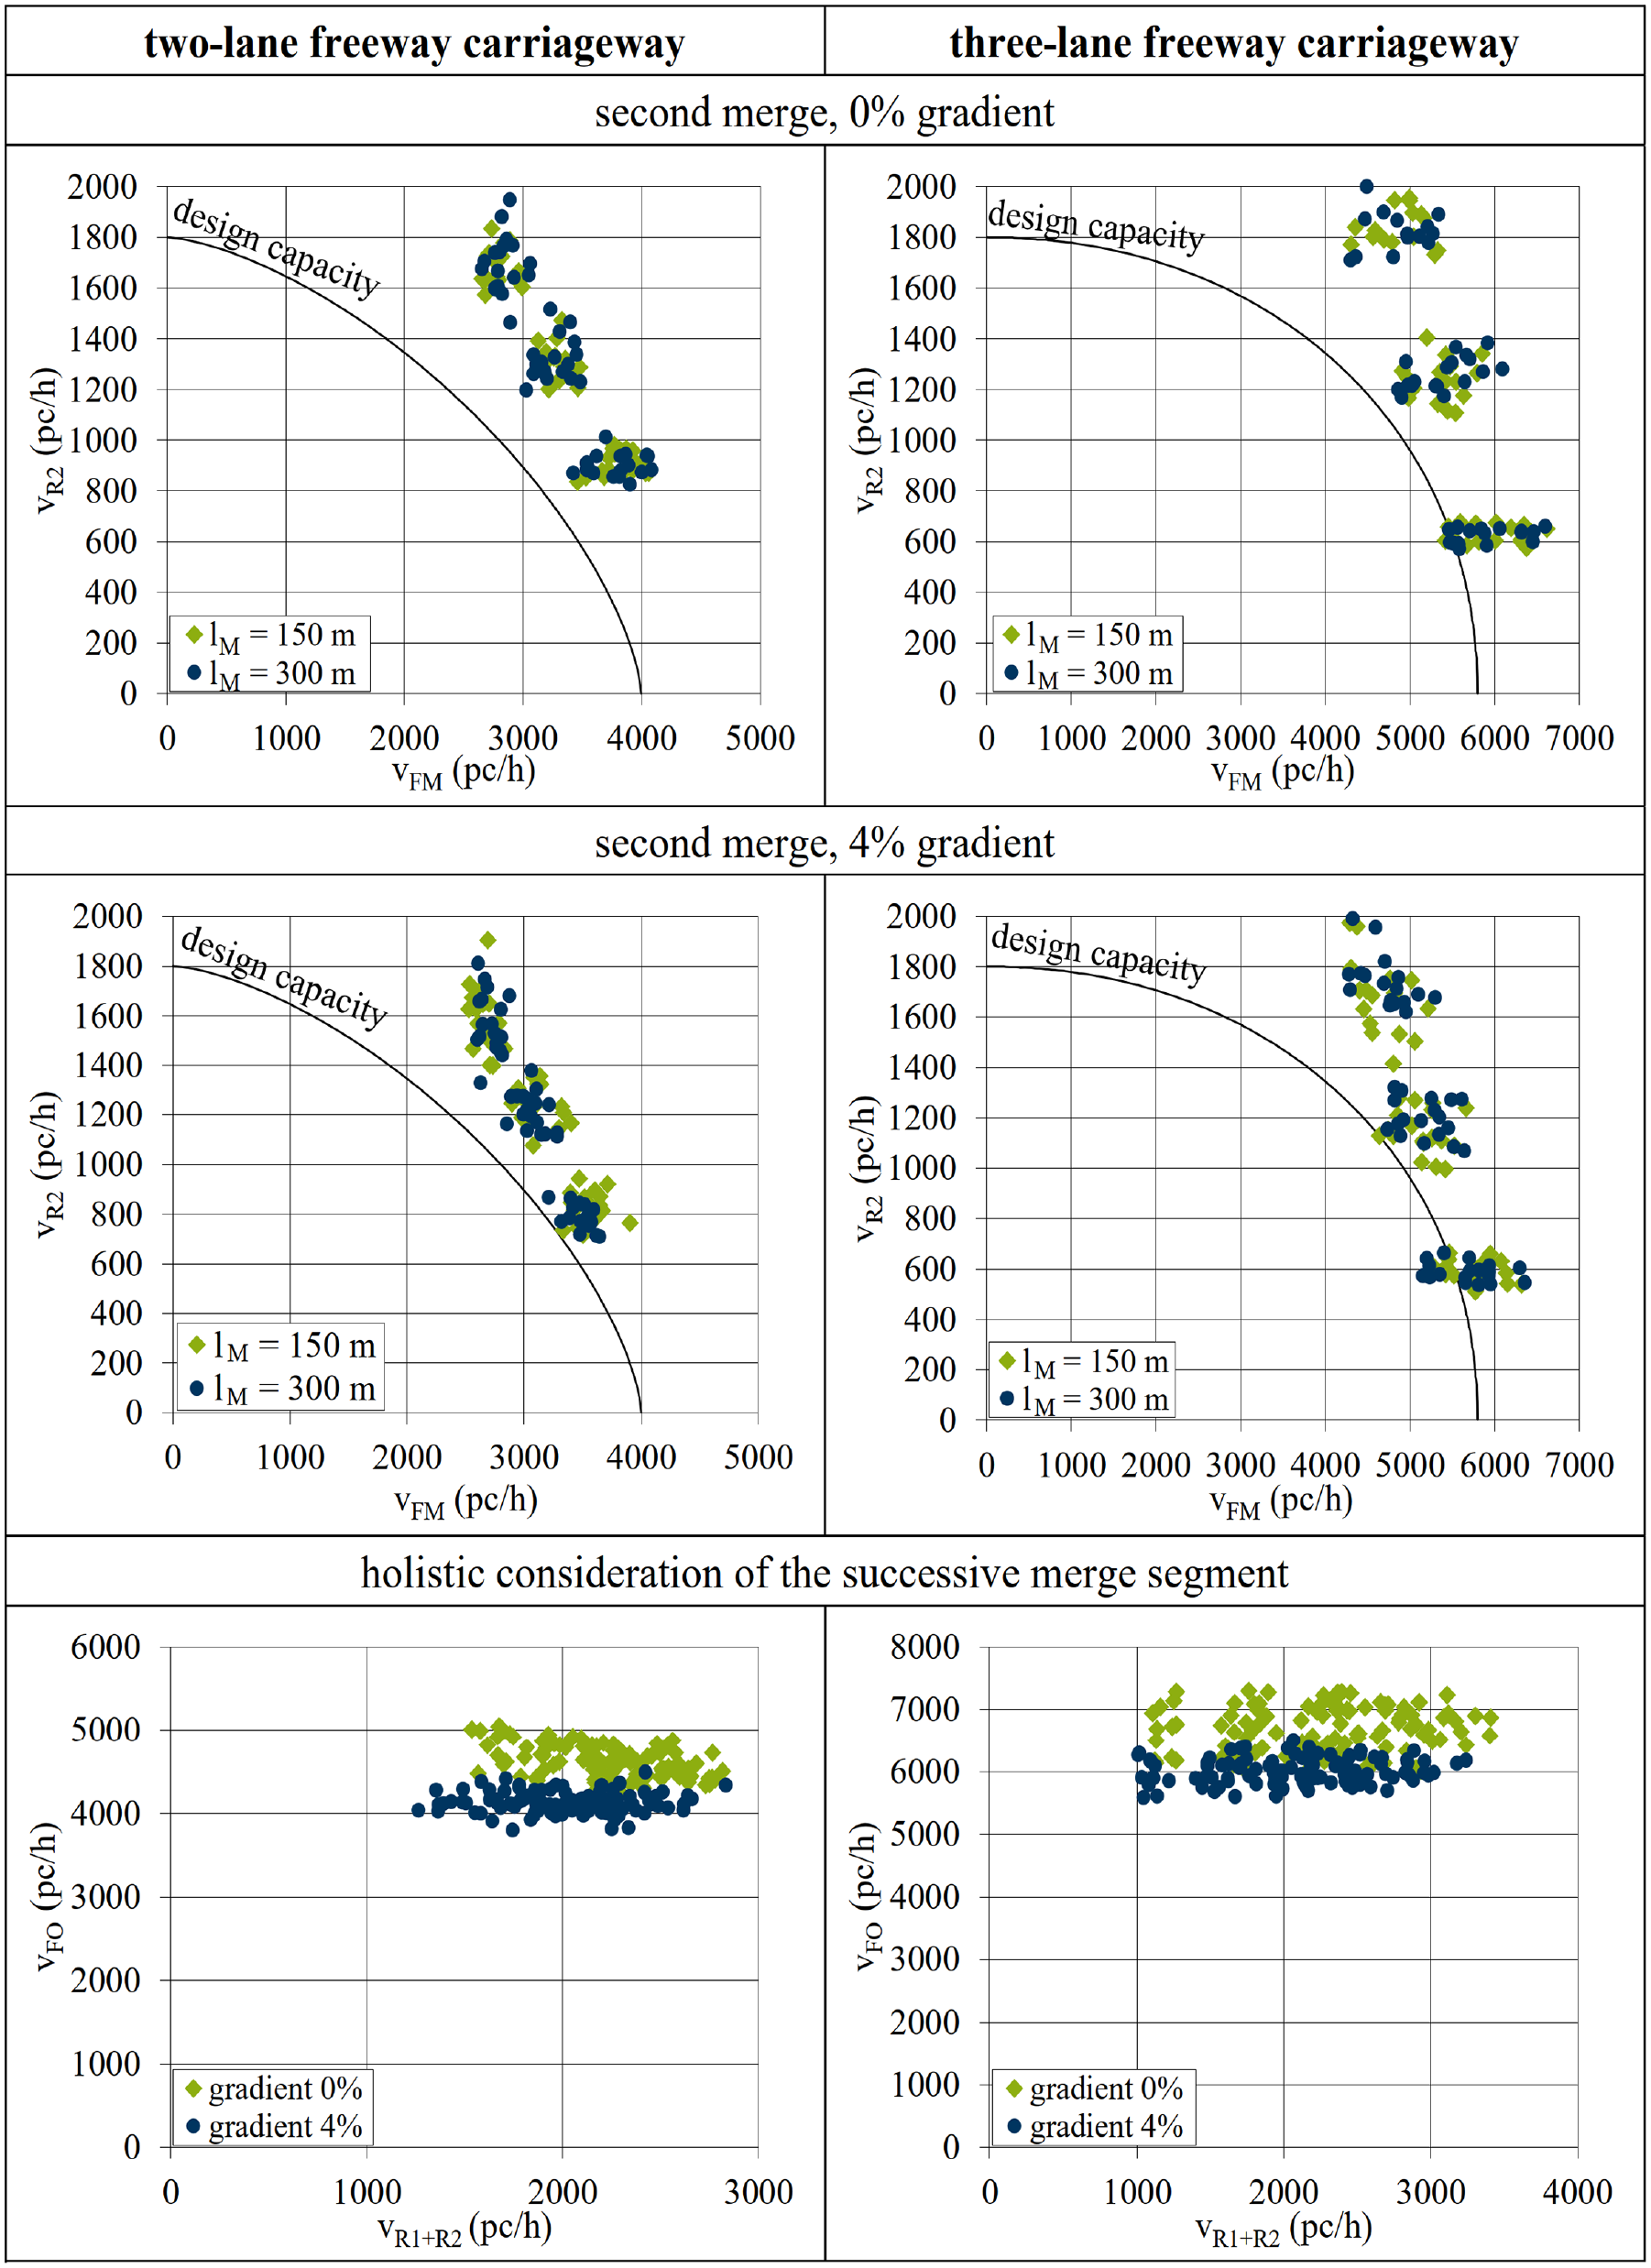
Mean pre-breakdown volumes obtained in the simulation scenarios for different geometric parameters of the successive merge segment.
The results of the microscopic simulation revealed that the gradient of the mainline freeway significantly influences the capacity of the successive merge segment. The capacities determined at 4% grade are significantly lower than the capacities in level terrain.
With regard to the distance between the two individual merges, the simulation revealed that an extension of the minimum distance of 150 m specified in the RAA does not improve traffic flow ( 1 ). Furthermore, the sum of the pre-breakdown volumes of the on-ramp and the mainline carriageway upstream of the second merge was almost constant. Generally, it can be concluded that the capacity of the second merge is limited by the capacity of the downstream freeway segment, whereas the first merge does not affect the capacity of the second merge.
Traffic Safety Analysis
For the traffic safety analysis of successive merge segments, accident data over a 3-year period were analyzed. All accidents with at least serious property damage recorded by the police were taken into account. In total, traffic safety was analyzed for 37 successive merges where no permanent construction site was in place during the study period from 2015 to 2017. The analysis section covered the mainline carriageway from 500 m upstream of the first merge to 500 m downstream of the end of the second merge. At the analyzed successive merges, a total of 286 accidents occurred within these sections.
With regard to the assessment of traffic safety, crash rates and crash cost rates were determined. The crash rate relates the number of accidents to the mileage and the section length. The crash cost rate represents the crash costs per 1,000 vehicle kilometers (vkm) traveled. Depending on the accident category (severe personal injury, minor personal injury, serious property damage), specific average costs per crash were used.
The crash rates and crash cost rates were differentiated by the accident severity. Table 3 summarizes the mean crash rates and crash cost rates for successive merges at two-lane and three-lane carriageways. Both the average crash rate and the crash cost rate for crashes with personal injury are higher at two-lane carriageways than at three-lane carriageways, whereas the mean rates for crashes with serious property damage are equal. However, a statistical test of the mean values revealed no significant differences between the two compared groups.
Average Crash Rates and Crash Cost Rates of All Investigated Successive Merge Segments Differentiated by Accident Severity
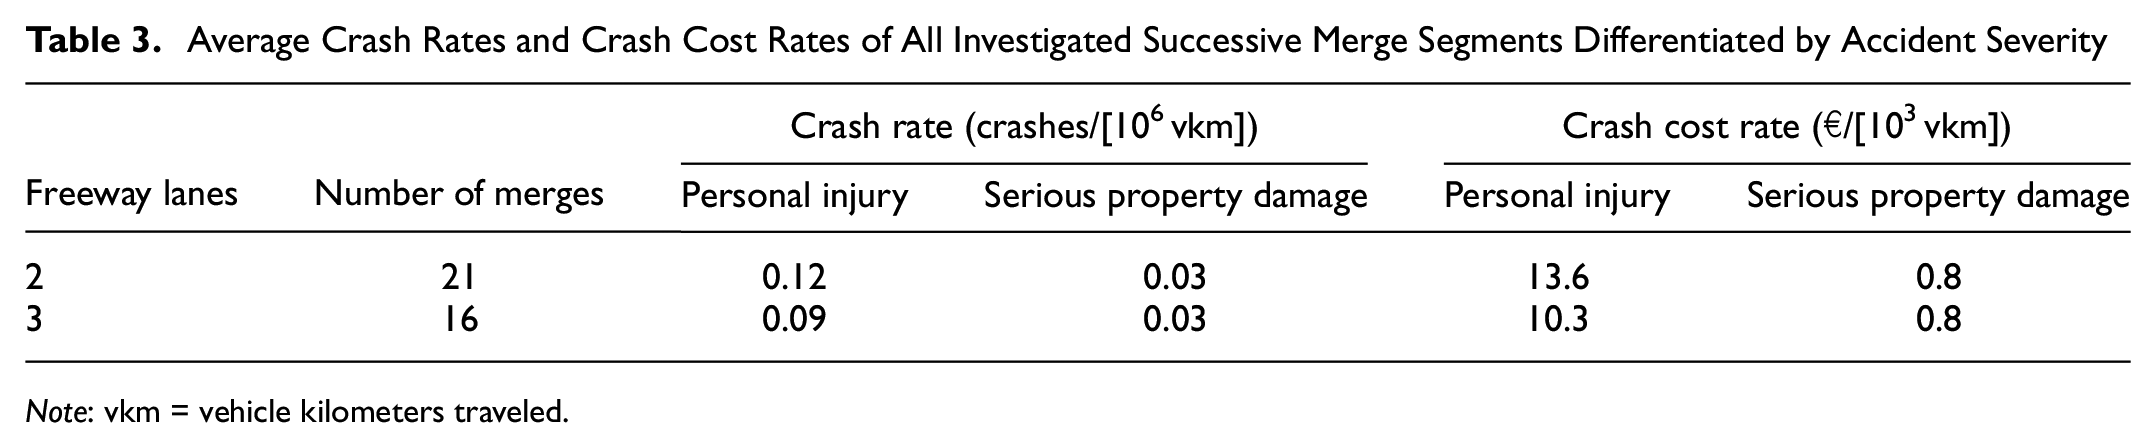
Note: vkm = vehicle kilometers traveled.
Compared with the overall accident frequency on German freeways, the results for successive merges are unremarkable. Both the mean crash rate and the mean crash cost rate are similar to the average value for freeways in Germany. The highest crash rates were found for successive merges with a distance between the two merges of less than 150 m. Furthermore, the successive merge with the highest crash rate has two acceleration lanes with lengths below the RAA recommended value of 250 m ( 1 ). A statistical relationship was determined between the traffic volume of the two entering flows and the crash rate and crash cost rate at successive merges at two-lane freeway carriageways. The two rates increase with increasing traffic volume. For successive merges with a distance exceeding the minimum value of 150 m specified in the RAA, no dependence of traffic safety on the distance between the two merges could be found ( 1 ).
For a more detailed analysis of the accident characteristics, the crash types at successive merges were examined. The German Recommendations for Local Accident Analysis in Road Safety Commissions define seven different accident types, of which four occurred at the examined successive merges ( 23 ). The distribution of crash types shown in Figure 6 reveals that crashes in longitudinal traffic happened most frequently, followed by driving crashes. The main differences between successive merges at three-lane and two-lane freeway carriageways are the lower proportion of driving crashes caused by a loss of control and the higher proportion of crashes in longitudinal traffic, which can be explained by the higher traffic volumes and the greater frequency of interactions between vehicles on three-lane carriageways. Crashes caused by merging usually occurred at the first merge.
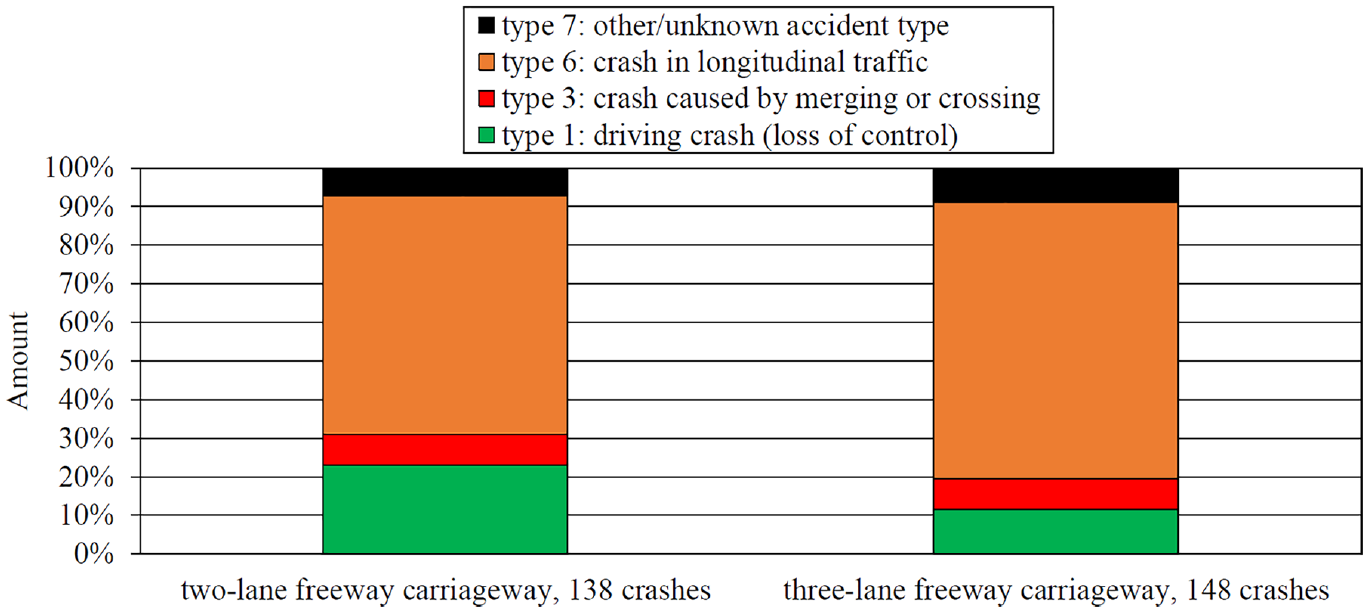
Distribution of crash types at successive merges.
Conclusions
The capacity of successive merge segments was analyzed based on loop detector data as well as the results from microscopic traffic simulation. The average pre-breakdown volume was used as capacity estimate. In general, it was found that successive merge segments provide a high capacity. The empirical results showed that the capacity of the second merge at two-lane freeway carriageways usually exceeds the design capacity given in the HBS ( 3 ). Furthermore, it was determined that, as the proportion of entering traffic increases, the difference between the empirical capacity and the HBS design capacity increases. The empirical results therefore support the assumption already included in the HBS that successive merges can be evaluated as two individual merges.
Within the microscopic analysis, it was observed that many vehicles entering at the first merge immediately change to the left lane on the mainline freeway. This reduces the percentage of small time gaps on the right lane of the mainline carriageway between the end of the first merge and the beginning of the second merge. Thereby, the capacity of the second merge is not affected by the traffic entering at the first merge. This effect was observed only when the distance between the two merges was sufficiently long. In addition, the crash rate was higher than average at two successive merges with close distance between the two merges. Accordingly, it is recommended that the minimum distance of 150 m as defined in the current RAA should be maintained ( 1 ). It is recommended that this minimum value should be consistently applied in planning projects for reasons of traffic flow quality and traffic safety.
Footnotes
Author Contributions
The authors confirm contribution to the paper as follows: study conception and design: A. Brandenburg, J. Sauer, J. Geistefeldt; data collection: A. Brandenburg, J. Sauer; analysis and interpretation of results: A. Brandenburg, J. Sauer, J. Geistefeldt; draft manuscript preparation: A. Brandenburg, J. Sauer, J. Geistefeldt. All authors reviewed the results and approved the final version of the manuscript.
Declaration of Conflicting Interests
The author(s) declared no potential conflicts of interest with respect to the research, authorship, and/or publication of this article.
Funding
The author(s) disclosed receipt of the following financial support for the research, authorship, and/or publication of this article: This paper is based on research carried out at the request of the Federal Ministry for Transport and Digital Infrastructure, represented by the Federal Highway Research Institute, under research project no. 02.0426/2018/EGB.
The authors are solely responsible for the content of this paper.