
Abstract
In compliance with recent (2022) federal legislation found in the Code of Federal Regulations Part 650 Subpart C, risk-based inspection (RBI) practices for determining inspection intervals for highway bridges are now permitted. The RBI approach allows for a systematic assessment of risk and prioritizes inspection resources where they are most needed. However, to ensure an optimal level of safety and serviceability, it is necessary to utilize reliable inspection techniques in conjunction with an appropriate inspection interval, as emphasized by National Cooperative Highway Research Program (NCHRP) Report 782. Utilizing ineffective inspection techniques may lead to uncertainty about the element’s condition and thus increase the risk associated with the component. Therefore, this paper proposes a framework that integrates a new factor, called the inspection effectiveness factor (IEF), into the RBI process to rationally estimate the inspection interval considering the reliability of the inspection technique. The inspection interval in the proposed approach is determined based on the damage mode, associated likelihood, consequences, and effectiveness of the inspection technique, offering a rational approach for decision-makers in estimating the inspection interval of bridges and identifying appropriate inspection techniques for different defects. The effectiveness of the proposed method is validated through experts’ judgment. In addition, the proposed approach is demonstrated through a case study utilizing historical inspection reports.
Keywords
Over 600,000 bridges are currently in service across the United States. Periodic inspection of these bridges is a crucial task to ensure their safety and serviceability functions. Typically, bridge owners adhere to a uniform 24-month inspection interval to satisfy the National Bridge Inspection Standards (NBIS) ( 1 ). However, a one-size-fits-all approach may not address the varying inspection needs owing to the substantial differences among bridges in design characteristics, operating environments, loading conditions, age, and current condition. For instance, new bridges built to recent design specifications in benign environments may require less frequent inspections compared to older bridges in harsher environmental conditions. Additionally, certain types of damage may be unlikely to develop between inspection intervals, thus the inspection interval can be extended in such cases. For example, newly constructed bridges with accordance to the recent design, material, and fabrication standards are unlikely to develop fatigue cracks.
Considerable research efforts have been dedicated to developing a systematic approach for estimating inspection intervals. The concept of reliability has been increasingly implemented for maintenance and inspection planning ( 2 – 8 ). Reliability is generally defined as the ability of a component or a system to perform its intended function within a certain time frame. Typically, reliability is assessed by developing a theoretical model that evaluates the capacity of a component or system, where materials, deterioration models, loading, geometries, and so on, are treated as random variables that follow certain probabilistic distributions ( 2 , 3 , 6 , 8 ). Reliability is also considered for finding the optimum maintenance and inspection plan by formulating the inspection scheduling as an optimization problem aiming to minimize the cost function, known as the objective function ( 4 , 5 , 7 ). The optimum inspection interval can then be obtained by adjusting the interval within appropriate constraints such as safety and maximum allowable interval.
Other studies have attempted to use inspection data to develop statistical stochastic models that predict the future condition of a bridge or its components, which can then be used for inspection and maintenance planning ( 9 – 17 ). Generally, the deterioration process is modeled as one or multiple variables that follow certain probability distributions, such as Weibull, gamma, and so on. These probabilistic models can be classified as state-based models or time-based models ( 17 ). The deterioration process in state-based stochastic models is estimated based on the probability of the bridge element to change from one condition to the other. Markov chain is a common type of state-based stochastic models, which is basically predict the likelihood of the bridge element to change from its current condition to the next condition ( 9 , 11 , 12 , 16 , 17 ). In the time-based model types, the deterioration process can be described using probability of distributions, such as Weibull, gamma, and so on, where the time period that the bridge element stays at a certain condition is considered the random variable (13–15, 17 ).
However, the practical implementation of these approaches is quite complex and requires a large amount of reliable data. Unfortunately, the needed unbiased quantitative historical data on bridge deterioration is often incomplete or unreliable, which can lead to unrealistic estimations of future performance. Furthermore, these approaches tend to focus on the strength limit state, overlooking serviceability and some safety aspects. For example, although concrete deck spalling may not severely reduce the deck’s load-carrying capacity, falling debris may pose a risk to public safety if the bridge spans a heavily trafficked roadway. Additionally, traffic delays owing to lane or shoulder closures for maintenance can severely impact the serviceability of bridges with high traffic volumes. Thus, incorporating these approaches may not fully meet the safety and serviceability requirements intended by the inspection planning.
The risk-based inspection (RBI) incorporated the probability of the defects to occur and the safety and serviceability consequences. The RBI approach has been adopted in various industries for making inspection and maintenance decisions ( 18 – 20 ). Nearly a decade ago, federal legislation mandated the Federal Highway Administration (FHWA) to consider the RBI approach for bridge inspections ( 21 ). Consequently, the National Cooperative Highway Research Program (NCHRP) Report 782 was developed to provide guidelines on implementing RBI ( 22 ). In 2022, the RBI approach was formally permitted to be used in establishing inspection intervals for highway bridges ( 1 ). This approach allows for a systematic assessment of risk and prioritizes inspection resources where they are most needed. The approach is established by evaluating the risk associated with each component. The generic definition of risk is a combination of the probability of an undesirable event occurring and its associated consequences assuming the event occurs as it is illustrated in Equation 1

The inspection interval for a given bridge component involves identifying damage modes and associated occurrence and consequence factors. The occurrence factor measures the likelihood that the damage mode under consideration will occur, and the consequence factor is a measure of the outcomes assuming the damage mode occurs. As the occurrence and consequence factors for a given damage mode are determined, the inspection interval can be obtained from a risk matrix such as shown in Figure 1. Components with high risk require inspection at shorter intervals while those with low risk can be inspected at extended intervals.

Basic risk matrix for determining inspection intervals ( 22 ).
While the current RBI practice assists bridge owners in determining the appropriate inspection interval, it does not account for the reliability associated with the inspection technique used to conduct the inspection. The reliability of the inspection technique is an important factor that should be included in determining the inspection interval since some defects may not be reliably detected through visual inspection. Therefore, even very frequent, but unreliable inspections, will not decrease risk. Therefore, this paper proposes a methodology that integrates the reliability of the inspection technique into the RBI approach with the goal of improving safety and reliability. The inspection effectiveness factor (IEF) is introduced to the RBI methodology to account for the reliability of the inspection technique in detecting the damage mode under consideration. The inspection interval in the new RBI approach is determined by considering the occurrence and consequence factors, as well as the IEF for a given damage mode.
Background
Following is an overview of the RBI practice outlined in NCHRP Report 782, including a general explanation of the main parameters of the RBI approach ( 22 ). This section also provides an overview of the implementation of the reliability of inspection techniques in RBI practices in other industries.
Overview of RBI
The process of implementing the RBI approach is established by developing the Risk Assessment Panel (RAP), which is a group of experts assembled at the owner level. The evaluation of the occurrence and the consequence factors for a given damage mode are based on the collective judgment of the RAP. The RAP members evaluate the reliability characteristics of the bridge within the owner’s operational environment and the potential consequences associated with each damage mode. It is essential that RAP members are familiar with the owner’s operational environment, design requirements, bridge management, and bridge characteristics, as these factors can vary significantly between states.
Damage Mode
The damage mode for a bridge component refers to any potential defects that an element may develop over its service life. It’s crucial to distinguish between damage modes and deterioration mechanisms. Deterioration mechanisms are defined as the processes through which an element deteriorates, such as corrosion or fatigue. In contrast, damage modes are the specific types of damage that result from these mechanisms, such as section loss or fatigue cracks, and are observed and recorded during the inspection.
Occurrence Factor (OF)
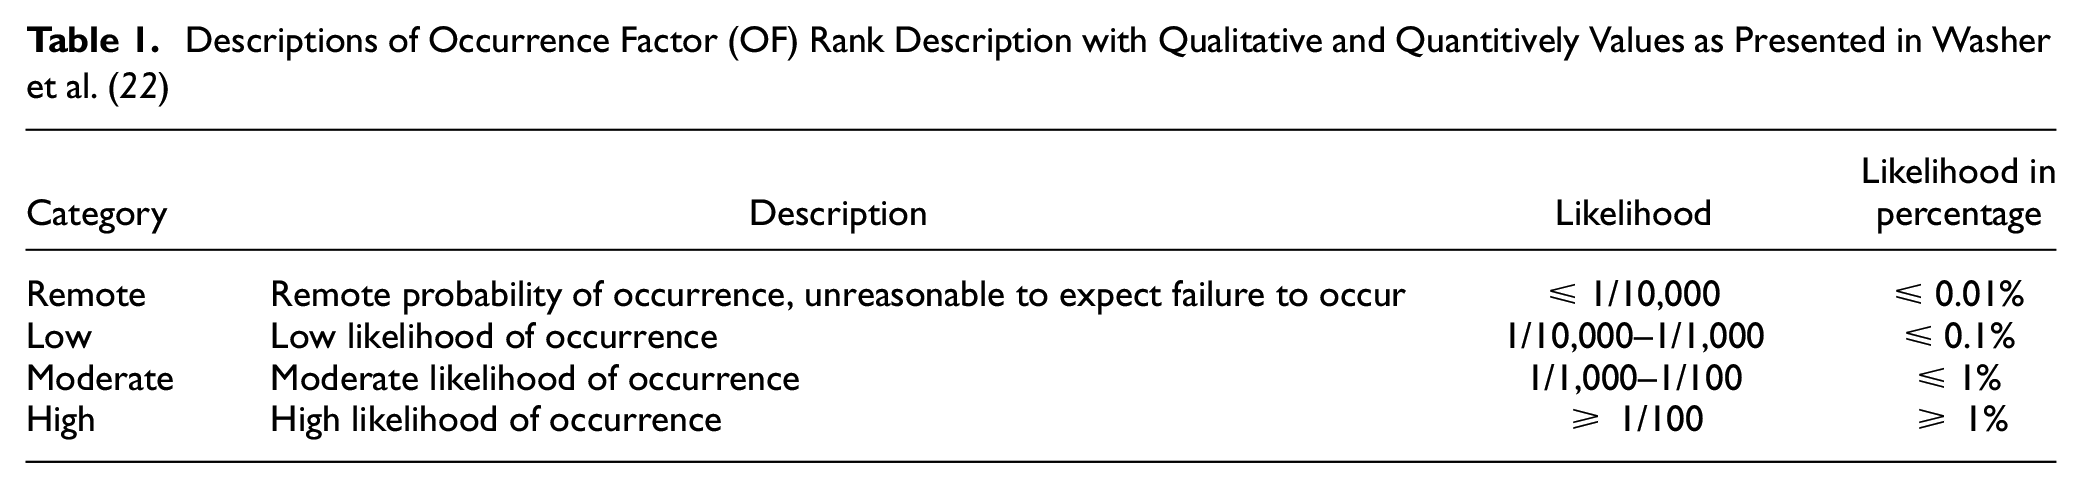
This factor is a measure of the likelihood or probability of the given damage mode occurring over a period of time and resulting in failure. “Failure” is defined in this context as when a bridge component (deck, superstructure, or substructure) is “no longer performing its intended function to safely and reliably carry normal loads and maintain serviceability” ( 22 ). Generally, the component condition rating of severe condition (condition rating 3) is used as practical measure of “failure.” However, complete member failure owing to brittle fracture, for example, may also be an outcome for some damage modes. The occurrence factor for a specific bridge element is evaluated based on the component attributes that can be related to design characteristics, element condition, and loading condition. These attributes contribute to the element’s performance, durability, and reliability. For instance, a bridge deck may have favorable design attributes that may delay the development of corrosion, such as epoxy coated rebars and an adequate concrete cover. In contrast, corrosion may develop more rapidly if the concrete deck has unfavorable design attributes such as unprotected rebars and minimal concrete cover. The occurrence factor ranges from remote, where the damage mode is unreasonably likely to occur, to high, where the damage mode is more likely to occur. Table 1 presents an example of commonly used descriptors and estimates likelihoods associated with various categories of occurrence.
Descriptions of Occurrence Factor (OF) Rank Description with Qualitative and Quantitively Values as Presented in Washer et al. ( 22 )
Consequence Factor (CF)
The consequence factor represents the potential outcomes of a particular type of damage, assuming the failure of the evaluated component. While it's not expected that the evaluated component will fail when using the risk-based approach, such an assumption is necessary to determine the CF. The consequences of a certain damage mode may include impacts on safety, serviceability, and economics. This factor can range from low, indicating little impact on serviceability and safety, to high, indicating severe impacts on serviceability and safety, as shown in Table 2.
Descriptions of Consequence Factor (CF) Ranks as Presented in Washer et al. ( 22 )

Risk Matrix
The inspection interval is determined based on the evaluation of the occurrence and the consequence factors for a given damage mode. The vertical axis represents the OF, and the horizontal axis represents the CF of the damage for given element. The risk matrix is constructed such that components with higher risk, that is, higher OF and CF, tend toward the upper right corner and necessitate a shorter inspection interval as compared to components with lower OF and CF, which tend toward the lower left corner. As different bridge components have different risk value, the real inspection interval of the bridge is based on the shortest inspection interval determined from the analysis.
Overview of Incorporating IEF in RBI
Inspection effectiveness is defined as the ability of the inspection technique to adequately detect and quantify damage in a particular circumstance. The effectiveness of the inspection technique depends on multiple factors, such as inspector training, skills, type of defect, accessibility to the component, and the inherent uncertainty of some inspection techniques ( 20 ). Incorporating inspection effectiveness into RBI is not a new concept. NCHRP 12-82, the project that produced the NCHRP 782 report, considered the reliability of the inspection technique in some situations when estimating the OF for certain damage modes ( 22 ). For example, when evaluating spalling in a concrete deck constructed with a stay-in-place (SIP) form, extra points are added to the occurrence factor calculation to account for uncertainty of the hidden deck soffit. However, this add-on attribute does not significantly change the occurrence factor. In fact, in some situations, the occurrence factor of a deck with an SIP form can become identical to that of a deck without an SIP form, and thus, resulting in the same inspection interval for both, depending on other attribute of the deck such as rebar coating (for example, epoxy versus bare reinforcing steel), overlay intended to prevent corrosion damage, .
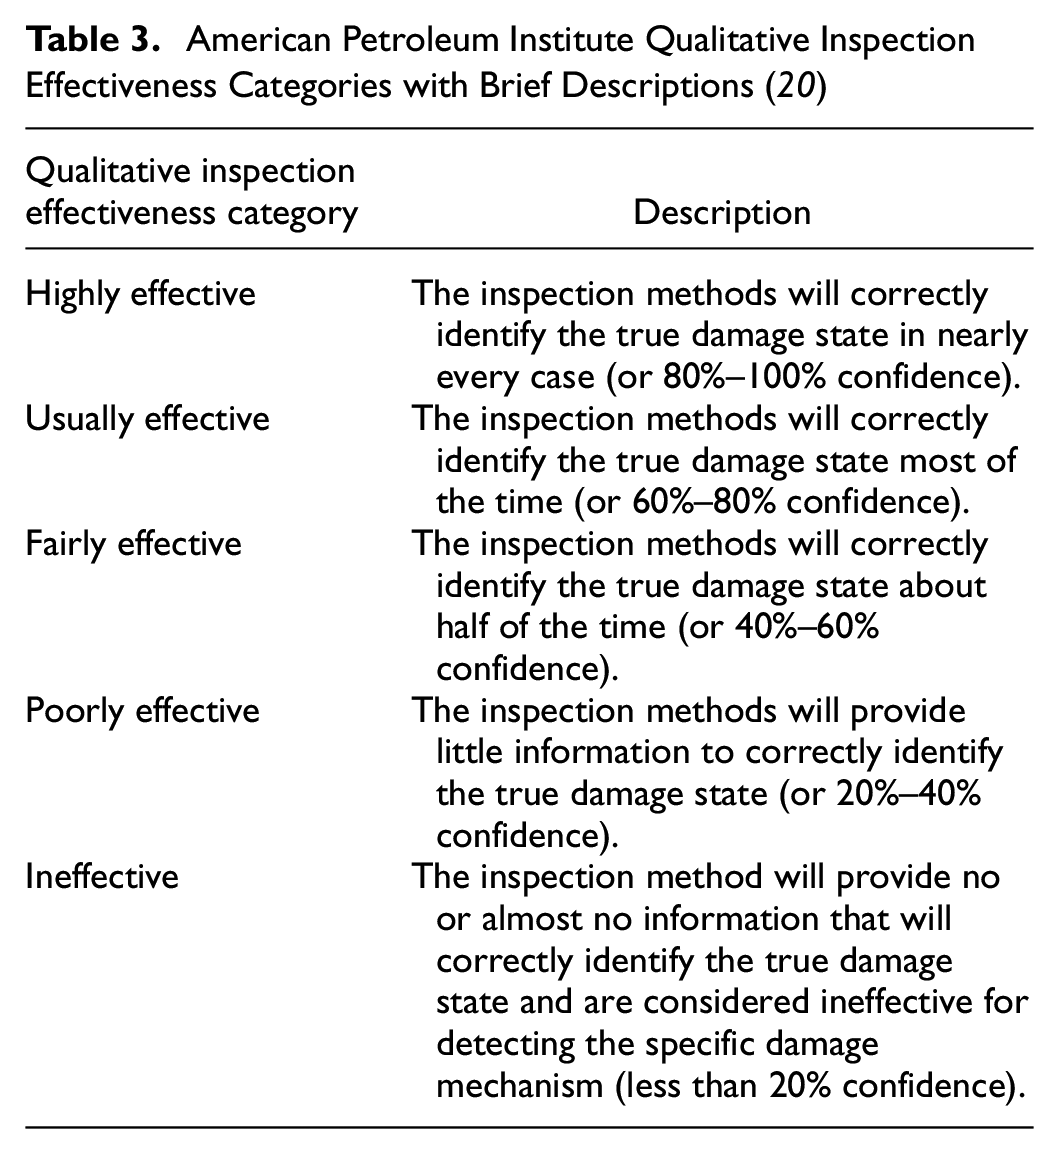
In the American Petroleum Institute (API) RBI practice, the concept of inspection effectiveness is employed in the calculation of the probability of failure ( 20 ). Inspection effectiveness is categorized into five groups, from A to E, where A signifies the most effective inspection and E denotes either no inspection or an ineffective inspection technique, as depicted in Table 3.
American Petroleum Institute Qualitative Inspection Effectiveness Categories with Brief Descriptions ( 20 )
The inspection effectiveness is integrated into the calculation of the probability of failure by modifying the model for independent variables based on the effectiveness of the inspection technique. Therefore, using a less effective inspection technique results in increased risk associated with the element.
For instance, in Figure 2, inspection categories A, B, and C are recommended as they yield a risk value below the risk target on the planned date. Conversely, category D is not acceptable because it results in a risk value higher than the target risk. Therefore, in such cases, options such as shortening the inspection interval or employing a more effective inspection category can be considered to mitigate the risk of the element.

Plot showing the impact of inspection effectiveness on risk over time ( 20 ).
In the aerospace industry, inspection effectiveness is integrated through a contextual factor referred to as a Cofactor ( 23 ). This factor is a combination of three distinct sub-factors: criticality, severity, and detectability factors. criticality factors are based on the importance of the component, while the severity Factor outlines the probability of the defect progressing to cause severe consequences. The detectability factor considers the visibility of the component and the reliability of the inspection technique. Cofactor values range from “defect always detected” to “defect visually not detectable,” with values varying from 0.5 to 2.0, respectively. In other words, the Cofactor could either halve the risk if the defect is always detectable or double the risk if the defect is not visually detectable, as illustrated in Figure 3. Once the Cofactor is determined, the risk score (RS) is calculated by multiplying the consequence, likelihood, and Cofactor.
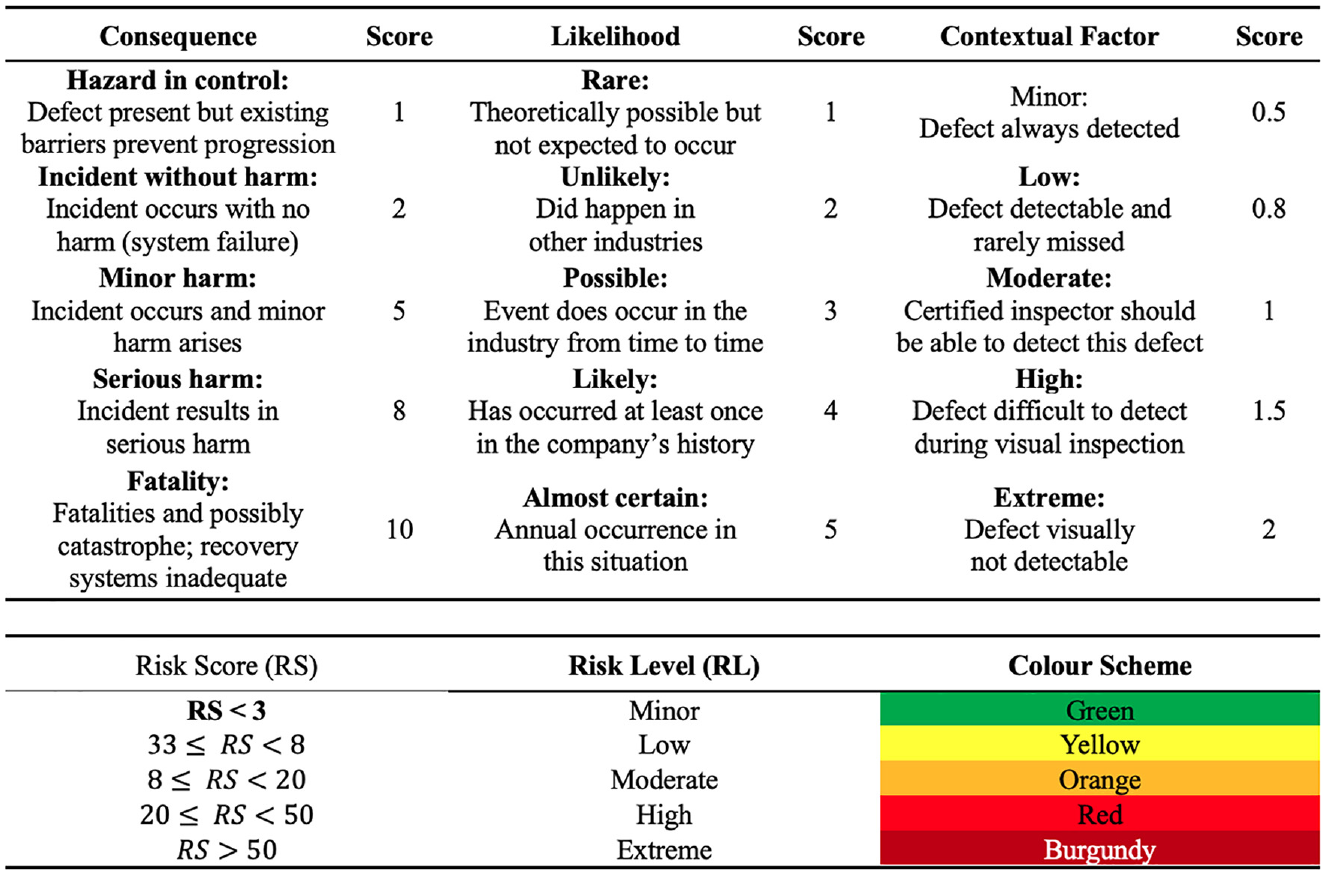
Consequence, likelihood and contextual factors description and risk categories limits ( 23 ).
Proposed Methodology
Rationale for Selection of the Proposed Methodology
In this study, the reliability of inspection techniques has been assessed based on engineering judgment and experience. Evaluating inspection reliability is a complex task owing to the involvement of numerous parameters that may not be easily quantifiable. A review of the literature indicates a limited number of studies addressing the reliability of visual and nondestructive testing (NDT) inspection methods ( 24 – 28 ). Quantitative evaluation of inspection reliability has posed significant challenges, primarily owing to the limited availability of quantifiable data and the difficulties encountered in establishing correlations between reliability and factors thought to influence the effectiveness of inspection techniques ( 25 , 28 ). The comparison of in-depth condition ratings with those obtained from routine inspections may not provide an accurate assessment of the reliability of the latter approach ( 26 ). This is because in-depth condition results may not consistently represent the true condition of the components, as supported by several studies ( 27 – 29 ). Furthermore, among various statistical approaches, expert judgment has also been demonstrated as an effective means in assessing NDT uncertainties in pressure vessels ( 24 ). Given the limited data, difficulties in correlating parameters with technique reliability, and the proven efficacy of expert judgment in this domain, expert judgment is considered in this paper to be a practical approach for evaluating the reliability of inspection techniques. Nevertheless, while one may disagree with how the authors ranked various non-destructive evaluation (NDE) techniques, the reader should simply view the rankings for the purpose of illustrating the methodology.
Expert Panel
The selection of expert panel members and the elicitation of expert judgment play a vital role in the evaluation process. Typically, an expert panel is assembled at the owner level owing to the variability of inspection practices and agency requirements between different owners. The panel typically consists of the inspection program manager, structural engineering experts, and NDE specialists. It should be noted that the expert panel members are typically similar to the RAP members except they would have additional quantitative knowledge and experience with NDE techniques in the context of bridge inspection. Incorporating NDE specialists with experience and an understanding of bridge components ensures a comprehensive assessment of the reliability of NDE tests in detecting various damage modes. The inspection program manager also plays a vital role in providing knowledge about the agency’s inspection procedures and practices. Structural engineering experts contribute valuable knowledge concerning common defects within the owner’s bridge inventory.
Evaluation Prosses
The evaluation of the IEF involves a thorough analysis of damage types, inspection techniques, and component geometries. Human factors can also have a significant impact on inspection effectiveness. However, accurately characterizing the impact of human factors remains a challenge and requires more comprehensive data and analysis than are currently available, and as such human factors was not included in assessing of inspection effectiveness at this stage in the development ( 30 – 32 ).
In the assessment process, a hypothetical scenario illustrating both the damage type and geometry of the structural element in question was presented to a group of experts. Identifying the defect type is important, as it allows experts to list appropriate inspection techniques for the specific damage. The scenario must include the geometry and the material type of the element since the reliability of certain inspection techniques varies depending on these factors.
A Delphi approach is used to elicit expert knowledge from the RAP. This approach seeks to develop consensus from a group of experts based on a series of formulated questions. For assessing the inspection effectiveness, the experts were asked to evaluate and rank each inspection technique based on its anticipated effectiveness in detecting the specific damage mode and geometry. Five levels of inspection effectiveness were considered, ranging from highly effective to ineffective or component inaccessible. After that, experts rank each technique be in increments of 10% within each level. The combined total of the five inspection categories for each technique must equal 100% as illustrated in Table 4. Experts then share and compare their evaluations until a consensus is achieved. Following this, the expert responses are examined, and an IEF is designated for each element and its corresponding damage mode. Based on the outcome of the RAP analysis, an IEF with five ranks is proposed as shown in Table 5.
Example of Worksheet of an Expert Response of Evaluating the Inspection Effectiveness Factor (IEF) for Steel Superstructure Corrosion
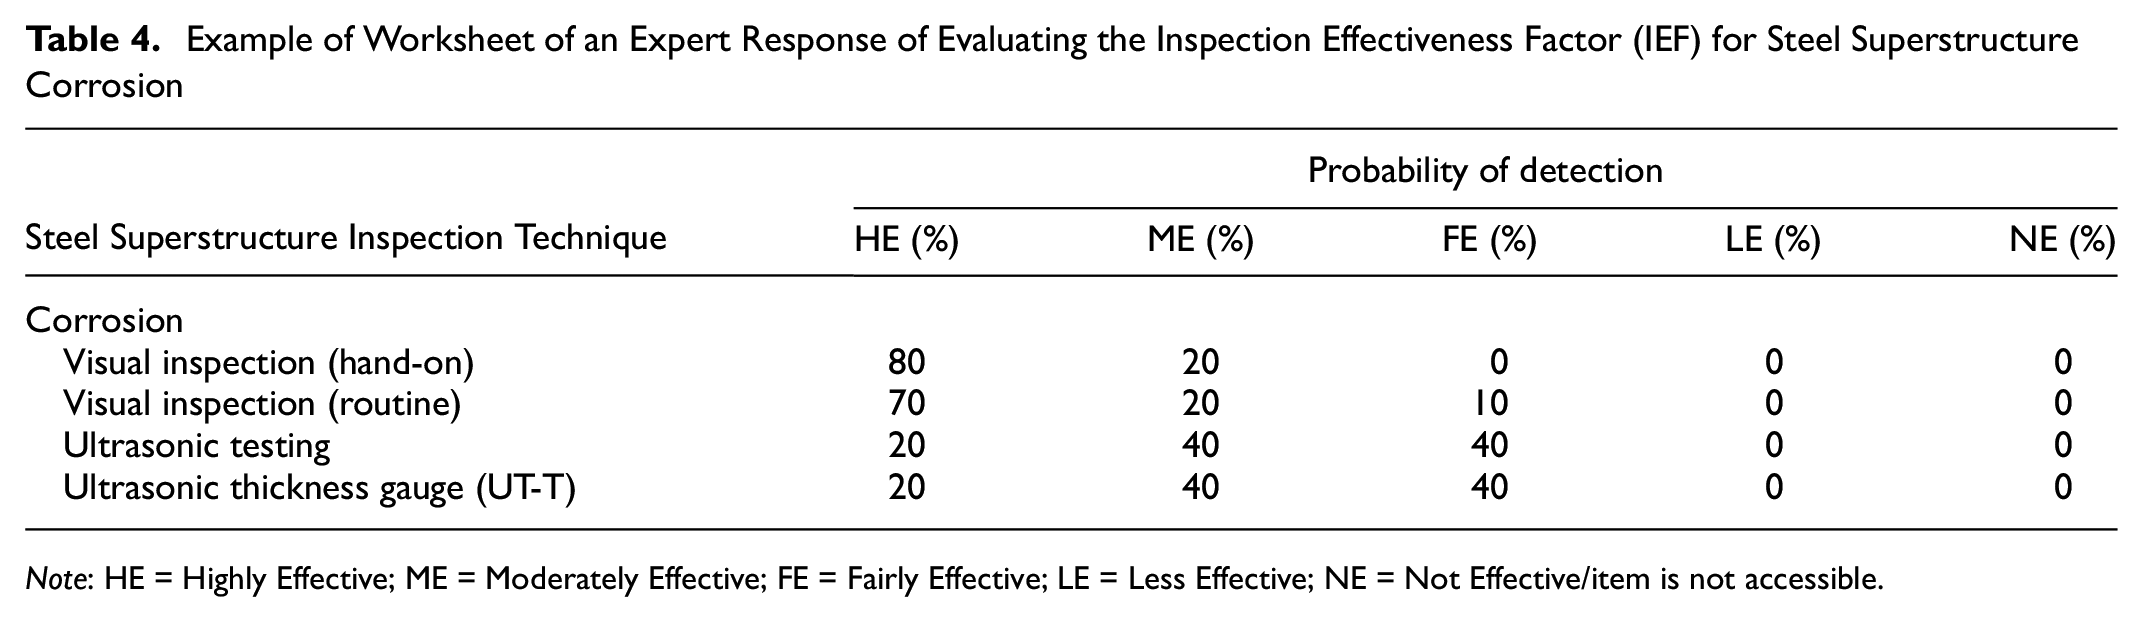
Note: HE = Highly Effective; ME = Moderately Effective; FE = Fairly Effective; LE = Less Effective; NE = Not Effective/item is not accessible.
Brief Description of the Proposed Inspection Effectiveness Categories, Approximate Probability of Detection and Their Values
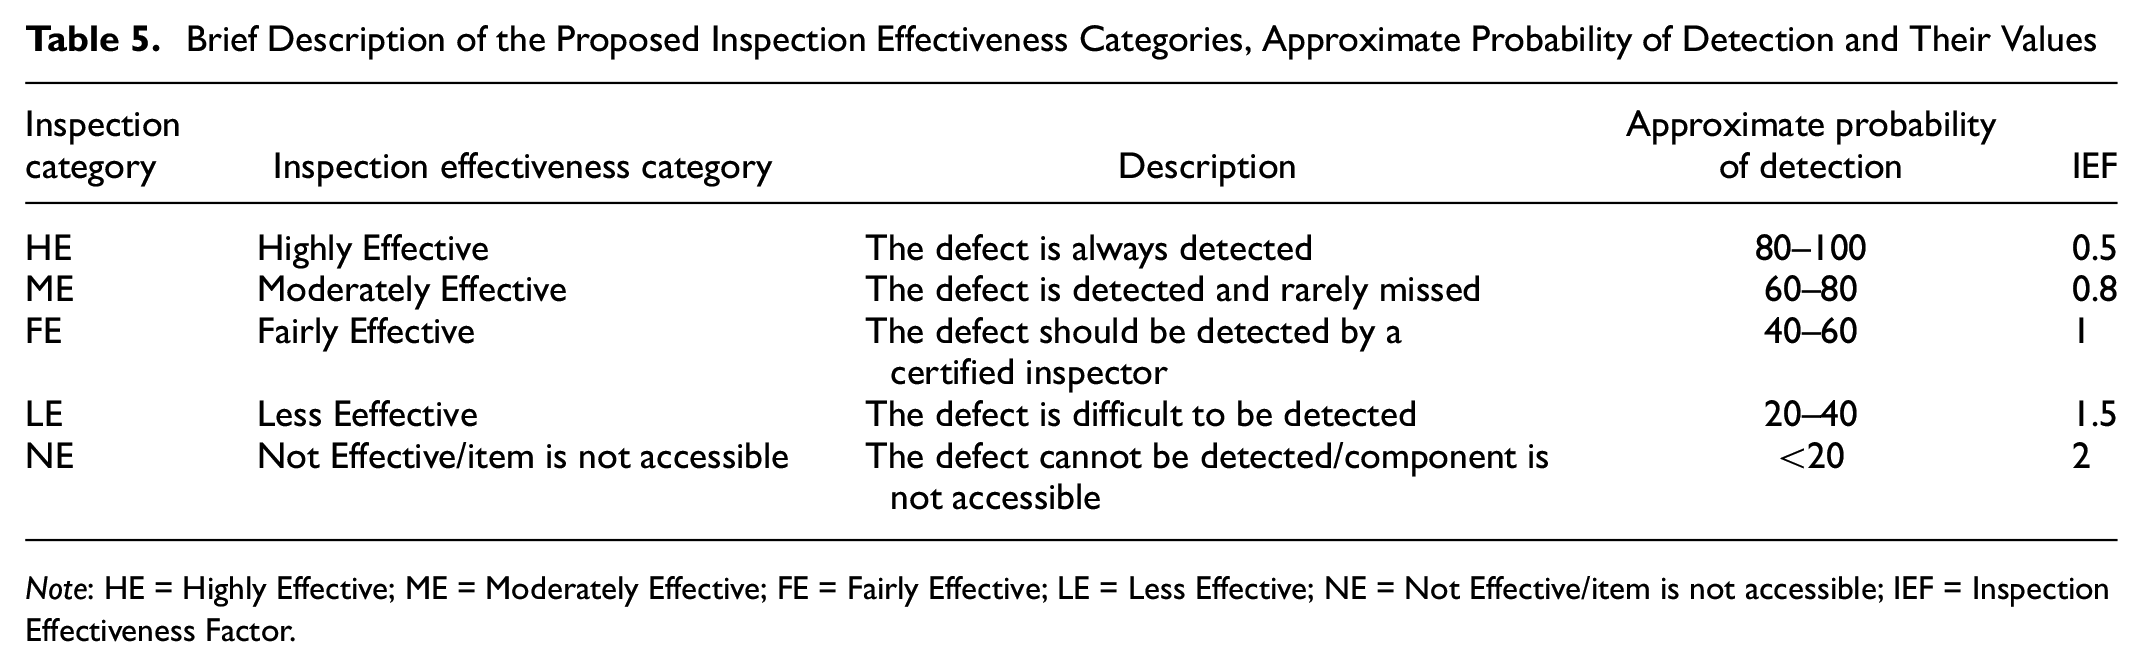
Note: HE = Highly Effective; ME = Moderately Effective; FE = Fairly Effective; LE = Less Effective; NE = Not Effective/item is not accessible; IEF = Inspection Effectiveness Factor.
Implementation of the IEF in Risk-Based Assessment
The effectiveness of an inspection can be correlated with the assessment of the probability of failure ( 18 , 33 ). Early detection of defects allows decision-makers to take early action to mitigate the risk, preventing the occurrence of undesirable consequences. Conversely, identifying a defect after it has reached a severe condition may result in limited and expensive actions to mitigate the risk. Therefore, inspection effectiveness can reduce the risk by detecting defects at an early stage, but it can also increase the risk if defects are detected late, by increasing uncertainty about the element’s condition. The integration of the IEF into the RBI approach is expressed in the form of multiplying the three factors (OF, CF, and IEF). Thus, the inspection interval for an element for a given damage mode is determined based on the numerical value of the risk priority number (RPN) as it is shown in Equation 2.

Elements with higher RPN values need to be inspected at shorter intervals, while those with lower RPN values may be inspected at extended intervals. However, it should be obvious that if the component is inaccessible or the inspection technique is ineffective in detecting the defect under consideration, corrective action should be taken to mitigate the risk, such as changing the inspection technique or removing any obstruction to improve accessibility to the element. For example, consider an inspection of a cable connection assembly with a damage mode of fatigue cracking at the socket and pin connection. Visual inspection is very likely an ineffective technique for detecting this damage mode, resulting in an increase in the total risk priority number by 2 or 1.5 as shown in Table 6. Thus, changing the inspection technique is mandatory since risk cannot be mitigated by inspection, even if multiple inspections are performed. The primary goal of incorporating the IEF into the RBI practice is to guide users in determining the appropriate inspection interval considering the effectiveness of the inspection technique or procedure, rather than conducting multiple ineffective inspections at short intervals.
Example of Inspection Effectiveness Factor (IEF) for Pin Connection Assembly, Assuming Fatigue Damage Mode

Note: HE = Highly Effective; ME = Moderately Effective; FE = Fairly Effective; LE = Less Effective; NE = Not Effective/item is not accessible; IEF = Inspection Effectiveness Factor; NA = not available.
In addition, the implementation of IEF of the highly or moderately effective inspection category (IEF < 1.0) is constrained by the values of CF and OF. IEF can only be applied if the product of the occurrence and consequence factors is less than eight (OF × CF < 8). This limit is determined such that the individual values of CF and OF for a given damage mode remain low or moderate within the inspection interval. In addition, since damage detectability generally increases as an element reaches advanced stages of deterioration, implementing the IEF may underestimate the risk associated with an element. For instance, the IEF cannot be applied to steel girders experiencing severe section loss, since having a better quantitative estimate of severe damage does not change the fact the damage is severe. In other words, if ultrasonic thickness measurements revealed that corrosion has resulted in 95% section loss of the web, it would not be appropriate to use the IEF to increase the inspection interval simply because a robust and reliable NDT method was used to determine the severity of the damage. Applying the IEF factor in such a situation would likely underestimate the risk and may result in component failure before the next inspection.
It should be noted that the implementation of the IEF is not only constrained by the element's condition but rather by the overall value of the OF and the CF. This is because an element with a low or moderate value of the OF not only possesses good condition rating but also generally has sound design and condition attributes. Consequently, if the damage remains undetected, these attributes may contribute to delaying the propagation of defects to a severe condition within the designated inspection interval.
Inspection Interval
After identifying the OF, CF, and IEF, an inspection interval can be obtained using of the risk bar, as illustrated in Figure 4. The risk bar is similar to the risk matrix established in NCHRP Report 782 ( 22 ), and it serves as a visual representation of the three factors of the RPN. The primary objective of the risk bar is to establish the inspection interval of a structural element based on its OF, CF, and IEF for a specified damage mode. Elements exhibiting high occurrence and consequence values, combined with less effective inspection techniques, may necessitate more frequent inspections. Conversely, elements with a lower occurrence and consequence factors, as well as highly effective inspection techniques, may be inspected at an extended inspection interval. The risk bar generally is calibrated to ensure that the risk associated with a given element stays comparatively below the owner-defined risk limit throughout the inspection interval.
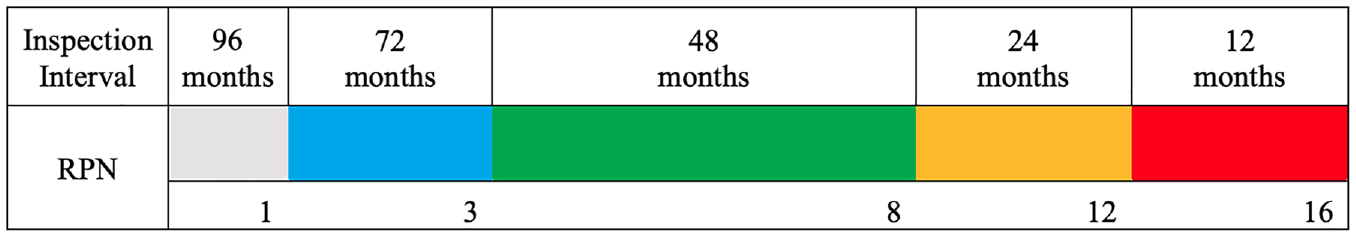
Proposed risk bar for determining the inspection interval.
Although inspection does not mitigate the entire risk associated with failure of a component, it provides knowledge about the condition of the element and thus reduces uncertainty. In some cases, the risk value of the element is unacceptable, necessitating corrective action to mitigate the risk. Therefore, it is important to establish a constant risk level at which mitigation action is needed. The acceptable risk level may vary among agencies based on factors such as regulatory requirements, industry standards, and past experiences. Based on expert judgments, analysis of bridge behavior in the owner’s inventory, and documented experience, one would then set an acceptable risk level (i.e., a maximum value for the RPN). For example, an agency may determine that an acceptable maximum value for the RPN value to be less than 12 (RPN < 12). Furthermore, the acceptance risk level is determined to ensure that the occurrence and consequence factors remain low or moderate within the designated inspection interval. If an element's RPN exceeds the acceptable risk level, corrective action must be taken to mitigate the risk. This may involve reducing the occurrence or consequence factor or utilizing a more reliable inspection technique. Figure 5 presents a flowchart of the proposed methodology, considering the implementation of the IEF and risk limits.
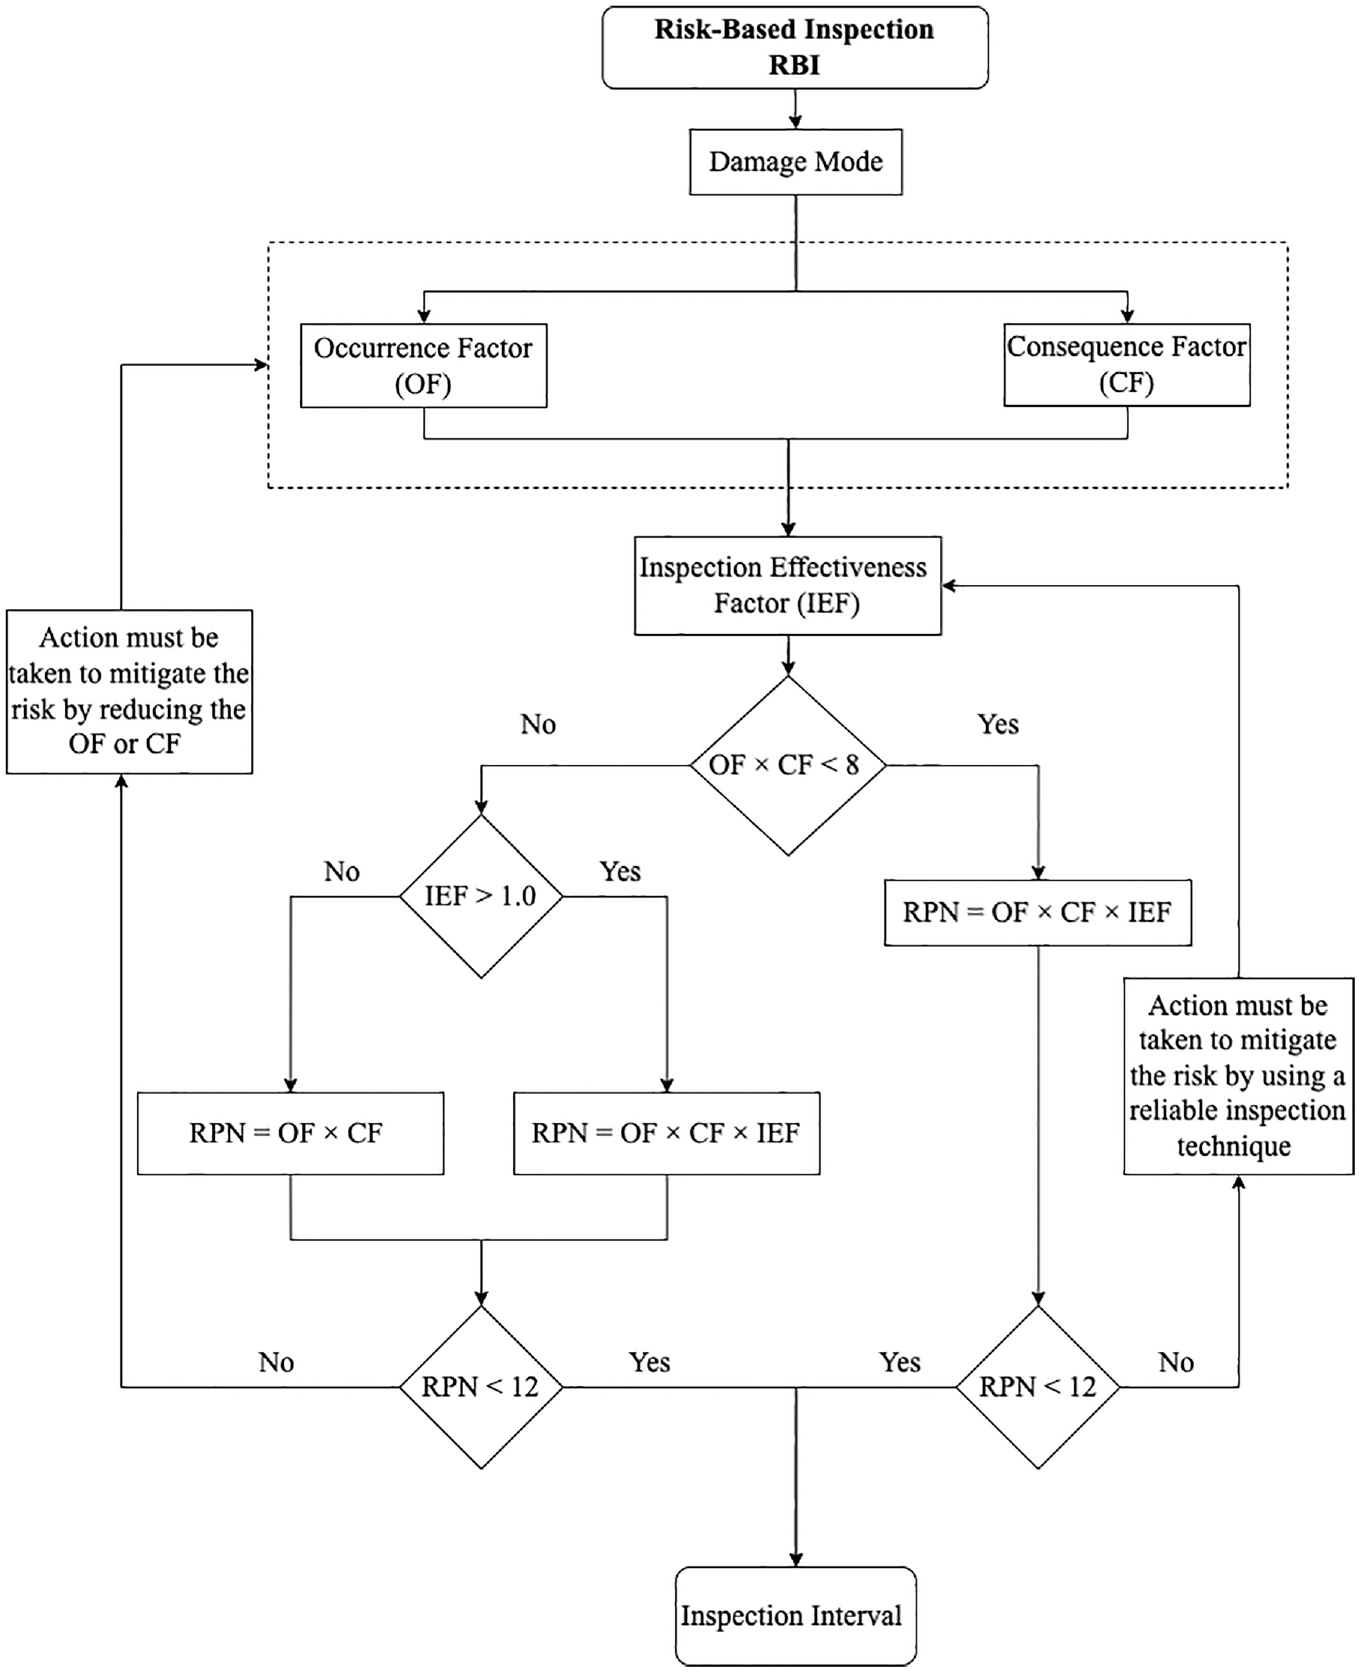
Flowchart of the proposed risk-based inspection (RBI) procedure.
Back Casting Concept
Back casting analysis is used to evaluate if the inspection intervals predicted by the RBI do not impact the safety and serviceability of the bridge ( 34 ). This approach basically poses the following question: Assuming the RBI approach had been used in the past using the inspection data available at that time, does the later inspection data show the element condition deteriorate faster than would have been detected using the proposed RBI interval? For example, if the RBI method, applied using inspection data from 2006, recommends a six-year inspection interval, records from 2006 to 2012 are thoroughly reviewed to ensure that the proposed RBI interval is effective. The assessment criteria for evaluating the effectiveness of the RBI are to confirm that, within the six-year span, the condition of the bridge component did not change significantly, and that no maintenance was delayed because of the proposed RBI interval. The concept of back casting is also adopted to attempt to verify whether any important criteria or factors that were overlooked in the OF or the CF models would have been important to yield an appropriate interval had they been incorporated. Consequently, the RBI approach is calibrated and verified to ensure that the inspection interval obtained by RBI does not compromise the bridge integrity and safety.
Case Studies
In this paper, the presented case studies aim to demonstrate the practicality of the proposed approach and to illustrates the back casting concept on real bridges. It is important to emphasize that while these case studies focus on a specific type of bridges, the methodology itself is not limited to these particular applications. Instead, the bridges considered in the case studies serve as an exemplary context through which the reader can gain a deeper understanding of the methodology and its potential applicability across a wide range of bridge types.
Case Study 1
Overview of the Bridge
The bridge under consideration, a concrete-encased steel I-beam, was built in 1936 with a span length of 48.5 ft. The bridge carries railway traffic and therefore the deck will not be part of the inspections conducted by the department of transportation as this is handled by the railroad. The superstructure comprises multiple concrete-encased I-beams, with the bottom flange being the only visible part of the girder, as depicted in Figure 6. Efflorescence is noticeable between the superstructure panels. The substructure features uncoated steel reinforcement and standard concrete, with a 2.0 in. concrete cover. According to the latest inspection report, the overall condition of the superstructure is fair, exhibiting minor surface rust and scrapes on the bottom flange. However, the substructure is experiencing severe spalling and significant exposed rebars. Currently, inspections of the bridge are conducted every 24 months, and its overall condition ranges from fair to poor.
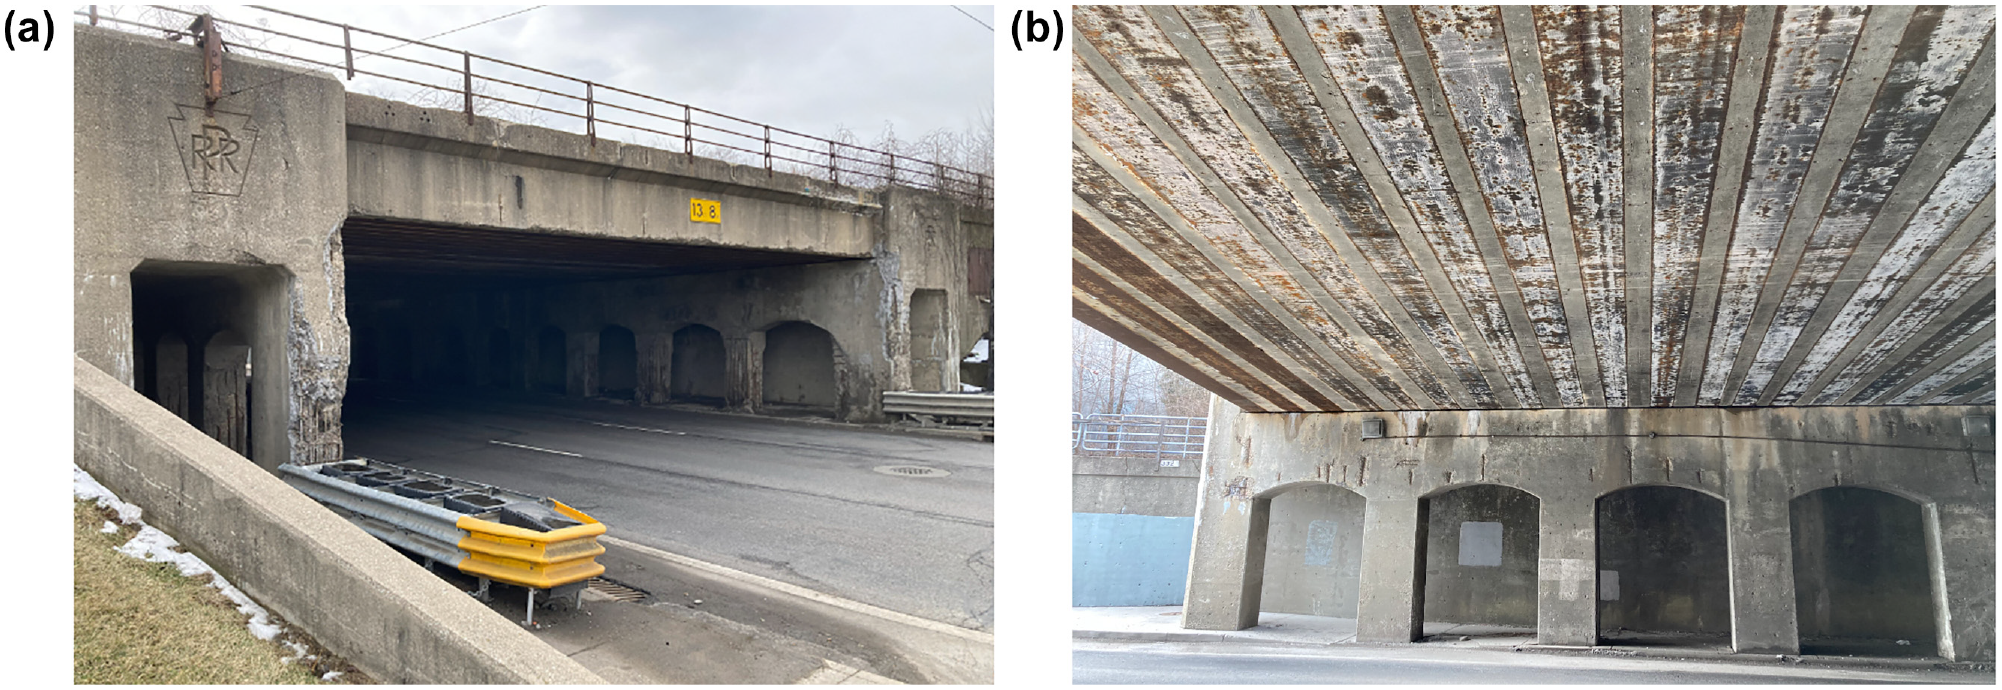
Views of the bridge considered in the case study: (a) side view of the bridge and (b) bottom view of the bridge.
Damage Mode and OF Assessment
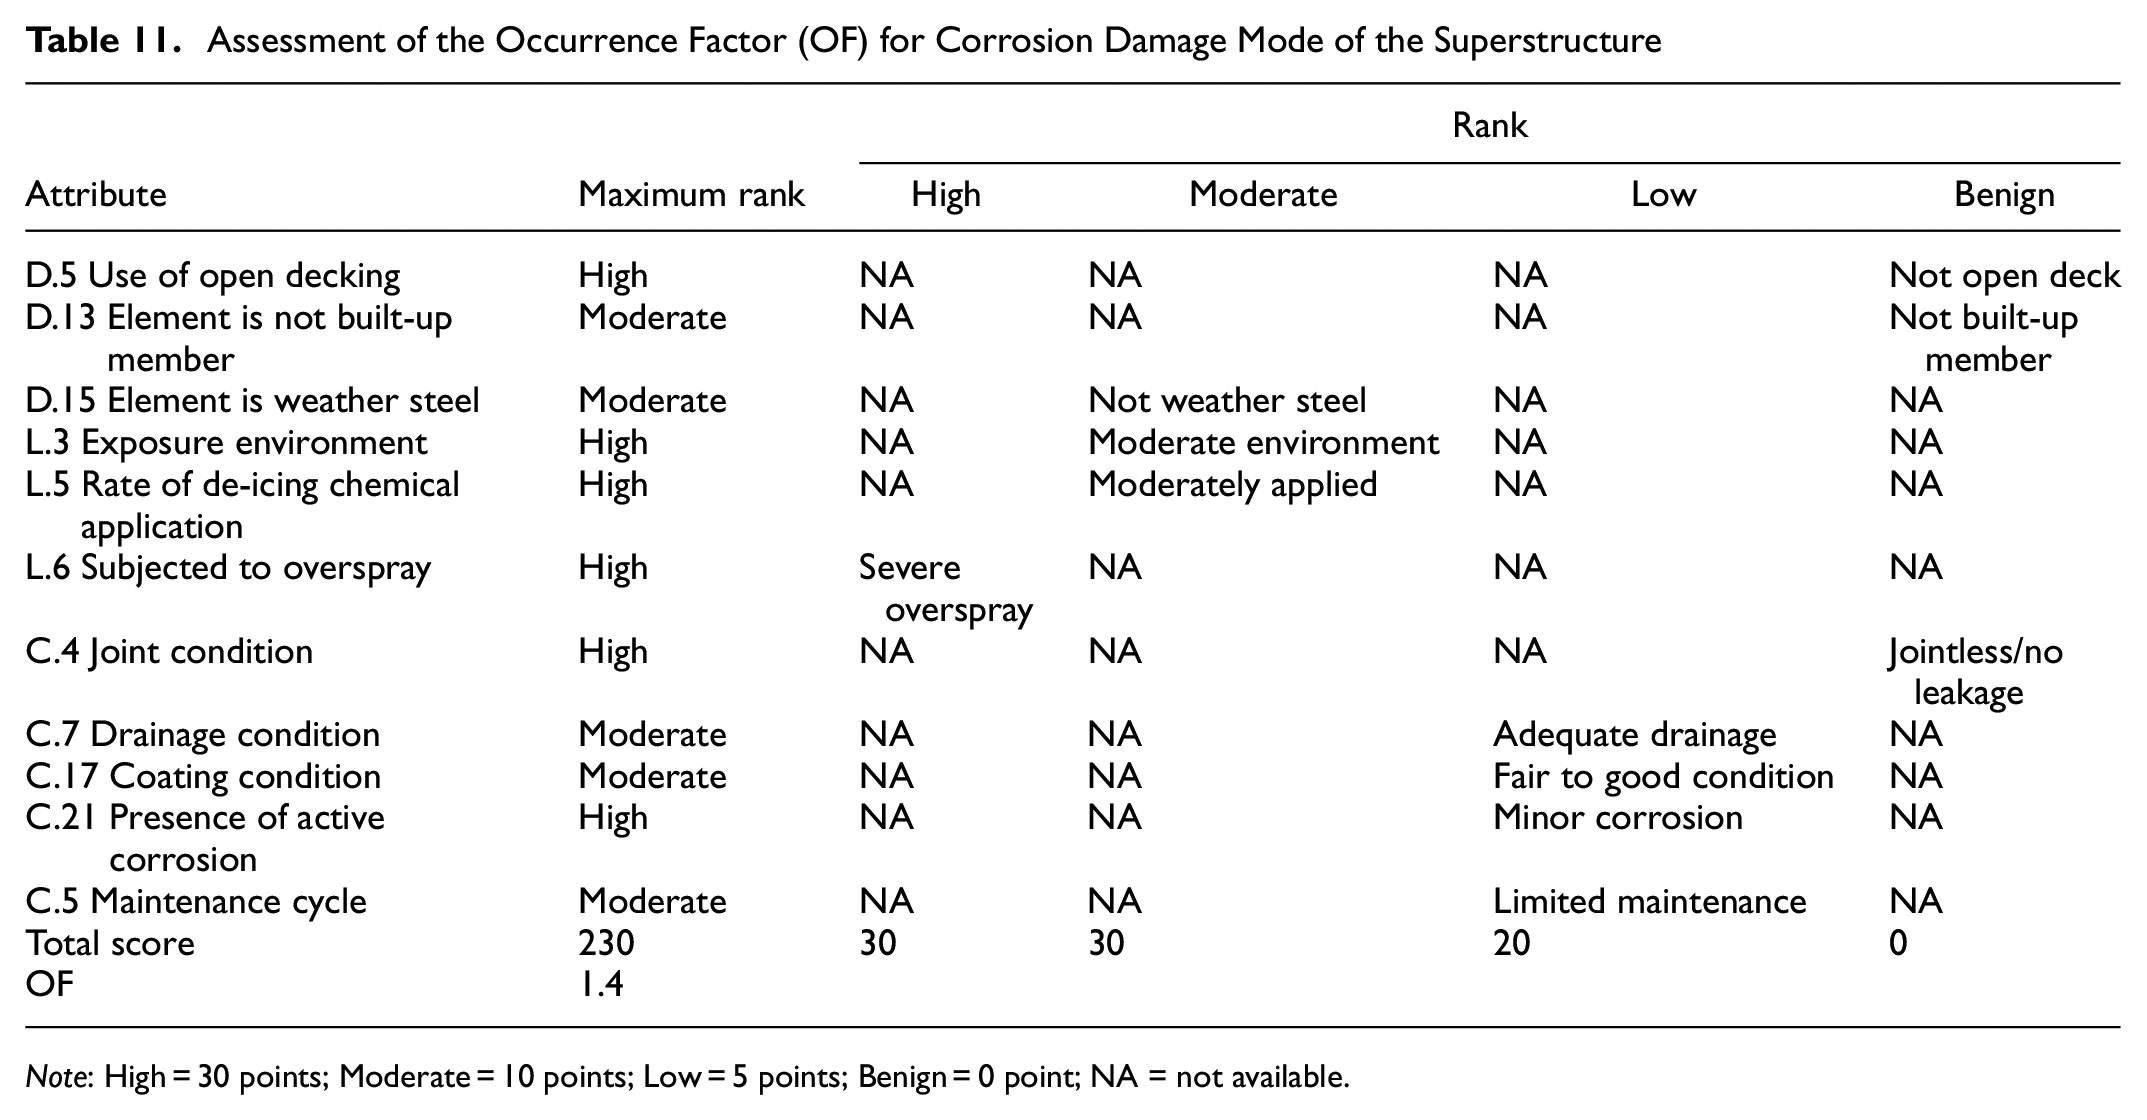
The primary components of the bridge include the concrete-encased I-beams and the substructure. The main damage modes are section loss of the concrete-encased I-beam and spalling of the substructure elements. Based on the condition, design, and loading attributes obtained from inspection reports and design documents, the occurrence factors of the of I-beam section loss and the substructure spalling are evaluated as low and high, as illustrated in Tables 7 and 8, respectively.
Assessment of the Occurrence Factor (OF) for Corrosion Damage Mode of the Superstructure Steel Girders
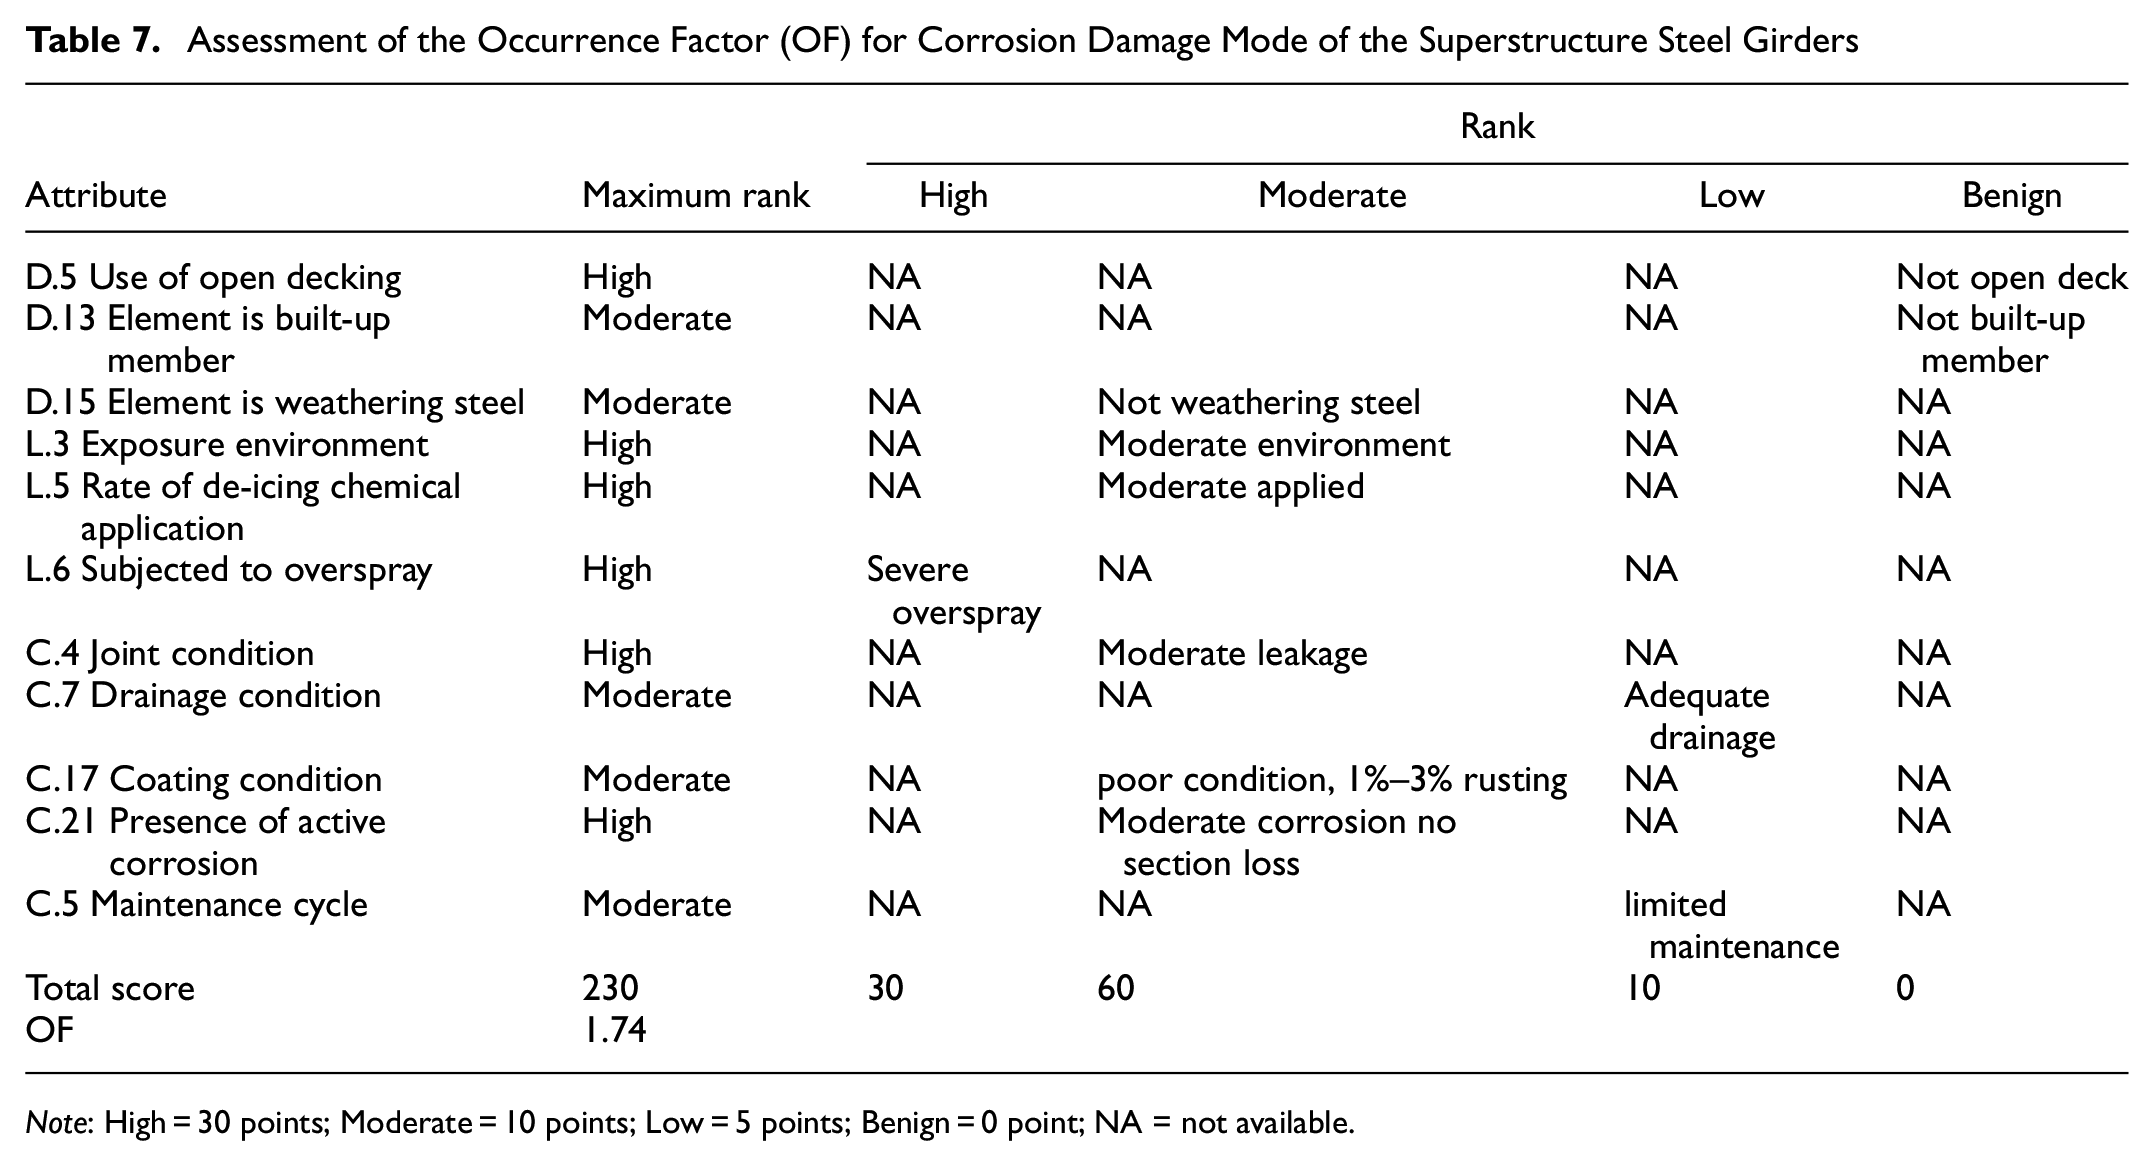
Note: High = 30 points; Moderate = 10 points; Low = 5 points; Benign = 0 point; NA = not available.
Assessment of the Occurrence Factor (OF) for Spalling Damage Mode of the Substructure
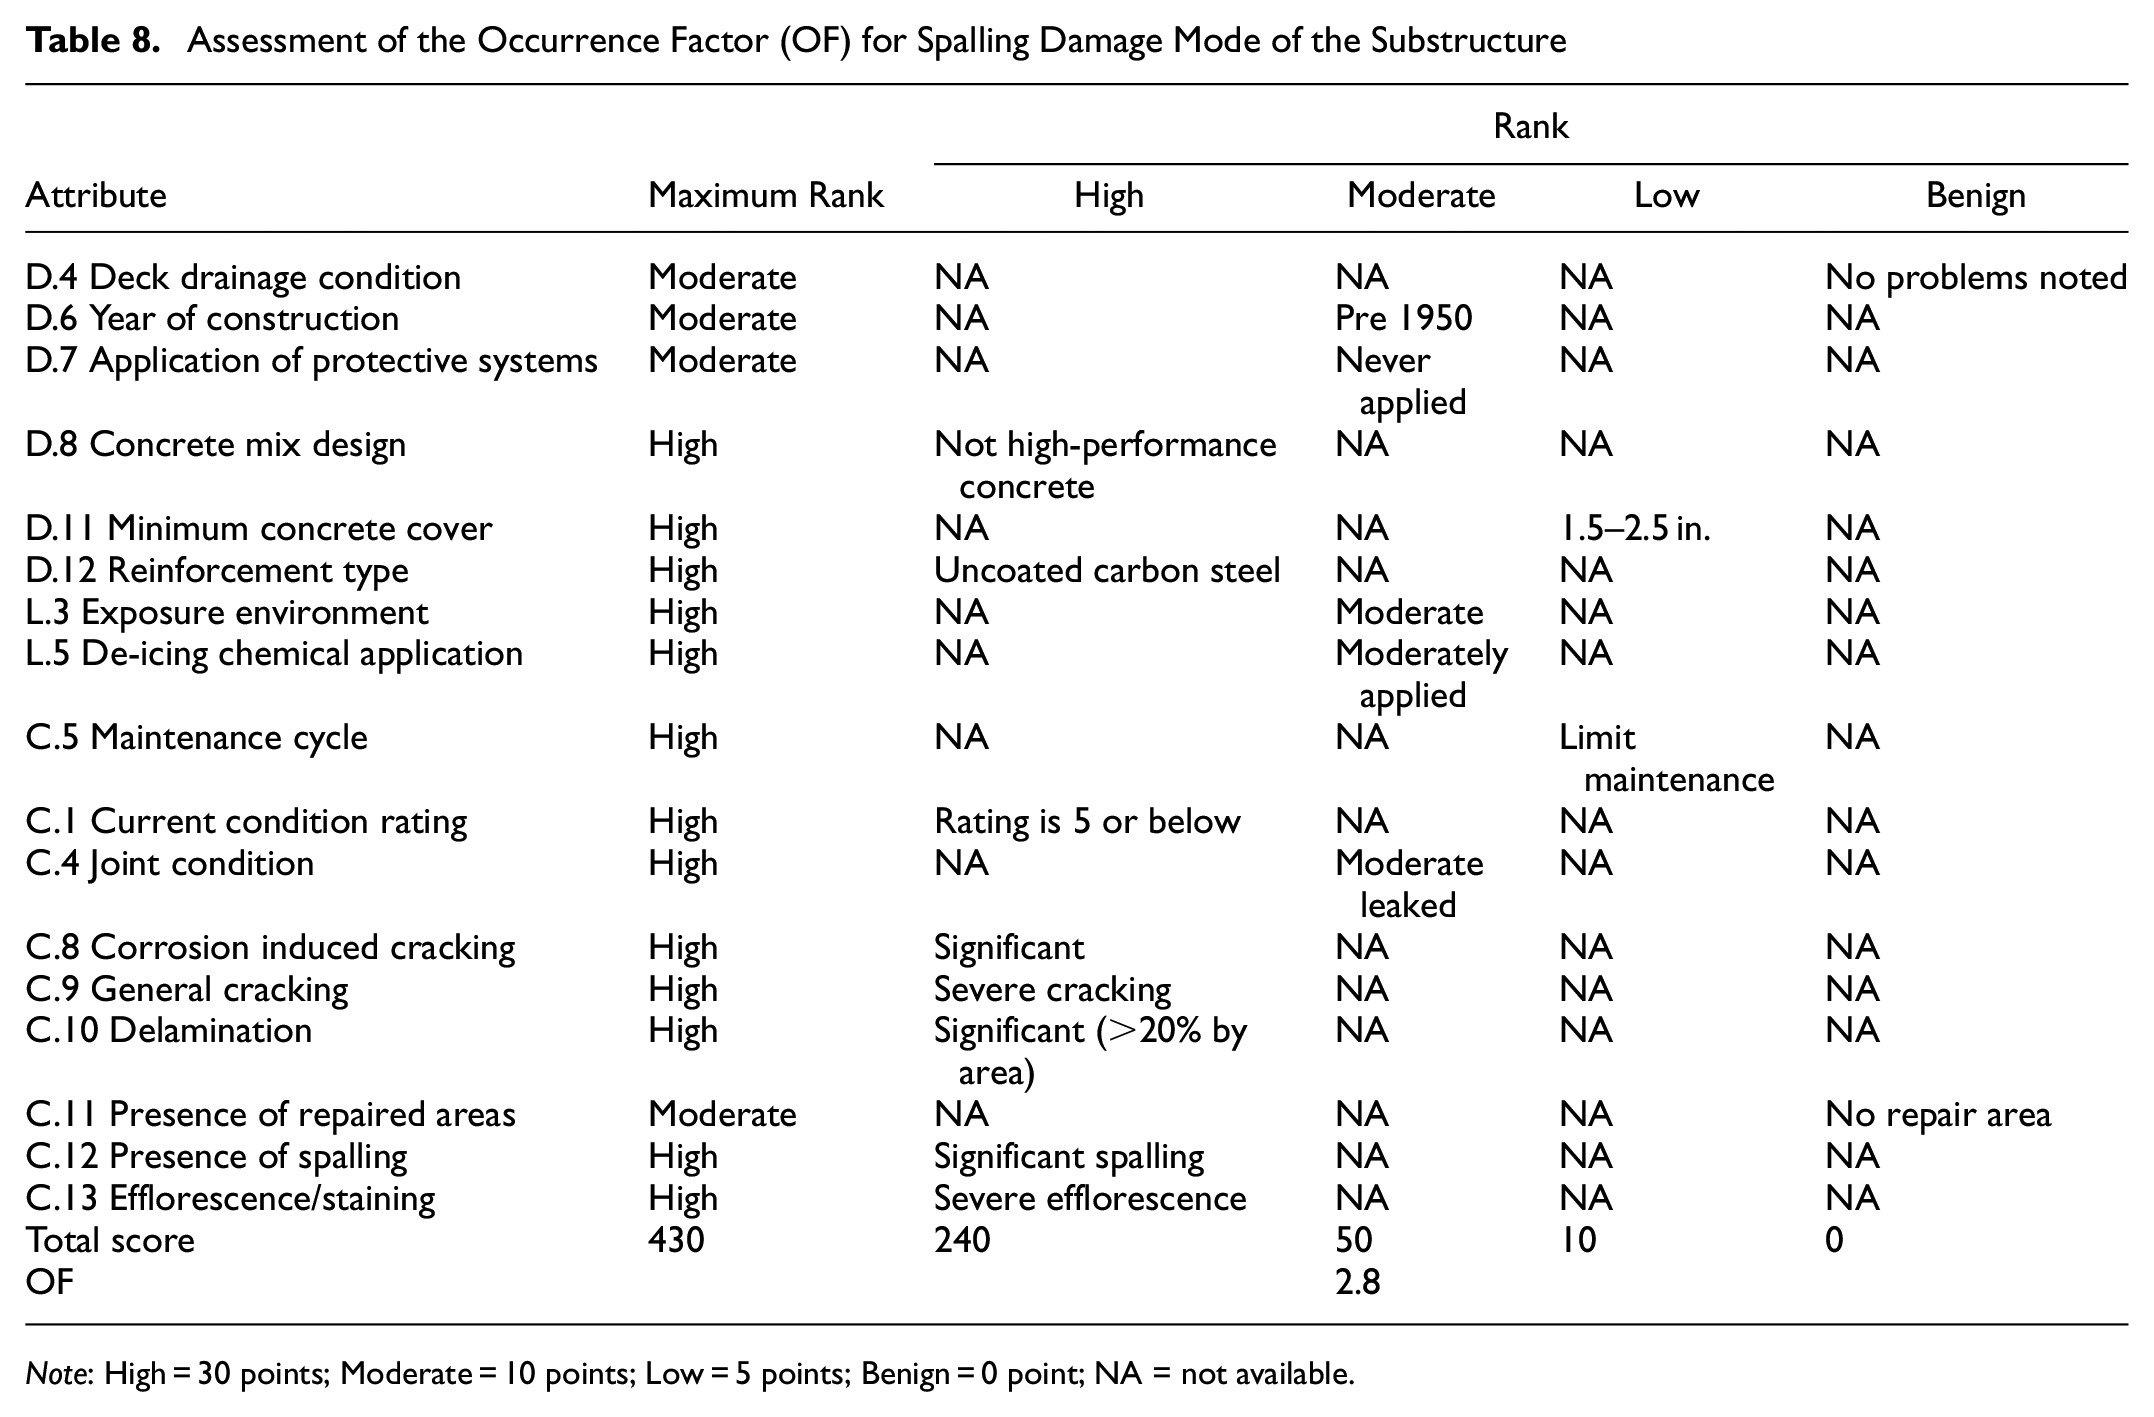
Note: High = 30 points; Moderate = 10 points; Low = 5 points; Benign = 0 point; NA = not available.
CF Assessment
The consequence factor of the superstructure is considered to be low since the superstructure is constructed with a multi-girder system, which is classified as a redundant system under American Association of Highway and Transportation Officials (AASHTO) standards ( 35 ). However, falling debris from the superstructure elements onto the traffic beneath the bridge raises safety concerns, leading to an overall moderate consequence evaluation for the superstructure. Based on rational engineering judgment, the structural capacity of the substructure is expected to remain adequate. However, the potential for falling debris from substructure is considered to be high, given that the bridge passing over an area with moderate traffic volume and the piers are relatively close to the road. This results in an overall moderate consequence factor for the substructure.
IEF Assessment
In the superstructure, the bottom flange is the only part of the girder that can be inspected visually. While the bottom flange is the critical section of the girder, the thickness of the bottom flange cannot be visually determined, and thus the bottom flange may experience significant section loss that could go undetected. As a result, implementing a more reliable inspection technique, such as an ultrasonic thickness gauge, is necessary to reduce the uncertainty associated with the component. For the substructure, visual inspection can be utilized as it is considered to be fairly effective at detecting spalling.
Inspection Interval
The presence of an element with lower inspection effectiveness necessitates a bridge inspection plan with two distinct intervals: routine visual inspections and in-depth inspections. The routine inspection plan is designed to inspect the visible components of the superstructure and substructure, while the in-depth inspection specifically targets the hidden part of the bottom flange. Therefore, the RPN of the superstructure will be calculated considering the IEF as less effective (IEF = 1.5) for visual inspection and moderately effective (IEF = 0.8) when using the ultrasonic thickness gauge. It is worth noting that the risk value for all components is below the risk limit (RPN < 12), meaning no mitigation action is required. Moreover, the IEF can be applied to all components as the product of the occurrence and consequence factors is below the upper limit (OF × CF < 8). The appropriate inspection intervals, based on the RPN values of each element, are calculated and shown in Table 9 and Figure 8.
Summary of the Occurrence Factor (OF), Consequence Factor (CF), Inspection Effectiveness Factor (IEF) for Each Component and its Corresponding Inspection Interval
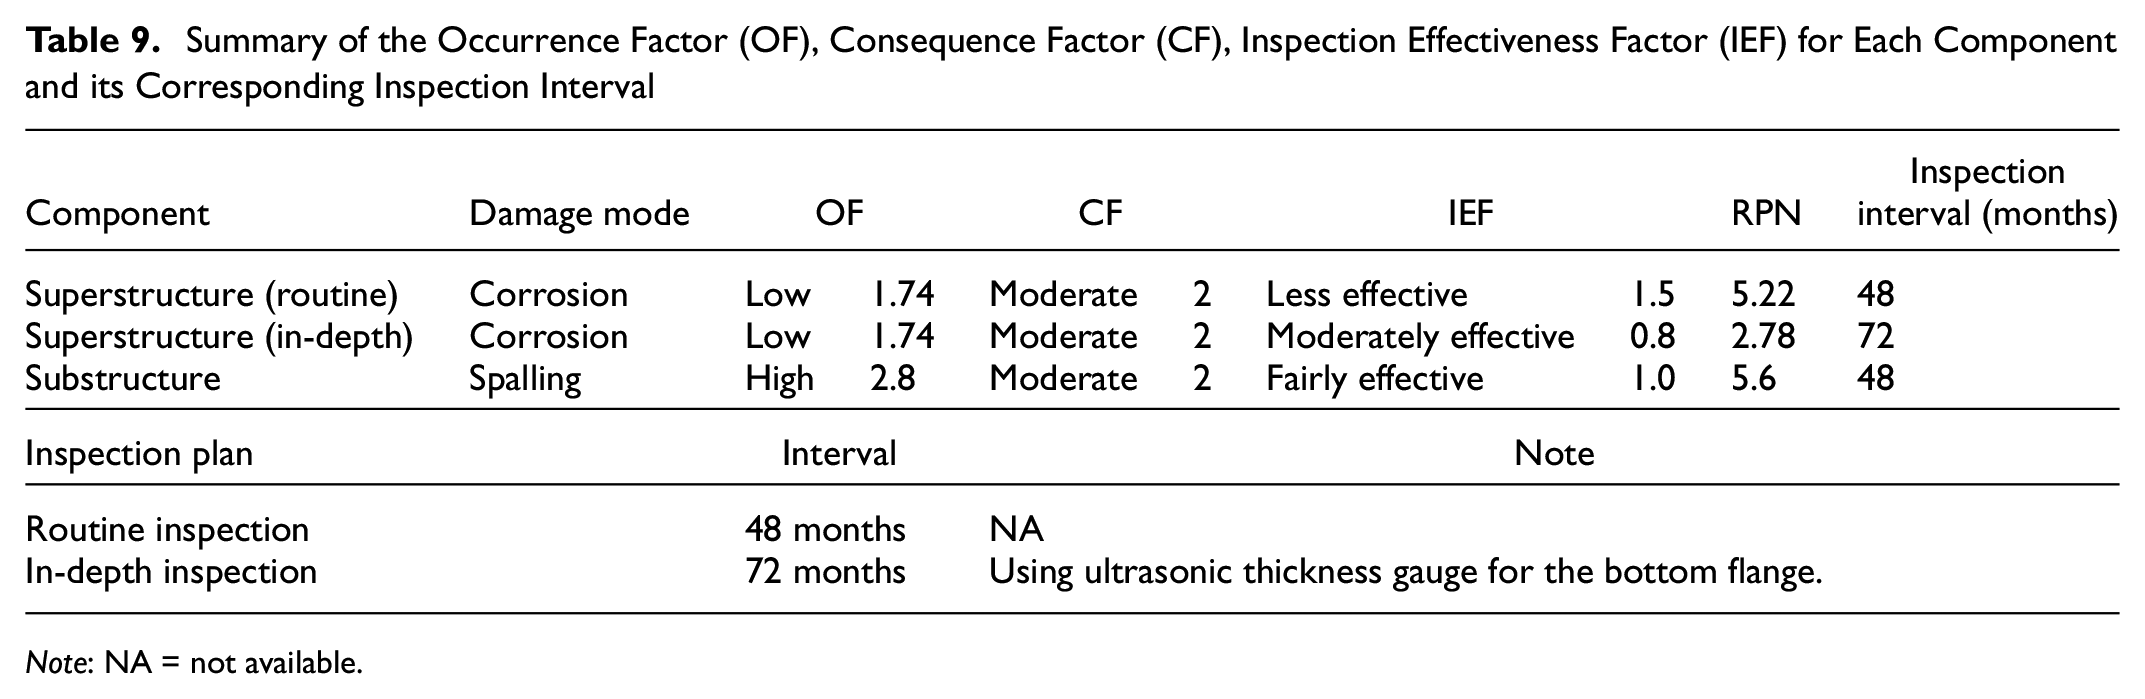
Note: NA = not available.
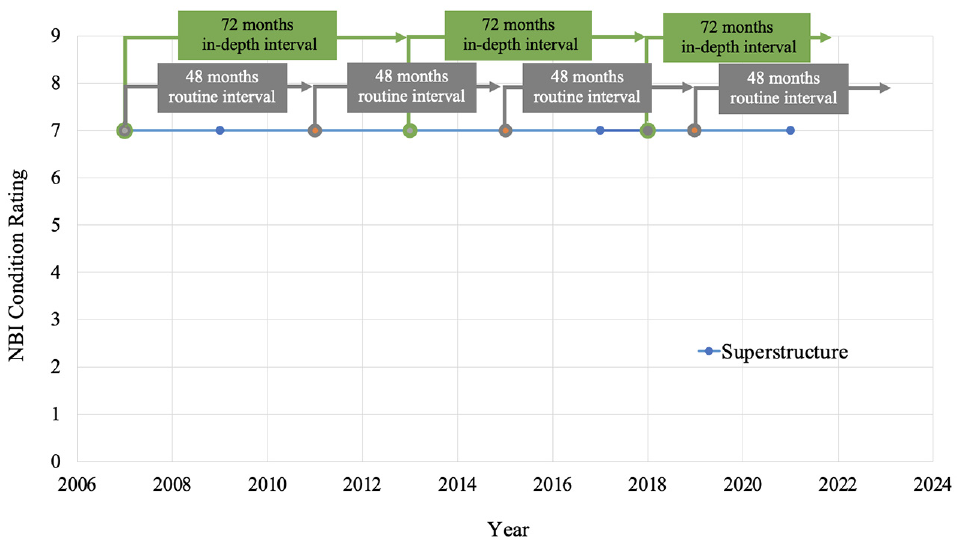
While previous inspection reports and design drawings provide valuable information, an initial inspection is essential for obtaining baseline data about the condition, design, and loading attributes of the bridge. The routine and in-depth inspection intervals can be scheduled independently of each other. In simpler terms, the interval for both routine and in-depth inspections is counted from the time of their respective previous inspections as it is illustrated in Figure 7a. Alternatively, routine inspections for components not scheduled for an in-depth inspection can be conducted simultaneously with the in-depth inspection as it is depicted in Figure 7b. This approach is preferred by some agencies as it allows them to utilize the presence of inspectors at the bridge site efficiently and ensures regular monitoring of all bridge components, even those not scheduled for routine inspection.

Proposed inspection scheduling plans: (a) illustrates the first proposed inspection scheduling method and (b) demonstrates the second proposed inspection scheduling method.
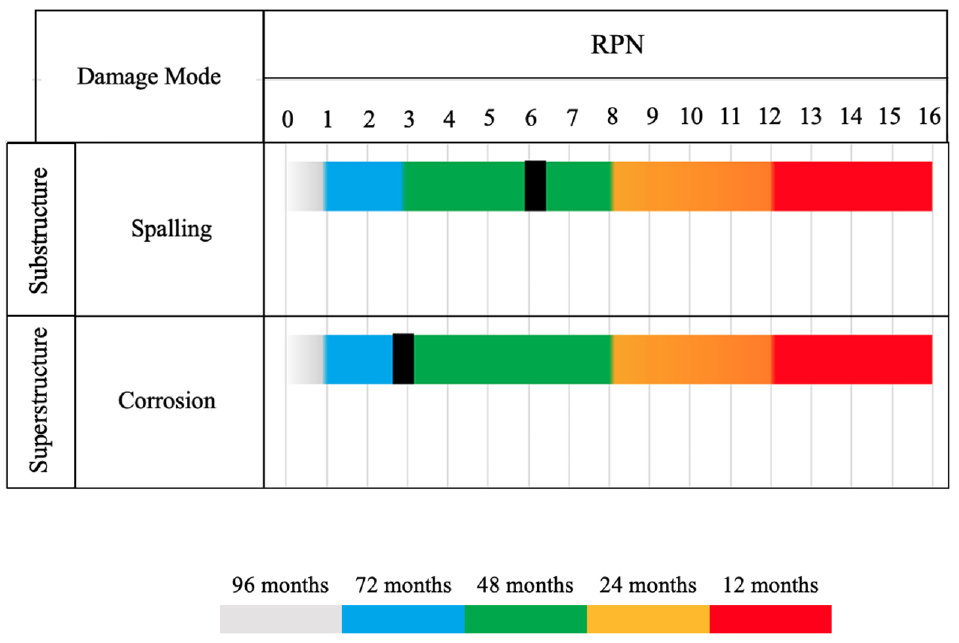
Plots of Risk Priority Number (RPN) for each component and corresponding inspection interval.
Back Casting Analysis
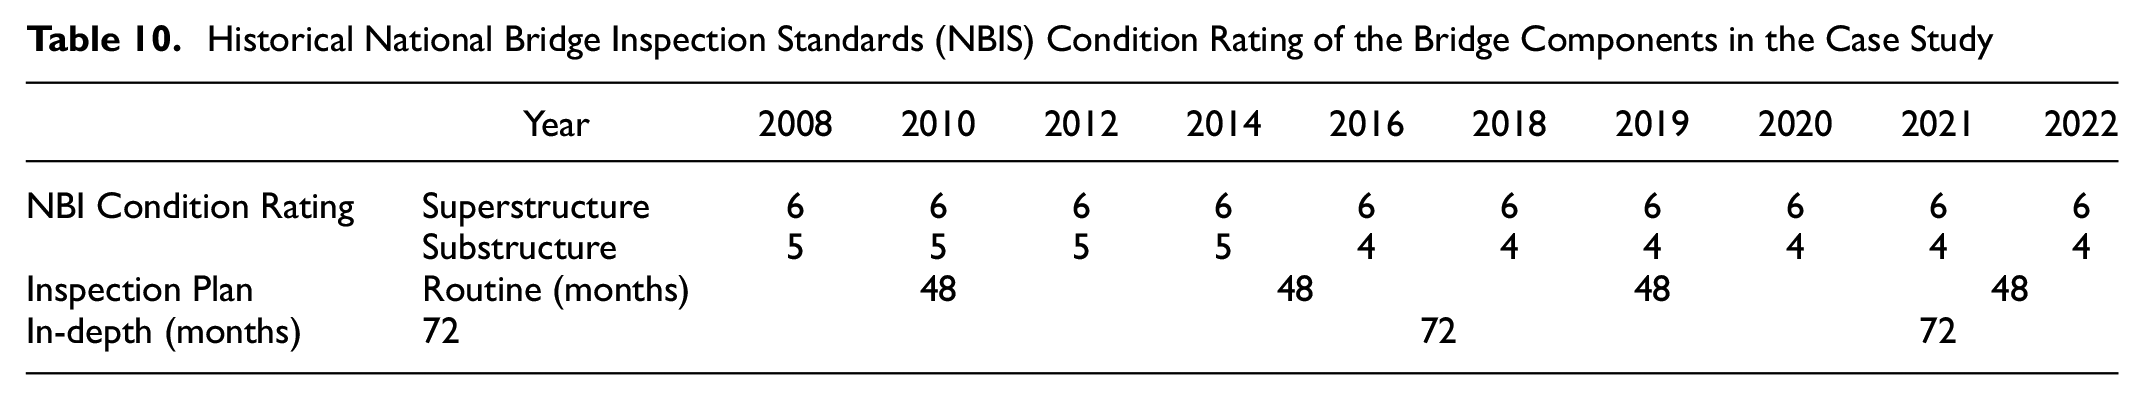
The back casting analysis was performed by applying the RBI approach using the 2008 inspection data, proposing 48- and 72-month intervals for routine and in-depth inspections, respectively as shown in Figure 11. Subsequently, the inspection reports from 2008, 2010, 2012, and 2014 are reviewed to ensure that within these RBI intervals, the condition of the bridge element has not changed significantly, and no maintenance has been delayed owing to the proposed RBI intervals. Similarly, the RBI approach is then applied using the inspection data from 2012 and 2014 to determine the routine and in-depth inspection intervals, which again result in the same intervals of 48 and 72 months, respectively. The inspection data from 2012 to 2016 are also reviewed for the back casting analysis of the routine inspection and data from 2014 to 2020 are assessed for the back casting analysis the of in-depth inspection back casting analysis.
This process is repeated with the subsequent inspection data to verify the safety and serviceability of the bridge. Based on the back casting analysis, there was no significant change in the condition of the bridge elements as shown in Figure 9. Furthermore, no delays occurred in maintenance actions that should have been performed within the proposed inspection intervals, as illustrated in Table 10. Consequently, the inspection plan produced by the RBI approach appears appropriate for the bridge under consideration and the proposed intervals would not have “missed” any significant damage.

Condition ratings of the main components of the bridge in the case study over time, showing back casting procedure within the proposed inspection intervals.
Historical National Bridge Inspection Standards (NBIS) Condition Rating of the Bridge Components in the Case Study
Case Study 2
Overview of the Bridge
The subject bridge, built in 1987, comprises continuous composite multi-steel plate girders. The depth of the girders reduces from a maximum over the piers to a minimum at the pin-hinge connections, as shown in Figure 10. The bridge accommodates an average daily traffic (ADT) of 11,711 vehicles, 5% of which are trucks, as per the inspection reports. The bridge spans a roadway with moderate traffic and has a maximum span of 133 ft. The bridge underwent reconstruction in 2002, and routine visual inspections are scheduled biennially. According to the inspection reports, the overall condition of the bridge’s superstructure is good, with some isolated moderate corrosion at the pins and ends.

Views of the bridge considered in the case study 2: (a) side view of the bridge and (b) bottom view of the bridge showing the pin-hinge connection.
Condition ratings of the main components of the bridge in the case study over time, showing back casting procedure within the proposed inspection intervals.
Damage Mode and OF Assessment
For brevity and for the purpose of illustrating the implementation of the IEF, RBI assessment is only considered for the superstructure element. Thus, corrosion and fatigue cracks are considered to be the primary damage modes for the superstructure girders and pin-hinge connection. Based on the loading, condition, and design attributes obtained from inspection reports and the design drawing data, the occurrence factors for the aforementioned damage modes are evaluated in accordance with the NCHRP 782 report ( 22 ), as illustrated in Tables 11 and 12.
Assessment of the Occurrence Factor (OF) for Corrosion Damage Mode of the Superstructure
Note: High = 30 points; Moderate = 10 points; Low = 5 points; Benign = 0 point; NA = not available.
Assessment of the Occurrence Factor (OF) for Fatigue Crack Damage Mode
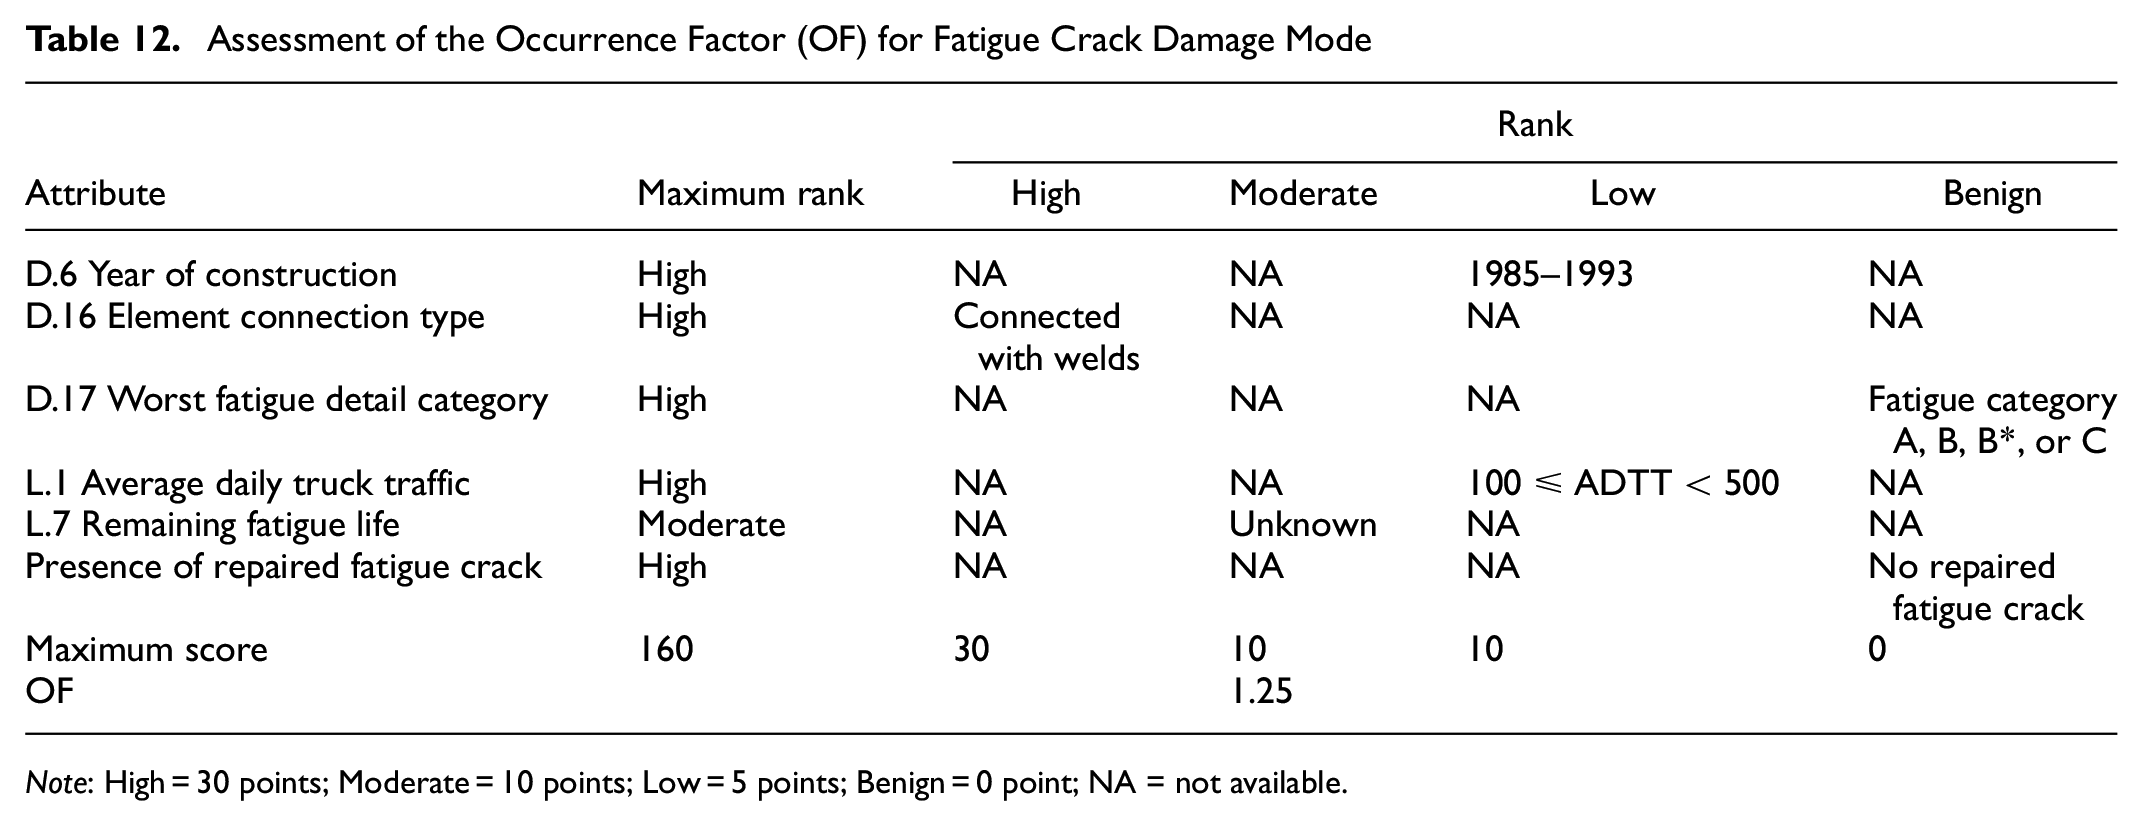
Note: High = 30 points; Moderate = 10 points; Low = 5 points; Benign = 0 point; NA = not available.
CF Assessment
Since the bridge employs a multi-girder system, which is classified as redundant according to AASHTO specifications, the consequences for the superstructure owing to both damage modes are considered to be low. Although the immediate consequences may be considered low, the short-term consequences could be high since the bridge spans a moderately trafficked road. Thus, if one of the damage modes occurs, lane or shoulder closure may be necessary for repairs, potentially causing traffic delays and speed reductions. Considering both immediate and short-term consequences, the overall consequence for the superstructure from corrosion and fatigue crack damage modes is considered to be high.
IEF Assessment
For the superstructure corrosion damage mode, visual inspection is considered to be fairly effective (IEF = 1.0) since most of the superstructure elements are visible and accessible. For the fatigue crack damage mode, it is crucial to note that routine visual inspection is ineffective for detecting fatigue cracks in steel girders. Therefore, hands-on visual inspection is utilized for the fatigue crack damage mode in steel girders, as it is moderately effective (IEF = 0.8). However, for the pin-hinge connection, hands-on inspection is ineffective for detecting fatigue cracks in such detail. Consequently, ultrasonic testing (UT) is highly effective for detecting fatigue cracks in pin-hinge connections (IEF = 0.5).
Inspection Interval
Based on the values of OF, CF, and the IEF for each component and its corresponding damage mode, the appropriate inspection interval is determined as shown in Table 13. For the steel girders, both damage modes dictate a 48-month inspection interval. However, hands-on inspection technique is considered for both damage modes since visual inspection is deemed ineffective in detecting fatigue cracks in steel plate girders. Since fatigue cracks in pin-hinge connections cannot be detected through hands-on inspection, UT is proposed every 72 months to ensure that there is no fatigue crack in the pin-hinge details. Therefore, the inspection plan for the superstructure includes a 48-month hands-on inspection and a 72-month UT inspection of the pin-hinge connection.
Summary of the Occurrence Factor (OF), Consequence Factor (CF), Inspection Effectiveness Factor (IEF) for Each Component and its Corresponding Inspection Interval
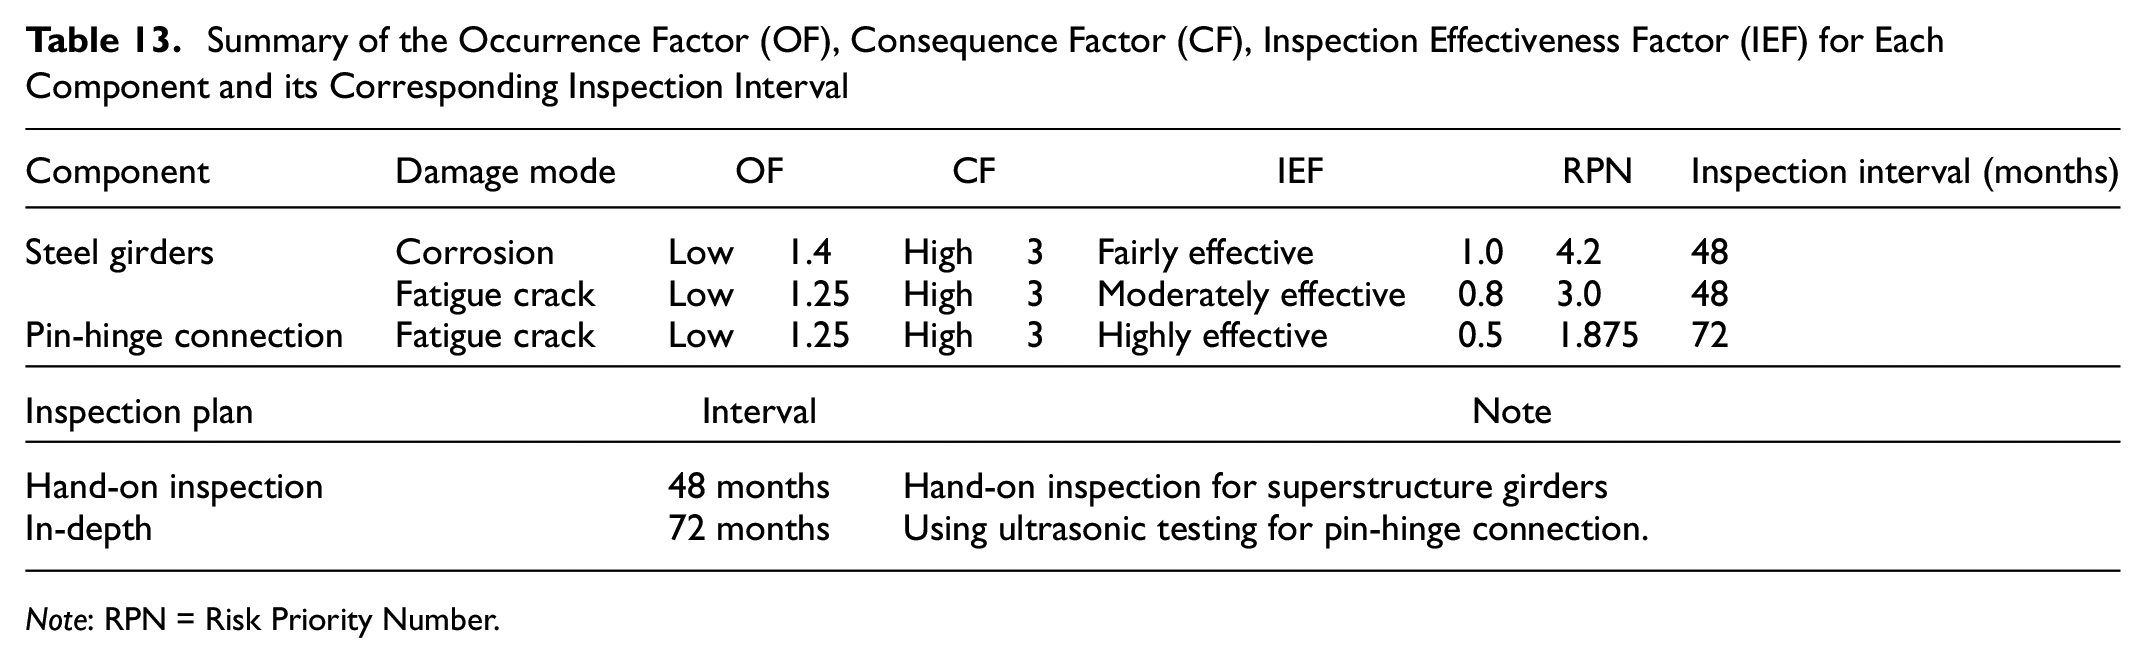
Note: RPN = Risk Priority Number.
Back Casting Analysis
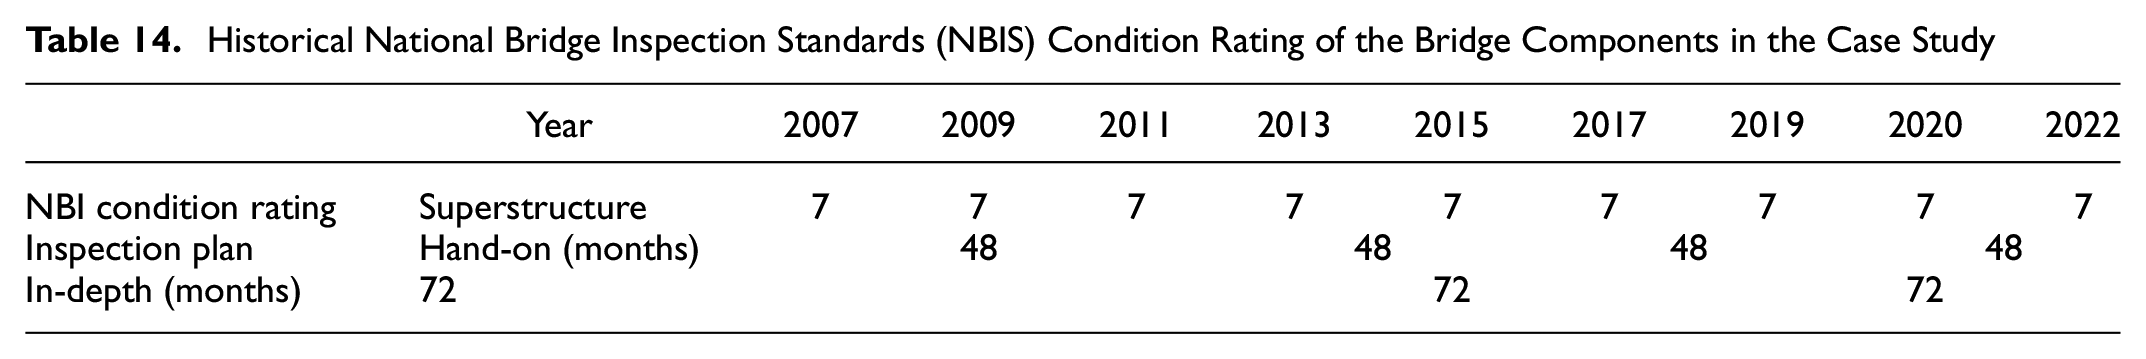
Using the inspection data from 2007 through 2022, the back casting analysis were conducted for both inspection plan. The back casting was initially conducted using the inspection data of the bridge in 2007, yielding a 48-month inspection interval. The inspection reports from 2007 until 2011 were reviewed to ensure that within the proposed interval, the condition of the bridge did not significantly change, no unexpected damage was developed, and no maintenance would’ve been delayed because of the proposed inspection interval. It is noteworthy that reviewing the inspection reports were not limited to the NBI condition rating of the element, but it involved reviewing the inspector notes and the pictures of the superstructure elements. The same process was repeated for the subsequent inspection years and for the in-depth back casting analysis. The result of the back casting analysis showed that the proposed inspection plan provides safety and better allocate the inspection needs.
Using the inspection data from 2007 through 2022, the back casting analysis was conducted for both inspection plans. The back casting initially utilized the inspection data of the bridge from 2007, which suggested a 48-month inspection interval. Inspection reports from 2007 to 2011 were reviewed to verify that within the proposed interval, the bridge’s condition remained stable, no unexpected damage had developed, and no maintenance was delayed owing to the proposed inspection interval as shown in Table 14. It is notable that the review of the inspection reports was not limited to the NBI condition rating of the element; it also involved examining the inspector’s notes and the photographs of the superstructure elements. This process was repeated for the subsequent inspection years and for the comprehensive back casting analysis. The results of the back casting analysis indicated that the proposed inspection plan ensures safety and better allocation of inspection resources.
Historical National Bridge Inspection Standards (NBIS) Condition Rating of the Bridge Components in the Case Study
Summary and Findings
The back casting concept has been applied across a representative sample of bridges featuring a variety of structural systems, materials, and details. Bridges with unique details requiring thorough inspection, such as pin-hinges, pin-hanger elements, and encased or covered structures, were deliberately chosen for the back casting process to validate the integration of the IEF into the RBI for inspection planning. For each back casting analysis, the CF, IEF, and OF, along with scoring attributes for each type of damage, were evaluated using the historical inspection data of these bridges, which spans approximately 13 years. Overall, the back casting analysis showed that within the RBI interval, there were no incidence where the condition of a bridge component significantly changed, or any important maintenance would’ve been delayed because of the RBI interval resulting in changes in condition that would result in a decrease in safety. Furthermore, considering an entire inventory, the inspection intervals suggested by the RBI approach is more cost effective than the current inspection practice. For example, the RBI suggest that 48-month visual inspection for prestressed concrete box girder bridges while they currently inspected at 12- or 24-month intervals. Although in some cases there were no significant changes in bridge condition suggesting that the inspection interval could have been extended beyond what the RBI recommended, the potential consequences of damage necessitated shorter intervals. For instance, newly constructed twin bridges have a very low likelihood of fatigue cracks, but owing to their non-redundancy, the severe consequence factor may result in a shorter inspection interval.
For most back casting analysis, the RBI yields constant inspection intervals throughout the service lives of the bridges, with one exception being a twin girder bridge with pin-hinge details. The remaining fatigue life of this bridge was not detailed in the inspection report in the initial implementation of the back casting analysis. However, in the subsequent back casting, the following year's inspection report, confirmed that the bridge had a sufficient remaining fatigue life as evaluated by a private consultant. This finding, reduced the perceived risk of fatigue cracks, thus permitting the extension of the UT interval for the pin-hinge details from 48 to 72 months. It is significant to note that the bridge’s owner has mandated an UT inspection at intervals of every 60 months. This prescribed interval is grounded in expert opinion rather than being derived from a systematic risk assessment approach. In some cases, particularly with non-redundant bridges built before 1975 featuring E fatigue details, the RBI recommended 12-month inspection intervals. The implementation of IEF was not permissible in these instances since the RPN exceeded the previously mentioned limits. As a result, for such bridges, a 12-month hands-on inspection interval for the steel girders was proposed.
The key benefit of the proposed method is enabling bridge owners in determining inspection intervals for bridges with unique details that are not detectable through visual inspection. While more frequent and thorough inspections, such as using hands-on visual inspection or NDT, may boost the safety, the associated costs render these methods economically inefficient. Thus, the proposed approach establishes inspection intervals that balance bridge safety with inspection costs. In summary, the application of back casting has demonstrated that the RBI, when integrated with the new IEF factor, yields suitable inspection intervals that maintain the safety and integrity of the bridge while effectively allocating inspection resources.
Conclusion
The RBI practice has been widely adopted in the civil engineering industry to estimate inspection intervals. However, the reliability of the RBI approach can be compromised if unreliable inspection techniques are used, as this can result in uncertainty about the element's condition and increase the risk associated with the component. To address this issue, this paper proposes a framework that integrates the inspection effectiveness elements into the RBI process with the aim of estimating the rational inspection interval associated with the reliability of the considered inspection technique. The inspection interval in the proposed approach considers the damage mode, associated likelihood, consequences, and effectiveness of the inspection technique. The proposed method is demonstrated through a single case study. Using a back casting approach, the proposed methodology was shown to result in acceptable extended inspection intervals, ensuring effective use of the inspection resources without increasing risk.
Footnotes
Author Contributions
The authors confirm contribution to the paper as follows: study conception and design: Aedh Alharthi, Glenn Washer, Robert Connor; data collection: Aedh Alharthi, Robert Connor; analysis and interpretation of results: Aedh Alharthi, Robert Connor; draft manuscript preparation: Aedh Alharthi. All authors reviewed the results and approved the final version of the manuscript.
Declaration of Conflicting Interests
The authors declared no potential conflicts of interest with respect to the research, authorship, and/or publication of this article.
Funding
The authors disclosed receipt of the following financial support for the research, authorship, and/or publication of this article: This work was supported in part by the Joint Transportation Research Program (JTRP) administered by the Indiana Department of Transportation, Project 4535 and Purdue University.
The contents of this paper reflect the views of the authors, who are responsible for the facts and the accuracy of the data presented here, and do not necessarily reflect the official views or policies of the sponsoring organizations. These contents do not constitute a standard, specification, or regulation.