
Abstract
The applicability of using ground penetrating radar (GPR) as a non-destructive technology for estimating the thickness and dielectric constant of pavement layers has been extensively documented in the literature. Time delay methods (TDMs) have been the most commonly used by researchers. However, various studies have reported different results with respect to the suitability of different GPR systems and TDMs for dielectric constant and thickness estimation. Thus, this study aims to compare the use of ground-coupled GPR and air-coupled GPR (AC-GPR) for estimating the dielectric constant of pavement materials. In the context of TDMs, the study examines three methodologies for assessing the traveled distance in the investigated layer. The study involves laboratory experiments using asphalt and dry sand. Also, it comprises a sensitivity analysis to examine the effect of different experimentation setups. The study employed two GSSI antennas: 51600S (GC-51600S) and GSSI 42000S (AC-42000S). Using the manufacturer’s recommended operation setups, the results generally indicated the possibility of simplifying the TDM calculation by considering the 42000S and 51600S antennas as monostatic for pavement materials with different dielectric constants (≥3) with an error rate within 5%. Moreover, the study indicates that using AC-GPR may be inappropriate for common midpoint analysis using the default mounting setups. These findings provide valuable insights into the suitability and limitations of different GPR systems and calculation methods for accurately estimating pavement’s dielectric constant and thickness.
Keywords
Ground penetrating radar (GPR) is a widely used non-destructive technology in various civil engineering applications. Initially, GPR was mainly used to locate buried objects in soil ( 1 ), for example, water, sewer, and gas pipelines. However, over the past three decades, significant improvements in GPR theory and technology have assisted in extending the application of GPR in civil engineering. Such applications include condition assessment and monitoring of concrete bridges ( 2 – 4 ), tunnels (5, 6), and pavement ( 7 – 9 ).
In particular, GPR is praised as a cost- and time-effective technology for various applications in pavement engineering. These include determining layer thicknesses, detecting pavement distresses, locating utilities, estimating density and compaction, and assessing air content. Notably, GPR has found widespread use in evaluating the layer thickness and density of in situ pavement materials, which usually necessitates the estimation of the dielectric constant ( 7 – 9 ).
The application principle of GPR is based on transmitting electromagnetic waves (EMs) and detecting the reflected parts at the interfaces of dielectric contrast. The information obtained from the received GPR signal, including the two-way travel time (TWTT) and amplitude, is utilized to characterize the properties of pavement materials. These properties are influenced by the material composition and affect the speed and deterioration of the wave. Among these properties, the dielectric constant is deemed the most crucial material property for evaluating layer thickness of in situ pavement materials (7, 8).
Several methods have been developed to estimate the dielectric constant of pavement materials. One approach involves determining the dielectric constant using numerical methods based on the composition of the pavement materials, including binding materials, aggregates, air, and water content ( 8 ). The surface reflection method (SRM) is used to estimate the dielectric constant for pavement layers using information on the amplitude of the reflected wave from pavement layer interfaces ( 10 ). However, researchers have revealed that the measured dielectric constant values are likely to experience significant uncertainties because of various factors ( 11 –13). Primarily, the SRM assumes homogeneity of the pavement layer through its depth. Consequently, the accuracy of this method can be compromised if the properties of the pavement material are inconsistent throughout its depth. To address this limitation of the SRM, time delay methods (TDMs) are commonly used to estimate the dielectric constant. The application of TDMs is discussed in the following section.
Dielectric Constant and Thickness Calculation Using Time Delay Methods
TDMs are commonly used to estimate the dielectric constant based on the TWTT of the GPR wave in the surveyed pavement material. TDMs are based on the relationship established between the GPR wave’s velocity and the medium’s dielectric constant (
9
). The related calculation is shown in Equations 1–3 (
9
). Equation 1 establishes the relationship among the velocity of the GPR wave in layer n (


The classical form of the TDM involves the use of sampled cores to estimate the traveled distance
This TDM is more representative of the dielectric constant of the whole layer thickness compared to the SRM. Loizos and Plati ( 12 ) compared the SRM and TDMs to calculate the dielectric constant in 16 test locations selected within nine pavement sections. The TDM achieved a median error of 5%, while the SRM had a notably higher median error of 9.6%. However, obtaining the TWTT information for thin layers can be challenging because of signal overlapping. Also, the availability of layer thickness information necessitates the extraction of core samples, which can be time-consuming and expensive. Moreover, the extracted core samples may not fully represent the entire study area because of the presence of variations in compaction, void content, water content, and other influential factors.
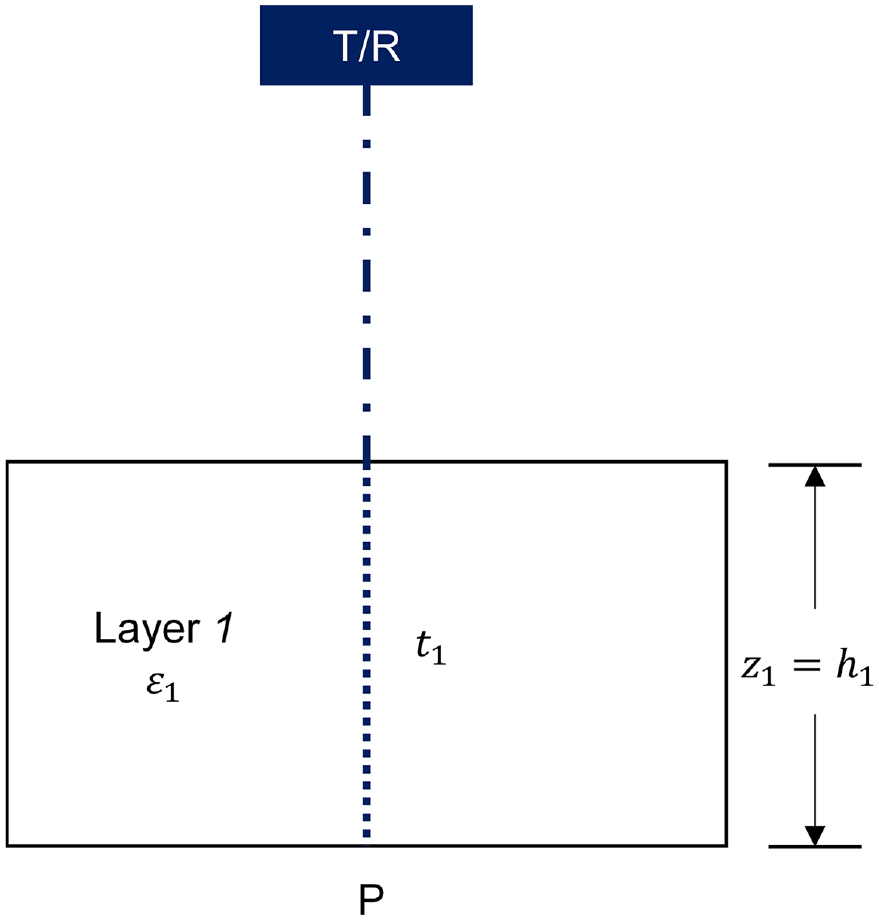
Alternatively, the common midpoint (CMP) method is a widely employed technique with GPR to estimate the thickness and the dielectric constant of pavement layers without the need for core extraction ( 9 ). The application of the CMP involves the separation of the transmitter and the receiver of the GPR system at different distances. Figure 1 illustrates the application of the CMP in the first layer. Subsequently, triangulation principles are leveraged to calculate the thickness of the layers and dielectric constant ( 14 ).

Application of the common midpoint method.
The CMP method offers several advantages, including applicability to estimating the dielectric constant and pavement thickness without the need for core extraction. In addition, it relies on time delay, which makes it less prone to variations throughout the thickness of the layer. However, it should be noted that the CMP may not be effective for thin layers because of the challenges posed by signal overlapping. Furthermore, the performance of the method could be hindered when using ground-coupled GPR (GC-GPR) because of ground–antenna coupling challenges and limited resolution. On the other hand, the use of air-coupled GPR (AC-GPR) may pose limitations on the applicability of the CMP considering the conventional mounting setups, as demonstrated in the subsequent sensitivity analysis conducted in this study (the recommended mounting height for widely used AC-GPR systems from GSSI is typically between 46 and 51 cm [ 15 ]).
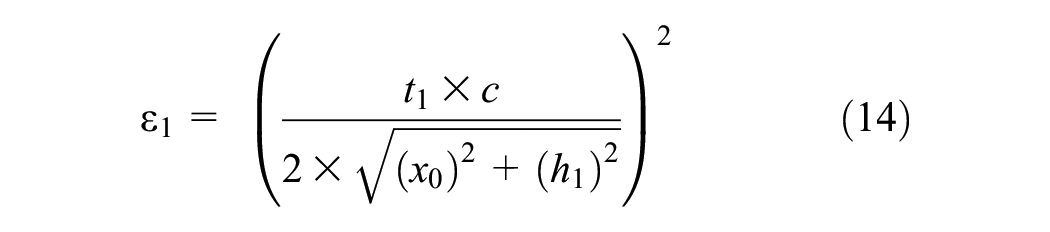
Proper consideration of the surveyed case, particularly the thickness range and dielectric constant of the surveyed layer, is crucial when selecting the appropriate GPR system and calculation method for dielectric constant estimation in the pavement. In the context of the TDM, assessing the traveled distance by the EM wave may become a critical factor, and researchers have approached this aspect differently in various applications. Some studies opt for a simplified approach by treating commercially available bistatic GPR systems as monostatic, which can ease the estimation process. However, other researchers explore triangulations to simulate the traveled path of the EM waves, aiming to enhance the accuracy of results or facilitate the utilization of AC-GPR for the CMP.
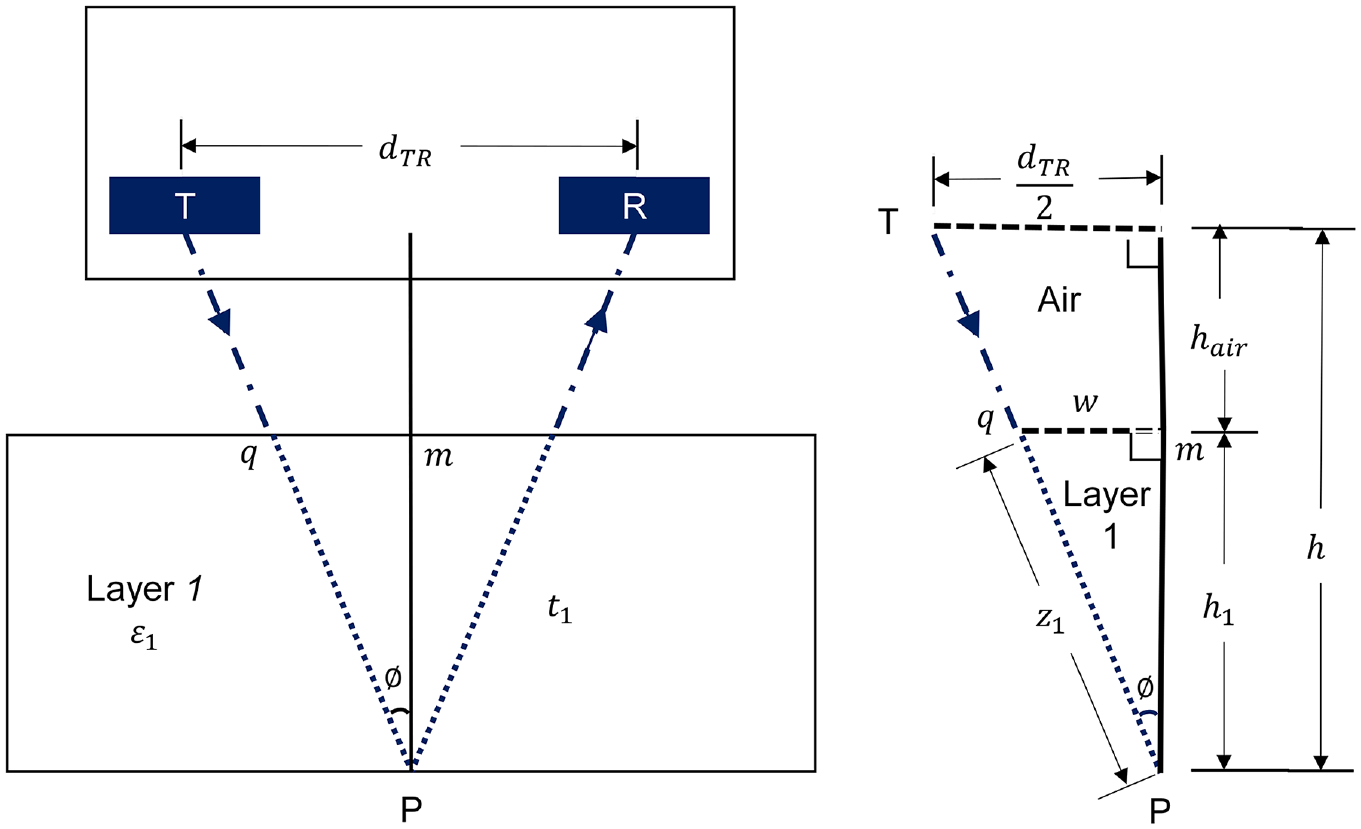
Monostatic Simplification
Most commercially available GPR systems are bistatic, featuring fixed transmitters and receivers within a single unit. However, in practice, the distance is often calculated by treating the system as monostatic. Figure 2 illustrates the traveled distance considered for the monostatic simplification (MS) method when using TDMs. In such cases, the traveled distance across the first layer (
Determination of the traveled distance using the monostatic simplification method.
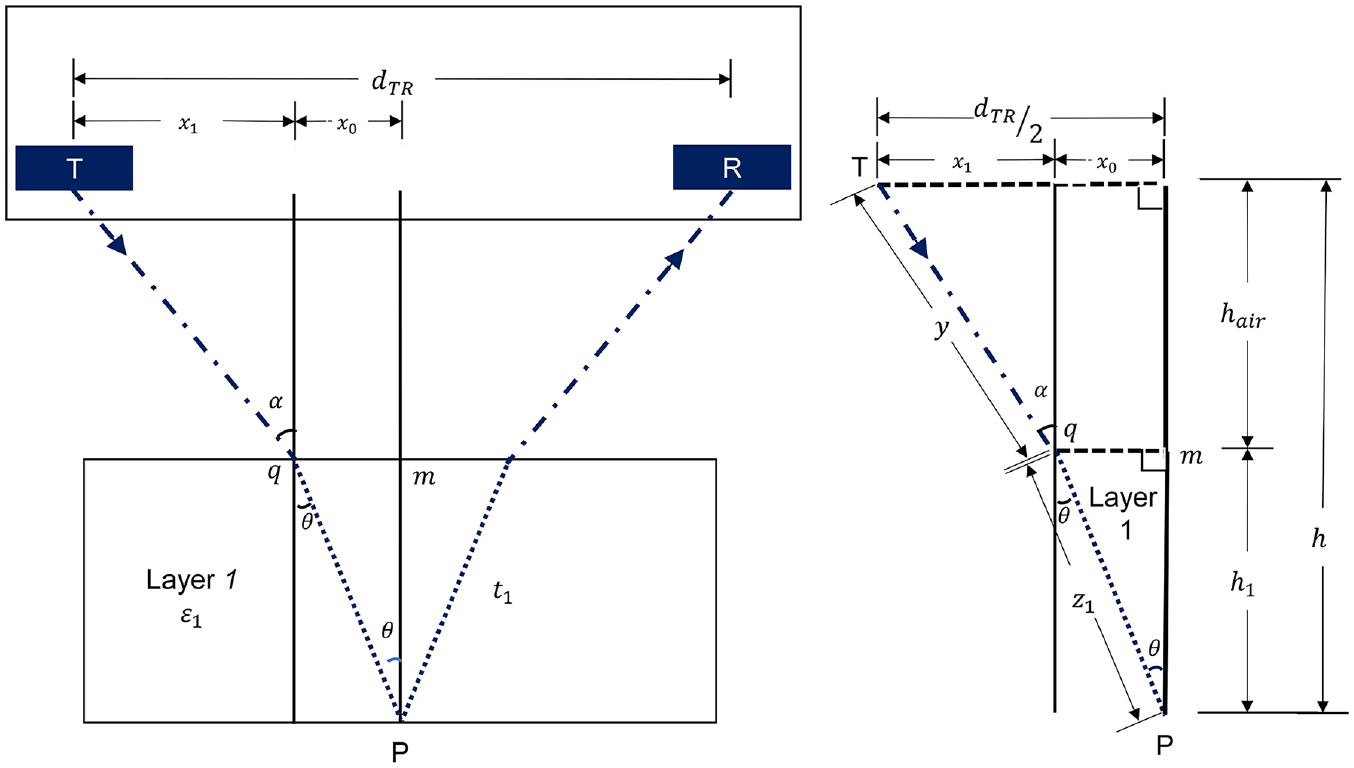
Bistatic Simplification
In the bistatic simplification (BS) method, the bistatic nature of the GPR system is recognized. However, Snell’s law is ignored when estimating the traveling distance of the signal. Snell’s law explains the behavior of the EM waves when traveling across two materials of different dielectric constants ( 9 ). Figure 3 illustrates the travel path of the GPR signal reflected from the bottom of the first layer. As shown in Figure 3, the traveled distance can be linked to the thickness of the layers using the Pythagoras theorem.
Determination of traveled distance using the bistatic simplification method.
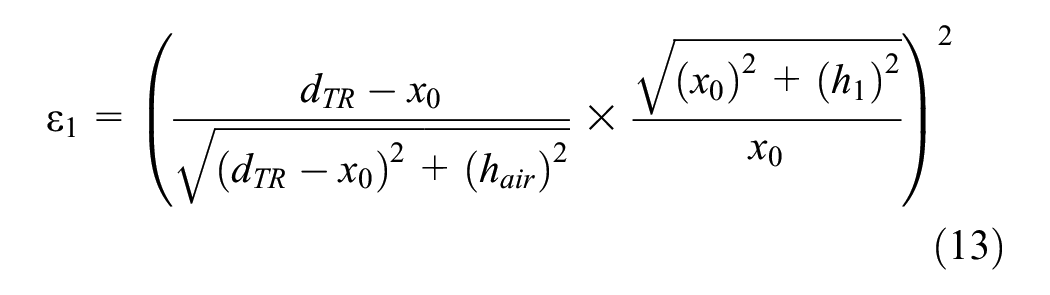
For estimating the traveled distance by the GPR wave in the first layer, the triangulation relationships can be applied, as shown in Equations 4 and 5. Equation 6 can be obtained by substituting Equation 4 into Equation 5 (
5
). Using Equation 6,


where
The BS method was utilized in the work of Ahmed et al. ( 16 ), where AC-GPR was used for pavement thickness estimation. The study claimed a significant improvement in the accuracy of thickness estimation. Hamrouche and Saarenketo ( 17 ) proposed a method for evaluating the dielectric constant by employing a horizontally arranged single transmitter and multiple receivers of the AC-GPR type. The study utilized BS to estimate the travel path of the GPR waves and apply CMP calculations.
Bistatic Correction
Some studies have recognized the transmitter–receiver offset distance as well as the effect of signal refraction, as outlined in Snell’s law to estimate the path of the GPR waves. Figure 4 provides an illustration of the travel path of the GPR signal reflected from the bottom of the first layer according to the bistatic correction (BC) method.
Determination of layer thickness using the bistatic correction method.
Equation 7 defines the relationship between the traveled distance in the air with the elevation of the transmitter/receiver from the top surface of the investigated layer and the distance


Lahouar et al. ( 10 ) developed a modified CMP method using a monostatic GC-GPR and bistatic GC-GPR. This method accounts for signal refraction through pavement layers by incorporating Snell’s law. Leng and Al-Qadi ( 9 ) proposed a modified common midpoint (XCMP) technique employing two air-coupled bistatic systems. In the XCMP method, the two systems are aligned along the surveying direction, and each receiver is assumed to collect signals from both transmitters. The XCMP method incorporates Snell’s law to address signal refraction ( 9 ).
Research Motivation and Objectives
The applicability of the GPR to measure the dielectric constant and layer thickness of pavement has been extensively documented. However, researchers have reported various performance results based on the surveyed site, the used GPR system, and the employed estimation method ( 9 ). This study aims to provide valuable insights to aid researchers and practitioners in selecting the most suitable method and GPR system for their specific study, considering the type and thickness of the investigated material.
The objectives of this study include comparing the applicability of AC-GPR and GC-GPR to evaluate the dielectric constant and thickness of pavement materials using TDMs. By examining the performance of these two GPR systems, the study aims to identify their respective strengths and limitations. In addition, this study aims to compare the different methods for estimating the distance traveled by GPR waves in the context of TDMs. Understanding the impact of these distance estimation techniques on the applicability of AC-GPR for the CMP and the overall accuracy of dielectric constant and thickness estimation is a key aspect of this investigation.
Methodology
The investigation was conducted in the lab using two GPR systems (AC-51600S and GC-51600S) and two pavement materials: asphalt and dry sand. The laboratory setup for the experiment is shown in Figure 5. Furthermore, three methods for evaluating the traveled distance in the pavement layer (MS, BS, and BC) were compared in the context of TDM calculations. In addition, sensitivity analysis was conducted to investigate the effect of GPR system characteristics and mounting setups on the accuracy of dielectric estimation and their applicability for CMP calculations. This section outlines the calculation methods for the dielectric constant and the description of the experimental setups.

Lab setup showing the tested the materials (A50, A100, and DS75) and the AC-51600S antenna.
Materials
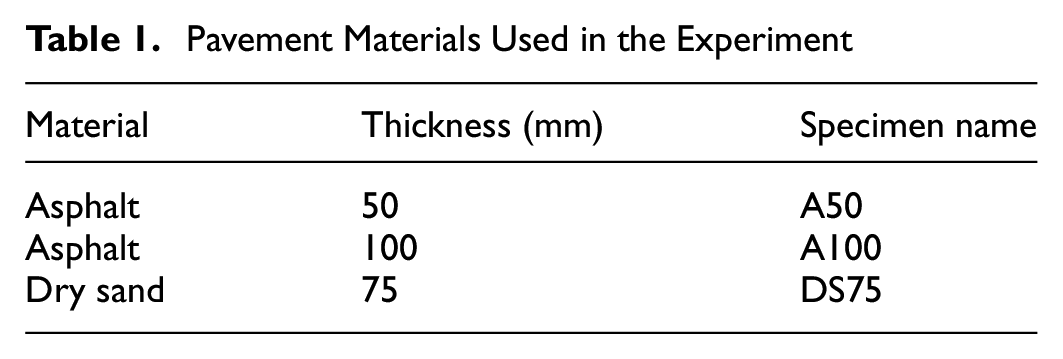
Two types of pavement materials, namely asphalt and dry sand, were used to compare the different GPR systems and dielectric constant estimation methods. The type and thickness of the pavement layers investigated in this study are presented in Table 1. Specimen A50 represents an asphalt layer with a thickness of 50 mm, whereas A100 represents an asphalt layer with a thickness of 100 mm. Both A50 and A100 were prepared using the same mix design to ensure consistent properties for comparative analysis. In addition, the study included DS75, which represents a dry sand layer with a thickness of 75 mm. The dimensions of the specimens are 30 cm × 60 cm.
Pavement Materials Used in the Experiment
GPR System
This study utilized two GPR systems for data collection: an AC-51600S system and a GC-51600S system, both manufactured by GSSI (Geophysical Survey Systems, Inc.). The AC-51600S system comprised a SIR 30 control unit and a GSSI 42000S high-frequency air launched antenna. The antenna used in this system had a central frequency of 2.0 GHz and dimensions of 21 cm × 55.6 cm × 49.5 cm (width, length, and height). The distance between the centroid of the transmitter and the receiver is 37.5 cm ( 16 ). The elevation of the transmitter and receiver from the soffit of the antenna box was estimated at 13 cm. The ground-coupled system consisted of the SIR-4000 control unit and the GSSI ground-coupled antenna model 51600S. The antenna used in this system had a central frequency of 1.6 GHz and dimensions of 3.8 cm × 10 cm × 16.5 cm (thickness, width, and length). The distance between the centroid of the transmitter and the receiver is around 6.2 cm. During regular use of GC-51600S, the estimated distance between the transmitter and receiver from the surface of the examined material was assumed to be within 2 cm. For system operation, RADAN software (version 7.5.18.02270) was employed. The collected data were exported in CSV format for further processing and analysis. Figure 6, a–e, visually represents the SIR-30 unit, 42000S antenna, SIR-4000 system, 51600S unit, and RADAN software interface, respectively.

Ground penetrating radar systems: (a) GSSI 51600S antenna, (b) SIR 30 control unit, (c) GSSI 51600S antenna, (d) SIR 4000 unit, and (e) RADAN interface.
The setup of the GPR systems used in this study is presented in Table 2. The number of samples per scan was set as 512. The time range was set as 12 ns for the air-coupled system and 7.65 ns for the ground-coupled system. The data collection mode was configured as time. Moreover, infinite impulse response (IIR) and finite impulse response (FIR) filters were applied to improve the quality of the collected data. The IIR filter of a high-pass cutoff frequency of 100 MHz was applied to both systems. A custom FIR filter, GSSI 42000S, was applied for the AC-51600S. A FIR filter with a low-pass cutoff frequency of 3000 MHz and a high-pass cutoff frequency of 470 MHz was applied to the GC-51600S.
Data Collection Setting for the Air- and Ground-Coupled Systems
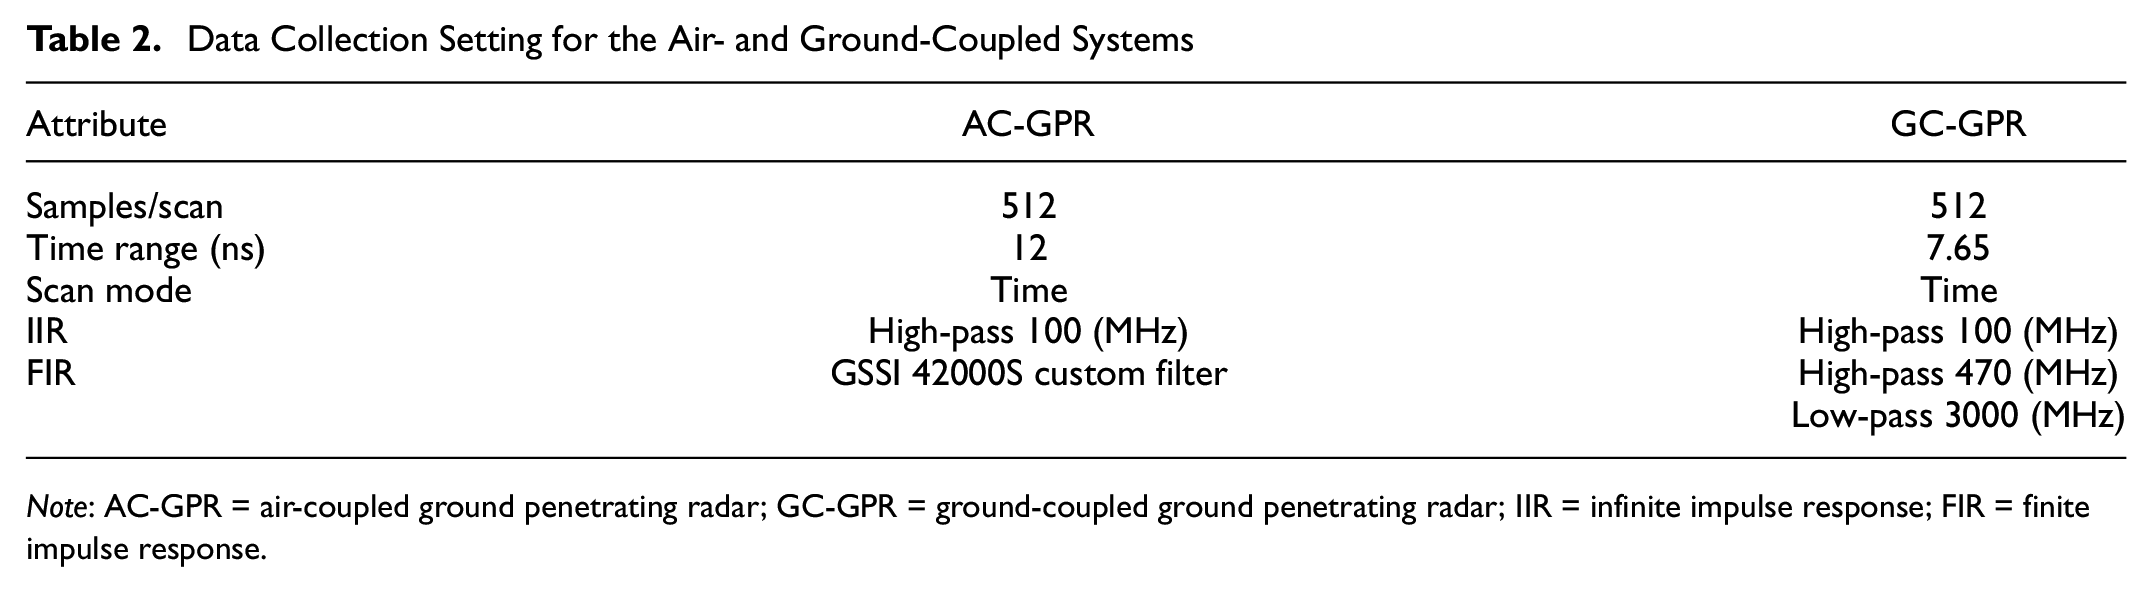
Note: AC-GPR = air-coupled ground penetrating radar; GC-GPR = ground-coupled ground penetrating radar; IIR = infinite impulse response; FIR = finite impulse response.
Experimental Setup
The experiment involves collecting GPR data for the three samples after placing them on the top of a metal plate (MP). The MP was approximately the same size as the specimens. Figures 7 and 8 depict the experimental setup and GPR reading using the AC-42000S and GC-51600S for A50, respectively. Furthermore, Figures 7 and 8 present the A-scan and B-scan acquired during the experiment on specimen A50 using the AC-51600S and GC-51600S, respectively.
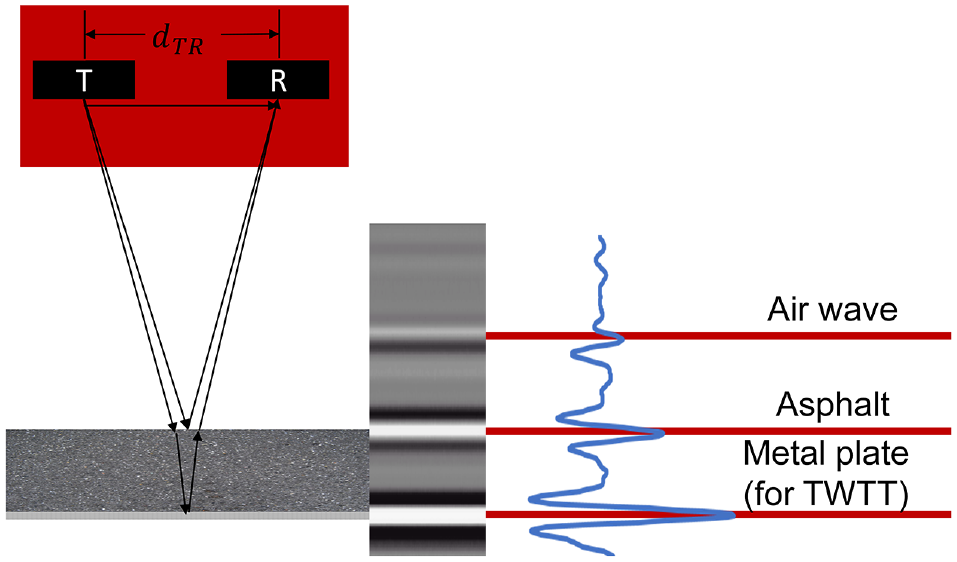
Illustration diagram of the experimental setup using the AC-51600S for specimen A50.
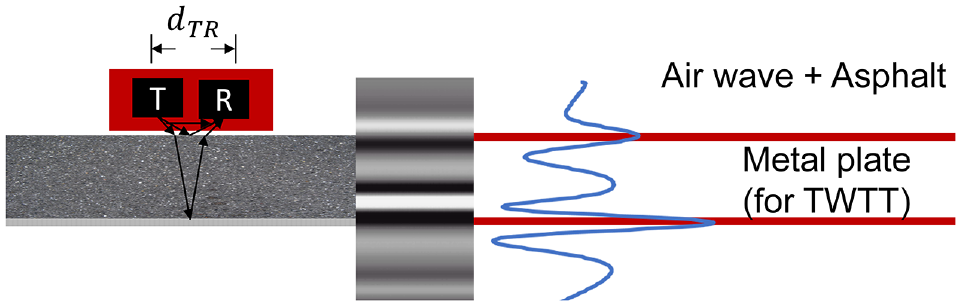
Illustration diagram of the experimental setup using the GC-51600S for specimen A50.
Sensitivity Analysis
This study involved laboratory experimental work with a limited number of samples and setups. Thus, a sensitivity analysis was conducted to understand the impact of the investigated pavement material’s thickness and dielectric constant, antenna parameters, and the experiment setup on the criticality of addressing the transmitter–receiver offset. In addition, the analysis was used to investigate the applicability of using the AC-51600S for the CMP. The sensitivity analysis was conducted using a theoretical framework. By systematically examining these factors and their effects on GPR measurements, the sensitivity analysis offered valuable information to guide researchers and practitioners in optimizing GPR methodologies for accurate dielectric constant estimation in pavement engineering. The details of the parameters considered in the sensitivity analysis are shown in Table 3.
Details of the Sensitivity Analysis
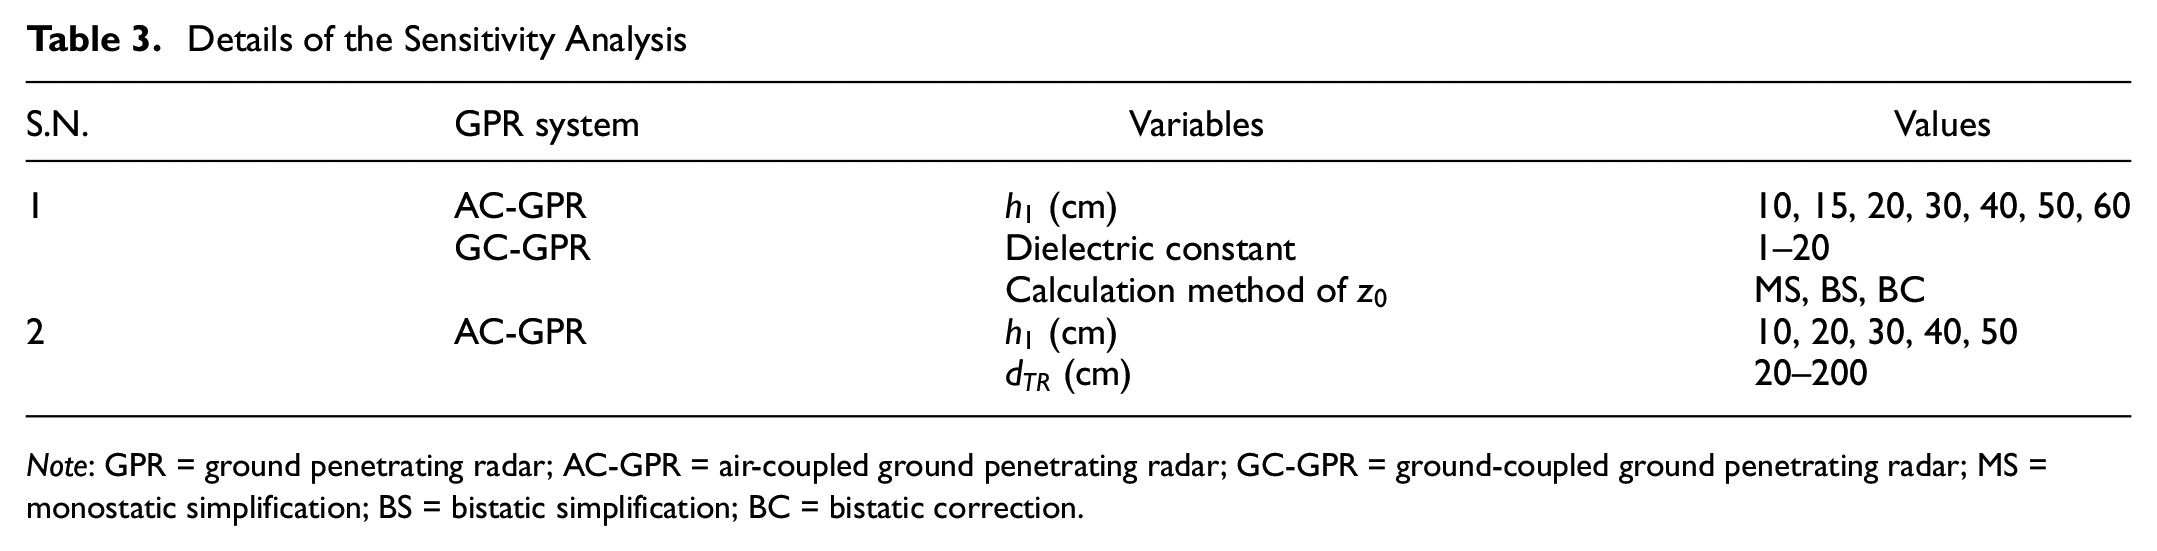
Note: GPR = ground penetrating radar; AC-GPR = air-coupled ground penetrating radar; GC-GPR = ground-coupled ground penetrating radar; MS = monostatic simplification; BS = bistatic simplification; BC = bistatic correction.
Results and Discussion
Experimental Results
Table 4 presents the calculated dielectric constant values of the tested specimens using different TDMs with the AC-42000S and GC-51600S. The dielectric constant values were estimated by employing MS, BS, and BC methods to assess the GPR wave’s traveled distance. Generally, dielectric constant values measured with the AC-42000S exhibited greater consistency compared to those measured with the GC-51600S, particularly for specimens A50 and DS75. This can be attributed to the shorter wavelength and higher resolution of the AC-42000S in contrast to the GC-51600S. In addition, dielectric constant values obtained using individual TDMs for the asphalt specimens (A50 and A100) were notably consistent, especially with the AC-42000S. For instance, dielectric constant values measured using the different methods for the two asphalt specimens exhibited only 0.1 difference with the AC-42000S. Similarly, the application of MS on the asphalt specimens yielded a highly consistent dielectric constant calculation using the GC-51600S, showing only a 0.1 difference. The relatively high divergence between the dielectric constant values calculated for the two asphalt specimens (A50 and A100) using the GC-51600S while employing the BS and BC methods can be attributed to the limited thickness of the A50 specimens compared to the wavelength of the GPR wave.
Dielectric Constant of the Tested Specimens

Note: GC = ground-coupled; AC = air-coupled; MS = monostatic simplification; BS = bistatic simplification; BC = bistatic correction.
Suspected corrupted value caused by wave overlapping.
Severely corrupted value caused by wave overlapping.
However, a different observation arises when comparing the dielectric constant values obtained from the two employed GPR systems using the same TDM for the same material. Figure 9, a and b, illustrates the variation between the dielectric constant values calculated using the three TDMs and the two GPR systems for specimens A50 and A100, respectively. The figures illustrate that the dielectric constant values obtained using the AC-42000S were larger than those obtained using the AC-51600S by about 18% and 12% for specimens A50 and A100, respectively. This suggests that the antenna type and associated settings have a more pronounced effect compared to the effect of the TDM, particularly for MS and BC.
Comparison of the dielectric constant values calculated using the different combinations of the employed time delay method and ground penetrating radar systems for samples (a) A50 and (b) A100.
The dielectric constant measured for DS75 using the AC-42000S was approximately 2.6, while it was significantly lower at 1.7 when measured with the GC-51600S. This difference can be attributed to the overlapping of waves when using the GC-51600S. Figure 10a shows the combined wave obtained in RADAN, representing a superposition of the direct and the reflected waves. The reflected wave was obtained by reducing the direct wave, as shown in Figure 10a. Subsequently, the wave representing the air/DS75 interface was reduced, as shown in Figure 10b. As presented in Figure 10b, the first cycle of the reflection from the DS75/MP interfaces with the second cycle of the reflection wave from the air/DS75 interface. This overlap resulted in a shift in the peak of the first cycle of the wave reflection from the DS75/MP by three samples. After removing the overlapping effect, the corrected value of the dielectric constant for DS75 was obtained as 2.0. However, a detailed discussion on how to obtain the corrected peak by subsequent reduction of the waves is beyond the scope of this study. Thus, the TDM can be characterized as unsuitable for evaluating the dielectric constant of DS75 in the context of this study. The overlapping of waves in the GC-51600S led to inaccuracies in the dielectric constant estimation, highlighting the limitation of TDMs in the evaluation of the dielectric constant of materials of low depth and dielectric constant. The lower dielectric constant values measured for A50 compared to A100 using the GC-51600S can be primarily attributed to wave interference effects. The relatively long wavelength of the GC-51600S, when investigating A50, led to increased interference between the reflected waves. Nevertheless, the dielectric constant value for A50 is believed to be minimally affected by wave overlapping, as it is relatively close to that measured for the A100 specimen.
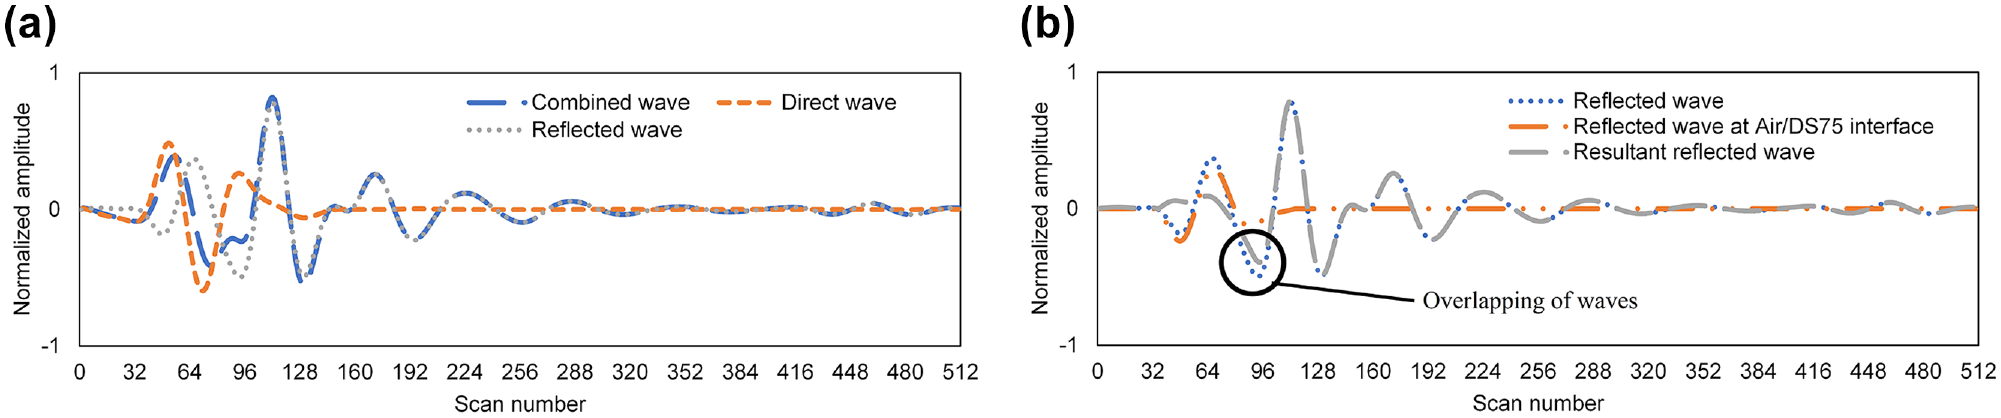
Subsequent decomposition of the wave obtained for testing DS75 using the GC-51600S: (a) decomposition of the combined wave into direct and reflected waves and (b) decomposition of the reflected wave into DS75 reflection and resultant waves.
Indeed, overlapping of reflected waves can pose challenges when measuring the thickness or evaluating the dielectric constant of thin pavement layers with a low dielectric constant. Thin layers can be defined as layers where the GPR reflections at the surface and bottom overlap. In other words, thin layers refer to those with a thickness smaller than the wavelength of the GPR waves when passing through them. Considering that the current wave of GPR consists of two cycles, the shift of the peak in the first cycle of the wave from the bottom of one layer may happen when the thickness of the layer is smaller than three-quarters of the wavelength of the GPR waves when passing through the same layer. The wavelength of the predominant frequency of a GPR of the central frequency (f) in a layer can be calculated using the frequency formula, as shown in Equation 15:

Table 5 presents the wavelength of the GC-51600S and AC-42000S waves in asphalt and dry sand as calculated using Equation 15. As presented in Table 5, the layer thicknesses of specimens A50 and DS75 are less than three-quarters of the wavelength of the GC-51600S, indicating overlapping that may result in discrepancies in the measured dielectric constant values.
Wavelength for the Ground Penetrating Radar (GPR) Signals in the Tested Materials

Note: h = specimen thickness;
Considering the setting of the GPR systems, as shown in Table 2, the resolution effect on the obtained results is investigated. As the GPR readings are collected in steps called samples, the start and end of the layer can cumulatively involve uncertainty of up to almost two scans. In such a way, the uncertainty range can be within ±2 samples. The dielectric constant uncertainty was calculated using the AC-42000S and the GC-51600S for the different specimens.
Figure 11 presents the uncertainty calculated for the dielectric constant as a percentage of the estimated dielectric constant. As shown in Figure 11, when comparing the results individually for each GPR system, the uncertainty range is more extensive for A50 compared to that of A100 for both the AC-42000S and GC-51600S. In general, it is expected that the larger the thickness and the dielectric constant, the lower the effect of the resolution on the uncertainty in the calculated value of the dielectric constant. Also, Figure 11 demonstrates that the uncertainty for the GC-51600S is lower compared to that of the AC-42000S when comparing the values for the same specimens. This can be attributed to the higher resolution of the GC-51600S because of the setup used. The time range was set at 7.65 ns for the GC-51600S compared to 12 ns for the AC-42000S, while the number of samples per scan (A-scan) remained the same for both systems.
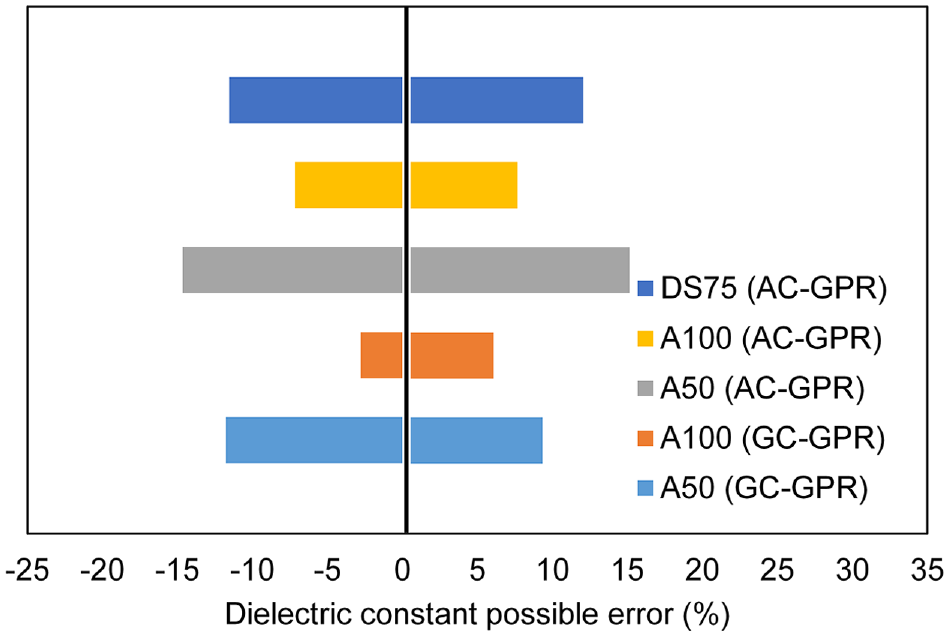
Error range for the calculated dielectric constant caused by resolution.
The resolution of the GPR system can be adjusted by manipulating the number of samples per scan and the targeted time range. Increasing the targeted time range and reducing the number of samples can have a negative impact on the vertical resolution. As a consequence, uncertainties with respect to the calculation of the dielectric constant and pavement thickness increase. Moreover, when expressed as a ratio, the uncertainties can be influenced by other factors, including the thickness of the surveyed layer and the dielectric constant. Thus, to enhance the accuracy of GPR-based measurements, careful consideration of the resolution settings and a thorough understanding of the factors affecting uncertainties is crucial.
Sensitivity Analysis
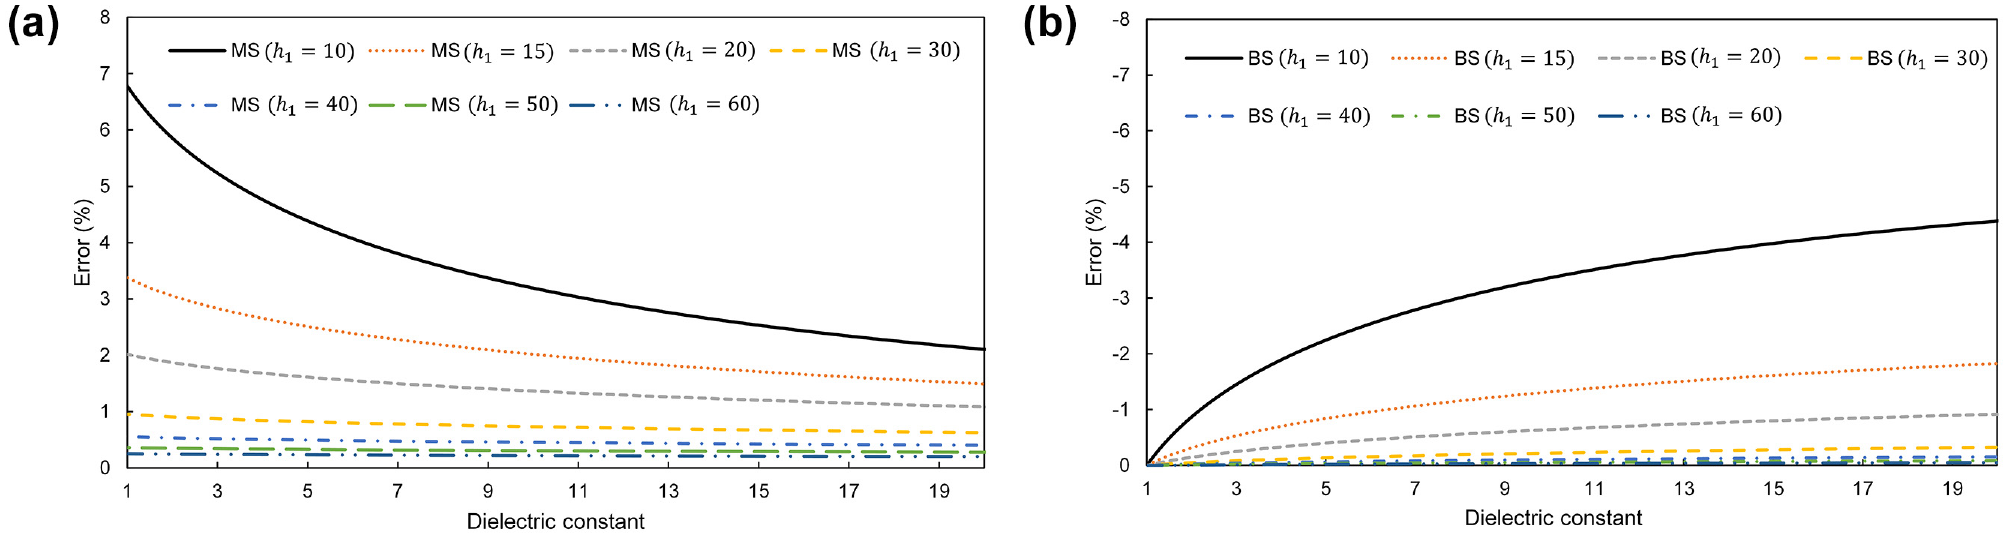
A comprehensive sensitivity analysis was conducted to understand the impact of the dielectric constant and thickness of the surveyed material on the error introduced by employing the simplification methods (MS and BC). The analysis considered the same mounting and data collection setup, calculating the error across a range of seven different thicknesses and dielectric constant values, spanning from 1 to 20.
Figure 12, a and b, plots the relative error introduced in the calculated dielectric constant caused by the adoption of the simplification methods of MS and BS, respectively. As shown in Figure 12a, the use of the MS method resulted in an overestimation of the dielectric constant values. Even for materials with a dielectric constant equal to two, the error is below 5%, which is much smaller than the error that might originate from the resolution problems of the GPR in the settings used in the current study. Thus, the MS method can be applied with a negligible error rate in such scenarios. In contrast, Figure 12b shows that the adoption of the BS method caused an underestimation of the dielectric constant values for the analyzed scenarios. Moreover, the absolute relative error value increased with the increase in the dielectric constant and layer thickness. If the dielectric constant is larger than three or the thickness is lower than 20 cm, the error introduced using the MS is limited and lower than that introduced using BS. Therefore, in such scenarios, it is reasonable to consider the GPR system as monostatic.

Introduced errors in the calculation of the dielectric constant using the AC-42000S based on the (a) monostatic simplification (MS) and (b) bistatic simplification (BS) methods.
Figure 13, a and b, shows the relative error introduced using the MS and BS methods with the GC-51600S. Similar trends to those observed for the AC-42000S are seen for the GC-51600S, with the relative error being lower for the GC-51600S. Except for small layer thicknesses (≤15 cm), the relative error is lower than 2% when using the MS method. In addition, the error introduced by using MS or BS is negligible for higher thicknesses, indicating the possibility of using the GC-51600S as a monostatic system.
Introduced errors in the calculation of the dielectric constant using the GC-51600S based on the (a) monostatic simplification (MS) and (b) bistatic simplification (BS) methods.
As previously discussed, when the receiver and transmitter are elevated at approximately 40 cm with a transmitter–receiver offset of 37.5 cm (the setup used in the current study), they can be treated as monostatic with negligible error, falling within the resolution error uncertainty. Therefore, we analyzed the effect of antenna elevation and transmitter–receiver offset to investigate the applicability of using AC-GPR for the CPM calculation. The analysis considered a pavement material with a dielectric constant equal to 4.2.
Figure 14, a and b, illustrates the relationship between the distance
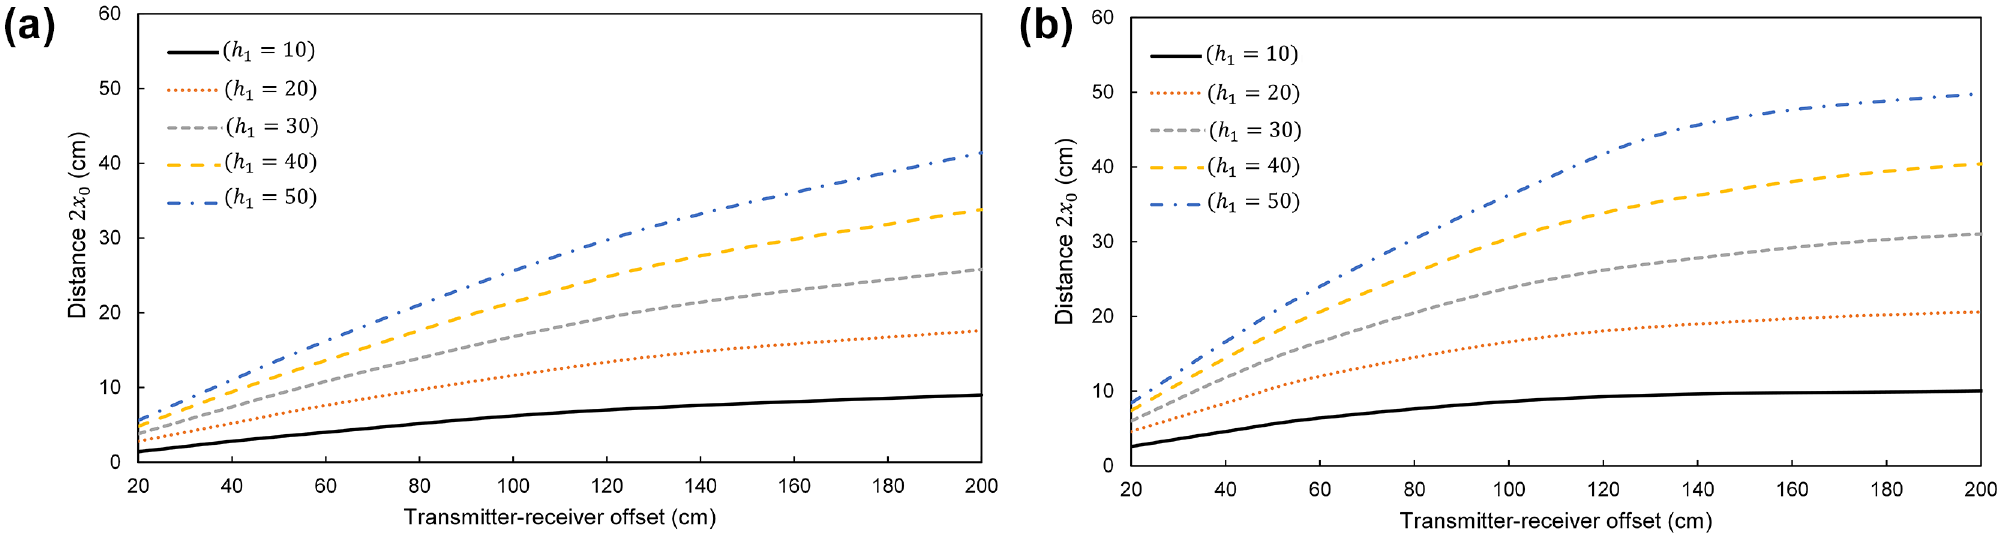
Relationship between the transmitter–receiver offset of air-coupled ground penetrating radar and the distance
Figure 14a shows that at an elevation of 50 cm and
This analysis indicates that the practicality of using AC-GPR for the CMP method should be carefully evaluated based on the thickness of the layer and the expected dielectric constant. The difference in
Conclusions
The extensive literature on GPR has established its applicability as a non-destructive technology for estimating the thickness and dielectric constant of pavement layers. Researchers have widely used TDMs for this purpose. However, the variability in results across different studies with respect to the suitability of different GPR systems and TDM calculation methods for dielectric constant and thickness estimation calls for a comprehensive investigation.
This study involved a comparative analysis of GC-GPR and AC-GPR for estimating the dielectric constant of pavement materials. Within the framework of TDMs, the study examined three distinct methodologies for estimating the traveled distance in the investigated layer. The investigations encompassed laboratory experiments using asphalt and dry sand and simulations with various experimentation setups. The GSSI 51600S and GSSI 42000S antennas were utilized to acquire data for our study while adopting the default setups recommended by the vendor.
The results indicated that the AC-42000S and GC-51600S yielded dielectric constants that differed by about 12% for A100. Notably, the differences were more significant for the other two specimens with lower thickness, which points to a limitation of TDMs when dealing with thin layers. Also, the effect of resolution on the certainty of the results is more prominent for lower thicknesses and dielectric constants. The results revealed that 42000S and 51600S antennas could be dealt with as monostatic antennas for pavement materials with different dielectric constants (≥3) with an error rate within 5%. However, this study highlights the need for caution when employing AC-GPR in common CMP analysis with default mounting setups, as it may yield unreliable results.
By providing a comprehensive comparison of GC-GPR and AC-GPR, together with insights into optimizing TDM calculations, this study provides practical guidance for researchers and practitioners in making informed decisions with respect to GPR system selection and calculation methods. This study adds to the existing body of knowledge about applications of GPR in pavement engineering and emphasizes the importance of customized methods in specific survey conditions. However, this study was limited to laboratory experiments employing only two GPR systems and three specimens, supplemented with a sensitivity analysis conducted using a theoretical framework. The impact of the physical sample size, particularly for the application of AC-GPR, was not investigated. Therefore, further research is needed to complement this study by incorporating more GPR systems, specimens of different types, and varying physical dimensions.
Footnotes
Author Contributions
The authors confirm contribution to the paper as follows: study conception and design: A. Fares, T. Zayed; data collection: A. Fares, N. Faris; analysis and interpretation of results: A. Fares, N. Faris; draft manuscript preparation: A. Fares, T. Zayed, N. Faris, S. Abdelkhalek, E.M. Abdelkader. All authors reviewed the results and approved the final version of the manuscript.
Declaration of Conflicting Interests
The author(s) declared no potential conflicts of interest with respect to the research, authorship, and/or publication of this article.
Funding
The author(s) disclosed receipt of the following financial support for the research, authorship, and/or publication of this article: Ali I.F. Fares would like to express his acknowledgment and thanks to the Research Grants Council (RGC) of Hong Kong for supporting his PhD study through the Hong Kong Ph.D. Fellowship Scheme (HKPFS).