
Abstract
In this study, for the first time in the literature as far as we are aware, we model e-scooter use frequency and use purpose jointly, allowing for multiple use purposes. In doing so, we consider individual and household sociodemographics and psycho-social lifestyle considerations, as well as a residential location indicator. The analysis uses data collected through a survey of e-scooter users in Washington, D.C., U.S., administered electronically between September 2021 and December 2022. The results from our analysis indicate that gender, income earnings, motorized vehicle ownership in the household, a green lifestyle propensity, and a positive perception of e-scooters, in general, are the most important determinants of use frequency. Also, there are distinct demographic groupings between e-scooter use for hedonic (leisure and tourism-related) pursuits and utilitarian (shopping, work/appointments, and transit connections) pursuits. By understanding how changes in key influencing variables can affect use frequency and purpose, we provide richer insights for policy and initiatives involving frequency and integration, perceptions and marketing, sustainability, equity and accessibility, and mixed land-use practices.
Since their introduction in 2017, e-scooter-sharing services have experienced increasing acceptance in urban areas. Estimates suggest there are 24 million shared e-scooter users in the U.S. and the user base is anticipated to grow at an average annual rate of 9.2% over the next 5 years ( 1 ). Interestingly, despite the temporary suspension of many e-scooter services at the onset of the COVID-19 pandemic, the e-scooter-sharing market has continued to grow strongly ( 1 ). This resilience highlights the enduring appeal and potential of e-scooter sharing as a viable urban mobility option. As for user-owned e-scooters, official statistics are hard to find, but it is estimated that over 16,000 e-scooter units are sold monthly on the major e-commerce platform Amazon alone ( 2 ).
Existing research on e-scooters may be broadly classified into two main areas: 1) system-level studies and 2) consumer-level studies. System-level studies focus on addressing questions related to the supply and use of e-scooters, their spatial and temporal mobility patterns, their interaction with pedestrians and other roadway users (including safety concerns), and the challenges of integrating with other travel modes. On the other hand, consumer-level studies aim to explore the travel behavior associated with e-scooter usage, including who uses them, how frequently, and for what purposes, and their interaction with other transportation modes in people’s activity-travel patterns. At this consumer level, although e-scooter companies collect user information and detailed trip characteristics, such data are usually not publicly released because of privacy concerns and proprietary value. Thus, most consumer-level studies rely on user surveys, and combinations of GPS data and trip-planning apps ( 3 – 6 ). Consumer-level studies can be further grouped into: 1) individual-level studies focusing on sociodemographic and built environment variables associated with e-scooter usage and 2) trip-level studies that focus on the intersection of individual characteristics and trip characteristics including purpose, length, and time. The first group of studies focuses on the overall adoption and use of e-scooters (see Blazanin et al. for an extensive review), while the second group of studies emphasizes the supplementary and substitutive effects between e-scooters and traditional travel modes for specific trips (see Badia and Jenelius) ( 7 , 8 ). In our current study, the focus is on an individual-level analysis of e-scooter use, along with the purposes for which e-scooters are used. While trip-level studies have also provided some insights on trip purpose, the purpose is captured as a single choice for a specific trip (such as the purpose of a typical e-scooter trip or the purpose of the last trip for which an e-scooter was used). Our individual-level analysis of purpose, on the other hand, allows an individual to report e-scooter use for a suite of different kinds of purposes (rather than confining the individual to respond in only one purpose category as in the trip-level studies).
The literature on individual-level analysis (e.g., Reck and Axhausen, and Mouratidis et al.) has investigated e-scooter adoption, with a handful of studies going beyond adoption to examine use frequency (the intensity of e-scooter usage), typically in ordinal categories ( 4 , 5 ). For example, Guo and Zhang used three ordinal categories to represent use frequency: they classify users as “infrequent users” (those who rode once in a while), “occasional users” (those who rode occasionally but less than once a week), and “regular/frequent users” (those who rode e-scooters more than once per week) ( 9 ). Similarly, Aguilera-García et al. adopted a three-level ordered categorization of “never used,”“occasionally used” (less than once per week), and “frequently used” (once per week or more frequently) ( 10 ). Blazanin et al. also used three ordinal categories of use: rarely, weekly, and monthly, though they also modeled adoption (first use) ( 7 ). All these studies use either a binary choice model (for adoption only), an ordered-response model (for the ordinal categories of use), or a combination (Blazanin et al.) to model both adoption and frequency ( 7 ).
The general (and consistent) findings from the above individual-level studies of e-scooter use are that younger (26–35 years) individuals, students, and those with a university degree are more likely to be e-scooter users. Other individual characteristics that have been found to affect e-scooter adoption and use include gender (men are more likely than women to use e-scooters), holding a motor vehicle driver’s license (holders are more likely to be e-scooter users), and e-scooter owners (see Blazanin et al. and Guo and Zhang) ( 7 , 9 ). Guo and Zhang also considered trip purposes as exogenous variables to model use frequency ( 9 ). They found that those who used e-scooters for commuting or dining were likely to be more frequent users than those who used e-scooters for sightseeing/recreation. At the same time, those who used e-scooters for sightseeing/recreation were likely to be more frequent users than those who used e-scooters for shopping and connecting to public transit. Some other studies have considered individual attitudes/priorities and lifestyle effects, in addition to sociodemographic effects and trip purpose effects, to analyze use frequency. For instance, Aguilera-García et al. included indicators of personal attitudes (willingness to download new apps, share personal data, and share bank account information) and the travel priority of respondents (such as the importance of travel time, travel cost, environmental issues, and travel time reliability), suggesting that those more willing to share bank account information and those who have a high concern for environmental issues are the most frequent e-scooter users ( 10 ). Similarly, Reck and Axhausen also considered the travel priority of respondents, in the form of priority for the environment, travel time, and travel flexibility, and observed that individuals with a high environmental priority were less likely to use e-scooters, while those with high priority for time and flexibility, as well as those with public transport season ticket ownership, are more likely to be e-scooter users ( 4 ). Blazanin et al. also considered psycho-social attitudinal variables in the analysis of e-scooter use adoption and use frequency, but differently from Aguilera-García et al. and Reck and Axhausen who included attitudinal indicators directly as explanatory variables ( 4 , 7 , 10 ). Blazanin et al. recognized that the indicators are manifestations of underlying (but unobserved to the analyst) latent attitudes ( 7 ). They point out that, because the indicators are but proxies of attitudes captured with measurement error, directly including them as exogenous variables invites the pitfalls of inconsistent model estimation as well as provides less than adequate insights for interventions, because the relationship between observed individual characteristics and the attitudinal constructs is not mapped.
The Current Study
In this paper, we contribute to the literature on individual-level studies of e-scooter use in several ways.
1) For the first time in the literature as far as we are aware, we investigate the effects of determinant variables on use purpose, in addition to the effects on use frequency. Earlier studies have focused on the latter, but not the former. “Use purpose” here refers to the overall suite of purposes for which an e-scooter is used, as opposed to the purpose of a single trip, thus better capturing the richness of purposes of e-scooter use.
2) We model use frequency and use purpose jointly rather than employing use purposes as a set of exogenous variables. The latter approach, as adopted by Guo and Zhang, fails to recognize the jointness in use frequency and purpose choices ( 9 ). For example, individuals with a strong intrinsic inclination toward environmental consciousness (an unobserved variable) may not only choose to use e-scooters frequently but also specifically use e-scooters for making routine transit connections. Similarly, those who intrinsically have a positive attitude toward e-scooters (viewing them as “cool and hip” as well as a quick/convenient way to get around) may not only have a high frequency of use but also tend to use them specifically for time-constrained social/tourism pursuits. If such significant jointness exists between use frequency and use purpose, and use purpose is treated as an exogenous variable to predict use frequency, it would incorrectly overestimate transit connections and social/tourism as important drivers of e-scooter use. This can then lead to misleading strategies about how best to increase e-scooter use, such as overinvestment in positioning e-scooter facilities around transit stations and tourism hubs. On the other hand, accommodating jointness in the two outcomes would control for spurious associations, after which one can examine if there are any “true” causal effects of use purpose on use frequency and vice versa.
3) As in some earlier studies, we consider a combination of sociodemographic as well as psycho-social lifestyle/attitudinal variables in our analysis (we will also refer to these variables as “stochastic latent constructs” in the rest of this paper). However, unlike Aguilera-García et al. and Reck and Axhausen, but similar to Blazanin et al., we consider the indicators (of these stochastic latent constructs) as proxies of lifestyles/attitudes captured with measurement error ( 4 , 7 , 10 ).
4) From a policy standpoint, our approach is also better able to trace back jointness in the use frequency and purpose dimensions to specific latent constructs, and from there to specific sociodemographic variables. Such a traceback can aid in strategy development.
5) We consider e-scooter use not only in a shared context but also in the privately-owned domain to examine potential differences in use and purpose patterns between shared and privately-owned e-scooter users.
6) While there have been survey-based studies of e-scooter use in highly car-oriented U.S. cities in the past (e.g., Blazanin et al., Guo and Zhang), we examine e-scooter use in the multimodal environment of Washington, D.C. ( 7 , 9 ).
The remainder of this paper is organized as follows. The next section contains a description of the data and a brief discussion of the analytic framework. The section after that presents empirical results including average treatment effects (ATEs). The final section discusses policy implications and conclusions.
Data and Analytic Framework
Survey and Sample Statistics
The data used in this study comes from the Washington, D.C. metropolitan area. It is based on an e-scooter survey conducted by the University of California, Davis and the University of Leeds, UK, across multiple regions of the U.S., UK, and Europe. The multicity survey was undertaken in partnership with the New Urban Mobility Alliance (NUMO), a global alliance organization of cities, nonprofits, companies, mobility service operators, and community advocates from diverse sectors.
The survey was administered electronically between September 2021 and December 2022, with the collaboration of e-scooter service providers active in the study region. The e-scooter providers distributed the invitation to complete the survey among individuals in their existing customer database who had used e-scooters in the study region and had agreed to receive communications related to services or research. Survey-takers were entered into a prize draw for e-shopping vouchers to the value of $50.
Because of the survey administration procedure employed, the sample is restricted to only those who have ever used a shared e-scooter in the past. While this leaves out the possibility of studying the e-scooter adoption decision (that is, whether to adopt e-scooters), the survey provides a rich data source to understand general patterns of use amongst e-scooter users, including the smorgasbord of use purposes within each respondent’s e-scooter repertoire. The final sample, after data cleaning, comprises 823 individuals, with a small segment of 55 (6.7%) individuals owning a private e-scooter.
Use Frequency and Purpose (the Main Endogenous Outcomes)
E-scooter use frequency was captured in three ordinal discrete categories: “infrequent” (less than once a month), “monthly” (at least once a month but not every week), and “weekly” (at least once a week). The distribution of e-scooter use frequency (both shared and personal e-scooters) is as follows: 416 (50.5%) individuals used e-scooters infrequently, 227 (27.6%) used them monthly, and 180 (21.9%) used them weekly (see Table 1).
Sample Distribution of Endogenous Outcomes (N = 823)
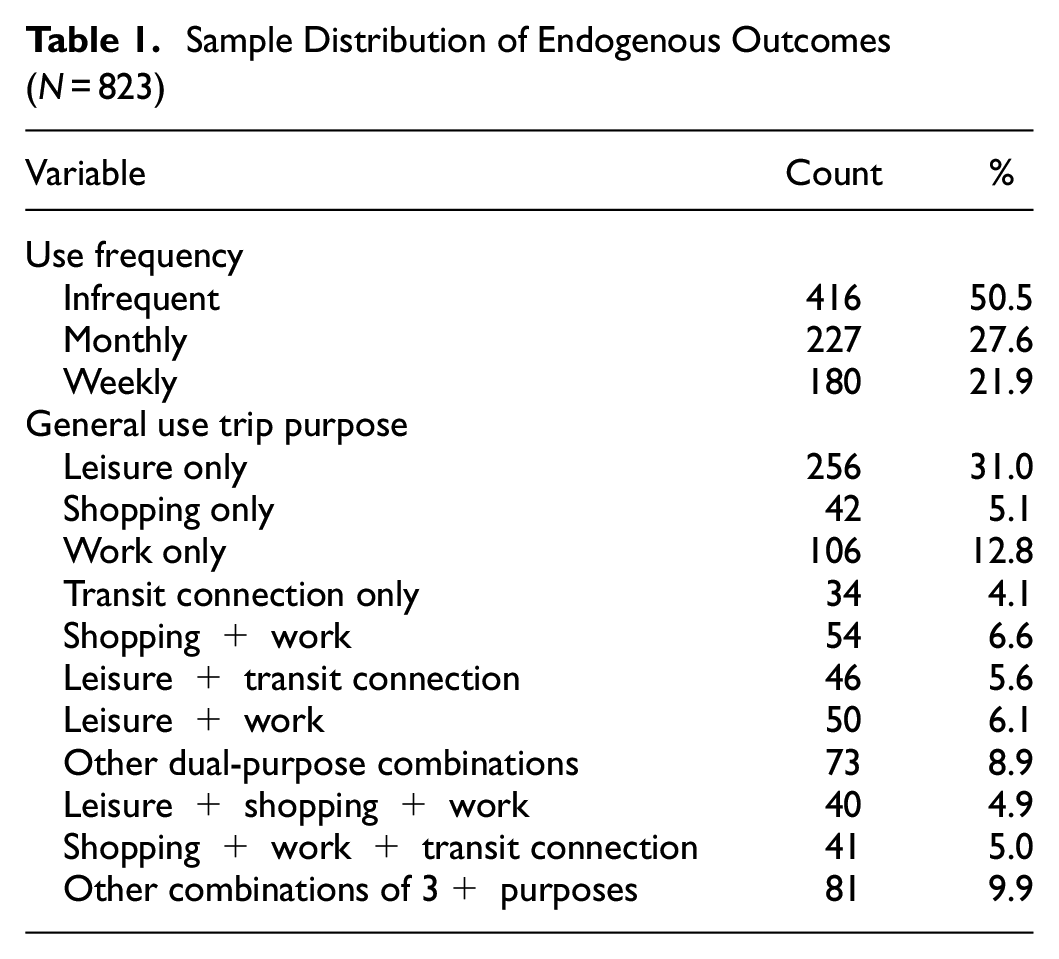
E-scooter use purpose is collected in the form of binary variables representing whether e-scooters were used for each of four categories: 1) tourism or social, 2) shopping or errands, 3) work or appointments, and 4) connecting to public transit. For ease of presentation, we will refer to these categories as “leisure” for tourism/social, “shopping” for shopping/errands, “work” for work/appointments, and “transit connection” for connecting to transit. As many as 438 individuals (53.0%) use e-scooters for just one purpose, 223 individuals (27.2%) use e-scooters for two purposes, and 162 individuals (19.8%) use e-scooters for three or all four purposes. Among single-purpose users, the breakdown is as follows: leisure (58%), shopping (10%), work (24%), and transit connection (8%). By far, the leisure purpose is the most popular among those reporting single-purpose use. Among dual-purpose users, the most prevalent combinations are for shopping and work (24%), leisure and transit connection (21%), and leisure and work (22%). The first of these may be characterized as a strategic trip chain where a person stops to shop on the way to/from work. The most common three or all four-purpose combination is shopping, work, and transit connection (25%).
Stochastic Latent Constructs
Three stochastic latent constructs are considered in our framework: green lifestyle propensity (GLP), variety-seeking lifestyle propensity (VSLP), and positive perception of e-scooters (PPS). Earlier studies in transportation and ethnography have found versions of the first two psycho-social constructs influential in shaping travel-related behaviors ( 7 , 11 , 12 ). The first latent construct, GLP, integrates the concepts of having a pro-environmental disposition and being socially altruistic. The second construct, VSLP, captures an individual’s inclination toward exploration, openness to new experiences, and embracing change. The third construct, PPS, pertains to personal attitudes toward e-scooters. Figure 1 provides the list of indicators corresponding to these latent constructs, along with the mapping of the indicators to each one of them. These mappings were determined based on both an exploratory and a confirmatory factor analysis (though the actual loadings are determined within the modeling framework used in our analysis).
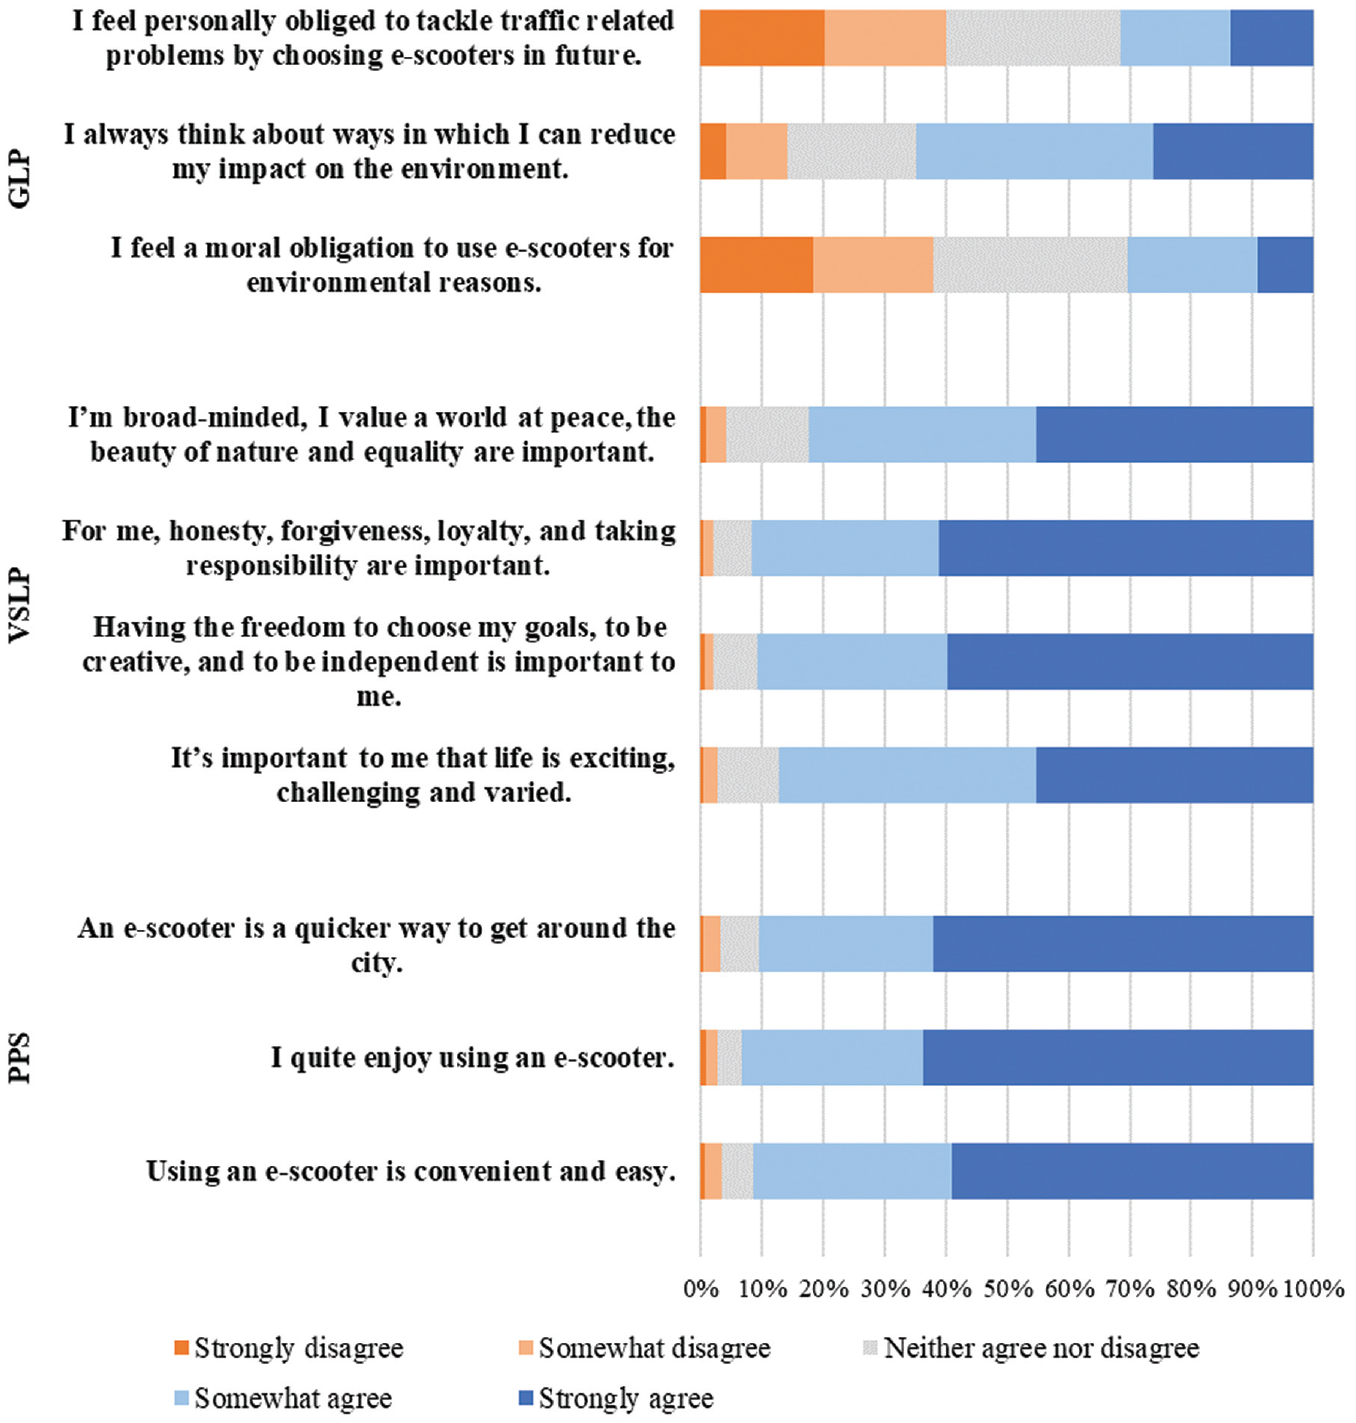
Sample distribution of lifestyle/attitudinal indicators.
The sample distributions of the indicators in Figure 1 for GLP suggest that e-scooter users are an environmentally conscious group of individuals, with over 60% of the sample “somewhat” or “strongly” agreeing that they think about ways to reduce their impact on the environment. But the sample is divided on whether they feel personally or morally obligated to use e-scooters to reduce traffic or for environmental reasons, with about 32% agreeing, about 40% disagreeing, and the rest undecided on the topics.As far as VSLP is concerned, a vast majority of the sample (80%+) agree with the traits of valuing peace, ascribing importance to life virtues, being self-directed, and enjoying an exciting and varied lifestyle. Finally, the PPS construct indicators reveal a common liking among the sample for e-scooter’s quickness, fun factor, and convenience. Very few people either disagree or remain undecided on these positive aspects of e-scooters.
Individual and Household Sociodemographics
The participating e-scooter companies that distributed the survey invitation did so with a large database of e-scooter users, including those residing in Washington, D.C. as well as those visiting the city. Therefore, we refrain from providing a direct comparison of the sample with the characteristics of the residents of the City of Washington or the larger Washington, D.C. metropolitan area. Besides, e-scooter users are typically more physically fit, own a smartphone, and are technologically savvier than the overall population. The sample shows reasonable variation across individual and household sociodemographics (see Table 2), with an almost even split by gender (51.3% men and 48.7% women). The sample loads on the young side of age, with 63.1% below the age of 35 years, 32.1% between 35 and 54 years, and 4.8% over the age of 54 years. As expected, the sample is highly educated, with 20.4% having less than an undergraduate degree, 37.5% having an undergraduate degree, and 42.1% having a degree beyond undergraduate. The employment rate among respondents is slightly above 80%.
Sample Distribution of Sociodemographic Characteristics (N = 823)
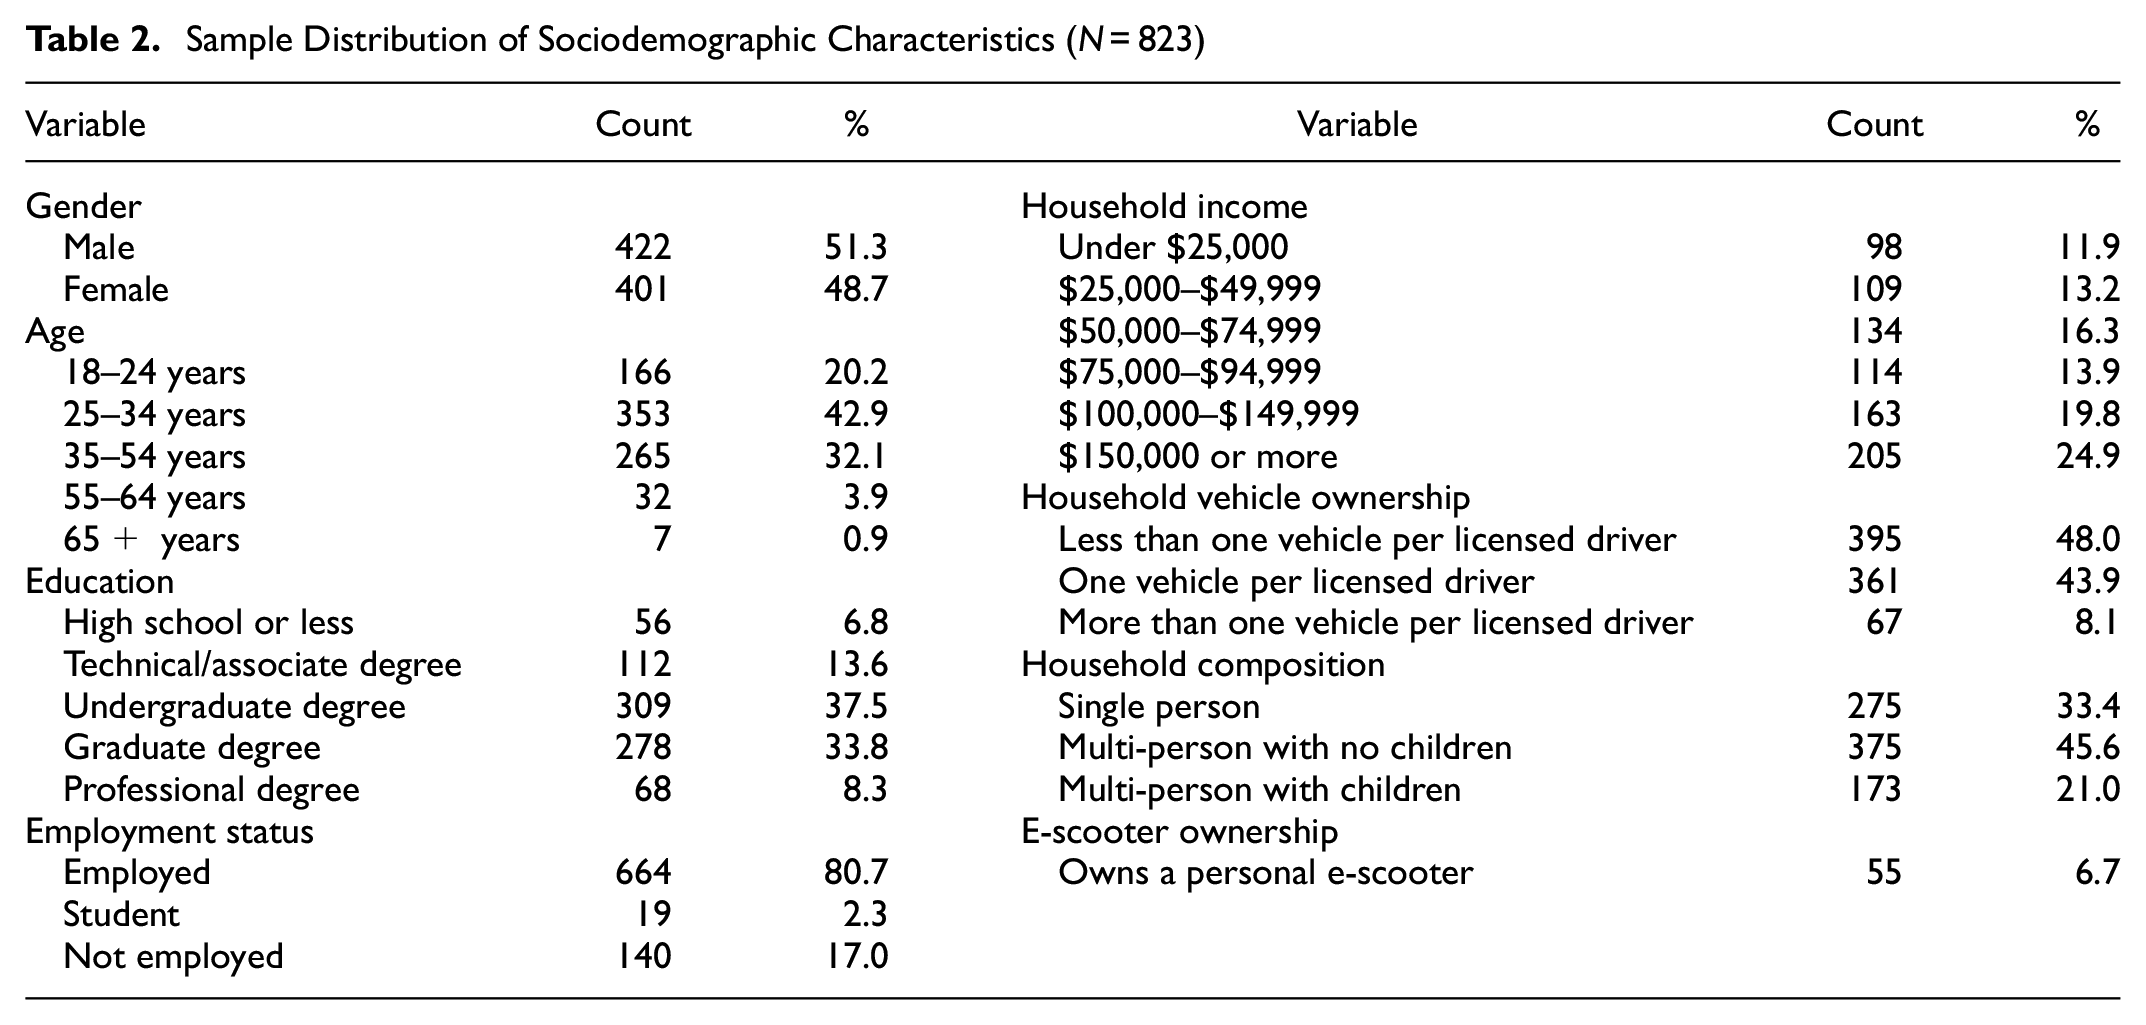
With regard to household sociodemographics, not surprisingly, as shared e-scooters are expensive to rent, the sample loads on the high-income side (44.7% have an annual household income exceeding $100,000). Slightly more than half (52.0%) have one or more than one motorized vehicle per licensed driver in the household (in this paper, the use of the term “vehicle” will be reserved for large, motorized vehicles not counting e-scooters and e-bicycles). Close to one-third (33.4%) of the respondents live alone, while almost half (45.6%) are from multi-person households with no children, and the remaining (21.0%) are from households with multiple individuals and children. No single-parent households were represented in the sample. As already indicated earlier, about 7% of the sample owns a personal e-scooter.
Analytic Framework
The analytic framework adopted in this study is based on the generalized heterogeneous data model (GHDM) developed by Bhat, which allows for the joint estimation of multiple outcomes of different types (continuous, ordinal, count, and nominal) by establishing a parsimonious dependence structure through stochastic latent constructs ( 13 ). In the current application, there are only ordered-response (use frequency) and multivariate binary outcomes (for each of the four trip purposes for which an e-scooter is used or not). Because a binary outcome can be viewed as a special case of an ordered-response outcome, the overall framework may be viewed as a multivariate ordered-response system. The framework is visually presented in Figure 2. Individual and household sociodemographics (the exogenous variables) are positioned at the left side of the figure and affect the stochastic latent constructs (at the center of Figure 2). These sociodemographic effects on the latent constructs, along with the correlations among the latent constructs (represented by the double-headed curved arrows), represent the structural equation model (SEM) component of GHDM. The error vector η captures the effects of unobserved idiosyncratic individual factors that affect the set of latent constructs for a given individual, after controlling for observed individual/household demographics. As a result, the latent constructs are stochastic. The SEM relationship is imputed based on the loadings of the latent constructs on the construct indicators (not shown in Figure 2 to avoid clutter) and on the endogenous outcomes (the endogenous outcomes are positioned on the right side of Figure 2). These loadings are part of the measurement equation model (MEM) component of the GHDM framework. In addition, individual and household sociodemographics may have a direct effect on e-scooter use frequency and purpose over and beyond the indirect effect through the latent constructs. This direct effect is represented by the arrow, at the bottom of the figure, directly from the individual/household demographics to the endogenous outcomes. The stochastic latent construct effects on the endogenous outcomes engender correlation effects among the endogenous outcomes, as discussed in The Current Study section. Finally, in joint limited-dependent variable systems, such as the one used here, the identification of causal relationships is confined to the recursive effects among the endogenous variables. Through various tests on recursive structures, we found that the causal direction of effect is from use frequency to use purpose (not from use purpose to frequency, as a-priori assumed by Guo and Zhang) ( 9 ). The use frequency effect on purpose (identified by the single-headed arrow in the endogenous outcome box in Figure 1) may be viewed as the “true” causal effect because spurious associations caused by the stochastic latent constructs have been controlled for. To save space and avoid excessive notation, we refer the reader to the detailed GHDM estimation framework discussed in Bhat ( 13 ).
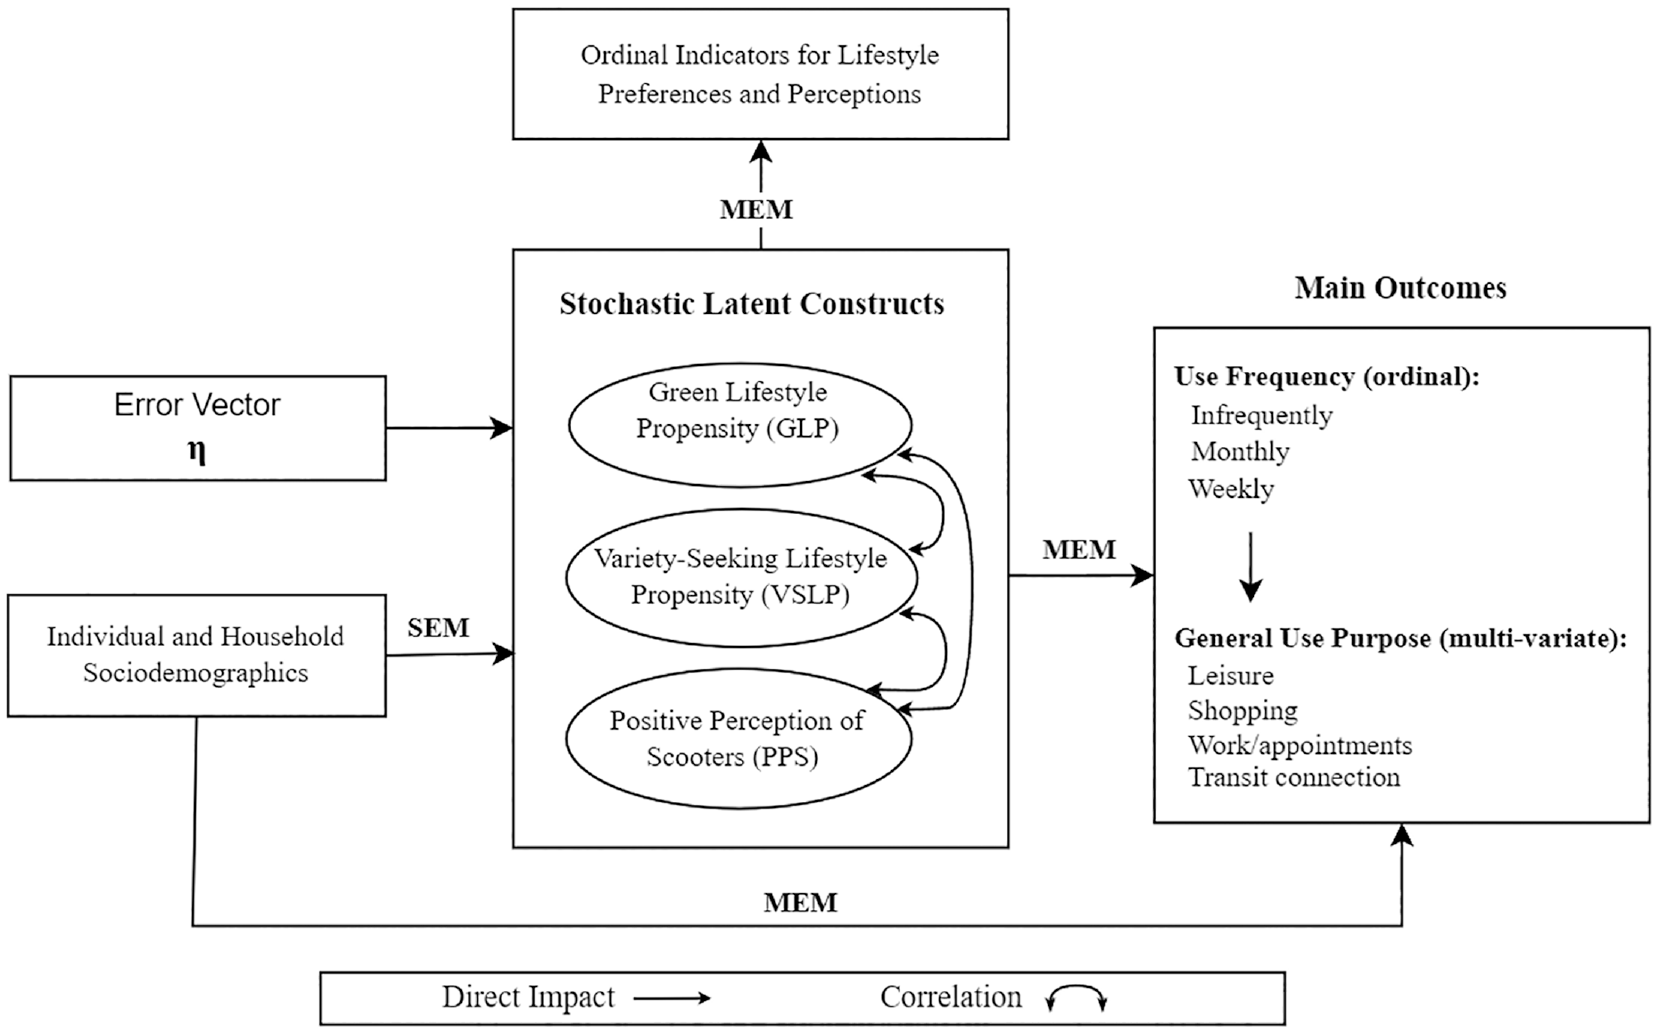
Visualization of the generalized heterogeneous data model (GHDM) framework.
Empirical Results
Several functional forms were tested for exogenous variables. The selection of variables included in the final model specification was based on previous research, intuitiveness, statistical significance (90% significance level), and parsimony considerations.
Latent Constructs Results
In this section, we first discuss the SEM results pertaining to the relationships among the latent constructs and exogenous sociodemographic variables, and the relationship between the latent constructs. Then, the MEM component results for the relationship between the latent constructs and their indicators are discussed.
Table 3 reveals, among individual sociodemographics, that gender significantly affects all three latent constructs. The higher GLP among women is well established in the social-psychological literature, which attributes this gender-based effect to relational value differences between genders (see Liu et al.) ( 14 ). According to this literature, women’s greater empathy toward other beings would translate into higher environmental concern, emphasizing the shared responsibility of preserving the environment for collective benefit. Women’s general care for others also permeates into the VSLP construct through the notions of peace, harmony, forgiveness, and honesty. The elevated desire for variety-seeking in women may also be explained by asymmetric power balances, leading to a lower sense of life control. Thus, women are more likely to seek empowerment, freedom, and excitement relative to men to retain self-identity ( 15 ). Similar reasons might explain women’s higher PPS, driven by the need for free-spiritedness and variety-seeking. Beyond gender, education affects VSLP solely among individuals with an undergraduate degree, rather than those below or above this level of formal education. This suggests a balance between higher formal education opening minds to new activities and opportunities, while also potentially leading to tunnel-vision because of the opportunity cost of time. The emphasis on opportunity cost of time also appears to lead to a generally lower PPS among those with a high level of formal degree attainment. With regard to employment status, unemployed individuals have a lower VSLP.
Determinants of Latent Constructs
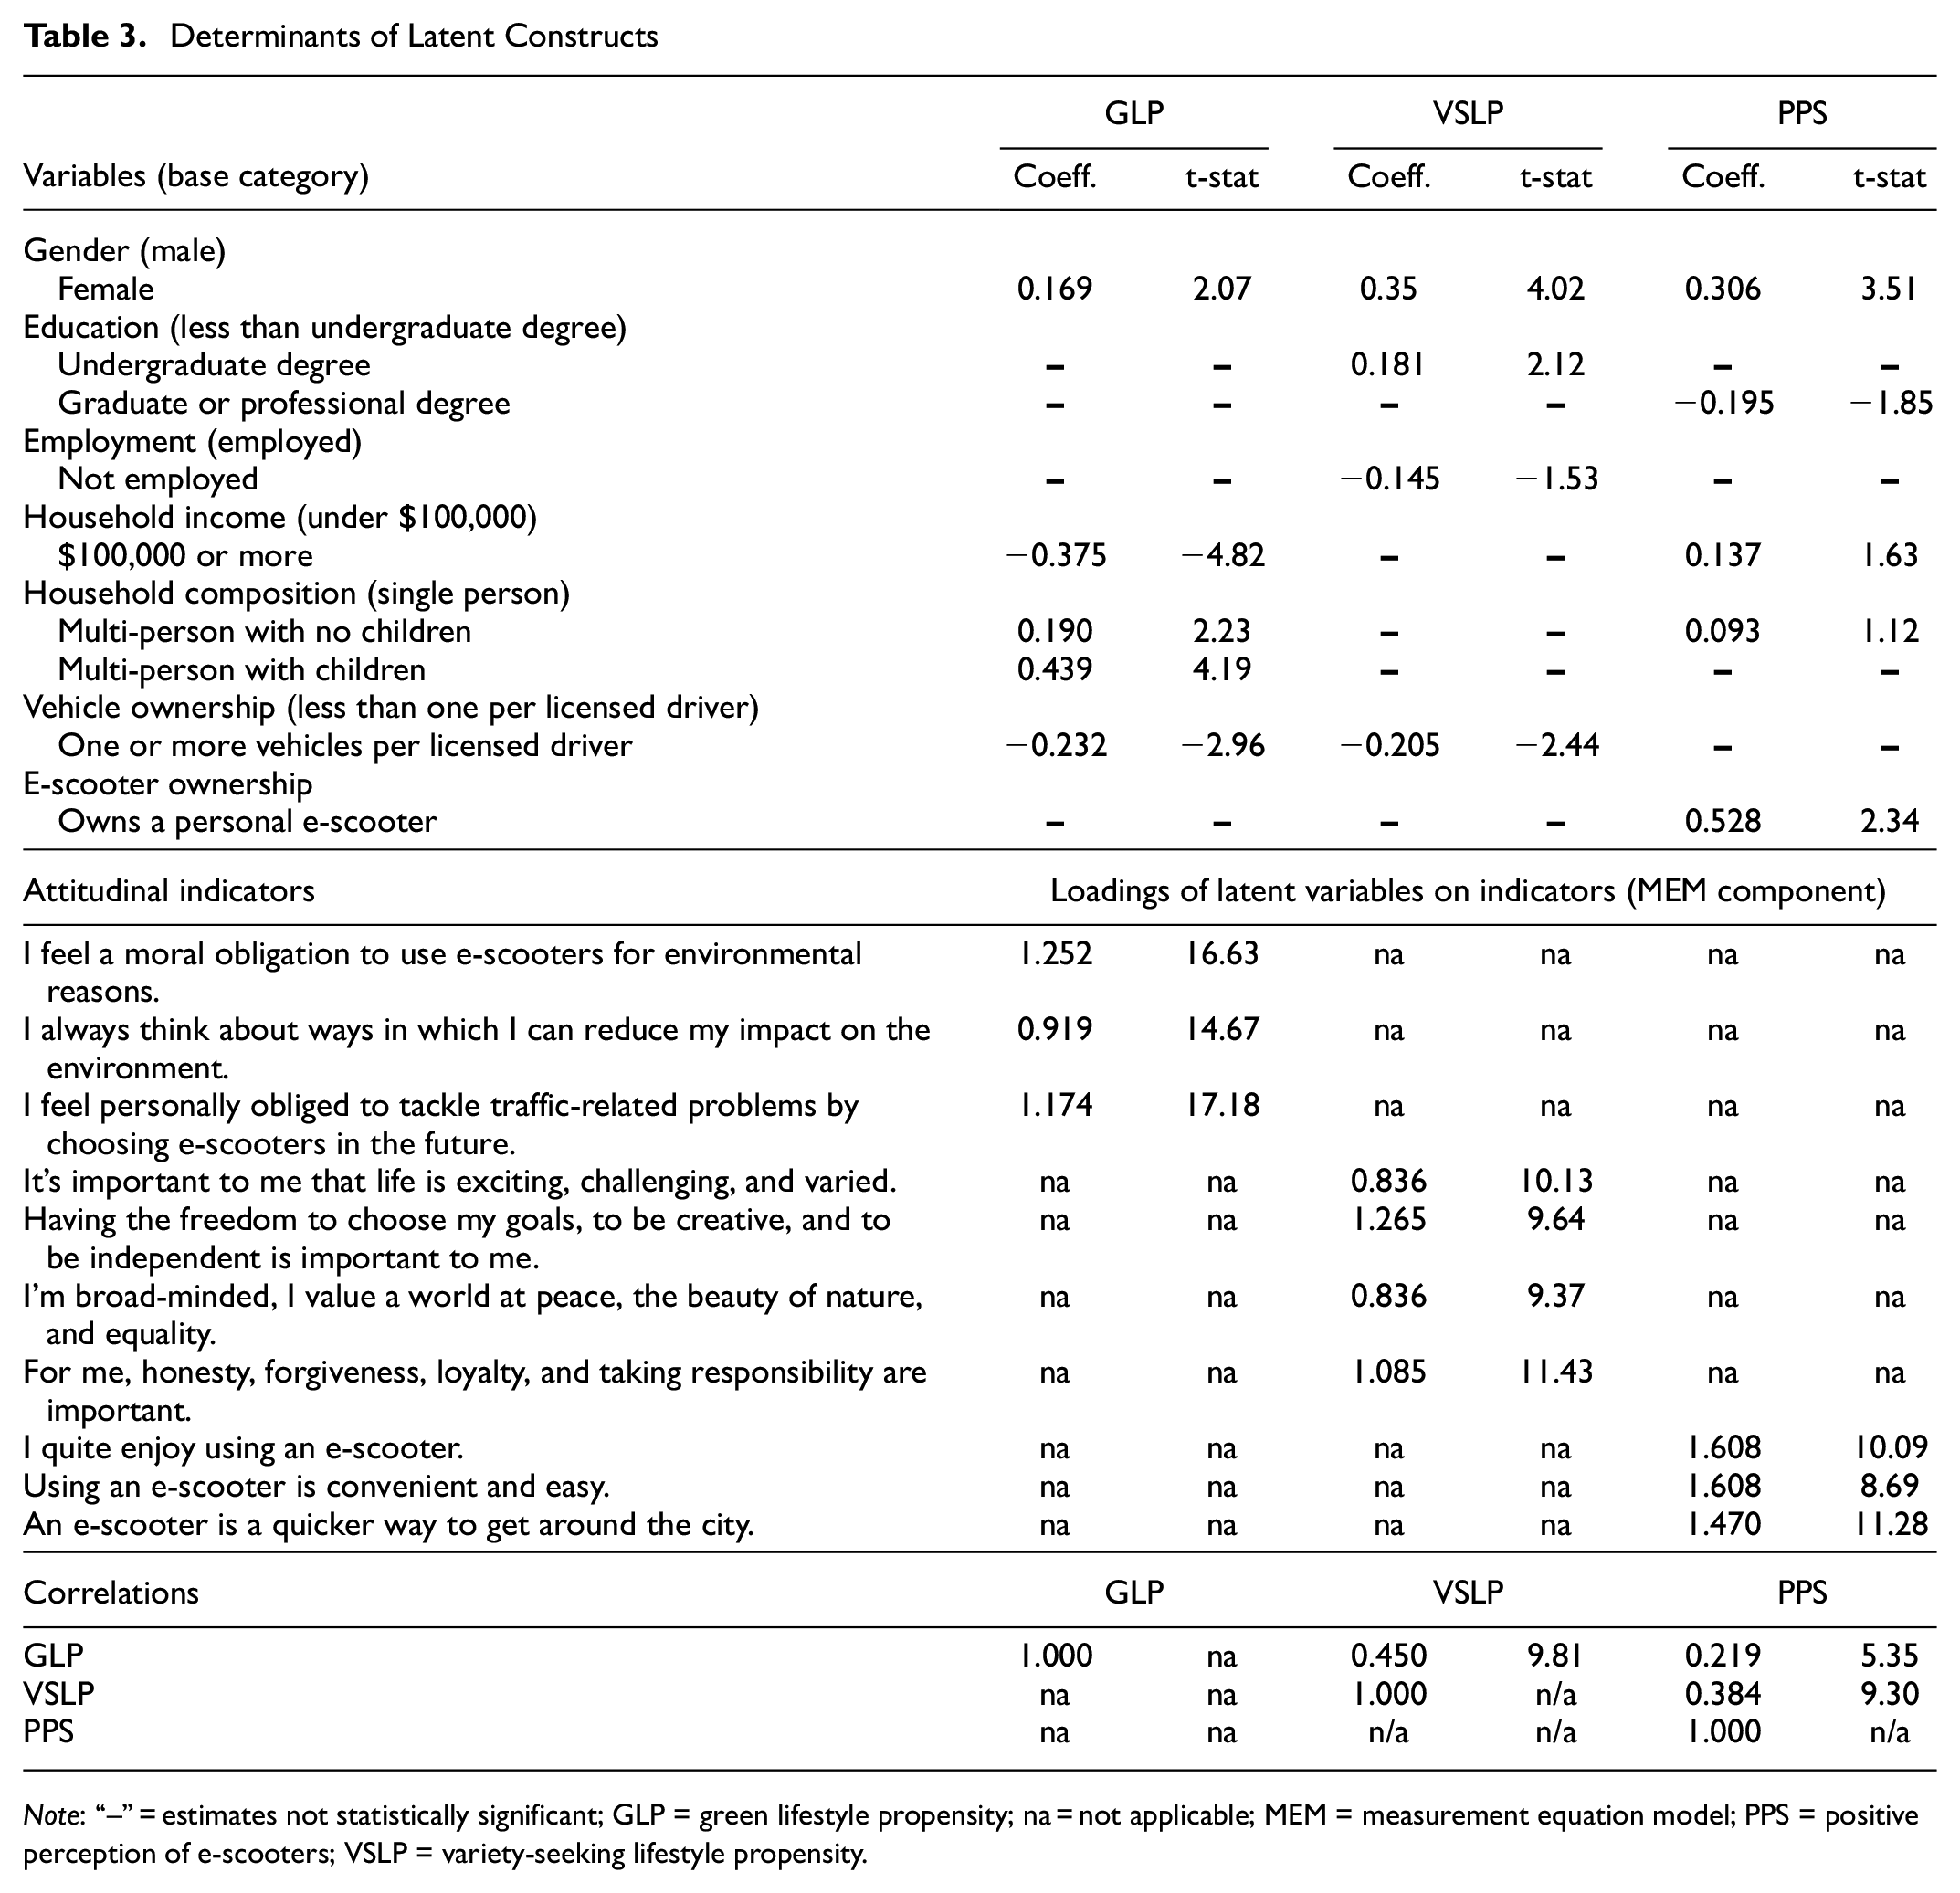
Note: “–” = estimates not statistically significant; GLP = green lifestyle propensity; na = not applicable; MEM = measurement equation model; PPS = positive perception of e-scooters; VSLP = variety-seeking lifestyle propensity.
The results for household demographic effects on the latent constructs are as expected, so will only be briefly discussed. High household income reduces GLP, while increasing PPS. The former effect may be because high-income groups prioritize status and exclusivity over eco-friendliness (e.g., Chevalier and Gutsatz) ( 16 ). In contrast, individuals living with others show higher GLP and PPS compared with singles, a relationship that is likely mediated by the stage in life represented by the living arrangements. Finally, owning a high number of vehicles relative to licensed drivers reduces green and variety-seeking inclinations, and owning e-scooters positively affects PPS (though it would be more appropriate to view this as an association, because the latter is likely, at least in part, a cause of the former).
The bottom half of Table 3 presents the MEM component results. The signs for all indicators are positive, consistent with the indicator prompts. The last row panel section, which presents the correlations among the stochastic latent constructs, reveals positive correlations across all pairs of constructs, suggesting that unobserved factors related to altruism, free-spiritedness, and pacifism permeate into uniformly higher or lower levels of GLP, VSLP, and PPS.
Main Outcome Results
The MEM results for the main outcomes are presented in Table 4. These include the latent construct, the exogenous sociodemographic, and the recursive endogenous variable effects on the propensities underlying the use frequency ordinal outcome and the purpose binary outcomes. It is important to note that the sociodemographic effects presented here are direct effects, after considering the indirect effects through the latent constructs and the use frequency.
Model Estimation Results (N = 823).
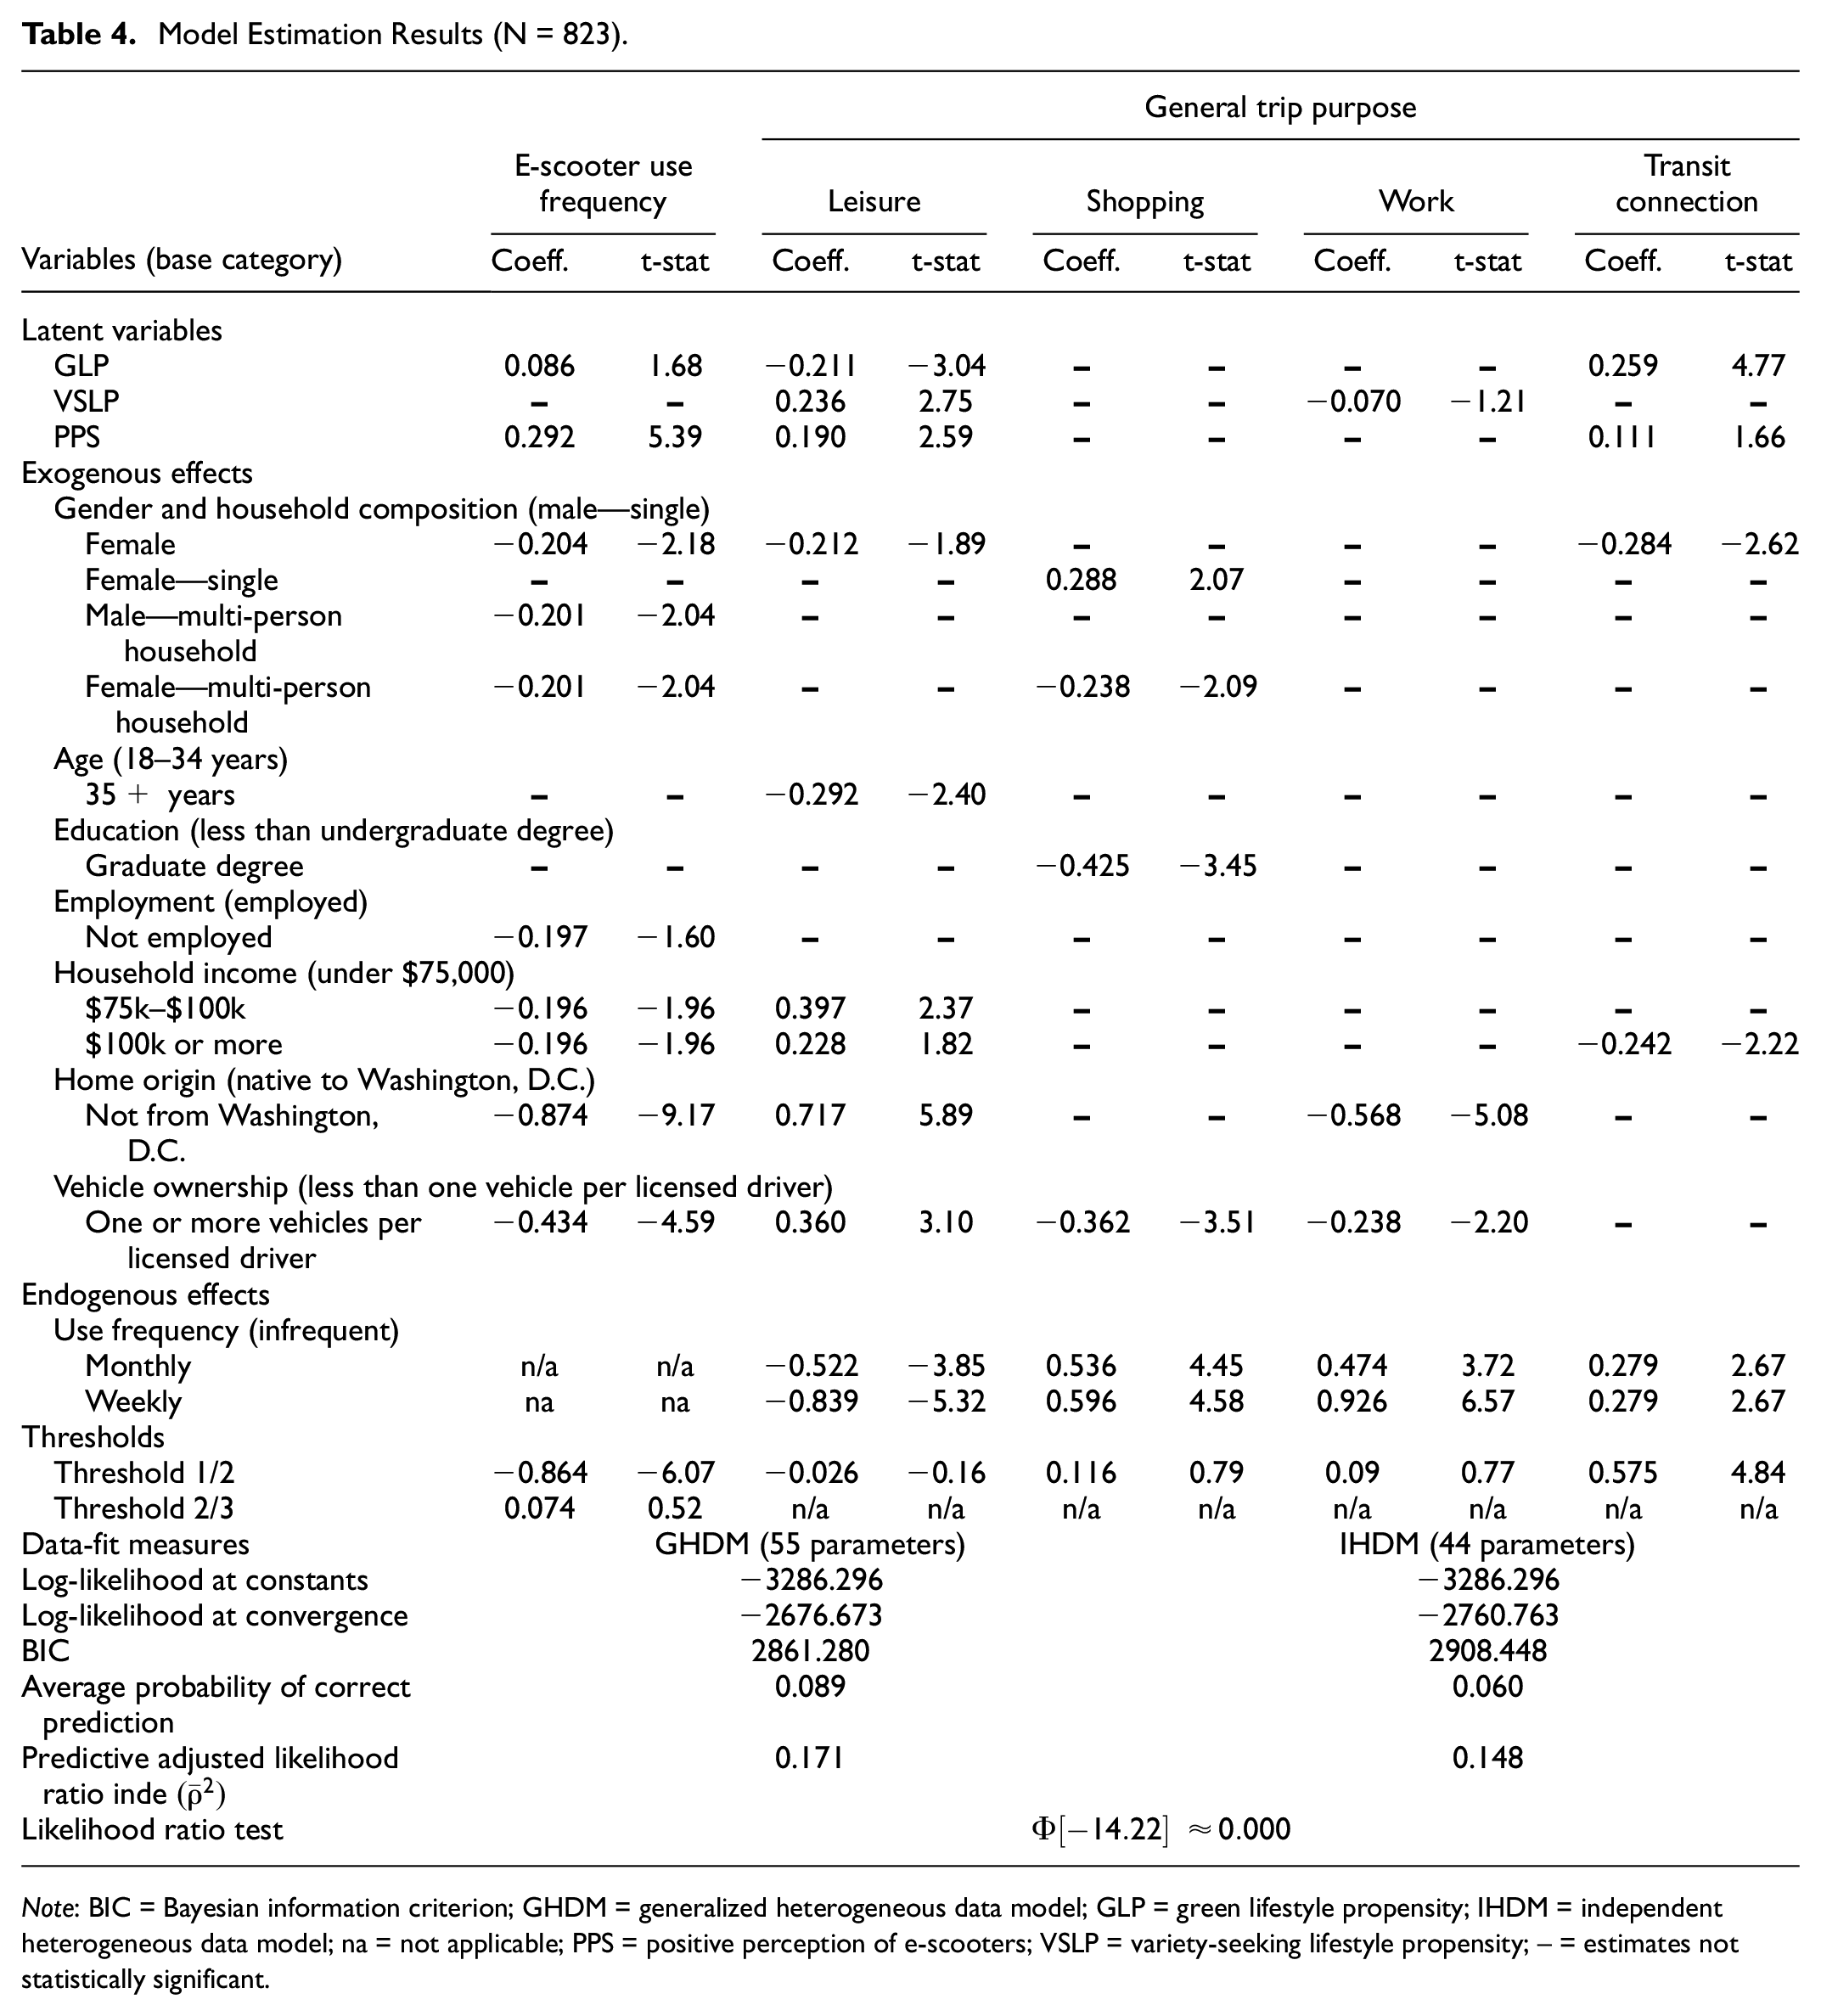
Note: BIC = Bayesian information criterion; GHDM = generalized heterogeneous data model; GLP = green lifestyle propensity; IHDM = independent heterogeneous data model; na = not applicable; PPS = positive perception of e-scooters; VSLP = variety-seeking lifestyle propensity; – = estimates not statistically significant.
Latent Construct Effects
Table 4 shows that a higher score on GLP implies a higher propensity for e-scooter use. This positive association between environmental concern and e-scooter use frequency has been consistently observed in previous studies (see Blazanin et al. and Bretones and Marquet), and can (at least partially) be attributed to the positioning and marketing of e-scooters as an eco-friendly alternative ( 7 , 17 ). Individuals holding a high PPS also tend to be frequent users. While most studies use respondent ratings of these attributes as independent variables in their models, and not as latent constructs or factors as we do, multiple studies have established a positive association between perceived attributes of e-scooters and their usage (see Bretones and Marquet) ( 17 ).
All three latent constructs affect one or more general trip purposes. Higher GLP is negatively linked with e-scooter use for leisure but positively linked with transit connections. The former result suggests that environmentally conscious individuals prefer alternative modes of transportation, such as walking, bicycling, or using public transit for leisure, either to minimize their environmental footprint during leisure and/or to maximize their time by traveling on faster public transit systems when vacationing. The positive effect of GLP on transit connection has already been explained earlier in the paper, reflecting an overall eco-friendly lifestyle. Also, individuals with higher VSLP tend to use e-scooters more for leisure. This is intuitive, as those who seek stimulation and value freedom in life are likely to explore new places using innovative modes of transportation, such as e-scooters. On the other hand, individuals with lower VSLP scores are more likely to use e-scooters for work-related purposes, where practicality and efficiency in commuting take precedence over variety-seeking and excitement. Finally, individuals who appreciate the fun, convenience, and agility aspects of e-scooters (i.e., have a high PPS) are more likely to use them for leisure and to connect with transit.
Effects of Individual and Household Sociodemographic Variables
Women demonstrate a lower propensity for e-scooter use compared with men, both when single and non-single, measured as a direct effect. When taken in concert with the indirect effects through the GLP and PPS latent propensities, the net result of being a woman on e-scooter use propensity remains negative. That is, the direct effect dominates the indirect effect here. Note that the indirect effect of being a woman is 0.086 (coeff. on GLP from Table 4) * 0.169 (female coeff. effect on GLP from Table 3) + 0.292 (coeff. on PPS from Table 4) * 0.306 (female coeff. effect on PPS from Table 3) = +0.104. The net effect then is −0.204 + 0.104 = −0.100 for single women relative to single men and −0.097 for non-single women relative to non-single men. (To discuss the gender effects appropriately, we have combined the household composition variables with the gender effects in Table 4.) Several studies report that men are more likely to adopt and frequently use e-scooters, suggesting that these gender disparities may be attributed to differences in risk-taking perceptions between men and women ( 4 , 9 ). However, further investigation is needed to fully understand the underlying reasons behind these gender-based variations in e-scooter usage. Our study starts to provide some initial guidance along these lines, indicating that e-scooter use among women (in any type of household structure) is particularly low for transit connections. This holds true even after controlling for the effects of gender through the GLP and PPS latent constructs; the net effect is −0.207 and remains statistically significant at the 95% confidence level. On the other hand, the results also reveal that e-scooter use among single women is higher for shopping purposes. After accounting for the endogenous effects, the net effect is +0.343. However, e-scooter use for shopping purposes among non-single women is significantly lower. This effect may be because e-scooters are primarily designed for individual use, making them less convenient for families or groups. In general, this is also the case for overall use frequency, where the results indicate that single individuals have a higher propensity for e-scooter use than those with multiple adults in the household. Overall, based on the many gender effects, single men have a generally heightened proclivity for e-scooter use, and men (regardless of being single or not) have an elevated propensity for e-scooter use for leisure and transit connections. Other individual sociodemographics, including age and education, have little direct effect on use frequency beyond any indirect effects they have through the latent constructs. However, older individuals are particularly unlikely to use e-scooters for leisure (perhaps because of being more cautious when pursuing tourism-type activities in unfamiliar surroundings), while those with a graduate degree are unlikely to use e-scooters for shopping. This latter effect is a net effect because there are no indirect effects through latent constructs on the shopping purpose. As far as employment status is concerned, unemployed individuals are reticent to use e-scooters as frequently as employed individuals. Unemployed individuals may have fewer daily travel needs compared with the employed, which could result in lower e-scooter usage among the unemployed.
Household demographics also play a role in e-scooter use frequency and use purpose. Individuals from households making over $75,000 per year have a lower predisposition to use e-scooters. The effect of income has been rather inconsistent across studies. While some earlier studies suggest e-scooter use is more prevalent among high-income households or those living in rather affluent neighborhoods (see Reck and Axhausen), Blazanin et al. find no effect of income on e-scooter use ( 4 , 7 , 18 ). Our study aligns more closely with Blazanin et al., suggesting that income has a net negative effect on e-scooter use (even when considering the indirect GLP and PPS effects, the net coefficient for those from households with $100,000 or more remains negative at −0.188 ( 7 ). All the studies, including ours, control for a host of other variables too. Clearly, more investigations are needed into this income effect. It is possible that income effects are purpose-specific, and there is a need to consider use frequency not just in a generic sense, but separately for each purpose. Again, our study starts to provide some insights along these lines. Specifically, our results reveal that individuals from high-income-earning households have a higher propensity for e-scooter leisure use but a lower propensity for connecting with transit. Other household demographic effects reveal: 1) the lower intensity of e-scooter use for D.C. non-residents, because of the limited availability and practicality of e-scooters in less densely populated areas, and reduced intensity of use among households with an abundance of motorized vehicles, 2) the higher use of e-scooters for leisure, and lower use of e-scooters for work, among D.C. non-residents and high car-owning households, and 3) the lower use of e-scooters for shopping by individuals from households with high vehicle ownership. With personal cars readily available, individuals in such households may find it more convenient to use their vehicles for most of their routine travel (such as to work and shopping), reducing the need and inclination to use e-scooters. Interestingly, we did not find any direct effects of e-scooter ownership itself on use frequency or purpose, though this variable plays an important role through its indirect effect through the PPS latent construct.
Endogenous Effects
After accounting for the correlations between the use frequency and use purpose outcomes through the latent constructs, endogenous effects may be considered in a recursive fashion. Our results reveal that the causal direction of effect is from use frequency to use purpose, not from use purpose to use frequency. An increase in use frequency implies an elevated propensity to use e-scooters for routine purposes, such as shopping, work, and transit, and a lower intensity of use for leisure. The implication is that improving facilities and encouraging e-scooter use for any routine purpose has the benefit of increasing e-scooter use for all routine purposes. While doing so may also decrease non-routine (basically tourism-type) use of e-scooters, this result augurs well for promoting sustainable transportation systems by making e-scooters more available and accessible within large swaths of urban cities. As individuals start using e-scooters for a wide variety of trip purposes, it can lead to a general lifestyle change and further increase e-scooter use in a reinforcing cycle.
Threshold Effects
The threshold elements in Table 4 do not have any substantive interpretations. Their primary purpose is to map the underlying propensity to the actual observed ordinal category (for use frequency) and the actual observed binary variable (for the binary trip purpose categories).
Model Fit
The data fit improvement resulting from jointly modeling the two choice dimensions in the GHDM system can be evaluated by comparing it with an independent heterogeneous data model (IHDM) that ignores jointness (that is, does not consider the stochastic latent constructs that engender the correlations in GHDM across the use frequency and use purpose dimensions). For GHDM, we evaluate a predictive log-likelihood value purely for the use frequency and purpose dimensions (ignoring the MEM component corresponding to the loading of the latent constructs on the indicators). The number of effective parameters in GHDM then corresponds to the actual estimated GHDM parameters minus the loading of the constructs on the indicators, amounting to 55 parameters. Next, we estimate an IHDM for the use frequency and purpose dimensions, without consideration of latent variables. In this IHDM, to put things on as equal a footing as possible in relation to observed variable effects, we include the determinants of the latent constructs as explanatory variables, resulting in a total of 44 parameters. We next compute a predictive log-likelihood for this IHDM as well as a model with only the thresholds. GHDM and IHDM are not nested, but we are able to test the two using informal non-nested tests. The analysis includes various metrics to assess model performance, such as the predictive log-likelihood at convergence with values of 2,676.673 for GHDM and 2,760.763 for IHDM (Table 4). The log-likelihood for IHDM with only thresholds is the same as that for constants at −3,286.296 (this is essentially the log-likelihood value at sample shares). Additionally, BIC values exhibit differences, standing at 2,861.280 for GHDM, 2,908.448 for IHDM, and 3,306.716 for IHDM with only thresholds. Comparing predictive adjusted likelihood ratio indices
Average Treatment Effects (ATEs)
Analysis Preparation
The ATE metric provides the expected change in the outcome of interest for a random individual when a particular variable transitions from a base level to a treatment level. It helps assess the extent of actual and relative magnitudes of the impact of the key factors that influence endogenous variables on both e-scooter use frequency and a set of four general purposes for e-scooter use. To obtain ATEs, we categorize all individuals in the sample under specific levels of the variable and then compute the probabilities of selecting various outcome combinations. For example, we consider all individuals to be in the youngest age category (≤35 years). Next, each individual’s probability of selecting each possible combination of outcomes is computed, and then we average across all individuals. Then, we repeat this procedure for all individuals in the oldest age category (>35 years). The difference in average probabilities, as a percentage of the original average probability, provides an indication of the percentage share shift (ATE in %) in the outcome combinations caused by the change in age from the youngest age category to the oldest age category.
In this study, the model provides, for each individual, the five-variate probability of (suppressing the index for individual for presentation ease)
Additionally, for household income, we present the ATE for a change from “under $75K” to “$100K or more,” and, for the endogenous effect of e-scooter use frequency on the use purposes, we report the ATE for a change from the “infrequent” (less than once a month) category to the “weekly” category. The last of these (that is, the endogenous ATE effect) is computed as follows for any given purpose n to accommodate the jointness between use frequency and use purposes:
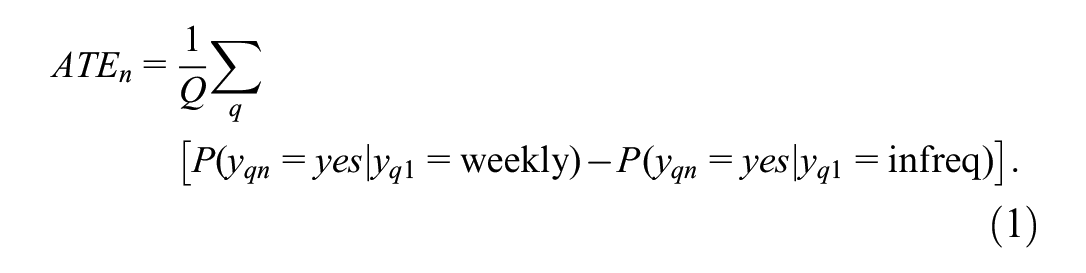
where
Q = the total sample size.
Table 5 presents the results. The ATEs for the latent constructs are included to show their effects on the outcome variables when changed from a state of low (25th percentile predicted value) to high (75th percentile predicted value). The ATEs for the exogenous variables represent net effects that combine 1) indirect effects through the latent constructs, 2) indirect effects through the use frequency endogenous outcome for the use purposes, and 3) direct effects on the outcomes. We have computed the magnitudes of these different indirect and direct ATEs of exogenous variables but are not presenting this level of detail, to keep Table 5 compact. However, we will selectively invoke the relative contributions of variables through the different indirect and direct effects when discussing ATE implications (see next section). The first numeric entry of 18.7 indicates that a shift GLP from low to high will increase weekly e-scooter use frequency by 18.7%, and the numeric entry of −10.1 (fourth row under the column of “weekly use frequency”) indicates that the weekly e-scooter use frequency of single women is, on average, –10.1% less than the weekly use frequency of single men (this reduced use frequency is the net effect of the indirect higher weekly e-scooter use frequency of women engendered by their elevated GLP and PPS, combined with the direct lower weekly e-scooter use frequency of women; in this instance, and not reported in Table 5, the indirect positive effect through GLP contributes 4.7%, the indirect positive effect through PPS contributes 29.0%, and the direct negative effect contributes 66.3%). Other ATE figures in Table 5 may be interpreted similarly.
Average Treatment Effects (ATEs)
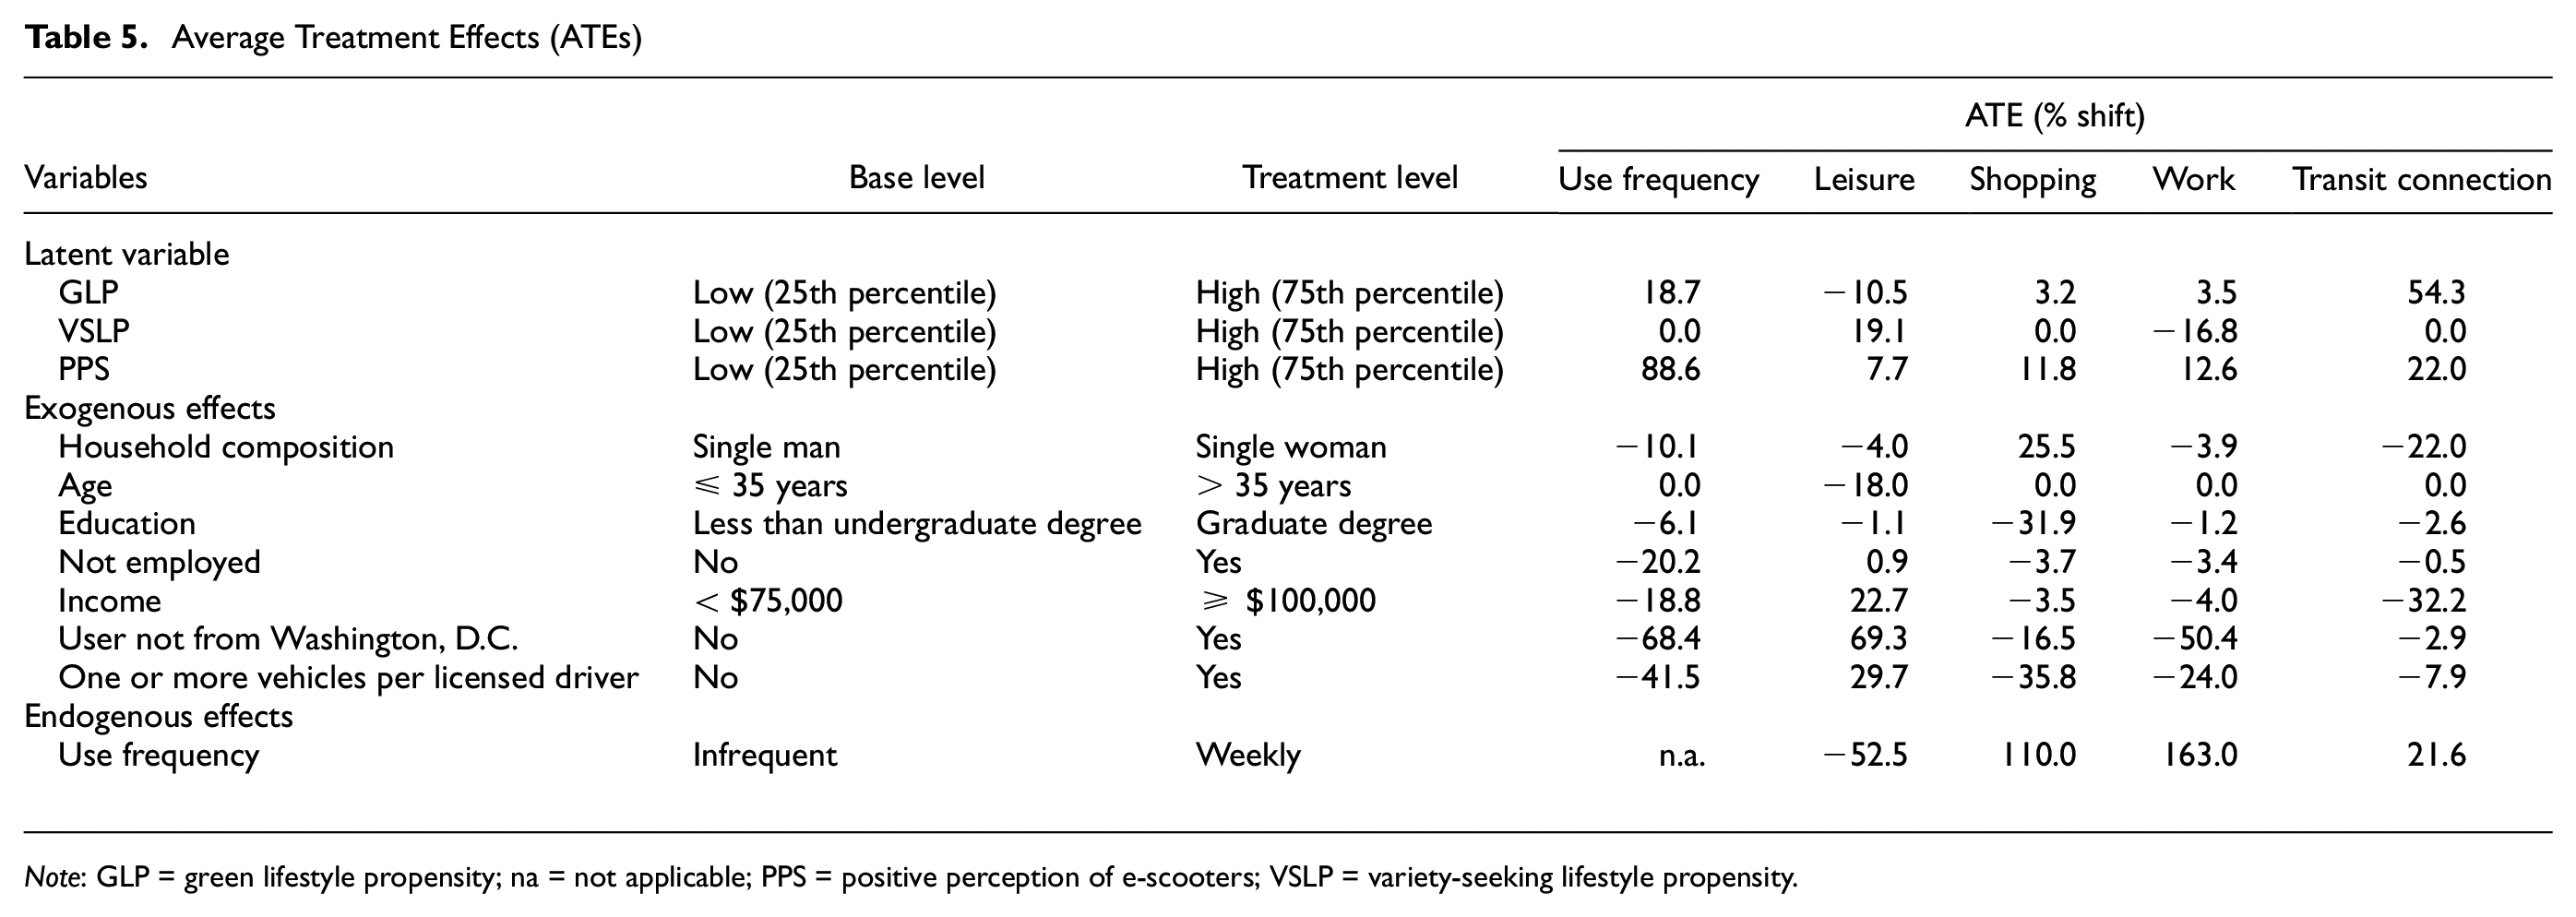
Note: GLP = green lifestyle propensity; na = not applicable; PPS = positive perception of e-scooters; VSLP = variety-seeking lifestyle propensity.
Policy Implications
The ATE results from Table 5 provide several important insights for policymaking related to promoting the use of e-scooters as an additional eco-friendly travel mode within an integrated multimodal transportation environment.
1) From an environmental perspective, GLP exerts a positive impact on overall e-scooter use frequency, particularly as a means for transit first and last-mile connectivity. Tracing back to the determinants of GLP (see Table 3), this suggests that information campaigns directed toward women, low-income individuals, and those with low vehicle ownership may be particularly effective in increasing e-scooter use. For transit connections, women are, overall, less likely to use e-scooters (see the ATE corresponding to women and transit connections in Table 5) because of a particularly strong direct negative effect (that captures 67.8% of the overall “female” effect, relative to only 10.4% of contribution through the indirect GLP effect; the rest of the “female” effect on transit connections is because of a 8.1% PPS effect and a 13.6% endogenous effect through the endogenous effect of “use frequency”). Our results indicate that bolstering the eco-friendly perception of e-scooters among women to elevate GLP may “chip away” at the general reluctance of women to use e-scooters. At the other extreme, high income individuals and those residing in households with a high ratio of vehicles to drivers generally exhibit a low GLP, contributing in part to their lower e-scooter use frequency, especially concerning transit connections (the indirect GLP effect of income on use frequency contributes 11.9% to the overall income effect on use frequency and 23.7% to the overall income effect on transit purpose use; the corresponding numbers are 4.4% and 33.2% for the motorized vehicle ownership variable). These population groups, however, are more likely to use e-scooters for leisure. Overall, increasing awareness of environmental issues and emphasizing collective responsibility, regardless of economic status, may prove effective in increasing e-scooter use for all trip purposes. The findings also highlight the role of micromobility in promoting sustainable tourism by potentially substituting leisure trips in large, motorized vehicles. This suggests an opportunity for tailored marketing initiatives aimed at encouraging eco-conscious leisure travelers to adopt e-scooters as a sustainable alternative.
2) The latent constructs of VSLP and PPS also affect e-scooter use frequency and use purpose. For instance, our results indicate the positive effect of VSLP on leisure use. Using a traceback approach from Table 3, women and those from low vehicle-availability households tend to have high VSLP (the indirect VSLP effect on leisure use for women captures 14.8% of the overall “female” effect, and the indirect VSLP effect on leisure for those from low vehicle ownership households captures 5.9% of the overall effect). These results suggest that emphasizing the novel, exciting, and adventurous aspects of e-scooter riding may increase e-scooter ridership among these groups of individuals. As such, tailoring marketing strategies to highlight these experiential elements could prove effective in diversifying and expanding the demographic reach of e-scooter users. Also, perceptions of convenience and ease of accessing e-scooters, and a sense that e-scooters are a quicker way to get around, as manifested in the PPS construct, have a particularly substantial effect on e-scooter use frequency in general, and particularly for transit connections. This suggests improving the accessibility and operation of shared e-scooter services by 1) promoting seamless integration between e-scooters and other modes of public transportation, 2) strategically placing e-scooter docking stations, and 3) continuously investing in improving e-scooter apps and technology. For transit connections, the ability to easily carry personal e-scooters in and out of buses/trains and conveniently store such equipment during the ride can also help. Moving beyond the overall PPS effects to a traceback of PPS to demographic variables (based on Table 3) provides further insights. Considerations related to personal attitudes toward e-scooters is the sole reason why highly educated individuals are generally hesitant to use e-scooters, and the sole reason for not using e-scooters for all trip purposes except shopping. Thus, understanding why highly educated individuals have a low e-scooter perceptions pertaining to convenience, ease of use, and time efficiency would be particularly valuable. The PPS-related findings also highlight that positive e-scooter perceptions play a mitigating role in offsetting the direct negative impact of gender and income on e-scooter use frequency (the indirect positive PPS effect of “female” contributes 29.0% of the overall “female” impact on use frequency, and the indirect positive PPS effect of low income contributes 14.9% of the overall low income effect on use frequency, relative to the direct negative contribution of 66.3% for the “female” variable and the direct negative effect of 73.1% for the income variable). These results reinforce the findings from earlier that, in addition to emphasizing the “green and adventurous” aspects of e-scooters, any e-scooter access and use improvements would be well positioned to particularly serve women and low-income population groups. At the same time, in totality, and as can be seen from the overall negative effects of women and low-income groups on e-scooter use frequency in Table 5, we may conclude that, while women and high-income individuals have positive views of e-scooter access and operation, these factors alone do not sufficiently outweigh other deterrent considerations.
3) Individuals who are not employed use e-scooters infrequently (with a −20.2% ATE in Table 5 corresponding to use frequency), and this is a direct 100% effect given that employment does not affect any of the latent constructs. Those not employed constitute a diverse group with many possible reasons that could discourage use among them, but the price and availability of e-scooters could be one. E-scooters are relatively costly to own compared with a bicycle for example, and shared e-scooters are also expensive. Given that retired seniors and students, especially youth, get discounts on transit passes, similar subsidized low-cost subscription plans for these users may help boost usage.
4) Our results indicate that any reduction in motorized vehicle ownership increases e-scooter use, especially so for utilitarian purposes (see the row labeled “One or more vehicles per licensed driver” in Table 5). This may be accomplished, at least in part, through mixed land-use practices; that is, by bringing origins and destinations closer to one another. Doing so also can potentially increase PPS, having an additional supplementary effect on e-scooter use by “walking the talk” that e-scooters can provide a faster way of getting around, rather than simply be a marketing “talk” with limited effect.
5) As discussed qualitatively in the Endogenous Effects section, any approach that increases use frequency will increase e-scooter use for all utilitarian trips (see the last row of Table 5). This is especially true for shopping (ATE of 110.0%) and work (ATE of 163.0%), though less so for transit connections (ATE of 21.6%). Such a transition could eventually lead to the integration of e-scooters as a “lifestyle” mode for typical day-to-day utilitarian transportation needs. Policymakers could explore ways to integrate e-scooters into the broader transportation network through coordination with public transportation systems and providing infrastructure such as dedicated lanes. Such interventions can also reduce the gender gap associated with e-scooter use frequency where women, as discussed earlier, are less likely to be frequent e-scooters users, especially for routine work trips and transit connections.
Conclusions and Implications
The results from our analysis indicate that frequent e-scooter users in Washington, D.C. are typically 1) low-income men with few cars available in their household and residing in the local area, and 2) those with a high GLP and PPS. When examining trip purposes, we note distinct and contrasting trends between hedonic (leisure/tourism-related) and utilitarian (shopping, work/appointments, and transit connections) purposes. In general, frequent e-scooter users tend to use them for utilitarian pursuits. Beyond that, there are clear groups favoring e-scooters for specific trip purposes. Those who predominantly use e-scooters for leisure are younger men, have an income exceeding $75,000, reside outside the Washington area, can easily access motorized vehicles, and exhibit less “green-ness,” desire a variety-seeking lifestyle, and have a high PPS. On the other hand, those using e-scooters for shopping tend to be single women, with educational attainment below a graduate degree, and living in households with fewer vehicles than drivers. The group using e-scooters to get to work or appointments includes those living within Washington, D.C., with low motorized vehicle sufficiency, and those exhibiting a lower preference for variety-seeking. Lastly, middle-income men with high GLP and PPS represent the population segment most likely to utilize e-scooters for transit connections, confirming e-scooters’ role in overcoming barriers to access public transportation in U.S. cities among individuals with a high propensity to adopt non-car alternatives.
We provide policy insights based on the ATEs from our study. These insights are related to use frequency and integration, perceptions and marketing, environmental considerations, equity and accessibility, and mixed land-use practices. In summary, urban transportation policies should prioritize increasing e-scooter use frequency for utilitarian trips, particularly work and appointments, through integration with public transportation. Tailored marketing emphasizing convenience and time efficiency can diversify user demographics, addressing potential gender disparities. Environmental considerations positively influence e-scooter use, offering opportunities for sustainable tourism. Policymakers could implement subsidy programs to enhance mobility for low-income individuals and collaborate with communities to ensure equitable access. Finally, recognizing the significance of mixed land-use practices is crucial for promoting micromobility and reducing household motorized vehicular ownership. Overall, our findings highlight the importance of inclusive urban planning focused on creating a sustainable, accessible, and diverse transportation system.
Future research needs to use larger samples so that the interaction effects of variables can be further investigated. Also, it would be helpful to use cardinal measures of use frequency, rather than ordinal measures that have been used so far in the literature. Extending our analysis of trip purposes from a binary of whether or not e-scooters are used for each of several trip purposes to the case of cardinality in the use of e-scooters for each purpose would provide a substantially improved picture of e-scooter uptake and use. Additionally, extending the study to other U.S. cities and other countries (as planned in future stages of this research) will make it possible to evaluate whether the relationships identified in this study hold also in different cultural and geographic contexts, and if heterogeneous patterns arise across locations.
Finally, the transferability of these results to other modes of micromobility needs to be evaluated. While findings on e-scooters are often compared with bike-sharing, another popular micromobility mode, several recent studies have highlighted differences in bike-sharing frequency, use purposes, and the effects of demographic variables on these aspects vis-a-vis e-scooters. Given these differences, we discourage applying insights from our study to bike-sharing, as is. Future joint investigations of both these modes will make for a good addition to our understanding of micromobility usage.
Footnotes
Acknowledgements
The authors thank Leah Lazer of the New Urban Mobility Alliance (NUMO) of World Resources Institute (WRI) for her help in collecting the data in partnership with private shared e-scooter providers, namely Bird, Helbiz, Lime, Lyft, Razor, and Spin. We are also grateful to Kailai Wang and Xiaodong Qian for their help with the data collection.
Author Contributions
The authors confirm contribution to the paper as follows: study conception and design: A. Kothawala, A. Haddad, B. Ozbilen, C. Bhat, G. Circella, C. Saridakis, Z. Wadud, Y. Yang, S. Grant-Muller, S. Castellanos; data collection: A. Kothawala, A. Haddad, B. Ozbilen, C. Bhat, G. Circella, C. Saridakis, Z. Wadud, Y. Yang, S. Grant-Muller, S. Castellanos; analysis and interpretation of results: A. Kothawala, A. Haddad, B. Ozbilen, C. Bhat, G. Circella, C. Saridakis, Z. Wadud, Y. Yang, S. Grant-Muller, S. Castellanos; draft manuscript preparation: A. Kothawala, A. Haddad, B. Ozbilen, C. Bhat, G. Circella, C. Saridakis, Z. Wadud, Y. Yang, S. Grant-Muller, S. Castellanos. All authors reviewed the results and approved the final version of the manuscript.
Declaration of Conflicting Interests
The author(s) declared no potential conflicts of interest with respect to the research, authorship, and/or publication of this article.
Funding
The author(s) disclosed receipt of the following financial support for the research, authorship, and/or publication of this article: This research was made possible by a grant from the New Urban Mobility Alliance (NUMO) of World Resources Institute (WRI) (Grant No. RAL22-0). Additional financial support for the research was provided by the 3 Revolutions Future Mobility Program at UC Davis, and by the U.S. Department of Transportation through the Center for Understanding Future Travel Behavior and Demand (TBD) (Grant No. 69A3552344815 and No. 69A3552348320).