



Abstract
The in-place density of asphalt pavements is a key indicator of construction quality, durability, and long-term performance. Differential thermal readings—also known as thermal segregation—and lack of uniformity in mat temperature were identified as key factors in achieving target densities. A protocol was developed in this study to identify and quantify temperature differentials using an unmanned aerial vehicle (UAV) equipped with a thermal sensor. Eight sites were visited to gather thermal data of paving construction ranging from 0 min up to 60 min after the pavement has been placed. A custom-developed Python script was developed to quantify temperature differentials and analyze the data in three sections: 1) identifying and visually quantifying thermal differentials, 2) detecting the non-uniform mat temperatures such as locally segregated spots, and 3) analyzing the cooling pattern of different sites as a function of time. Validation metrics such as the Gini index, percent of non-uniformity, and coefficient of variation were computed in discussing each of the sites’ thermal profiles. The UAV system not only provided the ability to increase spatial coverage but also gave the option to monitor the sublots within the window of compaction. These features were not possible with the existing thermal scanning products. Various temperature anomalies were identified and quantified in the sites visited, including local segregated spots, longitudinal center of lane streaks associated with gearbox and/or chain case segregation, and V-shaped pattern of cold spots indicator of paver stop-and-go operation.
Keywords
The in-place density of asphalt pavements is a key indicator of construction quality, durability, and long-term performance. Proper compaction improves in-place density, which in turn improves durability and extends pavement service life ( 1 ). Many state agencies in the U.S. have included in-place density as one of their criteria in quality assurance and acceptance protocols. For example, the California Department of Transportation revised its pay factor by examining air voids and providing incentives and disincentives based on a statistical analysis of quality assurance/quality control (QA/QC) results ( 2 ). The mat temperature of asphalt concrete (AC) and its uniformity are considered to be key factors in achieving in-place density. Differential thermal readings—also known as thermal segregation—and lack of uniformity in mat temperature were identified as key factors in achieving target densities. Non-destructive testing (NDT) techniques such as real-time infrared imaging (e.g., the PAVE-IR technology) for generating a temperature profile that identifies non-uniform temperatures are being proactively employed in QA/QC protocols ( 3 , 4 ). In this article, we present the development of an automated thermal performance monitoring protocol using a UAV equipped with an infrared camera. The developed protocol provides a distinctive platform to monitor non-uniform patterns such as thermally segregated areas and temperature differentials over wide paving areas.
Thermal segregation is considered as temperature differentials in the asphalt mixture as it is placed and it has the potential to cause premature failure in the pavement ( 5 ). Segregation can occur as a result of a single cause or a combination of variables such as material stockpiling and handling, as well as mixing, storage, shipping, and placing of the asphalt mixture. The chief detrimental effects of segregation on AC performance are reduced fatigue life, increased rutting, raveling, and moisture susceptibility causing a severe reduction in pavement life ( 4 ). Mahoney et al. evaluated different factors that can cause segregation and additionally used a thermal imaging camera to gather the temperature data of the construction job ( 6 ). Considering thermal imaging as one of the NDTs, recent developments have been made to monitor real-time mat temperature which was commercialized as PAVE-IR in 2009. PAVE-IR is a paver-mounted scanner with equidistant infrared sensors that give the mat temperature along the paving direction as the paver progresses ( 3 ). Subsequently, Texas Department of Transportation (TxDOT) has made attempts to implement PAVE-IR in their construction jobs to supplement their quality assessments ( 7 ).
UAVs—also known as drones—have become an increasingly valuable tool in the construction and civil engineering industries. Equipped with a variety of sensors, UAVs have extended the capabilities of non-destructive inspection techniques for quality assessment in construction works. Automated protocols were developed for civil engineering inspections, such as bridge inspections and building inspections, with the assistance of UAVs ( 8 ). These UAV inspections, aided by advanced computing techniques and computer vision, have shown various benefits including lower cost, immediacy, instant measurement, and the capacity to build a 3D model with a sufficient degree of clarity and dependability for a diagnostic procedure ( 9 ). In the paving industry, UAVs have been used to acquire high-resolution imagery of roads and highways, providing means for more effective maintenance planning. Furthermore, the application of photogrammetry for crack detection has expanded the use of UAVs for pavement condition evaluation ( 10 ).
During the placing and compaction of AC pavements, non-uniform cooling patterns can hinder uniform compaction, and can remain undetected even with rigorous quality assurance protocols collecting density data using cores. Thus, knowledge of temperature data from the pavement mat during paving is essential for achieving uniform target densities. Non-uniform cooling patterns may include locally segregated thermal spots or be between different sections of the mat. Thermal imaging sensors mounted behind the paver may provide some insights into thermal performance, but only for a confined and limited area behind the paver. However, they cannot provide data to capture pavement cooling patterns throughout time. In contrast, coupling UAVs with thermal imaging technology can enhance spatial and temporal coverage of scans to provide thermal data on the entire construction operation over a wider area throughout the time of compaction. The UAVs equipped with thermal sensors can be beneficial to address these challenges. Therefore, there is a need to test the UAV technology and develop a protocol to fully harness its potential.
In this paper, we present the development of an automated surveying protocol for overlay paving operations to monitor temperature differentials and cooling patterns. A thermal-camera-mounted UAV was used to monitor various construction projects to collect data and identify temperature patterns. Even though the protocol used is not capable of providing real-time feedback to the construction crew, it has the potential to do so and to take corrective actions once a temperature anomaly is identified. The following sections of the paper introduce the theoretical background on segregation, UAV, and thermal imaging techniques. The protocol employed in planning, data collection, and analysis are later discussed, along with the challenges in implementing these procedures. Temperature uniformity and segregation risk of eight sites visited during the spring and summer seasons were presented with distinct thermal signatures from each site. Various parameters, including paving crew, rolling patterns, lift thickness, and mix designs, were considered for interpretation of the cooling patterns for each site.
Objectives and Scope
The goal of this paper is to develop an automated protocol to identify non-uniform cooling patterns and temperature differentials using UAVs. The major research question that was explored in this paper is whether thermal images of good resolution obtained with UAVs can be used to detect thermal non-uniformities for the entire mat during construction. The following are the specific research objectives:
Develop a thermal signature profile of the paved mat to detect non-uniform cooling patterns and anomalies that include locally segregated spots using an automated protocol.
Analyze the cooldown process using the developed protocol aided by a manual observation of the construction process.
Understand the limitations of the temperature measurement unit mounted on the UAV and its sensitivity to various external factors.
This pilot study includes data capture from eight different paving jobs in various cities around the Phoenix, Arizona, metropolitan area in the U.S. The scope of this study mainly focuses on developing a standard protocol for identifying and quantifying thermal differentials.
Background
Segregation and Compaction
Stroup-Gardiner defined segregation as “a lack of homogeneity in the hot mix asphalt constituents of the in-place mat of such a magnitude that there is a reasonable expectation of accelerated pavement distresses” ( 11 ). Segregation can occur during aggregate stockpiling and handling, as well as AC mixing, storage, shipping, and paving. The two major kinds of segregation are known as “gradation” segregation and “thermal” segregation. When a material is not properly mixed or cooled down during transportation, the coarse aggregate will cool down faster than the fine aggregate ( 4 ). This non-uniform cooling is one of the key factors in causing temperature differentials over the asphalt mat, known as thermal segregation ( 1 , 3 ). Thermal non-uniformity may lead to challenges in the compaction of the pavement mat to achieve desirable air voids and density. The developed roller patterns based on the general mat temperature may not be adequate to compact these cooler regions before they cool down to the cessation temperature, leading to isolated areas with poor density ( 4 , 12 ).
Non-Destructive Inspection for Segregation
The application of the first use of thermal imaging as a non-destructive inspection technique for segregation detection can be dated back to 1996 ( 4 ). Washington State DOT (WSDOT) started using the infrared camera, identifying, as they observed, a correlation between thermal differentials with density profiles. Infrared imaging aided Willoughby’s group in identifying the persistent temperature differential problem experienced by WSDOT ( 13 ). In 2002, a correlation between large temperature differentials and substantial density differentials was reported by the same group ( 14 ). Thermal imaging was also used to monitor the uniformity of mat temperatures and reduce temperature differentials that can affect the quality of constructed pavements ( 11 ). Henault and Larsen utilized portable handheld thermal cameras for their study on assessing pavement performances ( 15 ). Thermal cameras aided them in locating the cold spots and their corresponding normal regions. Although several DOTs have begun to employ thermal cameras, they were still utilizing handheld cameras until a prototype of an infrared sensor bar with six infrared sensors was fitted behind a paver to obtain real-time thermal profiles ( 16 ). This was the first application of collecting real-time temperature data to identify thermal differentials.
Real-time pavement temperature monitoring technology enables the recording of mat temperatures during paving. Such a thermal scanning technology was commercialized as PAVE-IR to be mounted on top of the paver ( 3 ). The application of PAVE-IR by TxDOT has led to improvement in AC placement and compaction ( 17 ). The temperature data gathered in real-time led to the uncovering of significant thermal variations during operations in 2005. This issue was addressed by utilizing material transfer vehicles (MTV) and modifying the rolling patterns. Furthermore, utilization of PAVE-IR on eight construction sites by TxDOT showed a maximum temperature differential of 25°F, leading to the conclusion that many projects may exhibit some level of thermal segregation but not affect the compacted state of AC pavements and performance. However, PAVE-IR temperature data can be influenced by paver delays, as the location of the sensor is fixed and has limited coverage of pavement construction ( 18 ).
Overview of UAV Applications in the Construction Industry
UAVs have become increasingly popular in recent years because of their versatility and wide range of applications ( 19 ). The use of UAVs was highlighted by the Federal Highway Administration (FHWA)’s Every Day Counts (EDC)-5 Program for 2019–2020 ( 20 ). The ability of UAVs to carry various types of sensor as part of their payload allows the collection of data and execution activities that would otherwise be difficult or impossible ( 21 ). UAVs have been used to collect high-resolution imagery and data to assess the condition of roads and highways and aid in planning maintenance and repair works more efficiently. Mogawer and Xie conducted a literature assessment of current studies related to pavement condition analysis using unmanned aerial systems in FHWA-funded research work and led a pilot study to evaluate the usefulness of employing UAV for pavement condition analysis ( 10 ). Recently, in 2023, researchers ascertained that UAVs equipped with infrared imaging sensors can present a rapid and accurate means of identifying low-temperature areas across an entire pavement surface ( 22 ). By using the low-altitude flight capabilities of UAVs, it was shown that it is possible to effectively monitor temperature differences during the paving stage. These improvements in UAV technology have enabled researchers to properly monitor the paving process, bringing significant insights to the paving industry.
Equipment and Methodology
Equipment
Within the scope of this study, a Matrice 300 RTK by Dà-Jiāng Innovations (DJI) was used. The UAV has a maximum flight time of 55 min per battery set and the capability of carrying three payloads (attachment modules) at the same time. The UAV was equipped with an H20N thermal camera by DJI as the payload to capture the temperature data. The thermal camera is equipped with two 640 × 512 thermal sensors of 2x and 8x optical zooming capabilities and up to 32x digital zooming. This camera takes in energy readings and encodes them into pixel data with a customized saving configuration called Radiometric JPG (rJPG) images. Temperature data was accessed using DJI Thermal Analysis Software v3.0 which gives temperature readings of these rJPG images by adjusting humidity, height, emissivity, and reflected temperature as user inputs in the software. The UAV’s flight time is limited to ∼39 min per battery set with the payload. Four different sets of batteries were used for every site visit in this study. The configuration is shown in Figure 1.
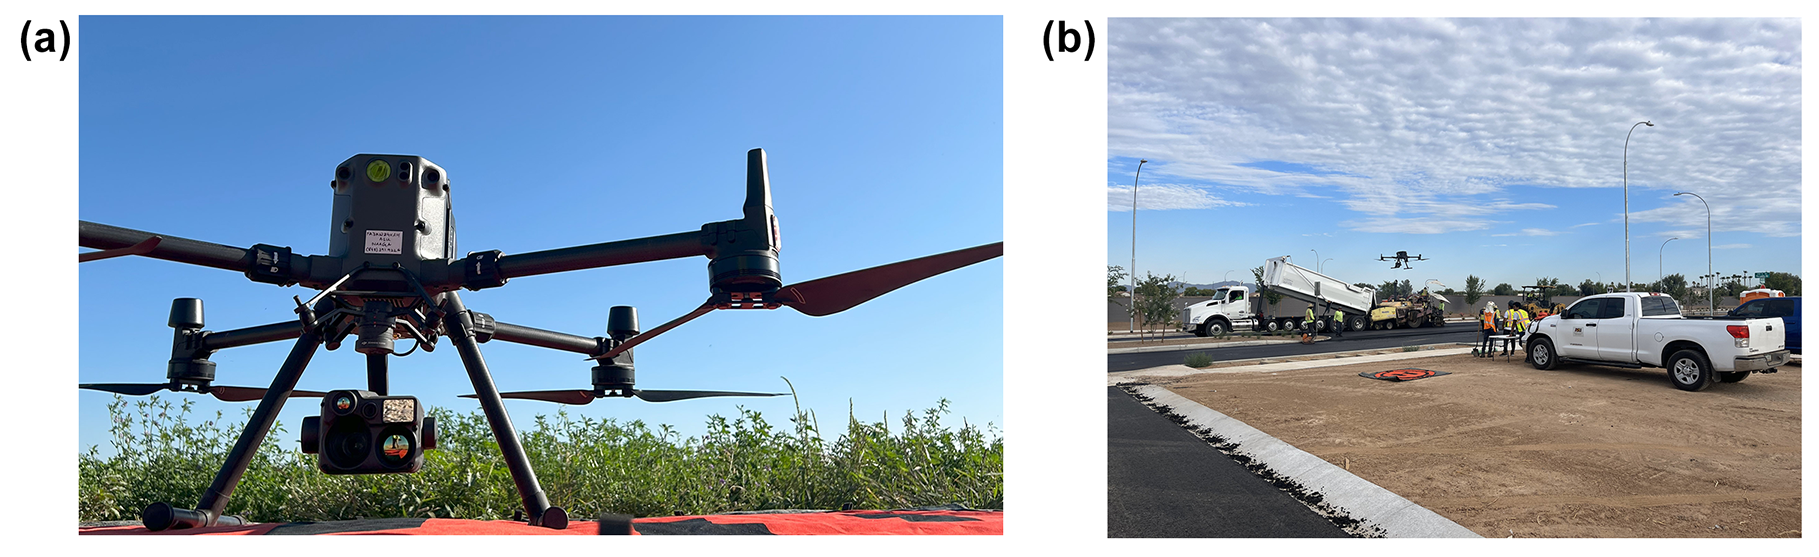
Unmanned aerial vehicle (UAV) used in the study: (a) image of the UAV DJI M300 with H20N sensor, and (b) UAV in flight at one of the construction sites visited.
Site Selection and Paving Jobs
Eight paving job sites were visited for data gathering, as marked on the map in Figure 2. The mixes were Marshall mixes produced by the same producer for all of the sites. Two different paving contractors completed the jobs in which six out of these eight sites had the same paving crew. The sites were randomly selected based on the mix design and airspace clearances. The mix designs include 3/4 in. nominal maximum aggregate size (NMAS) (for two sites) used as a base course and 1/2 in. NMAS for the remaining sites for surface layers produced according to the local agency specifications. The details for each site and paving operation are provided in Table 1.
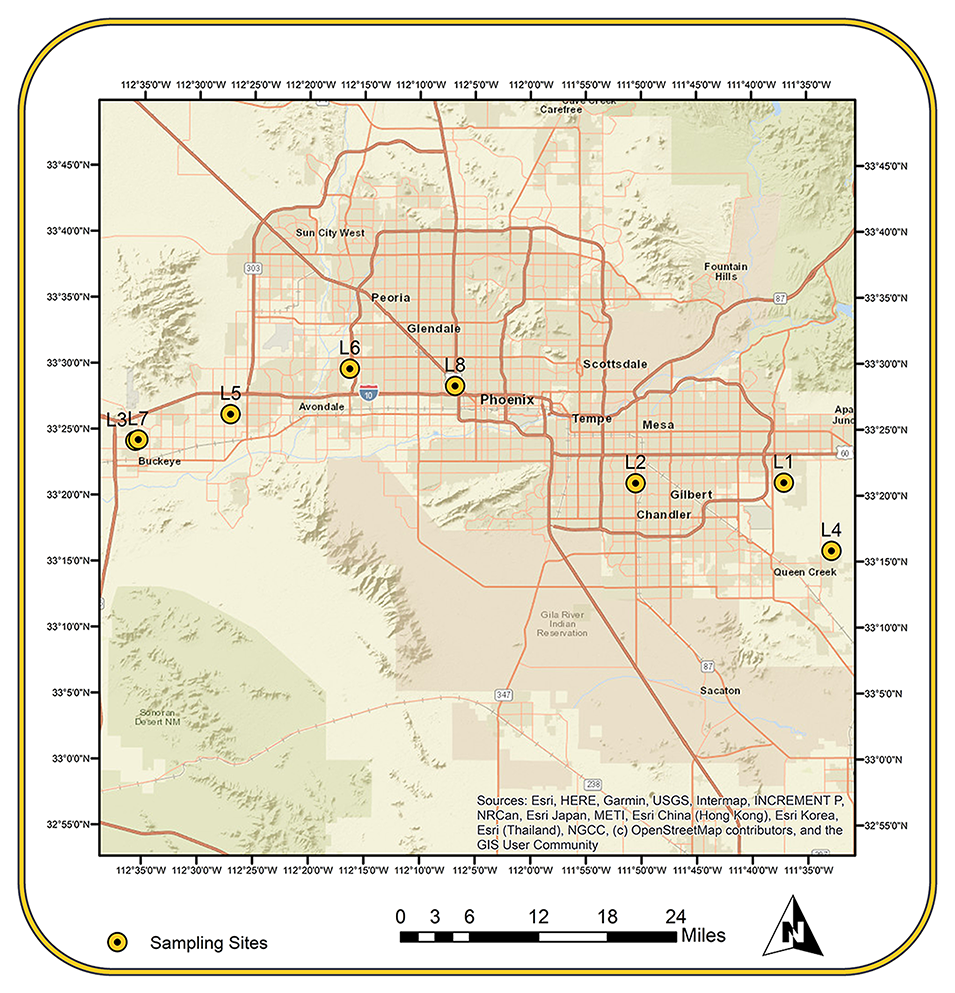
Map of the construction sites visited.
Job Site Pavement, Mixture Information, and Environmental Conditions
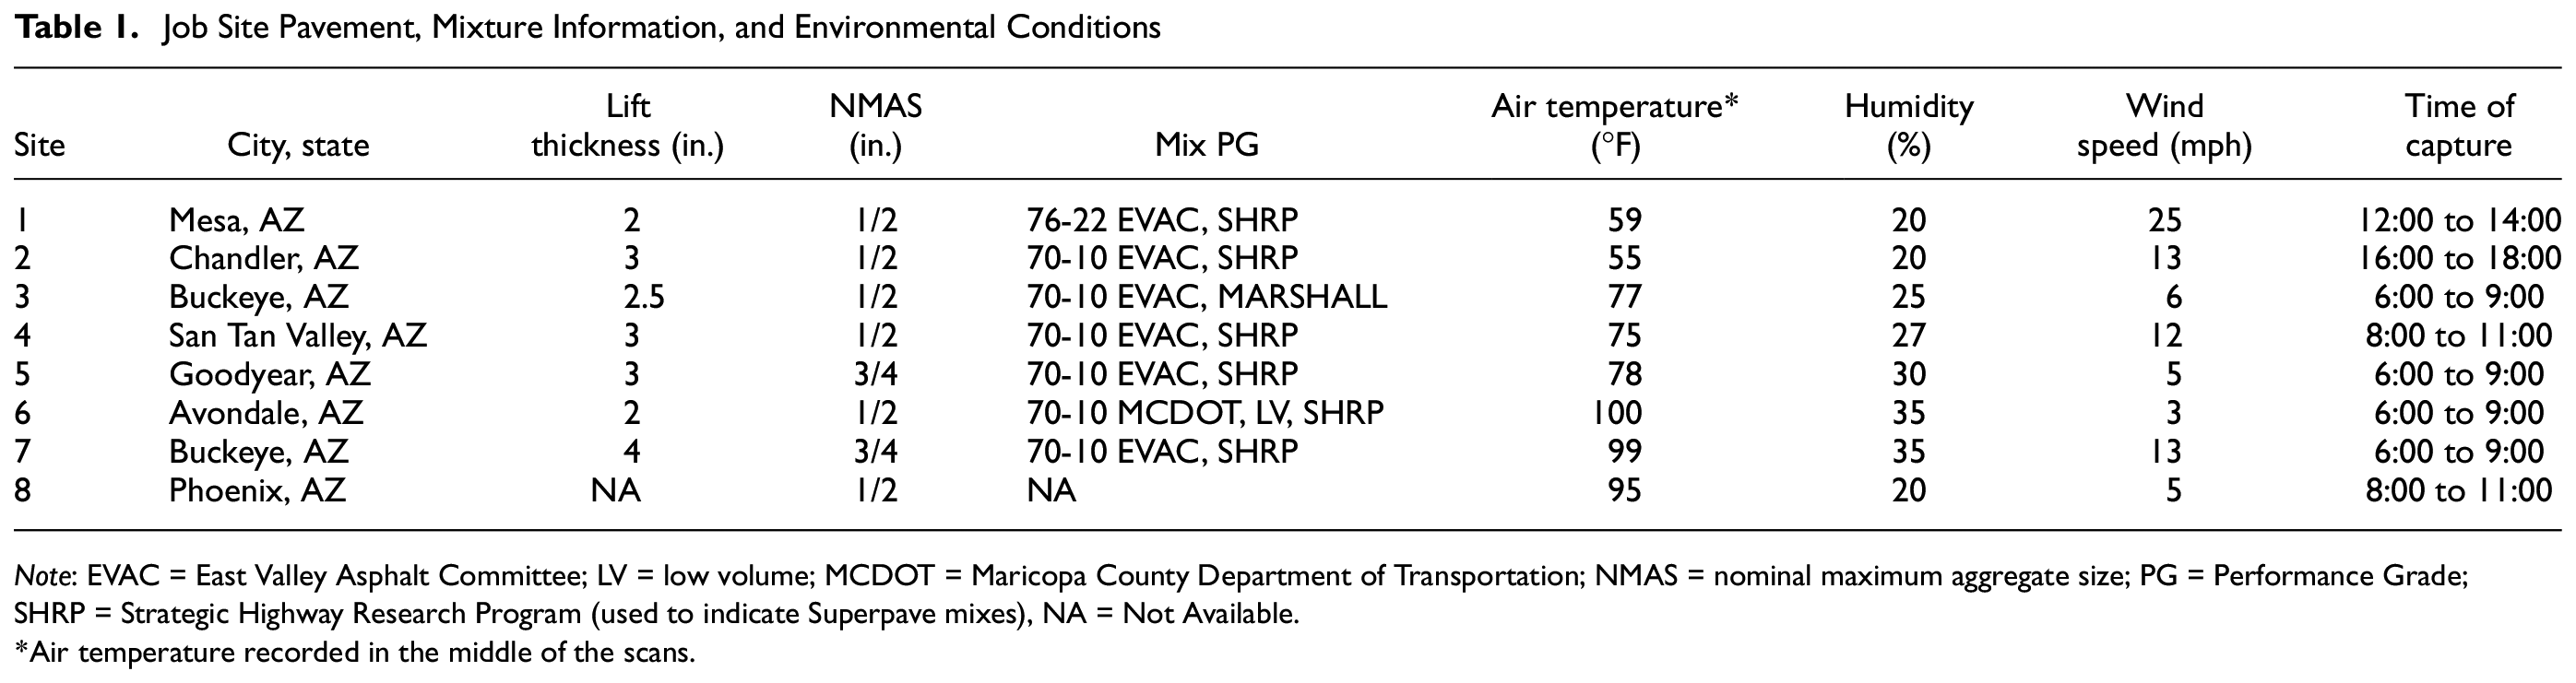
Note: EVAC = East Valley Asphalt Committee; LV = low volume; MCDOT = Maricopa County Department of Transportation; NMAS = nominal maximum aggregate size; PG = Performance Grade; SHRP = Strategic Highway Research Program (used to indicate Superpave mixes), NA = Not Available.
Air temperature recorded in the middle of the scans.
Data collection for seven out of eight sites involved flying the UAV for eight passes at different times from 0 to 60 min. Approximately 360 images were collected, and 25 images were taken for analysis from each site. A preliminary temperature validation analysis was performed at the last site. In addition to the thermal images, preliminary nuclear gauge readings were collected at Site #7 to seek a correlation between thermal anomalies and measured density. Nuclear gauge readings were collected at the spots identified with the UAV images. Because of limited attempts of using external temperature data collection and nuclear gauge reading, they are not included in the paper.
Thermal Imaging Survey Protocol
A protocol was developed to collect thermal images and analyze them for thermal performance and segregation analysis. The data collection spanned from April through June, so the time window for data collection was kept around 6 to 11 a.m. from the third site onwards to avoid the sun’s radiation influence on the readings. However, for the first two sites, the paving operation was delayed, thus pushing our data collection to be in the noon. Since the flight plan is automated along a fixed path for every site, the UAV was restricted by the application to a ground sampling distance of 1.25 in./pixel with a flight altitude of 100 ft (∼30 m). The analysis software, however, can take only a maximum value of 82 ft (∼25 m) while processing the images. The emissivity was assumed to be constant and 0.95 and the reflected temperature is set to 77°F (∼25°C) in the thermal analysis software.
Referring to the study by Entrop and Vasnev, the following protocol was developed ( 23 ). The sampling protocol developed to collect images for thermal performance analysis of each site is illustrated in Figure 3. Sampled thermal data from each image are plotted as a thermal heatmap matrix in Python, as shown in Figure 4. Representative thermal and aerial images collected from each site can be seen in Figure 5.
Preliminary Planning
Confirming the site location and acquiring airspace authorization if needed.
Creating a flight plan on the DJI Pilot application and checking Maps for base station setup.
Monitoring weather forecast and a pre-plan visit to the job site 24 h ahead.
Thermal Data Sampling and Other Supporting Data
A safe UAV launching location was determined to provide a sufficient distance from the paving crew and traffic.
Setting up the base station and marking the site at 50 ft intervals.
Identifying the main data collection lot for each site with a 200 ft length of the pavement section with ground marks at every 50 ft interval starting from 0 through 200 ft. The ground marks allowed the matching of the RGB images with the corresponding thermal images which were identified for further analysis.
Clearing the storage card and performing a test flight to check the images before the flight.
Adjusting the flight plan if needed and collecting thermal and RGB image data for the 200 ft lot in eight passes at different times—before paving, just after paving, and 5, 10, 15, 30, 45, and 60 min after paving, denoted as NP, 00M, 05M, 10M, 15M, 30M, 45M, and 60M passes, respectively.
Measuring the mat temperature in selected sites for calibrating the data obtained from the UAV.
Measuring mat density using nuclear gauges in selected sites
Data Processing and Interpretation
Referring to the RGB images, respective thermal images were selected with the help of 0–50, 50–100, 100–150, and 150–200 ft markers for each of the eight passes, making a total of 32 images.
The temperature values were obtained by adjusting the humidity for that day in analysis software.
For each of these 32 images, seven horizontal strips in the transverse direction of pavement are marked which are ∼7 ft apart and, for each horizontal strip, 13 points (one at the center of the lane, six points to the left, and six points to the right) are plotted to get the temperature values at these points, as shown in Figure 3b.
These temperature data points were then imported into a custom-designed notebook script written in Python language. The Python file includes commands for data extraction, cleaning, processing, visualization, and analysis which is repeated over all 50 ft images on all the sites.

Unmanned aerial vehicle (UAV)-assisted thermal scanning protocol: (a) UAV covering 200 ft lot behind the paver and (b) analysis image with seven horizontal strips and 13 data points for each 50 ft sublot image per site.

Typical thermal data processed in a sublot.
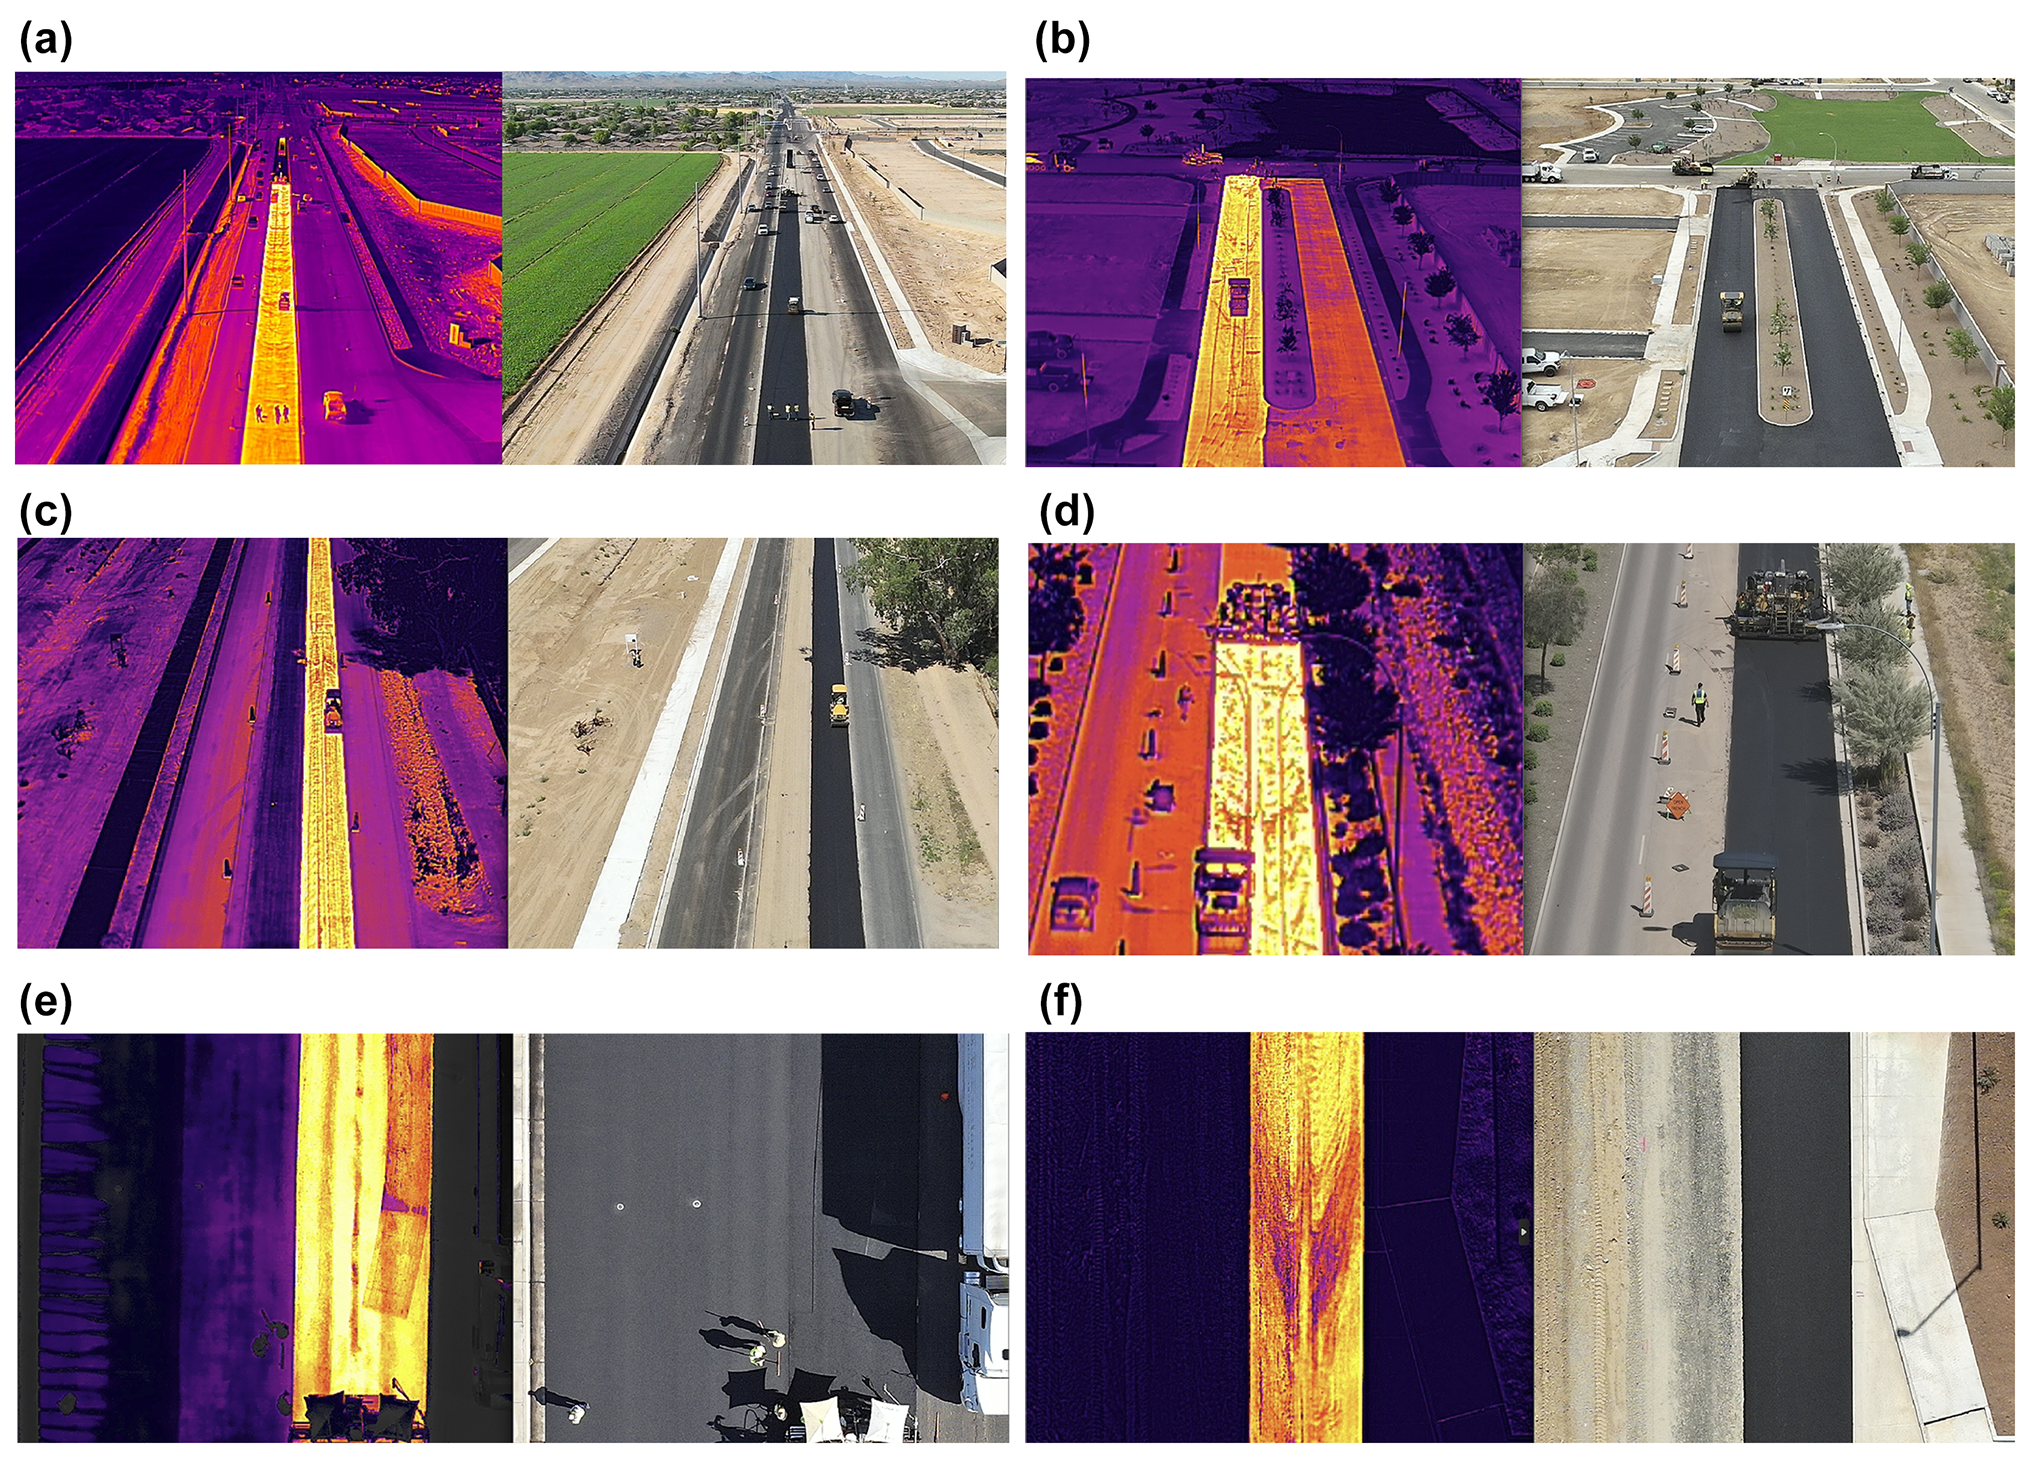
Thermal images (left) and RGB images (right) of the construction operation: (a) aerial image of 1/2 in. overlay in Mesa, (b) aerial image of 3/4 in. overlay in Santan Valley, (c) aerial image of 1/2 in. overlay in Buckeye, (d) aerial image of 3/4 in. overlay in Buckeye, (e) bird’s eye image of 1/2 in. overlay in Chandler, and (f) bird’s eye image of 1/2 in. overlay in Goodyear.
Analysis Methods and Discussion of Results
Three different analysis methods were developed and applied to the images collected from each site as follows:
Segregation Analysis: Calculation of temperature differentials between neighbor points in the grid to identify potentially segregated local spots.
Thermal Non-Uniformity Detection: Identification of temperature non-uniformities over larger areas of the mat that may affect compaction and achieving density at the mat uniformly.
Cool-Down Trends Analysis: Monitoring the time history of the mat at each grid location to gather trends of mat cool-down.
Segregation Analysis
Based on the sampling protocol introduced in the previous section, temperature data at the grid points was analyzed to identify potentially segregating spots in each sublot at the pre-defined time intervals. For example, the mat temperature in the first sublot of Site #1 (0 to 50 ft) after 15 min of paving is shown in Figure 6 (top). The temperature in the sublot varies between a minimum temperature of 149.7°F to a maximum temperature of 238.6°F. Based on the temperature variations over the mat, this can be considered as a significant variability between the strips that are approximately 7 ft apart.

An example of the thermal data analysis of Site #1: temperature grid in the 0–50 ft sublot after 15 min of paving (top); zoomed-in 3 × 3 area with segregation potential at middle three strips toward the left (bottom left); temperature differentials (bottom right).
However, the analysis needs to zoom in on the areas to compare immediate neighboring cells in each strip to identify locally segregated spots. Figure 6 (bottom left) shows one of those zoomed-in sections with nine temperature readings. Temperature differentials were calculated between the neighboring cells around its perimeter. An algorithm was developed to find the maximum differential between these neighboring cells and print the result, as shown in Figure 6 (bottom right). In this case, there are two cells found to have more than 50°F between any two neighboring cells. These cells can be identified as potentially segregated local spots with regard to the time of the measurements. This procedure has been automated for all eight passes at all four 50 ft interval sections and for all sites, allowing us to automatically detect potentially locally segregated spots and monitor the differentials for 1 h while compaction is taking place. One of the limitations of the analysis is the granularity of the temperature data used by dividing the sublot into seven strips and 13 cells. The resolution can be increased by increasing the number of strips per sublot with the features of the software to identify locally segregated spots with a lot more accuracy. This is part of ongoing work.
The above procedure is repeated over the entire mat for all four 50 ft images (or sublots) at all times up to 60 min after paving, and it identified temperature differentials getting dissipated over time. For example, temperature differentials in Site #4 are plotted according to this procedure. In both Figure 7, a and b , temperature differentials were observed on the top of the image when the mat was just placed. However, differentials started to fade after 15 min. The mat temperature became relatively uniform at 60 min in Site #4. However, the temperature differentials recorded in Site #5 persisted throughout the 1 h window measurements, and roller operations were completed as shown in Figure 7, c and d . The mixes used in Sites #4 and #5 were 1/2 and 3/4 NMAS, respectively. The patterns observed can be attributed to mixture type, lift thickness, and air temperatures. The air temperature was over 100°F during the operation of paving on both sides. Compaction and a slower rate of cooling could have played a role in correcting the temperature differentials to a certain degree with the lower NMAS mix.

Temperature differential grids in degrees Fahrenheit as a function of time: (a) Site #4: 0 to 50 ft, (b) Site #4: 50 to 100 ft, (c) Site #5: 0 to 50 ft, and (d) Site #5: 150 to 200 ft.
In 2009, NCHRP proposed different severity for temperature differentials ( 11 ). A similar approach was suggested in the specifications of TxDOT ( 24 ). Based on this, temperature differentials <25°F are designated 0 severity of segregation, severity level 1 was assigned to the differentials between 25°F and 35°F, severity level 2 to differentials between 35°F and 45°F, and severity level 3 to differentials >45°F. The Gini index computation was used to indicate the percentage of inequality in the temperature differentials of these three levels. The Gini index computation was limited to thermal differentials tracked initially and how they diminished over time or not. The higher percentage of the Gini index for level 3 implies a higher severity of segregation. Also, the percentage of non-uniformity was calculated as a sum of non-uniformities divided by the total data points and plotted as a function of time for all the sites, as shown in Figure 8. The percent of non-uniformity indicates thermal differential points tracked from the start and any new differentials that might pop up in between.
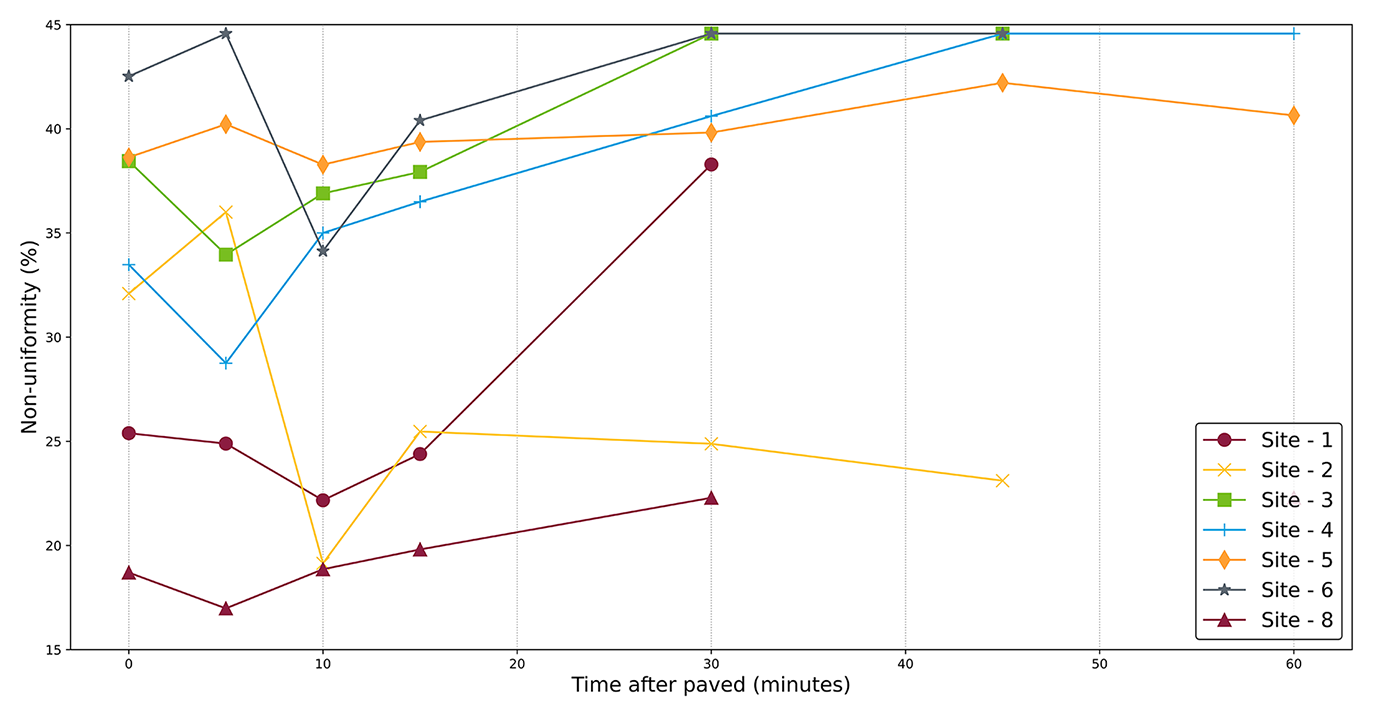
Non-uniformity percentage as a function of time for all the sites.
Another representation of these coefficients is tracking the total percentage of non-uniformity over different sites as a function of time, which is shown in Figure 9. It indicates that, except for Sites #1 and #5, the total non-uniformity in differentials gradually decreased within 60 min after placement. It is also important to note the decomposition of segregation risk into different categories. A greater percentage of higher severity segregation (temperature differentials greater than 45°F) is observed particularly in Sites #1 and #2. Lowest air temperature and high wind speeds were recorded during the operation in Site #1. In Site #2, the center of the lane longitudinal temperature differential streak—also known as gearbox and/or chain case segregation—was observed. A detailed analysis of Site #2 is provided next.
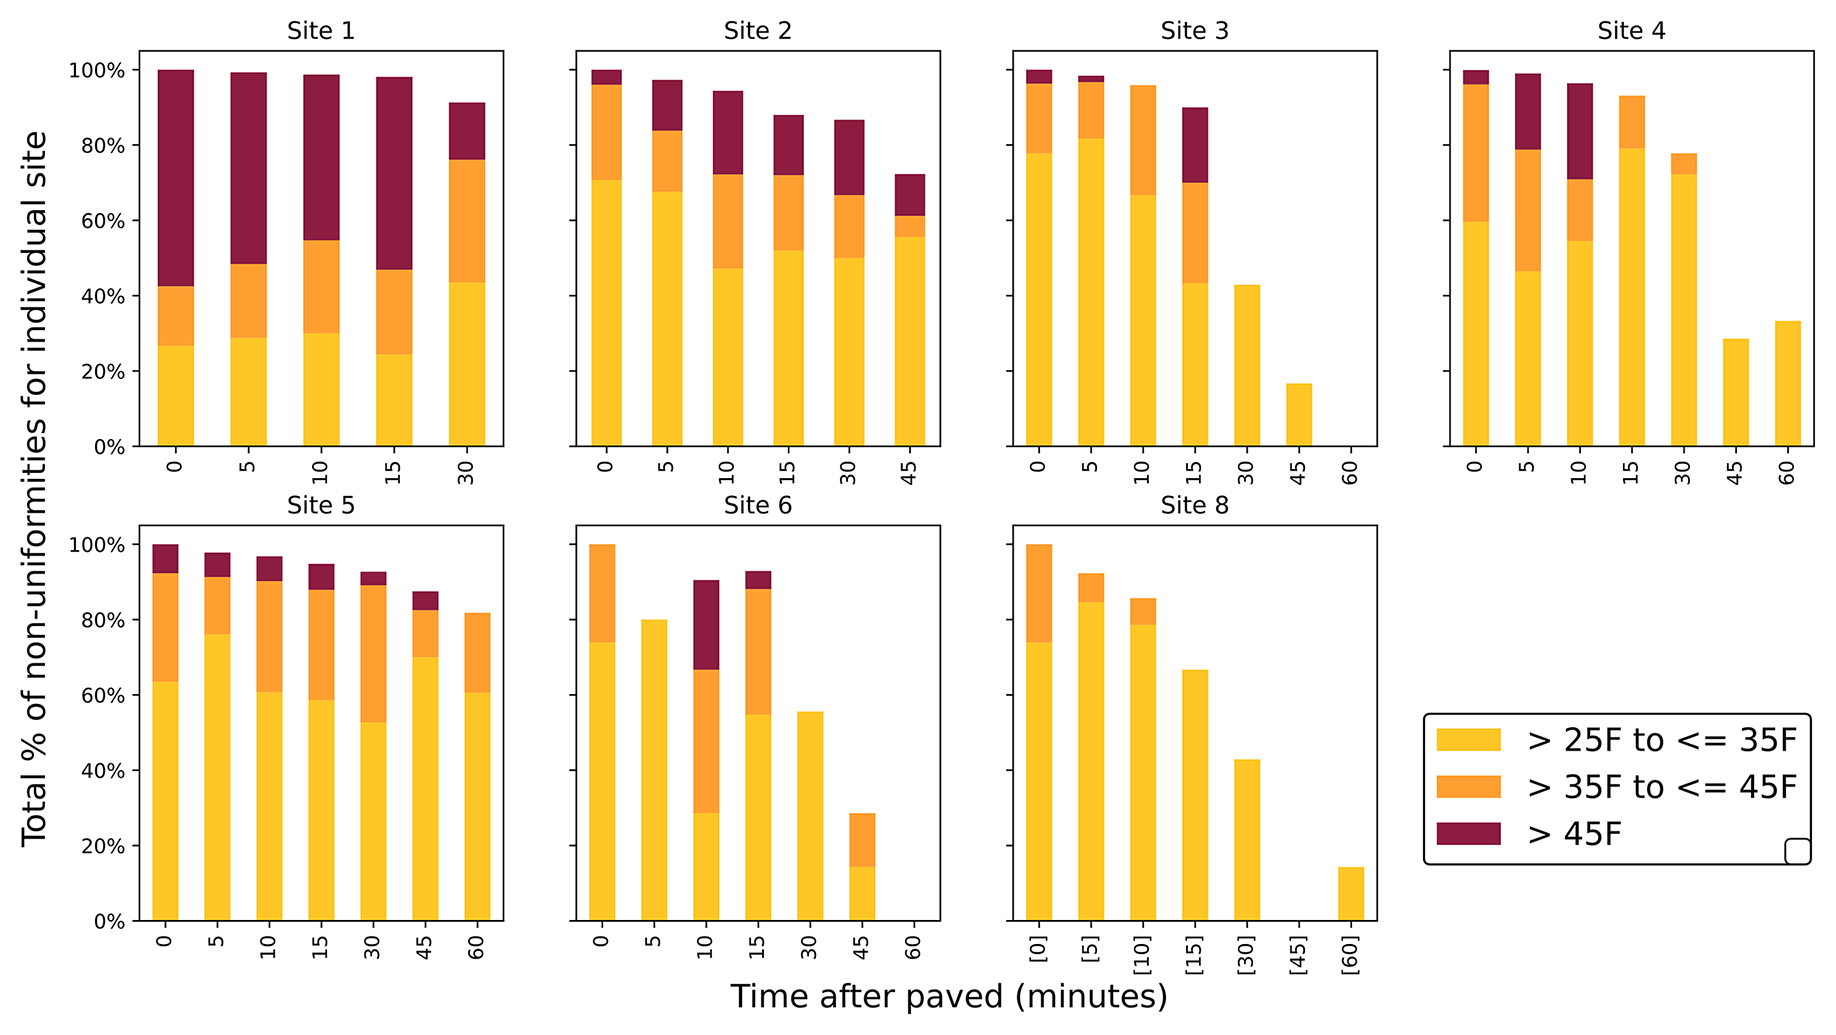
Total percentage of non-uniformity tracked over the time of compaction within a 1 h window for all the eight sites.
This protocol was applied to one of the commonly observed temperature anomalies causing top-down cracking in asphalt pavements. Mechanistic aspects of top-down cracking related to truck traffic loading are well studied in the literature ( 25 – 27 ). Such longitudinal cracks were also associated with construction aspects of paving operation resulting in segregated spots vulnerable to cracking ( 25 ). Figure 10 illustrates one of those cases where longitudinal temperature differentials were observed. A longitudinal streak of lines was observed in the pavement immediately after it was paved at Site #2. The temperature differentials between the hottest and coldest located streaks (on either side of the center lane) were consistently around 30°F. The center of the lane segregation is most likely to be caused by poor mixing of materials under the gap between the auger gearbox and/or chain case and the pavement, resulting in a coarser part of the mix on the pavement surface ( 26 ). Other possible causes can include issues with the kick-back auger configuration near the gearbox/chain case, or issues with the screed head. This is assumed to be gearbox and/or chain case segregation, and, in future cases, paver setup needs to be observed to further validate this statement. A schematic diagram representing the cross-section of the paver and gearbox is superimposed in Figure 10.
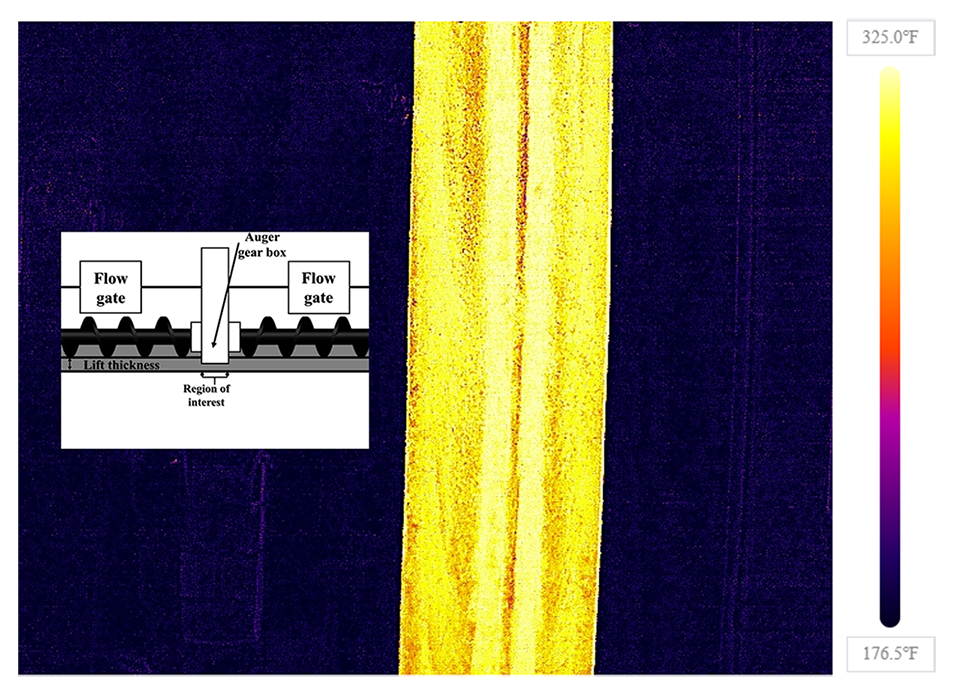
Center of lane longitudinal streak caused by gearbox and/or chain case segregation.
Detailed transverse strip and heatmap analysis are shown in Figure 11. The temperature differential along the longitudinal direction at the center of the lane as well as about 3 ft on each side can be observed. The temperature difference between the coldest and hottest spot in each transverse strip is about 30°F. However, the longitudinal streak observed immediately after the mat was paved dissipated with time and compaction. When rolling commenced, the temperature along the transverse direction became more uniform, as shown with the temperature data presented by the strips after 30 min in Figure 11a.
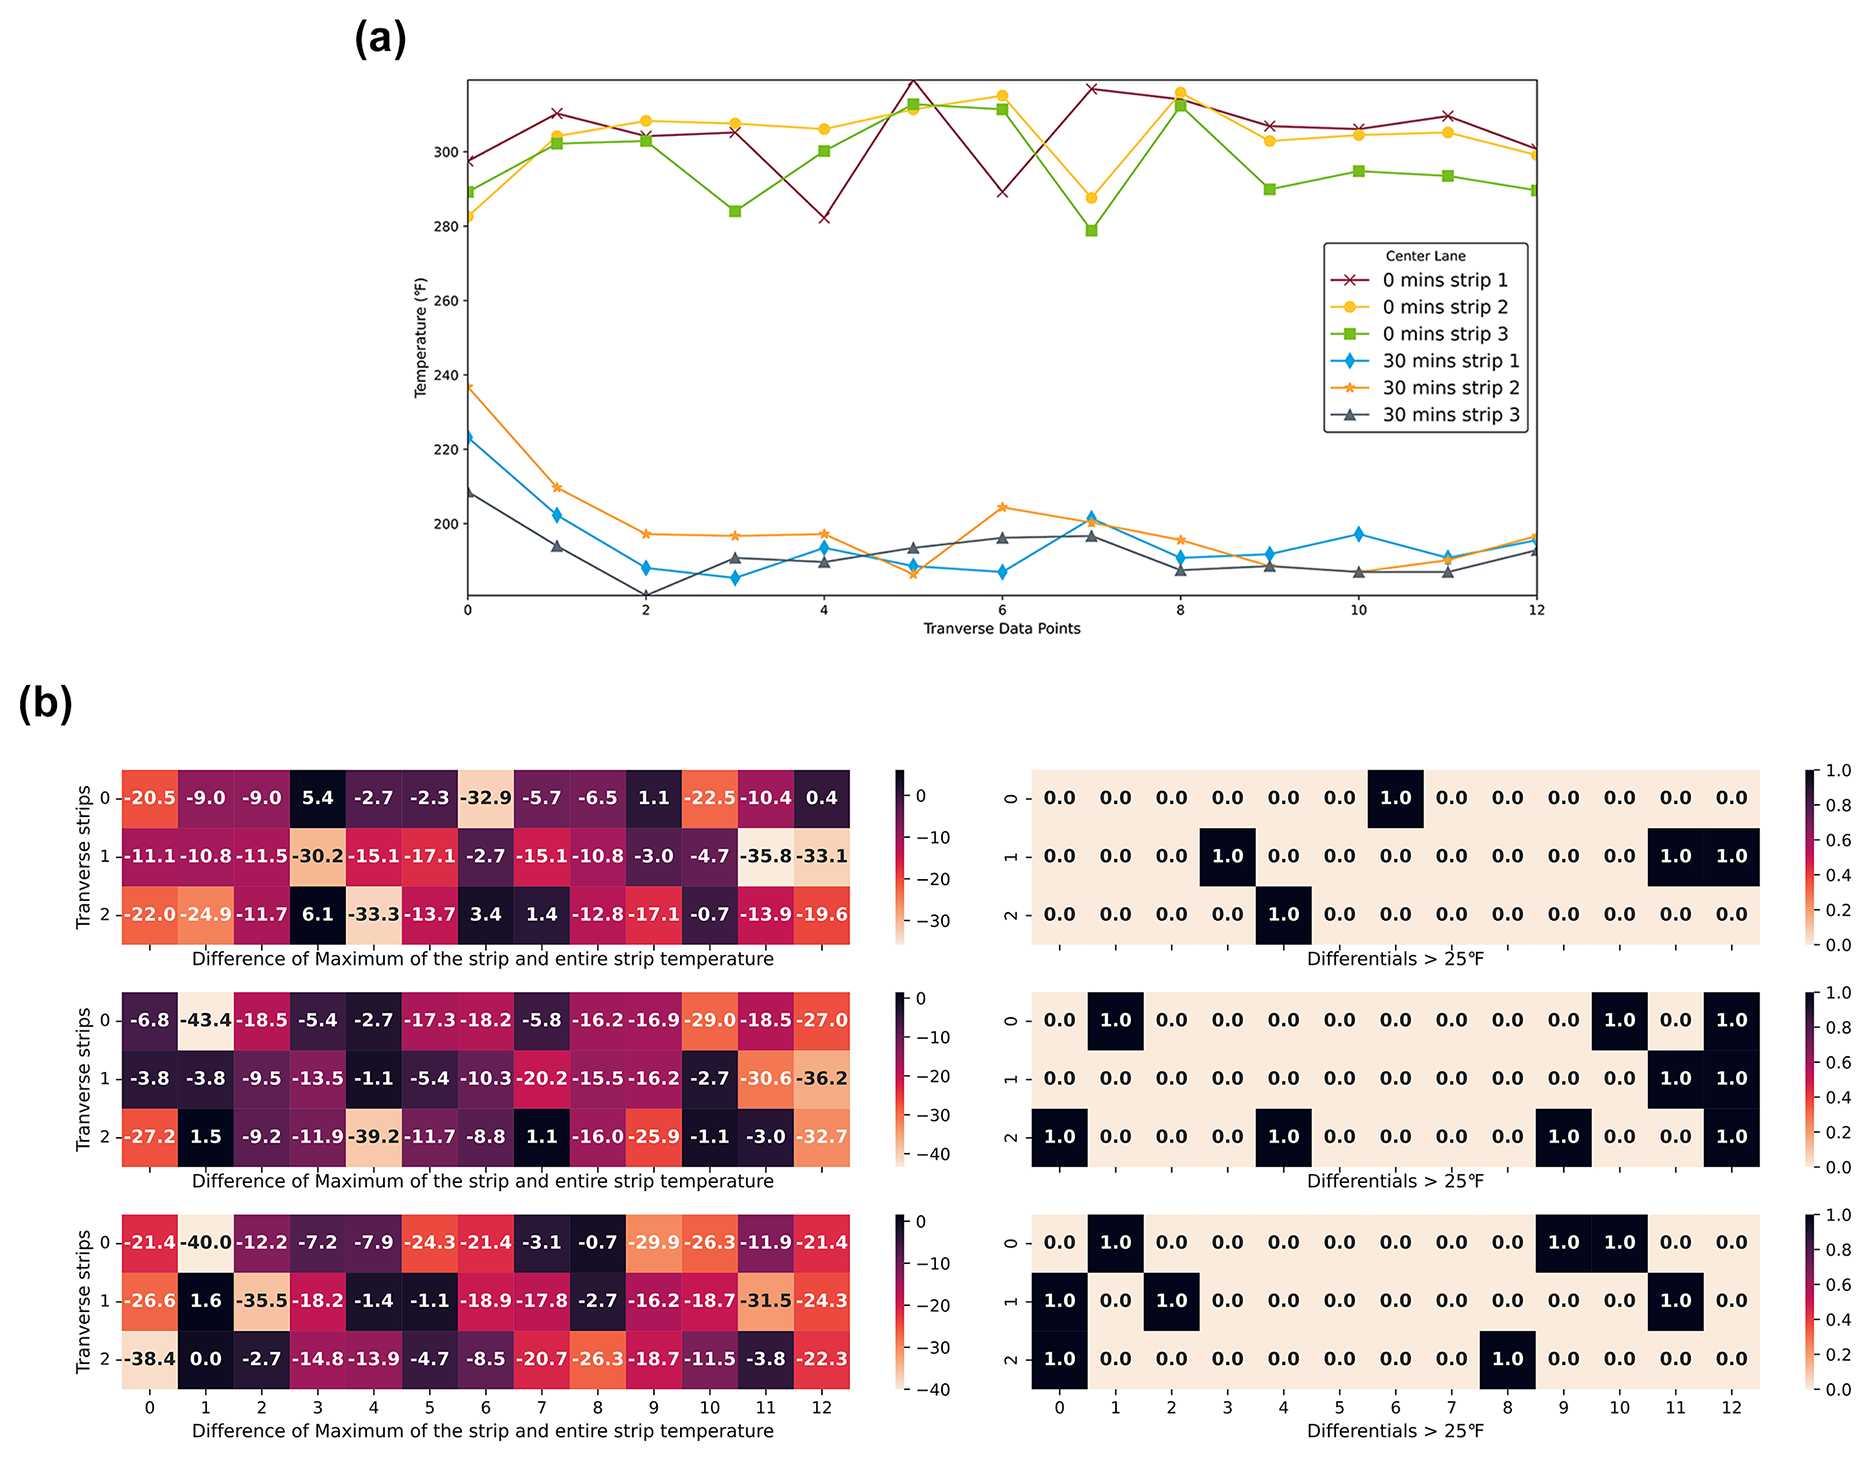
Center lane analysis: (a) transverse plot of strips at 0 to 30 min after paving and (b) thermal differential identified using Python script.
A detailed heat map of the section is shown in Figure 11b. The cells with temperature differences over 30°F were identified. According to the data, it can be seen that more severe cold spots were concentrated in the left and right half of the lane. To evaluate the ultimate impact of such a pattern of temperature differentials that may result in center-lane streak, field cores can be taken. Nuclear density measurements can also support the argument. Coring was not within the scope of the study during this phase. The sites will be monitored with additional UAV flights every year to correlate such unique temperature patterns and the performance of pavements.
Temperature Non-Uniformity Analysis
A specific example of thermal non-uniformity was observed at Site #5 during the construction of a 3/4 in. NMAS base course of an arterial. The periodic V-shaped non-uniform temperature pattern is shown in Figure 12a. These patterns were consistent throughout the paving direction when viewed from the aerial image, shown in Figure 12b. These patterns are caused when the end dump of material has remained in the hopper and the paver folds its wings to push the material to the conveyor making the hopper ready for the next dump. During the relatively long wait times between the trucks bringing a new load of AC at this site, the left-over AC from the previous truck cooled down under the shade of the paver before placement. The material that was pushed to the conveyor was spread across the pavement along the paving direction as the auger tried to spread the material starting from the center and pushing toward the edges. The importance of paver stop-and-go operation was also highlighted in the literature as one of the factors affecting construction quality ( 28 ). Quantification of this V-pattern was done by taking a mat’s temperatures of a uniform image and subtracting it from the temperature values of this V-shaped image, as shown in Figure 12c. Points were plotted in nine strips for these images where the first three strips (V1, V2, V3) were above the V-pattern, the second three strips (V4, V5, V6) were along the V-pattern itself, and the last three strips (V7, V8, V9) were below the V-pattern. Temperature differentials described by the V-shape pattern could still be observed even 60 min after the pavement was placed and compacted, as shown in Figure 12c.
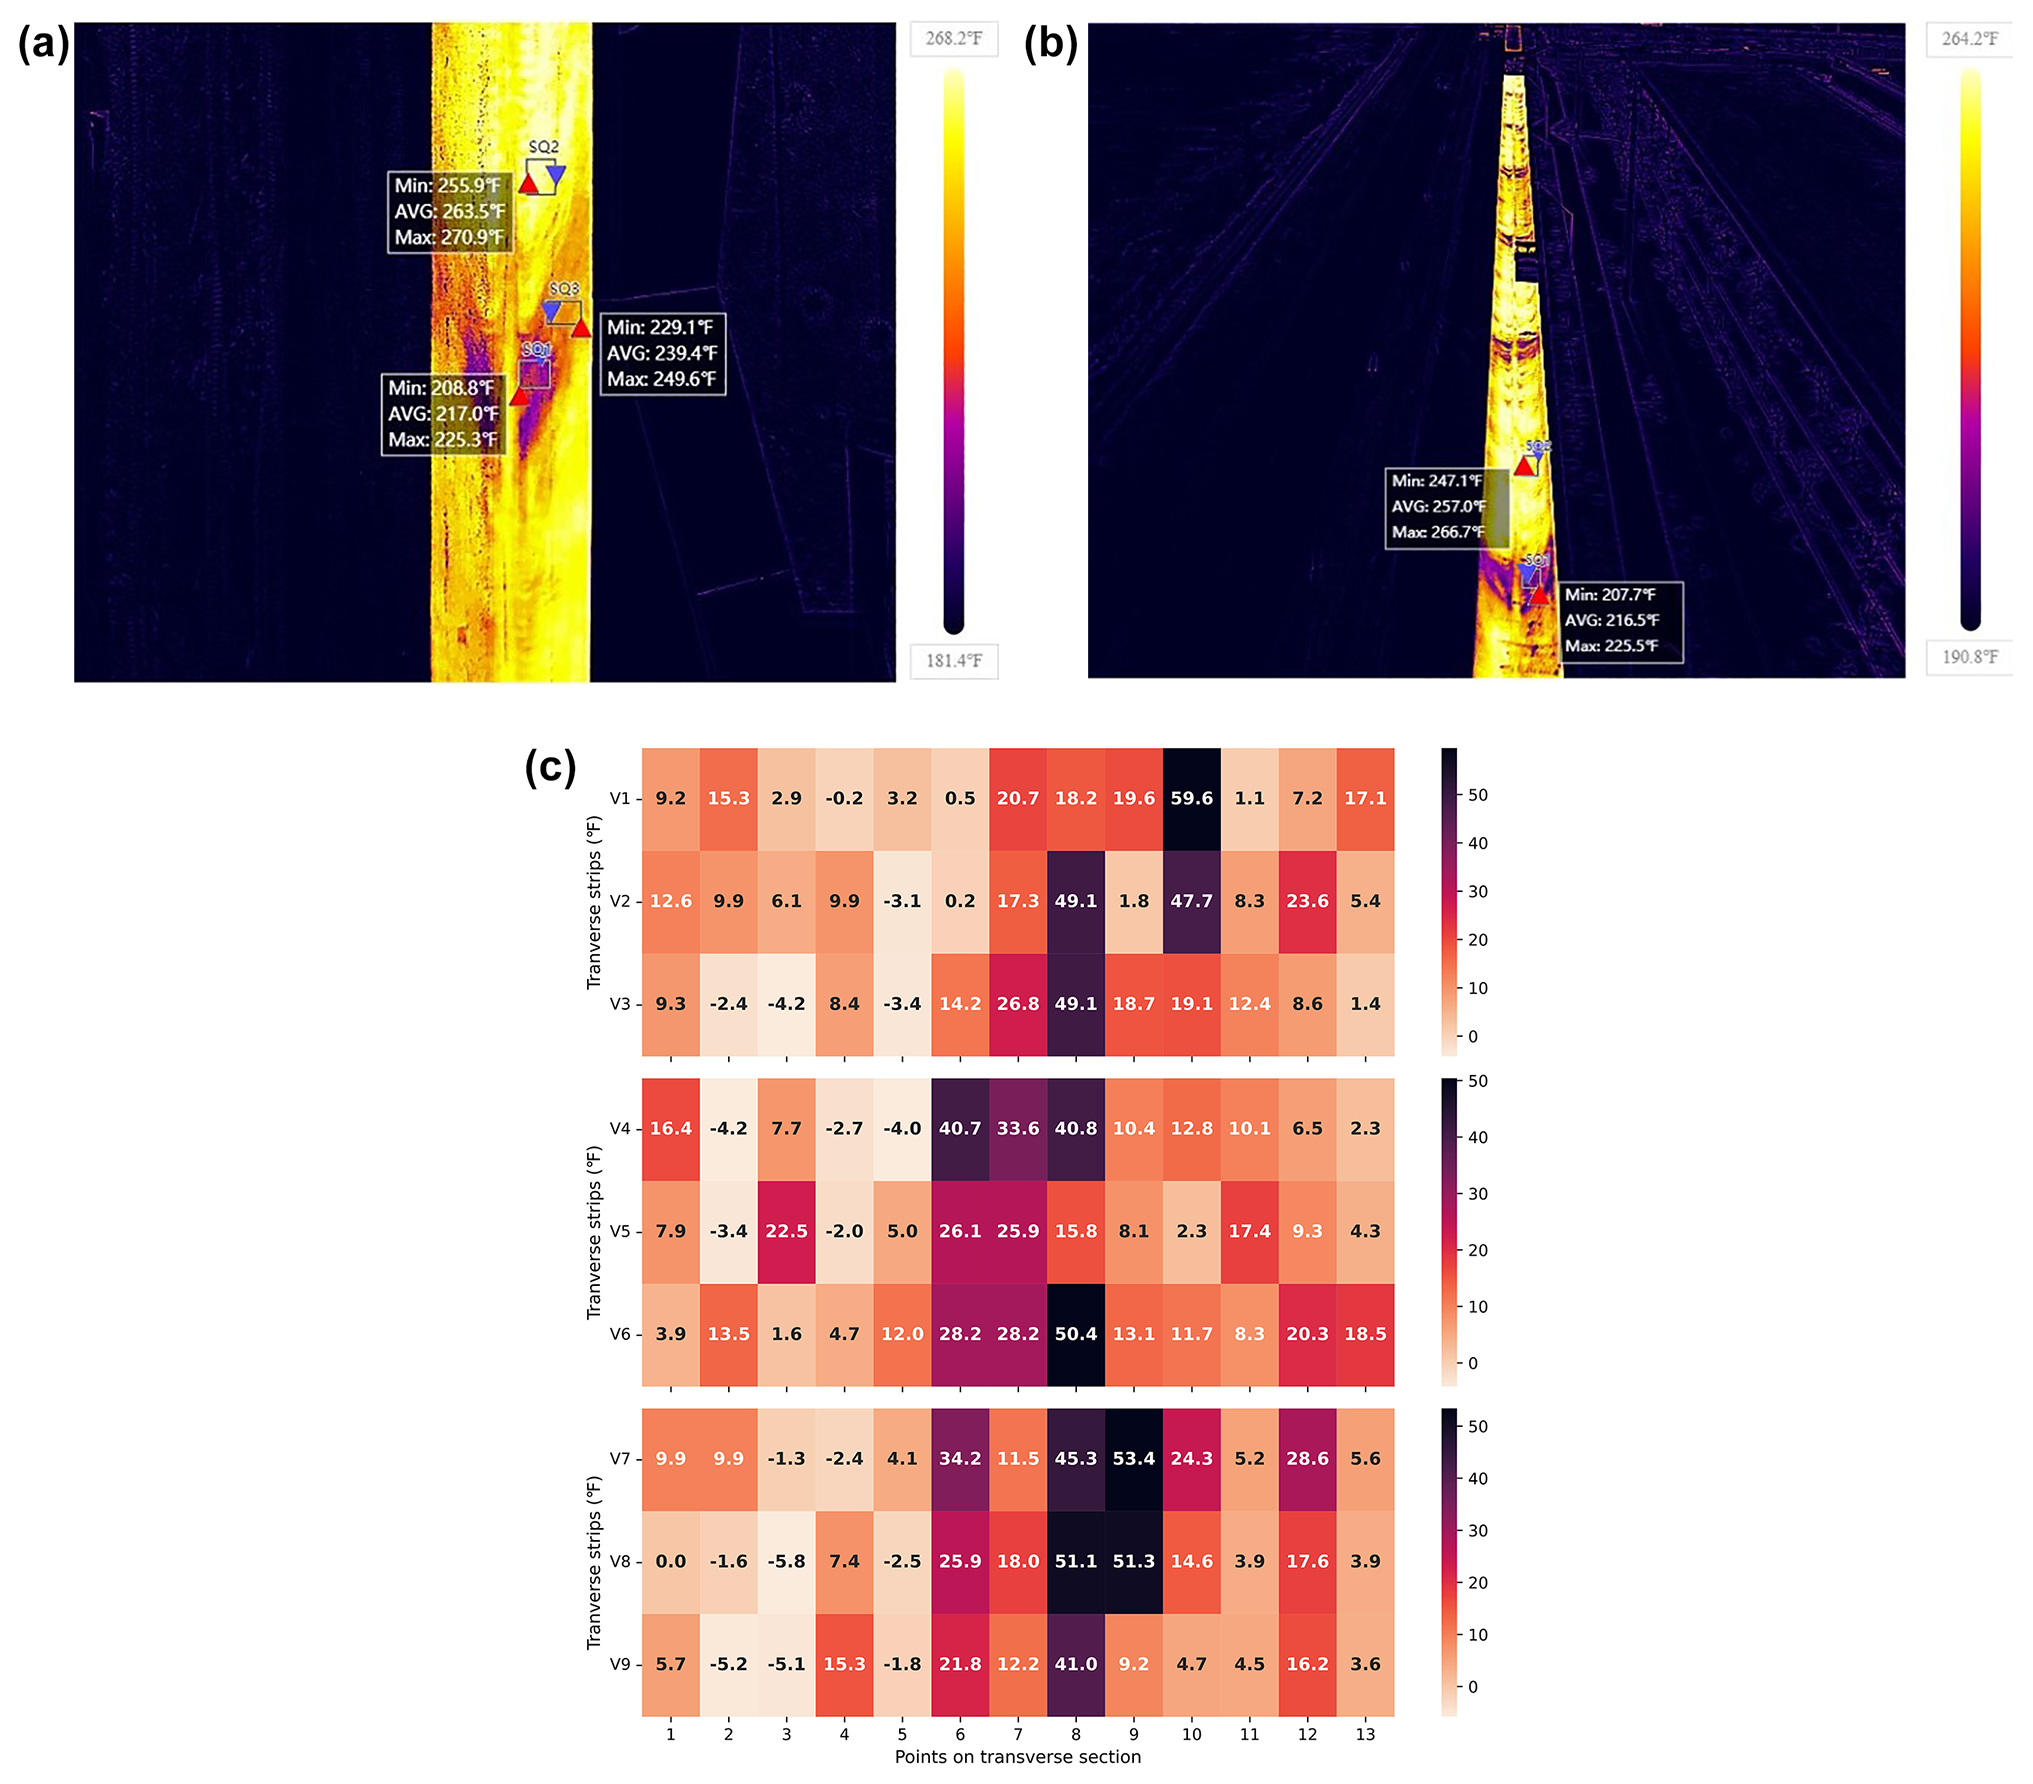
The V-shape pattern observed in Site #5: (a) V-shape pattern from bird’s eye view, (b) repeating V-shape pattern from aerial view, and (c) temperature differentials in one of the zones exhibiting V-shape pattern.
The impact of paver stop-and-go operation on thermal uniformity along with the temperature data obtained from other sites was quantified using a coefficient of variation (COV) parameter. The differential shown in Figure 12c resulted in non-uniformity of temperature values in V-shaped images which gave a 5.9% COV for the subtracted image which is approximately twice the percentage COV of 2.8% for the uniform image. The COV in each sublot where the V-shaped pattern is observed in Site #5, has gradually increased over time than any other site visited as part of the study. This is shown in Figure 13a which was computed by averaging the first four strips of two images per site. It is also observed that Sites #1 and #2 have higher COV, but this can also be explained as the wind speed is very high on Site #1 and the watering was done to cool down the pavement to open the section to traffic on Site #2. Examples of medium and low COV sites are shown in Figure 13, c and d .

Coefficient of variation (COV) and corresponding sites: (a) observed average COV for all the sites as a function of time and reference images of selected sites, (b) Site #2 with high COV, (c) Site #4 with medium COV, and (d) Site #3 with low COV.
Cool-Down Analysis
Another advantage of the technology proposed in this study is the identification of cool-down patterns to assist rolling operations. The mats’ temperature plots were averaged for three strips in each 50 ft sublot, as shown in Figure 14. These trends are confirmed to be similar in all four different 50 ft sections. Site #2 (Chandler site) had shown a very rapid cooldown compared with other sites because of the spraying of water to accelerate cooling for traffic opening, as mentioned earlier. Site #8 (a fiber-reinforced mix paved in a parking lot) has an overall low and steady cooling gradient. According to our observation at this site, there was only a single compactor trying to catch up with the paver’s speed. The compaction process was delayed by at least 15 min per lane. Nevertheless, since the cool-down was slow because of high ambient temperatures at the time of operation, the mat was still sufficiently warm during the compaction operation.
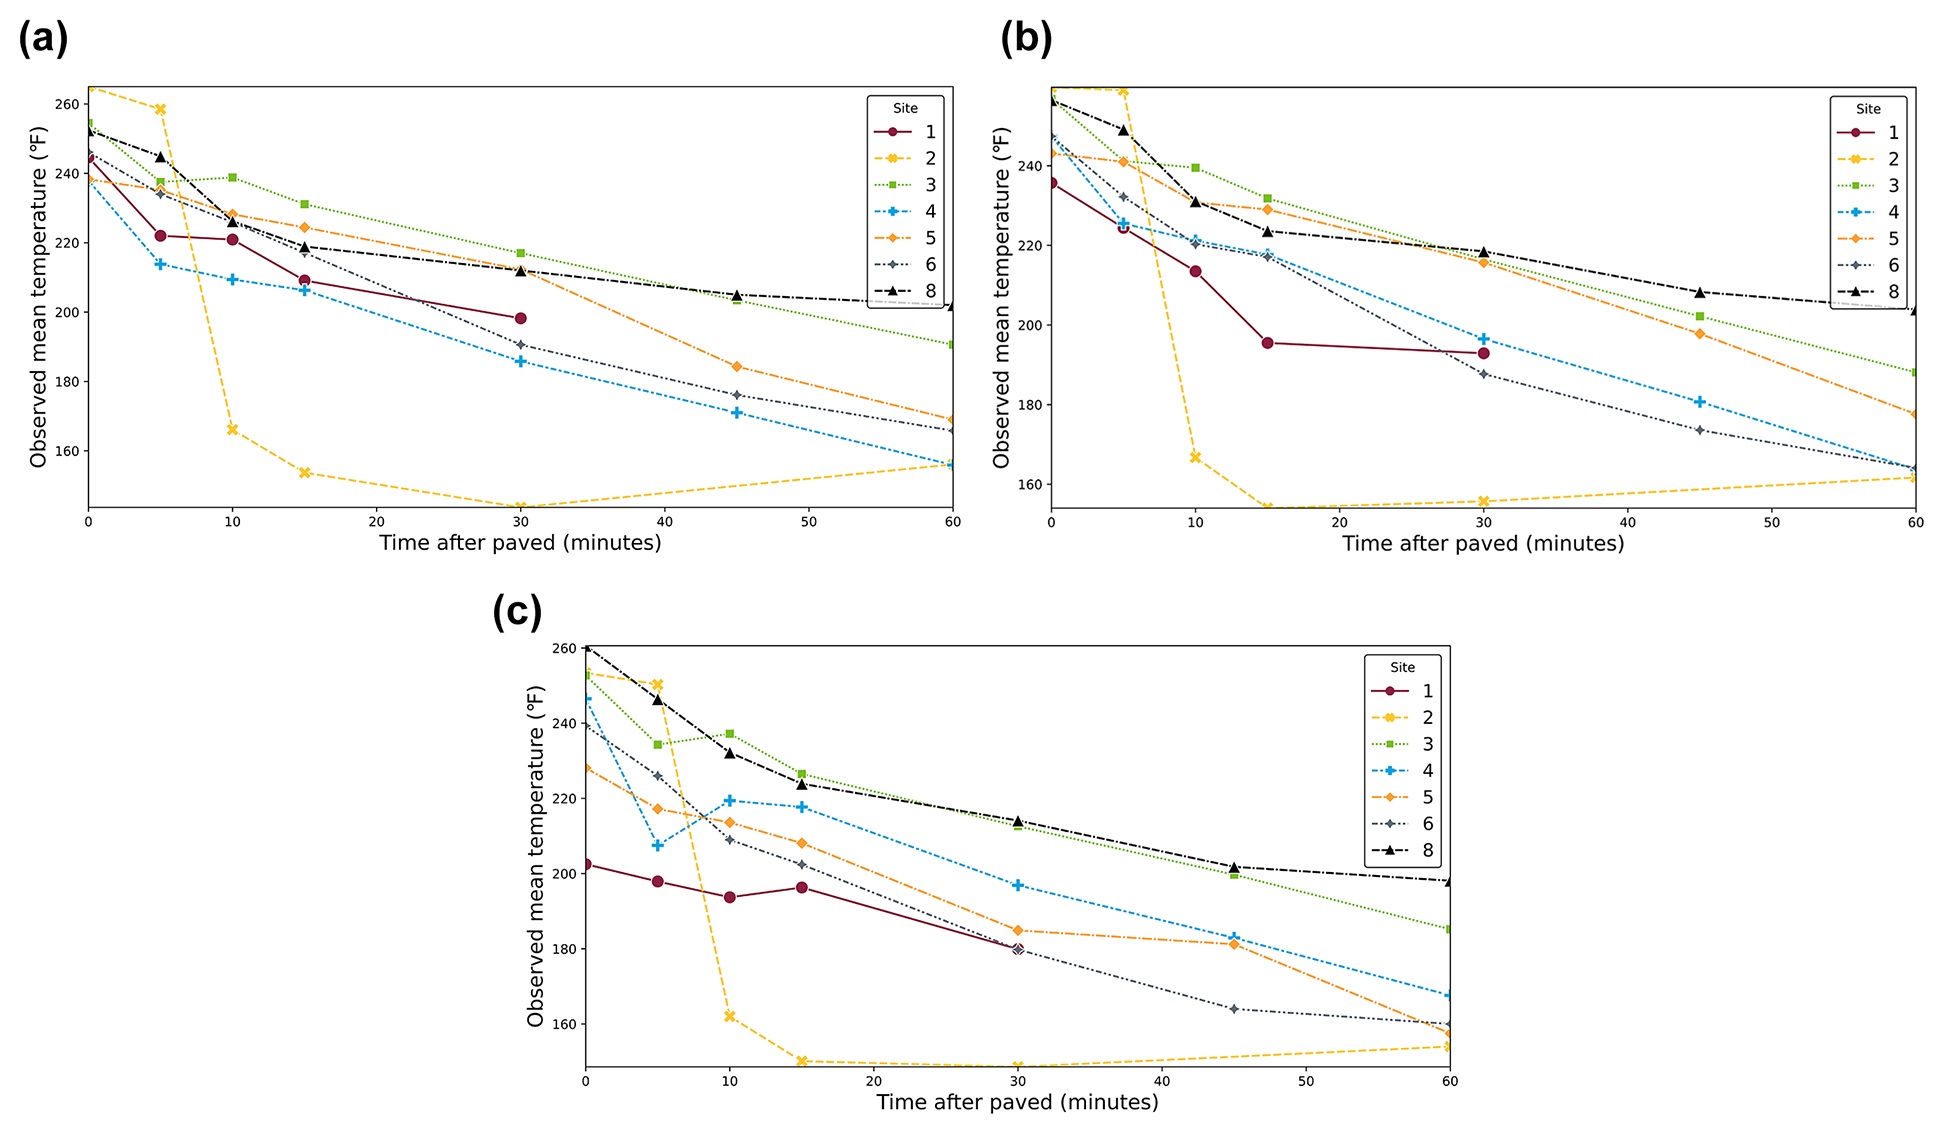
Observed temperature cooldown curves over time for three strips of all sites: (a) strip 1, (b) strip 2, and (c) strip 3.
The rate of cool down at Site #1 was comparatively faster than that at the other sites because of the environmental conditions, with colder air temperatures and wind speeds of approximately ∼25 mph. High wind also hindered the UAV operation from concluding after 30 min of paving, as the increasing gusts may potentially cause damage to the UAV and sensor. Similarly, the mix placed in Site #6 also experienced rapid cool-down. There was no correlation between mix or binder type with the cool-down rate among the sites. The variability in the cool-down patterns, despite the similarities of the ambient environmental conditions during paving, demonstrates the importance of using the proposed technology to monitor those trends over the entire mat to support roller operations.
Findings and Recommendations for Future Research
In this study, a protocol was developed to capture and quantify the thermal signature of the AC pavements during placement and compaction using a UAV mounted with a thermal sensor. To design a methodology for thermal analysis of paving operations, eight locations were visited to collect thermal data. The site visits took place between April and July where air temperatures varied by about 40°F to 50°F between the coldest to the warmest day. Surveying sites constructed with various mix designs (two types of NMAS, polymer modified and unmodified mixes), pavement facilities (arterial, parking lot, residential streets), and lift thicknesses (2 to 4 in.) allowed the development of a robust survey protocol and testing under a variety of conditions. Three major thermal characteristics of paving operations were quantified: local thermal segregation analysis, identification of non-uniform temperature patterns, and cool-down analysis. Automation for data processing and visualization accomplished using Python scripts provided a spatial and temporal coverage of an area behind the paver. Quantifying spatial and temporal analysis of the thermal signature of the mat could be key feedback that can be provided to the construction crew for corrective actions. The UAV system not only provided the ability to increase spatial coverage but also gave the option to monitor the sublots within the window of compaction. These features were not possible with the existing thermal scanning products.
The findings from the study and conclusions are summarized as follows:
Various temperature anomalies were identified in the sites visited, including local segregated spots, longitudinal center of lane streaks associated with gearbox and/or chain case segregation, and V-shaped pattern of cold spots indicator of paver stop-and-go operation.
Localized and area thermal uniformities were quantified by three types of metrics: temperature differentials, percent of non-uniformity, and COV.
The most influential factors affecting the non-uniformities appeared to be wind speed and NMAS. However, we cannot draw any conclusions about the effect of wind speeds on the temperature non-uniformities, as the UAV scans may have been affected by the wind as well.
Some of the non-uniformities and temperature differentials indicating the severity of segregation risk that appeared immediately after placement dissipated over time with the compaction process. The impact of such dissipating anomalies on the density and actual performance of pavement is not known at this point. The mechanisms of the dissipation and under what conditions temperature homogenization takes place need to be understood better.
Cool-down patterns showed significant variability from site to site. Air temperature, wind speed, and construction activities were among the factors affecting the cool-down rate.
The use of this protocol enables us to monitor the thermal signature of the mat and assess the persisting or dissipating thermal differentials, as it involves multiple passes over the mat sections at different times. This can give a better understanding of the mat non-uniformities not just before but also after compaction, which the existing systems cannot detect.
The following limitations and recommendations are summarized:
The UAV’s temperature data need to be compared against actual mat temperatures obtained using various methods. Calibration functions can be developed. External additional sensors can also be used to validate the non-uniformity dissipation observed in most of the sites.
The temperature-density relationship needs to be established using field cores and nuclear gauge measurements. Not all temperature non-uniformities or differentials may affect the state of compaction. It is critical to identify critical cases that can be correlated with the density achieved.
The thermal signature of each site can be correlated to actual performance with periodic visits and automated UAV surveys.
Gaining access to thermally encoded pixel data (radiometric energy values) can further aid in refining the proposed protocol. In particular, the resolution of the temperature grid can be increased to identify localized segregation spots more precisely. Developing near real-time feedback to the crew for corrective actions will also be possible.
Because of limitations in accessing encoded pixel data, the analysis had to be performed post-surveys (approximately 1 h per site) and with limited granularity.
The thermal data measured by the sensor are purely energy readings and can be affected by factors such as watering and time of capture. Reflectivity plays a role in altering the energy readings when the site is watered but can be addressed by testing this protocol on sites where sufficient ground temperature readings are collected and correlating the UAV data with ground truth.
On-the-ground observations of paving operations had been limited. There is a need to couple the UAV’s thermal output with the ground operation (e.g., rolling patterns and coverage) in a systematic manner.
Studying the paving equipment types, use of MTVs, paving crew behavior, rolling patterns, paver stops, and hauling distances can add a lot of value, in coherence with the protocol followed in this study.
Footnotes
Acknowledgements
The authors acknowledge the financial support received from the National Center for Infrastructure Transformation (NCIT) led by Prairie View A&M University (PVAMU). The authors also acknowledge the industry’s extended support received from Greg Groneberg—Southwest Asphalt, Dominick Martinez—M. R. Tanner Construction, and Integer Consulting, LLC.
Author Contributions
The authors confirm contribution to the paper as follows: study conception and design: H. Ozer, N. Vedula; data collection: N. Vedula, M. Beheshti, O. Alalwi; analysis and interpretation of results: H. Ozer, N. Vedula, M. Beheshti; draft manuscript preparation: N. Vedula, M. Beheshti, H. Ozer. All authors reviewed the results and approved the final version of the manuscript.
Declaration of Conflicting Interests
The author(s) declared no potential conflicts of interest with respect to the research, authorship, and/or publication of this article.
Funding
The author(s) disclosed receipt of the following financial support for the research, authorship, and/or publication of this article: The work described in this paper was supported by the United States Department of Transportation’s (USDOTs) National Center for Infrastructure Transformation (NCIT) led by Prairie View A&M University (PVAMU) with the grant reference number – AWD00039127.

The contents of this paper reflect the views of the authors who are responsible for the facts and the accuracy of the data presented here. The contents do not necessarily reflect the official views or policies of NCIT. This paper does not constitute a standard, specification, or regulation.