
Abstract
Urban railway systems require regular maintenance to uphold safe and efficient operations. System operators are sometimes forced to perform this maintenance during revenue service hours. The resulting changes in revenue service are called a “revenue service adjustment,” or RSA. Because RSAs typically feature planning horizons of months or even years, operators have an opportunity to design them in ways that minimize the level-of-service (LOS) impacts for passengers. This paper presents a framework for operators to consider LOS impacts early in the RSA planning process. First, a taxonomy of service delivery strategies is developed, where various strategies can be characterized by typical LOS impacts and operational considerations to efficiently identify options to consider. Second, a method is presented to develop optimal service plans to deliver the various strategies. Third, the distribution of LOS impacts on various groups of passengers is found for each service plan. Finally, considerations related to work planning and productivity are quantified and balanced against LOS impacts. The framework is demonstrated on a real-world case study from the Washington Metropolitan Area Transit Authority (WMATA) in which a single track needed to be removed from service. The results show that under the same resource constraints, different RSA design decisions can result in a large range of potential wait time impacts, with ratios ranging from 1.15 to 1.34 compared with normal revenue service, as well as a promising daily time period to perform work that balances a large increase in productivity with a smaller increase in LOS impacts.
Keywords
Introduction
Railways require regular maintenance to remain in safe condition, and the planning and provisioning of this maintenance can be challenging. A poor maintenance program can lead to level-of-service (LOS) degradation through speed restrictions, poor ride quality, and delays ( 1 , 2 ). Many forms of railway maintenance (such as rail replacement, power supply maintenance, switch maintenance, or signal testing) are challenging or impossible to undertake under revenue traffic. If these activities cannot take place within the normally scheduled overnight maintenance period (or if the system runs 24 h per day), revenue service patterns and/or schedules must be modified to accommodate the activities. These modifications will be referred to as revenue service adjustments, or RSAs.
The process of enacting RSAs involves many planning stages and stakeholders (Table 1).
Typical Revenue Service Adjustment (RSA) Planning Process

It is critical that the various stakeholders involved collaborate in the planning process early, as decisions made upstream of service delivery may result in unnecessarily severe degradation to passenger LOS. This paper develops a systematic approach so that the stakeholders can evaluate various RSA designs to balance productivity and LOS impacts. This approach benefits vertically integrated organizations by reducing reliance on ad-hoc planning processes between stakeholders. For non-vertically integrated cases (e.g., when the infrastructure owner is a different entity than the operator), the framework can help to ensure that the infrastructure owner meets its obligations to the operator by considering LOS impacts when developing work plans.
Although some individual aspects of the process of RSA design are well studied, there is a lack of literature focusing on holistic, passenger-centered planning of RSAs. Some of the strategies discussed here have been studied from the perspective of unplanned disruptions and resiliency. Both single tracking (trains running in opposite directions on the same track by taking turns, as opposed to using one track per direction) as well as bus replacement services are common responses to unexpected disruptions ( 3 ). In light of increased data availability, recent research has incorporated optimization and passenger assignment into these modeling responses ( 4 ). Meanwhile, from a strategic perspective, placement of crossovers has been studied as a method to reduce the impact of disruptions requiring single tracking ( 5 ). While these studies are useful examples of the RSA service delivery strategies in action, the respective operational and strategic planning horizons in these studies are not well-suited for the tactical planning horizons of RSA design, where resources can be carefully allocated in advance but major infrastructure modifications to accommodate maintenance are unlikely.
There is a large body of research investigating tactical planning of maintenance activities for intercity rail. Examples include optimizing for the trade-offs between maintenance needs and desired passenger services ( 6 ), minimizing delay caused by rerouting around maintenance activities ( 7 ), balancing the efficiency of maintenance with impacts on freight and passenger trains in yards ( 8 ), and optimizing the provision of additional multimodal service in the network ( 9 ). While the overarching goals of these studies are similar to this research, the urban railway context has special considerations. For example, rerouting is often possible for long-distance passenger trains and especially freight trains, but for urban railways may not be feasible, as it leaves many passengers at intermediate stations without service and introduces track capacity issues on other lines.
There has been some research on RSAs specifically in the urban railway context including strategies for passenger-centric evaluation of impacts to journey times following RSAs, demonstrated on multiple service strategies ( 10 ), trade-offs between construction efficiency and ridership retention ( 11 ), and a review of passenger impact mitigation strategies for two major urban railway rehabilitation projects in Philadelphia ( 12 ). These studies are retrospective in nature, while this paper aims to provide an RSA planning framework.
This paper serves as an adaptable framework for approaching RSA design under diverse conditions. The main contributions of this research are:
a framework for developing RSAs to balance maintenance needs with service delivery;
a taxonomy of the various RSA service delivery strategies, from a tactical planning perspective;
a method to evaluate the distribution of LOS impacts of RSAs on different groups of riders;
a method to quantify and compare the trade-offs between work productivity, project costs, and LOS impacts by adjusting the timing and duration of RSAs;
a case study based on a real-world RSA to demonstrate the use of the framework to identify lower-impact, higher-productivity RSA designs.
Framework for Development of RSAs
The proposed method to design RSAs that balance passenger, operational, and productivity-related needs includes four fundamental steps.
Selection of Service Delivery Strategy
To assist in the selection of service delivery strategies for an RSA, a taxonomy of service delivery strategies has been developed. Strategies are one of two types: service reductions and service suspensions. In a service reduction, the quality of the service degrades (e.g., by increasing the headway), but service is still available at all stations in both directions. Conversely, in a service suspension, there may be parts of the network with no service in a particular direction. Table 2 presents an overview of the strategies and their high-level characteristics.
Revenue Service Adjustment (RSA) Service Delivery Strategies
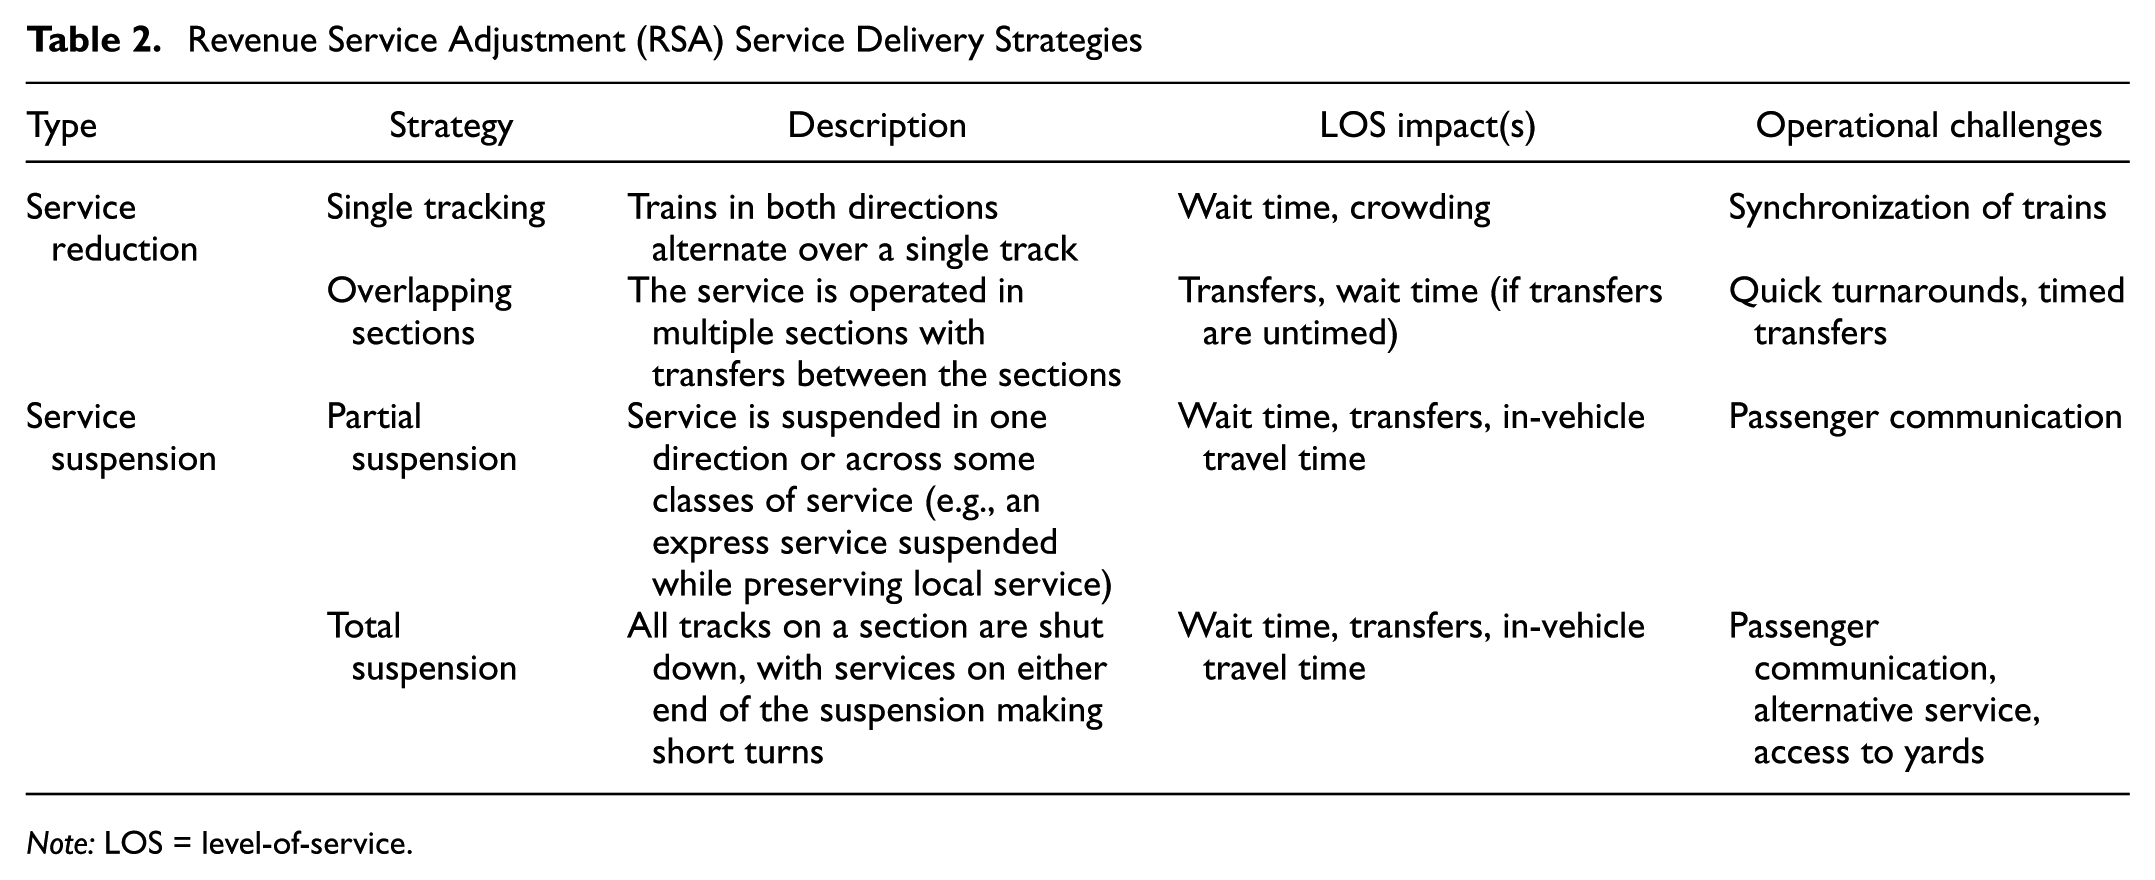
Note: LOS = level-of-service.
Service Reduction Strategies
Urban rail networks typically have double track. Depending on the nature of the right-of-way or the work to be performed, it may be possible to accomplish certain maintenance activities while shutting down only a single track. Revenue service is run by alternating the running of trains in opposite directions over the same section of track. This strategy is known as
The operational pattern of a basic single-tracking strategy is shown in Figure 1. Trains approaching the single-tracked area must wait for a train traveling in the opposite direction to completely exit the area before entering. To minimize wait times on a non-branching line with a single service pattern, consecutive trains through the single-tracking area should alternate directions (an alternating sequence of trains). However, if crowding is a major concern, or if there are multiple service patterns (e.g., on a trunk line with branches), operators may send multiple consecutive trains through the single-tracking zone in the same direction before alternating to the trains in the opposite direction (a grouped sequence of trains).
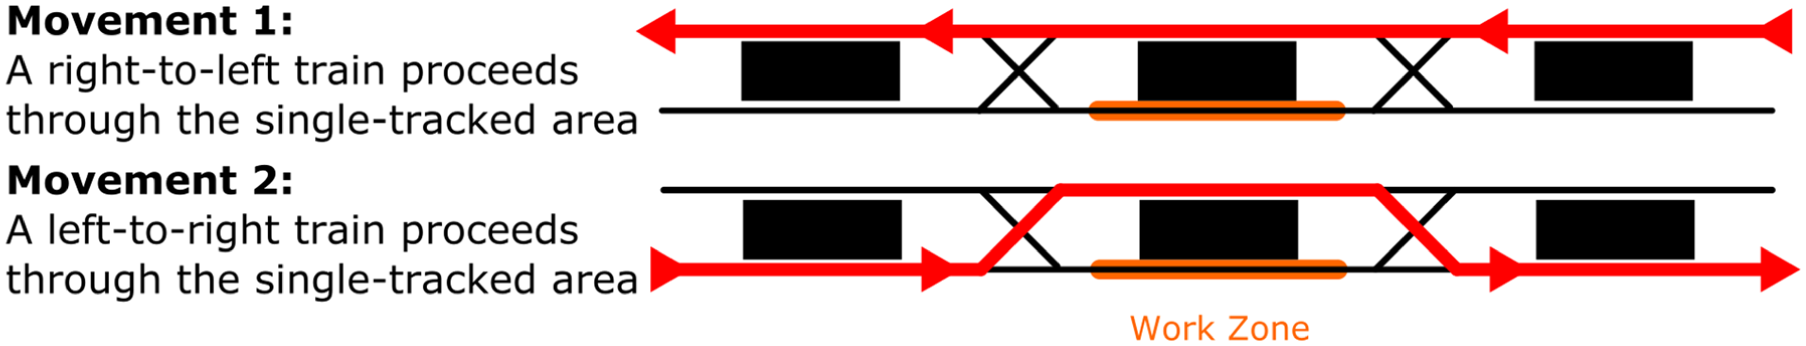
Schematic diagram of single tracking with an alternating sequence.
Single tracking allows operators to maintain similar service patterns to normal service, albeit with a higher headway (and higher wait times). The minimum single-tracking headway for any service pattern is determined as follows:

where:
R: the one-way run time through the single-tracking area
h F : the minimum following headway
N G : the number of additional trains entering in grouped sequence (e.g., in an alternating sequence, N G = 1, in a grouped sequence with two service patterns, N G = 2)
B: the buffer time between the last train in one direction exiting the single-tracked area and the first train in the other direction entering the single-tracked area
In cases where the distance between track crossovers is long or where many stations must be served within the single-tracking area, the minimum headway increases quickly. For example, even under the most optimistic assumptions, a single-tracked area with a one-way run time of 5 min has a minimum headway of 12 min. Furthermore, unless adequate supplemental service is provided in the form of short turns outside of the single-tracked area (see the section below on supplemental services), even passengers who are not traveling to/from the single-tracked area will be affected by the high headways. However, passengers benefit from minimal deviation from their preferred routing, and communication of the service plan is straightforward. Various stop-skipping strategies (such as A/B stop skipping, where trains skip every other station, or skipping stops in one direction) may reduce single-tracking minimum headways at the expense of LOS impacts for the passengers whose stations are skipped.
Operationally, single tracking presents several advantages. Trains can continue to turn around at their normal terminals, yards remain accessible from all points on the line, and vehicle or operator shortages owing to yard accessibility will not be a challenge. However, under ideal conditions, trains should be scheduled to meet at the boundaries of the single-tracked area to minimize the amount of time waiting for the single-tracked area to clear.
The
Figure 2 is an example of an overlapping sections strategy. A work zone is set up on the lower track. Unlike single tracking, the service is operated in two sections. Trains approaching from the left side traverse the entire single-tracked area, turn around at the transfer station, and head back to the left side. Trains approaching from the right side also turn at the transfer station, but without having to traverse a long portion of the single-tracked area. This creates a shorter headway on the right side and a longer headway on the left side.
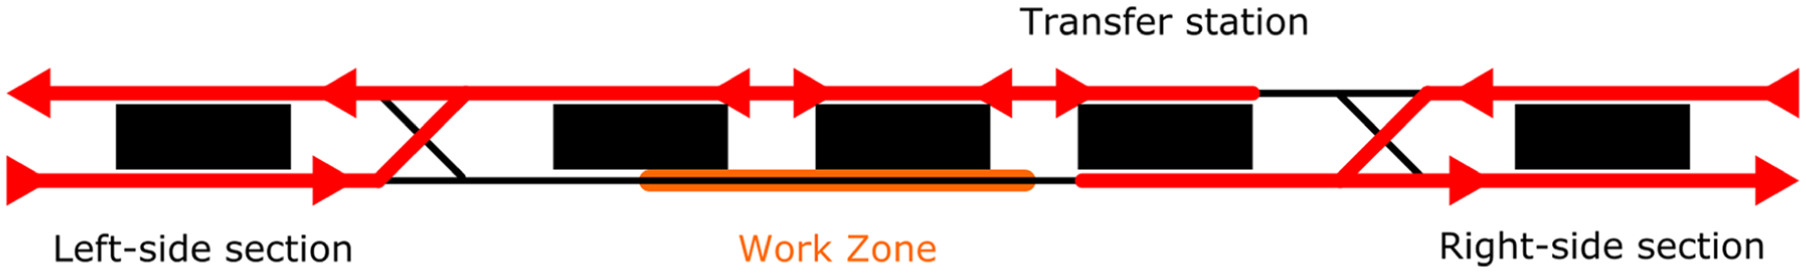
Schematic diagram of the overlapping sections revenue service adjustment (RSA) service delivery strategy.
The minimum headway for a particular section is given by:

where:
R: the one-way run time through the portion of the single-tracked area used by the section the one-way run time through the portion of the single-tracked area used by the section
T: the turnaround time at the transfer station
B: the buffer time between the last train in one direction exiting the single-tracked area and the first train in the other direction entering the single-tracked area
Passengers traveling through the overlapping section must make a transfer, incurring an additional wait time (particularly if the transfer is not timed) and the inconvenience of a transfer. This inconvenience may be outweighed by lower headways on one of the sections.
If rapid turnarounds can be achieved (e.g., through the use of a dropback operator) and transfers are timed (and ideally cross-platform), an overlapping sections strategy may provide a higher level of service than single tracking. Despite more complex operational conditions, overlapping sections strategies are used in cities such as New York ( 13 ), Seattle ( 14 ), and Moscow ( 15 ).
In both single tracking and overlapping sections strategies, it is possible that passengers on one or both sides of the single-tracked area experience high headways. To partially mitigate the impacts, it may be feasible to run additional service patterns which short turn outside of the single-tracked area. For passengers whose trips do not cross the single-tracked area, a supplemental short-turning service will reduce wait time and crowding. Operationally, short-turning services should ideally utilize non-revenue tracks at the short-turning locations to avoid conflicts with the other service patterns.
Service Suspension Strategies
Service suspension refers to the complete absence of service over a section of the network, in one direction or class of service (a partial suspension) or both directions and all classes of service (a total suspension). For certain OD pairs, passengers have to reroute their journey, resulting in potential increases in the wait time, number of transfers, and travel time. If access to the portions of the network affected by the suspension is to be maintained, system operators provide alternative service. Depending on the nature of the service suspension, the following options may be used, listed in order of highest-to-lowest impact (both for passengers and for operators):
Rerouting via an alternative bus service (sometimes known as a “bus bridge”). In the absence of rail network redundancy, passengers may need to use buses to reach their destinations. Operators may provide a replacement bus service that makes the same stops as the affected rail service, or they may direct passengers to existing bus links in the network. Buses are typically slower than parallel rail lines, increasing travel time, in addition to wait time incurred when transferring to/from the bus. In addition, a high number of buses is needed to transport the same volume of passengers.
Rerouting within the rail network. If sufficient redundancy exists, another rail line may be used to access the affected sections of the line. Depending on the level of redundancy, wait times, transfers, and travel time may increase significantly or not at all. However, crowding remains a risk if all passengers on the affected line travel via another rail route. A special case of rerouting during a partial suspension is when service is only suspended in one direction (e.g., if trains in one direction bypass a station). In this case, the “rerouting” involves traveling past the intended station and transferring to the service in the opposite direction to access one’s intended station.
Rerouting via a different class of service. In special cases of a partial suspension where express and local services run on the same line, it may be possible for an affected passenger to reach their destination via another service. Suspending an express service in favor of local trains is low-impact, as only in-vehicle travel times (and potentially crowding) are affected. However, suspending a local service in favor of express trains may further require local-station passengers to double back on the same line to reach their station.
Total suspensions may limit access to yards, as both tracks may be rendered inoperable in the course of work. This presents challenges when attempting to allocate the revenue train fleet or train operators to service patterns in the open sections of the network.
While in some cases a total suspension is unavoidable, with a long enough planning horizon, even major repairs can often be staged to affect only one track at a time (although doing so may come with impacts on work productivity). Therefore, in most cases, all varieties of service suspensions and service reductions can be considered while planning an RSA.
Passenger communication is not nearly as critical in service reduction, but in a service suspension, the passengers may have to reroute using unfamiliar or temporary services, which may require the operator to properly staff and sign stations for the adjusted service.
Although LOS impacts are usually most severe for passengers traveling through an RSA area, the type of strategy affects how the impacts are distributed among riders along the line. In the case of service suspension, the degradation in service is likely to affect riders along the entirety of the line. Conversely, in the case of service suspension RSAs, riders who are boarding, alighting, or traveling through the RSA area are often subject to major increases to their wait and travel times owing to the need for an alternative service. However, it is possible for riders outside the RSA area to experience few LOS impacts overall if operations are managed well.
Optimization of Service Plans
Once promising service delivery strategies have been identified, optimization of service patterns allows for comparison across versions of each service delivery strategy with the lowest LOS impact. In simple cases, the minimum headway that is feasible through a single-tracked area or at a short-turning location (e.g., in the case of overlapping sections or a total suspension) is the headway with the least impact to LOS. Furthermore, because there is generally less service provided during an RSA, it may be the case that rail operations resource constraints (such as fleet availability or operator hour availability) are unlikely to be binding. However, the following are examples of cases with more complex rail networks or operations that may justify a more rigorous service plan optimization:
single tracking affecting a section of the network where multiple routes share trackage;
networks with high redundancy on the rail network or flexible bus operations, where alternative service beyond a simple bus replacement shuttle is likely to be provided and/or utilized;
RSAs of long duration (e.g., months), such that regular travel habits are likely to change depending on the quality of service provided.
A method that can be used in more complex cases is adapted from ( 16 ), addressing a service pattern choice and frequency setting problem originally designed for trunk-with-branches systems ( 16 ). This model is an appropriate choice for the case study in this paper; however, most optimization models that identify a service plan with maximal passenger LOS given resource and operational constraints should work within the context of the overall methodology.
A service pattern is defined as a unique route (between two terminals) and a headway combination. Each service pattern representing options to run an RSA service (including short turns) should be identified, including only headways that are feasible (e.g., above the minimum allowed for single tracking). The following mixed-integer linear program identifies the optimal combination of service patterns to minimize wait time and (weighted) transfers:

Subject to:


where:
x s : decision variable. x s = 1 when service pattern s will be used; 0 otherwise
h s : the headway of service pattern s
γ: a weight to quantify the impact of a transfer with reference to wait time
f s : the fleet requirement for service pattern s
F: the total fleet available
p s : the operator hour requirement for service pattern s
P: the total operator hours available
v s : the hourly passenger flow capacity of service pattern s
q i : hourly passenger flow rate on track segment i
LOS Impacts and Distribution of Impacts
An important distinction between different service delivery strategies is how they affect certain groups of riders. For example, with single tracking, it is not uncommon to reduce the overall LOS impacts by implementing stop-skipping through the single-tracked area to reduce the minimum headway. However, doing so results in major increases in the LOS impacts for riders whose trips originate from or are destined to stops within the RSA area, which can introduce issues of fairness and equity.
Evaluating OD-level LOS impacts of an RSA requires: 1) calculating expected wait times (including for transfers) and run times from service plans or schedules for any given origin-destination pair, and 2), assigning passengers through the network in the case where “typical” passenger routings are interrupted, or experience degradation in their LOS. In general, transit assignment models fulfill both 1) and 2) ( 17 ).
Work Plan Development
An additional lever available to maintenance and service planners is the hours per day that an RSA is in effect, referred to as the engineering hours.
Most urban rail systems experience peak demand twice a day, corresponding to normal commuting hours, with lower demand during the daytime and lowest demand in the early morning and late night. In the absence of OD pairs with unusual demand patterns, the RSA design and the work planning can generally be considered independently.
The trade-offs involved in RSA timing can be demonstrated by considering two cases: one in which work is performed continuously (i.e., 24 h per day, 7 days per week) regardless of the time period, and one in which work is only performed during time periods when demand is low (e.g., late at night). Table 3 summarizes the various trade-offs that may require consideration.
Comparison of Revenue Service Adjustment (RSA) Work Planning Options
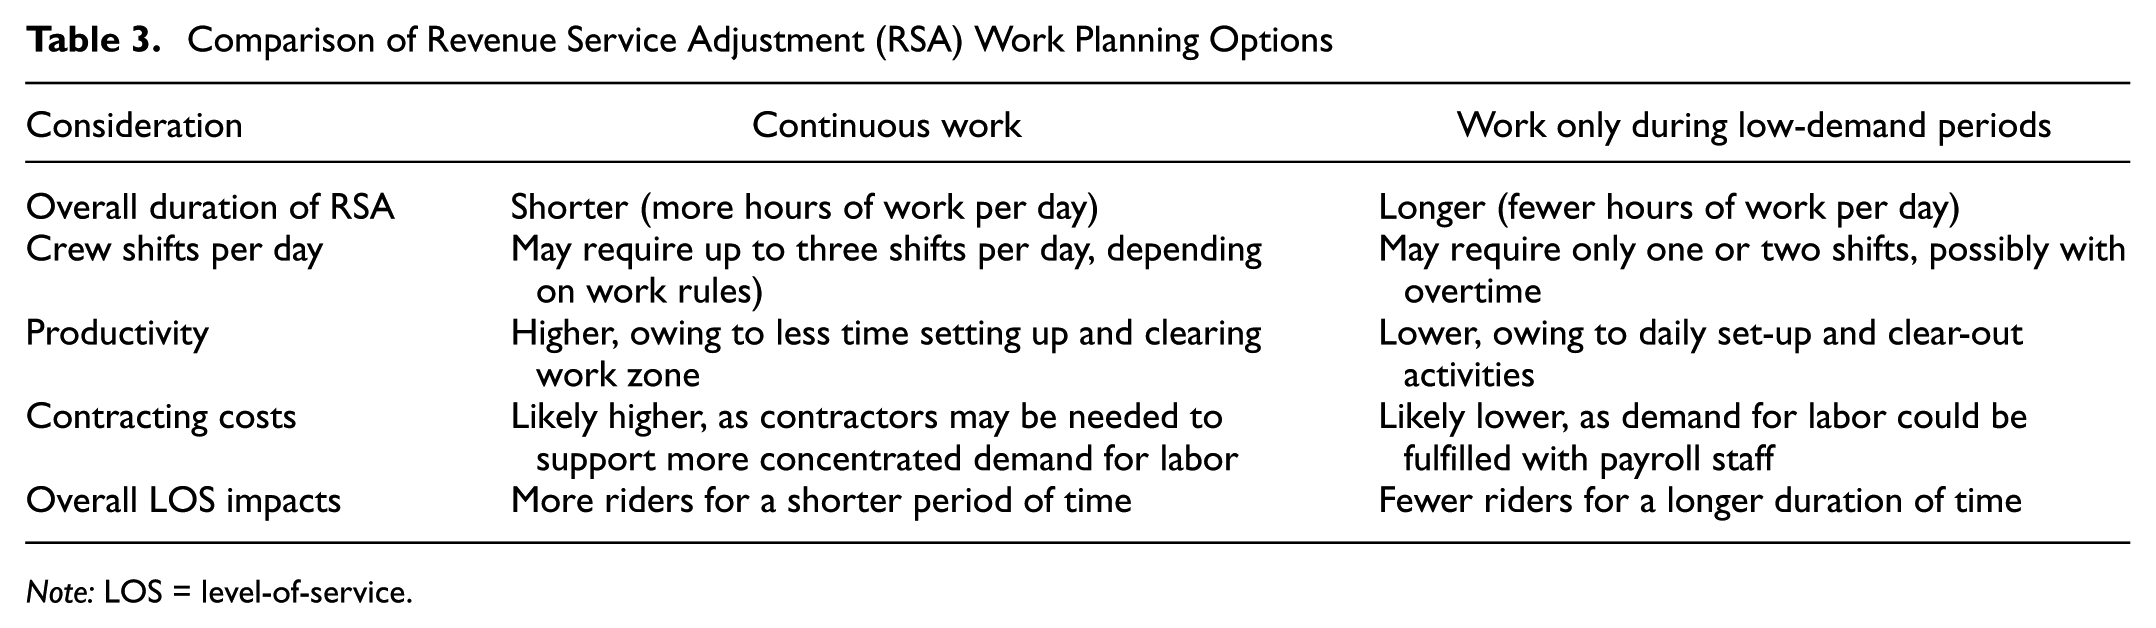
Note: LOS = level-of-service.
Neither case is clearly desirable over the other. Work that would require a higher-LOS-impact RSA to complete may justify a longer but less disruptive RSA; whereas time-sensitive or resource-consuming work may justify the productivity benefits of a continuous RSA. Moreover, the productivity impacts of splitting continuous work into daily periods of work are closely tied to the duration of set-up and clear-out activities.
Figure 3 outlines the related workflow. The inputs from the RSA service delivery strategy, specifically the aggregate LOS impacts by time period and day type, can be found as described in the previous section. The time periods and day types included should correspond to the different timing options considered by the planner: for example, hourly aggregate LOS impacts will allow for any combination of hours during the day to be considered for an RSA.
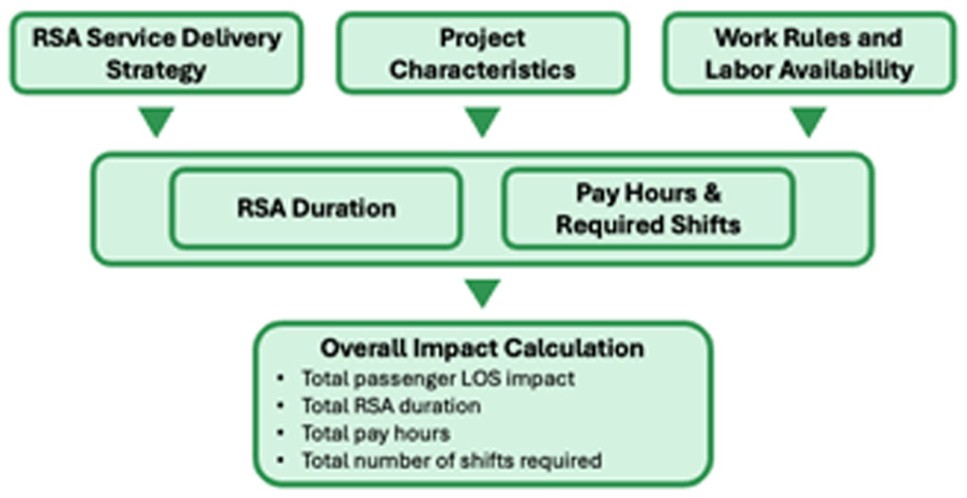
Revenue service adjustment (RSA) work planning flowchart.
The project characteristics are used to calculate the expected duration of the RSA (i.e., the number of days required for the work to be completed) under different timing options. The work rules are used to determine, for a given duration of engineering hours, the likely shift schedule and pay hours per day. By multiplying by the RSA duration, the total overall LOS impact, pay hours, and number of shifts required to complete the work can be calculated for each option.
RSA Duration
For any RSA, the distribution of set-up and clear-out times can be obtained from historical work log data across similar events. The following notation will be used:
T w : The total amount of productive time (time-on-tools, or wrench time) that will be required to complete the work activities
U s : A random variable representing the set-up time for the type of work involved. The set-up time is measured from the “beginning of engineering hours,” the time at which normal revenue service is considered to end
U c : A random variable representing the clear-out time for the type of work involved. Similarly to U s , U c should be measured to the end of engineering hours, that being the time at which revenue service is considered to start
Work is considered to be completed in deployments, d, consisting of an uninterrupted period of work

Furthermore, for any given deployment of duration T
d
, the productive time

Because U
s
and U
c
are random variables taking into account the uncertainty involved with the duration of set-up and clear-out activities, the number of deployments N
d
required to produce enough productive time to complete the project is also a random variable, and its distribution can be determined using a simulation process. Let Set replication i= 1 Set N
d
= 0 Set While Draw random
N
d
= N
d
+ 1
Repeat
The planner can use the resulting distribution to choose an acceptable percentile for planning purposes. For example, choosing the 95th percentile of the RSA duration distribution represents a conservative choice, implying that, on average, only 1 out of 20 RSAs would have work remaining after the allotted number of days have expired.
Pay Hours and Required Shifts
The following terms will be used throughout this section:
The conversion from engineering hours to pay hours and shifts is not necessarily straightforward. Off-site equipment and materials staging requires crew hours to be spent before the commencement of engineering hours. In addition, report locations may not be the same as the yards, depots, or stations from which crews will travel to the work zone, requiring crew hours for travel before and after the duration of engineering hours. Finally, the way in which required crew hours translate to pay hours depends on whether hours beyond a standard-length shift (typically 8 or 10 h) are achieved through overtime (i.e., extending the length of the shift) or through scheduling another standard-length shift for that day. While scheduling overtime can be expensive, it is sometimes justified by the lower number of shifts used (e.g., this may result in fewer shifts being diverted from other projects).
The following notation will be used to demonstrate the calculation of pay hours and shifts:
E: daily engineering hours
t g : time for staging at the report location + travel (for the first crew to arrive at a work site)
t r : time for relief travel (between crew changeovers)
t f : time for travel back to the report location + clean-up activities (for the last crew)
t s : regular shift duration
n s : number of crew shifts per day
h r : regular crew pay hours per day
h o : overtime crew pay hours per day
p o : overtime pay rate
If minimizing shifts is prioritized over minimizing pay hours, then

The number of engineering hours allocated to each type of shift is:
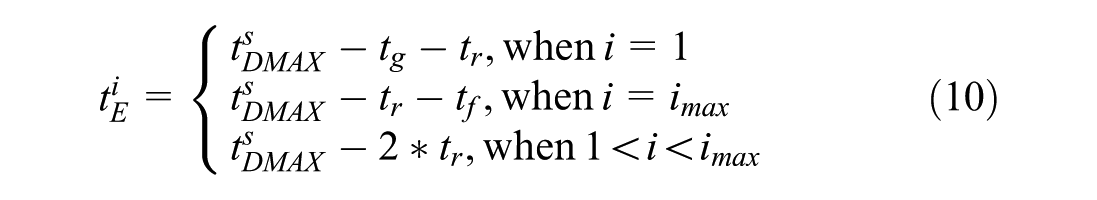
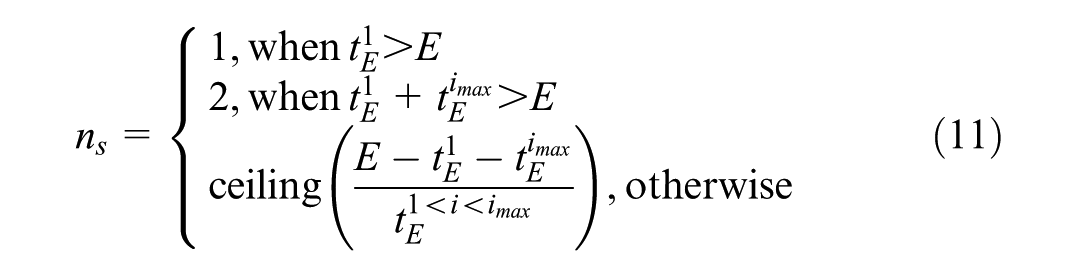
The number of crew shifts is calculated as follows:
The regular crew pay hours are given by:

Finally, the overtime crew pay hours are given by:

A graphical illustration of the way in which engineering hours are fulfilled by crew hours is shown in Figure 4. In this example, 11 engineering hours are shown to require a minimum of two 8-h shifts. Note that the engineering hours do not contribute in their entirety to productive time, as some travel and work zone set-up or clear-out activities typically can occur only while revenue service is not running.

Shift scheduling example: 16 h worked to 11 h of productive time.
Overall Impact Calculation
The passenger LOS, shift schedule, and pay hours are impacts at the daily level. However, the overall impacts of an RSA must be considered for the entire duration of the RSA, particularly as the duration of the RSA varies with the engineering hours scheduled. Moreover, some RSAs may require supplementary work, defined here as additional periods of work for the sole purpose of staging equipment/materials at the work zone before the RSA or removing equipment/materials from the work zone following the RSA. If the RSA is scheduled over a single period of consecutive days, then any impacts to LOS, pay hours, and so on only need to be calculated for the beginning and the end of the RSA, respectively. However, if the RSA is scheduled over several nonconsecutive periods (e.g., only on weekends), then supplementary work may be necessary for each period worked.
The methods in this subsection are generic for all types of quantified considerations (LOS, number of shifts, pay hours, etc.) so long as the magnitude of the impact can be estimated on a per-day basis for each relevant day type (e.g., by using the methods described in the previous two subsections). The following notation is used:
Q: the total quantity of a particular impact (e.g., the total LOS impacts measured in passenger-hours, the total pay hours, etc.)
q i : the quantity of the impact accrued if each day type i has an RSA
n
c
: number of consecutive periods worked. For an RSA occurring on consecutive days, n
c
= 1. However, a weekend RSA may need
q s : the quantity of the impact accrued owing to a period of supplemental work.
In the case where an RSA is scheduled across consecutive days, it is still important to differentiate between weekend days and weekdays that are affected, as weekends usually feature lower demand than weekdays. This is relevant for the calculation of total LOS impacts. Generally, if it is possible to schedule the duration of the RSA to cover as many weekend days as possible, this is desirable to minimize the affected weekdays.
The total quantity Q can be found as follows:

Q can be found for every relevant consideration for an RSA with a certain number of engineering hours every day. By comparing the magnitudes of these considerations for a variety of engineering hour options, RSA planners can consider the trade-offs between LOS impacts and work productivity to find an acceptable balance.
Case Study and Discussion
The RSA design approach described above has been applied in a real-world case study to evaluate potential RSA options for the Red Line at the Washington Metropolitan Area Transit Authority (WMATA). One track was taken out of service between Friendship Heights and Van Ness-UDC during weekends, beginning in October 2023 and still ongoing (Figure 5) for the purpose of tunnel leak mitigation. In real life, the RSA was accomplished by single tracking, with a supplemental short-turning service provided east of Dupont Circle. Under normal service the line operates at 6-min headways on weekends.
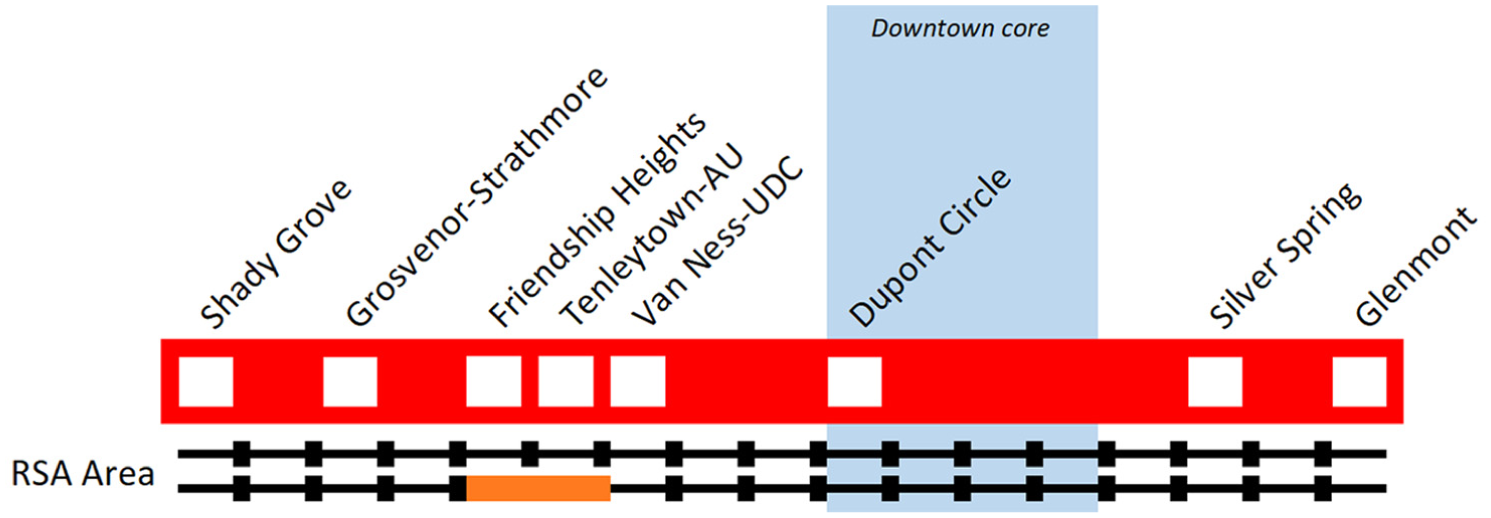
Washington Metropolitan Area Transit Authority (WMATA) Red Line schematic.
The Red Line features two tracks along its entire length and cannot support express services. The availability of yards and pocket tracks throughout the line ( 18 ) provides for operational flexibility for different service patterns and the possibility of adding supplemental short turns.
Service Delivery Strategies
A variety of single tracking and overlapping sections options were considered in the analysis. Given the operational challenges of manual interlocking operations involved with supplemental short turns, it was decided (in real life and in the case study) that only one supplemental short-turning service could be supported. In addition, stop-skipping was ruled out owing to unacceptably large increases in the wait time, transfer time, and in-vehicle travel time for OD pairs originating within or destined for the stations in the RSA area.
With these considerations, three alternatives are compared: a) is a single-tracking strategy with an 18-min headway through the single-tracked area (calculated from Equation 1) and a supplemental short-turning service between Dupont Circle and Glenmont; b) is a conservative overlapping sections strategy using headways that have been tried in practice in a real-world trial of an 8-min turnaround at Van Ness-UDC (February 24–25, 2024); strategy c) is a more optimistic overlapping sections strategy based on theoretical run times (calculated from Equation 2) and layover times practiced in similar contexts at other locations of the network (e.g., Mt. Vernon Square). The three designs are summarized in Figure 6.
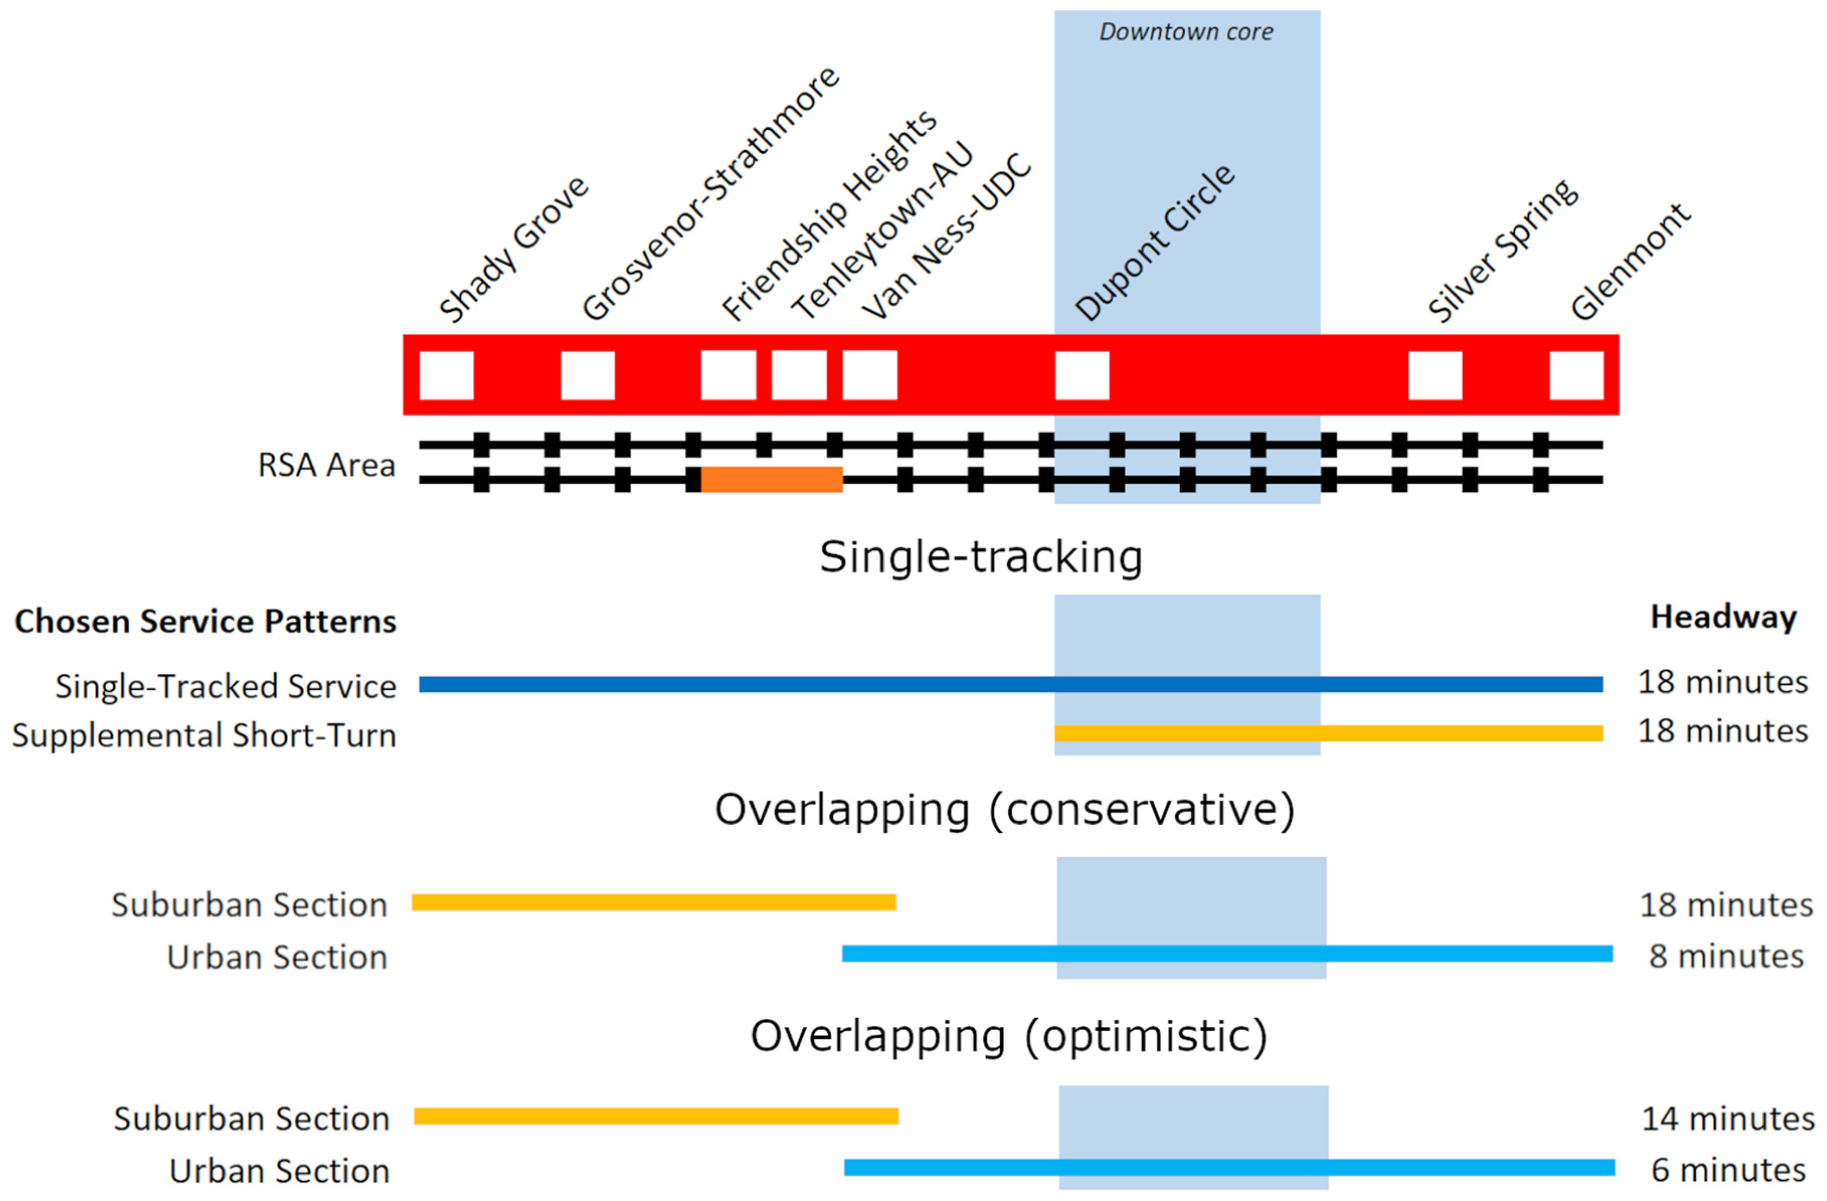
Revenue service adjustment (RSA) design comparison.
For single tracking, the downtown core and points east are served at a 9-min headway, but points west of Dupont Circle are served at an 18-min headway. It is assumed that all riders needing to access stations beyond Dupont Circle wait for the non-short-turning service pattern.
Similar to the single tracking, passengers boarding or alighting on the suburban section of the conservative overlapping sections will also face an 18-min headway. However, if they are continuing through the transfer at Van Ness-UDC, they will incur an additional wait time. Passengers east of Van Ness-UDC on the urban section benefit relative to the single tracking, as the headway is slightly lower (8 min versus 9 min). In both overlapping sections alternatives, the transfer is a cross-platform transfer at Van Ness-UDC, and it is assumed that transfers are not timed.
The layout of the service patterns for the optimistic overlapping sections is identical to that of the conservative overlapping sections; however, the headways of the suburban and urban sections have decreased from 18 to 14 min and 8 to 6 min, respectively. It should be noted that, although these headways are theoretically possible and based on similar operations elsewhere in the system, there is a possibility of reliability issues with these headways, and therefore the LOS impacts for this scenario should be viewed as a lower bound.
Overall Performance
Table 4 summarizes the wait + weighted transfer time (WTT) impacts and in-vehicle travel time (IVTT) impacts for the three RSA designs. The impacts are expressed with reference to the ratio between the RSA case and the baseline case (e.g., a WTT ratio of 3.0 means that the wait + weighted transfer time in the RSA case is three times as high as in the baseline case). All ODs are included in the calculation, including those that are not affected by a particular RSA design, as different RSA designs impact different groups of ODs.
Comparison of Case Study Revenue Service Adjustment (RSA) Designs
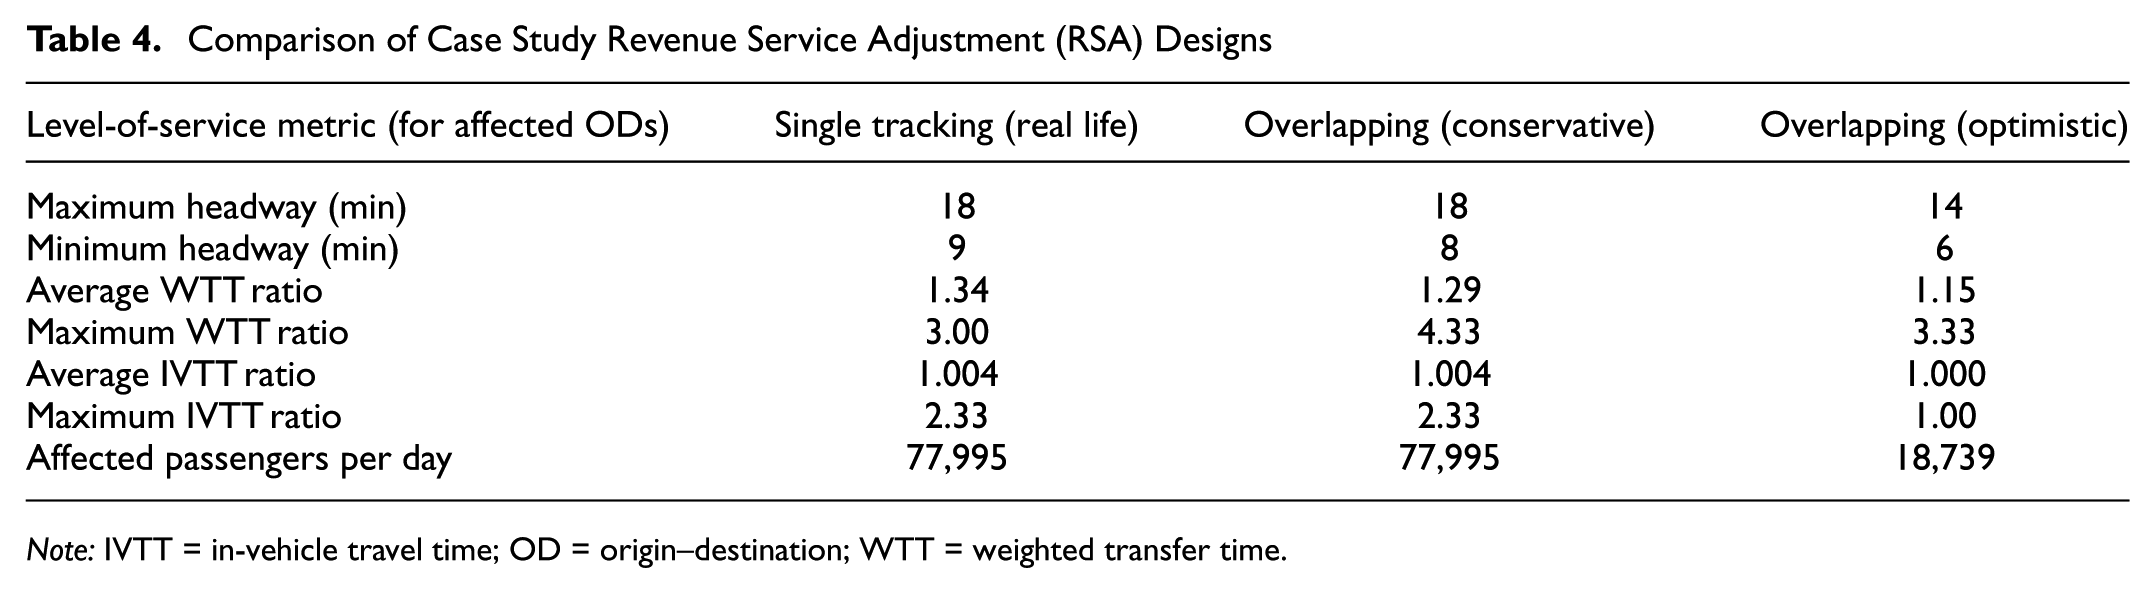
Note: IVTT = in-vehicle travel time; OD = origin–destination; WTT = weighted transfer time.
WTT is the largest source of LOS impacts. The average WTT ratio compared with baseline is highest for single tracking at 1.34 of normal service, and decreases to 1.29 for conservative overlapping sections and to 1.15 for the optimistic overlapping sections. The results demonstrate that headways impact both the wait and transfer time for passengers traveling across sections. Single tracking distributes the WTT impacts across OD pairs more evenly than the overlapping sections strategies. Although it has the highest headways, no groups of passengers are subjected to an additional transfer, giving it a lower maximum WTT (a ratio of 3.00) than even the optimistic overlapping sections alternative (ratio of 3.33).
Given the nature of service suspensions (all sections of the network are still served by service patterns similar to what is normally offered), average IVTT changes are small; the cases where IVTT changes are high are attributable to the rerouting of short trips in the downtown core.
The number of affected passengers per day is considerably lower for optimistic overlapping sections. This is because the 6-min headway through the downtown core is identical to normal weekend service, resulting in no changes in wait time nor any rerouting in the highest-demand section of the line.
Impact Distribution
Figure 7 shows the IVTT and WTT ratios for the three strategies. The color of the dots corresponds to the total volume of riders across all origin–destination (OD) pairs that experience that combination of change in IVTT and WTT. (Color online only.)
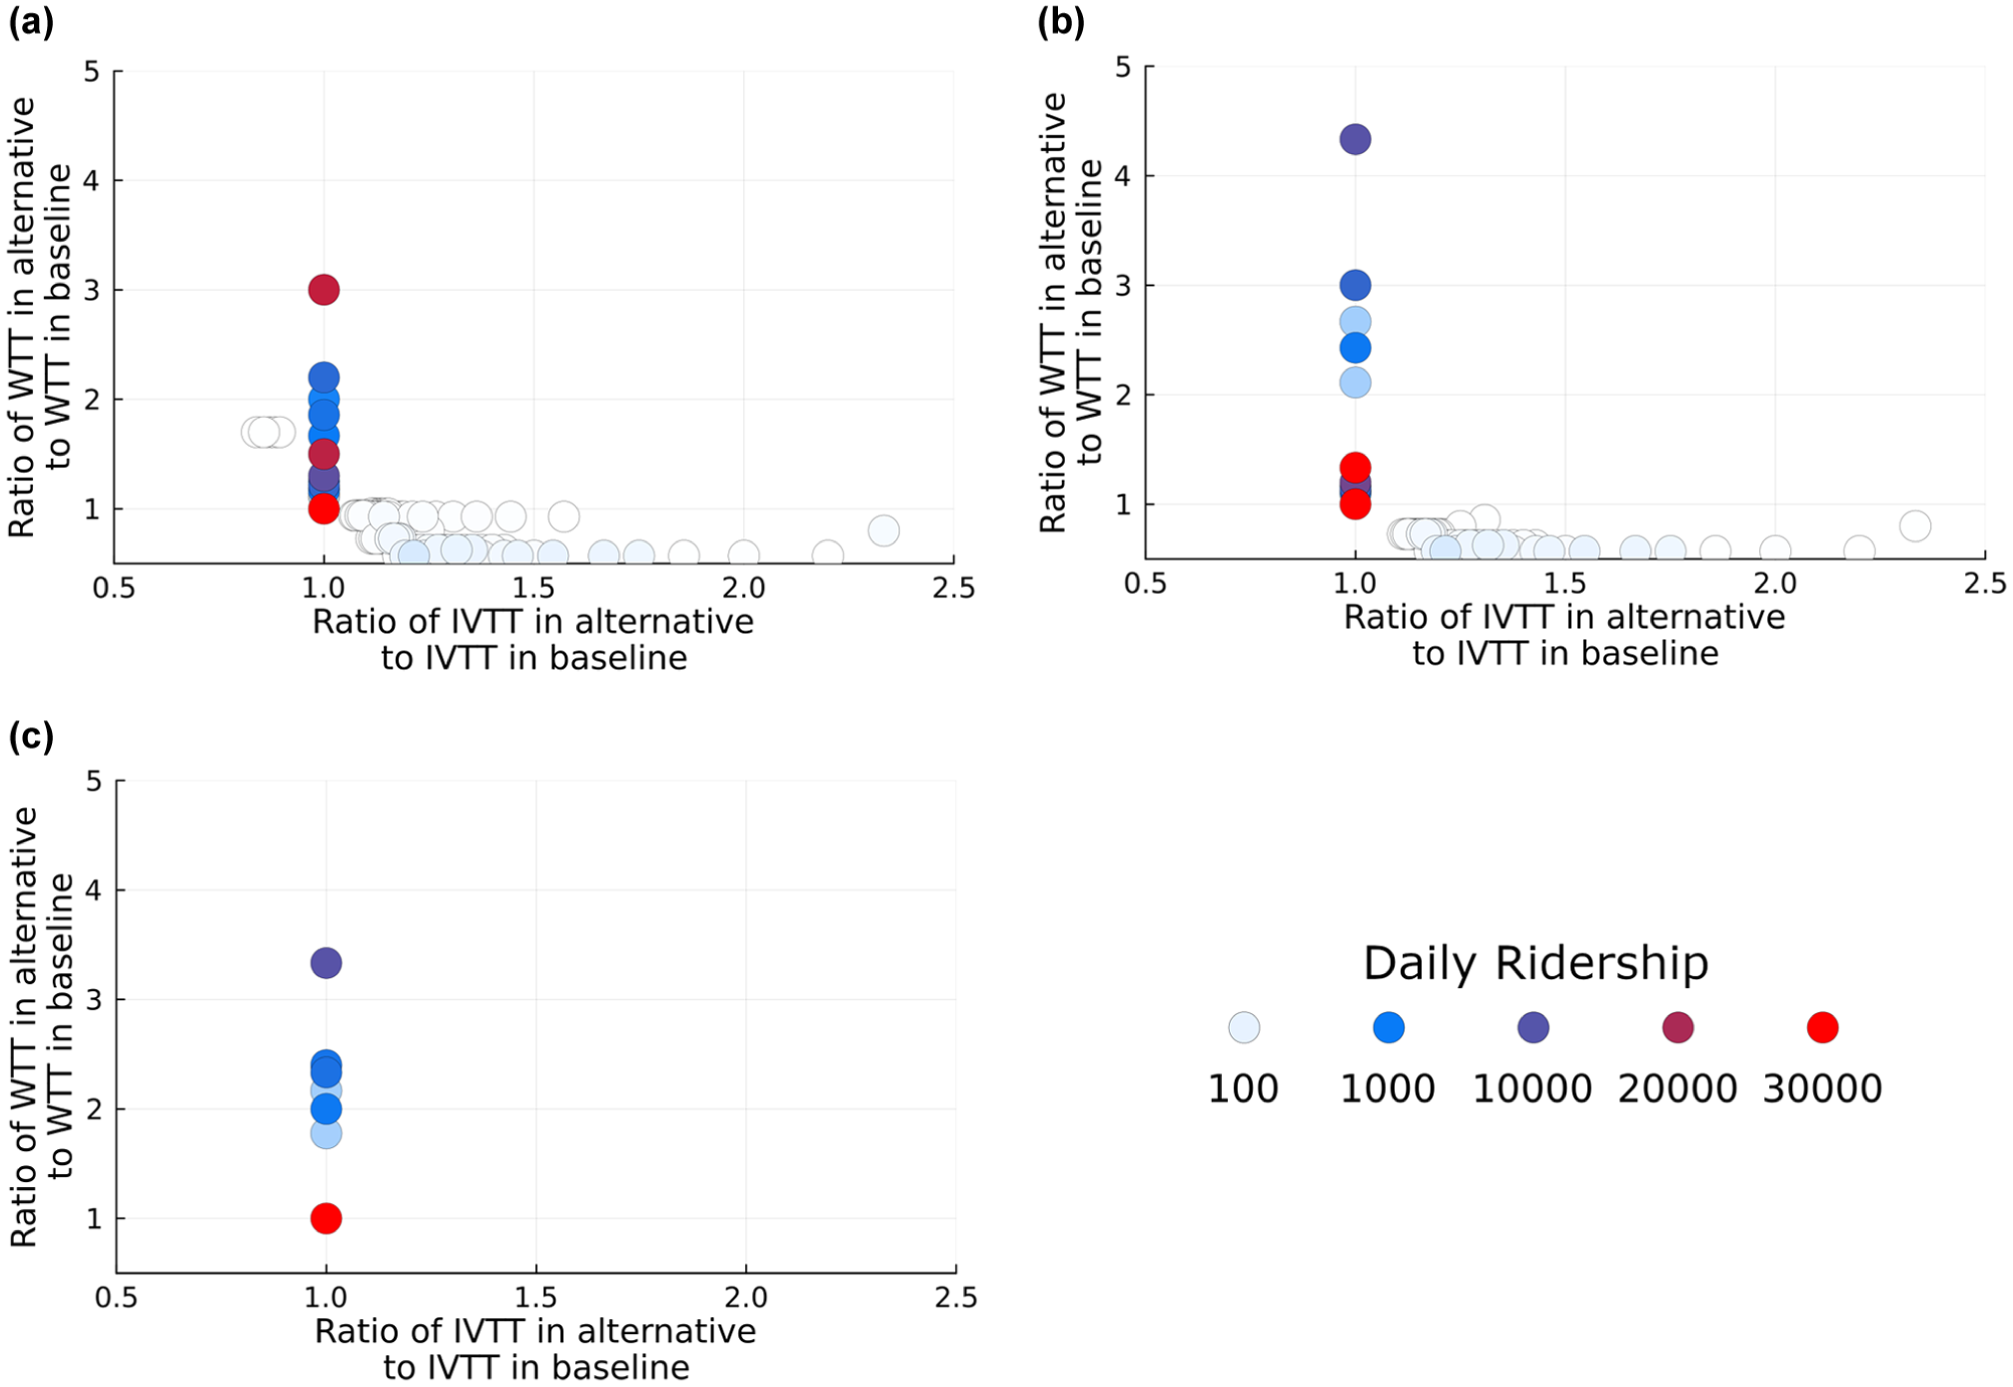
Origin–destination (OD)-level impacts for various revenue service adjustment (RSA) designs: (a) single tracking, (b) overlapping (conservative), and (c) overlapping (optimistic).
The single-tracking alternative service plan is shown in Figure 7a. There are large groups of riders with no change in their baseline IVTT but WTT ratios of 1.0, 1.5, and 3.0, respectively. The first group represents riders whose trips are unaffected by the RSA. The second group represents riders whose trips require the use of the eastern side of the Red Line, where headways have increased from 6 to 9 min; and the third group represents riders whose trips require the use of the western side of the Red Line, where headways have tripled from 6 to 18 min. Additional lower-ridership ODs scattered throughout the plot represent instances where rerouting via a different line becomes more optimal from an overall travel time perspective (the large increases in IVTT observed for some ODs represent short downtown trips where the WTT comprises an outsize portion of the overall travel time).
Figure 7b shows the IVTT and WTT under the conservative overlapping sections strategy. The largest group of affected riders now only experiences a WTT ratio of 1.33 compared with baseline, as opposed to 1.50 in the single-tracking case. However, although there are less riders in the group with the worst WTT impacts than in the single-tracking case, the impact itself is more severe as their WTT ratio is 4.33, owing to the additional transfer.
Similarly to the single tracking, wing to the higher headways on all sections of the Red Line, there are some groups of passengers who reroute their trips (as the assignment model optimizes for the shortest travel time for each OD pair) and therefore both WTT and IVTT change.
Figure 7c summarizes the impact on IVTT and WTT under the optimistic overlapping sections strategy. The LOS impacts are distinct from the other designs. Because the frequency of the urban section is identical to the 6-min headway normally scheduled on weekends on the Red Line, the majority of riders see no change in their WTT. Smaller groups of riders experience up to 3.33 times their baseline WTT owing to the suburban section headway and the transfer at Van Ness-UDC.
These differences illustrate that service planners have some degree of flexibility to allocate the impacts of RSAs through service planning. Equity considerations, passenger capacity considerations, trip purpose considerations, and operational considerations could all play a role in determining whether it is more appropriate to optimize for a lower overall LOS or to reduce the impact of the extremes, and the trade-offs are likely to be unique to the circumstances of the particular RSA.
Work Planning Trade-Offs
As of May 2024, the combined weekend RSAs in support of this project had logged 443 productive hours. For this exercise, 443 h was set as the total productive time required to complete the activity (as referenced in Equation 7). Set-up times and clear-out times, which are used in Equation 8, were obtained from daily work logs and ranged from 1.3 to 5.3 h for set-up activities and 1.4 to 3.7 h for clear-out activities. In the case that the set-up time and clear-out time exceeded the engineering hours, that deployment was still counted toward the total duration of the RSA, but no productive time was counted toward the total productive time required. The duration of an RSA was set to the 95th percentile of the distribution of durations calculated through simulation.
In 2023 and 2024, a typical non-RSA night provided 5 engineering hours (from midnight to 5 a.m.). To create RSA scenarios with additional (consecutive) engineering hours, an hour would be added to the beginning or end of the prior engineering hours based on whichever option had the lower LOS impact. For example, to create a scenario with 6 engineering hours, 1 h of single tracking between 11 p.m. and midnight has a lower LOS impact than 1 hour of single tracking between 5 a.m. and 6 a.m.; therefore, the scenario with 6 engineering hours starts from 11 p.m. and runs until 5 a.m., with 1 h of revenue service affected. This process was repeated until all scenarios between 5 engineering hours/no RSA and a 24-h-per-day RSA were created.
The overtime rate was set at 1.5×. It was assumed that overtime was only necessary in cases where shifts exceeded 8 h. The choice between adding overtime versus adding another 8-h shift was made on the basis of existing typical practice at WMATA, leading to a maximum of three shifts per day for a 24/7 RSA.
LOS impacts are calculated on the basis of the single-tracking service plan eventually adopted by WMATA. Figure 8 shows how RSA duration and LOS change as engineering hours are increased. RSA duration, shown as a blue line, corresponds to the left y-axis. (Color online only.) Without any RSA (i.e., 5 engineering hours per day), 691 workdays are required to complete the project. With 1 h of RSA per day (providing 6 engineering hours per day), the duration of the RSA decreases to 354 days. The duration follows a trend of diminishing returns, and a 24/7 RSA requires only 29 workdays to complete the project.
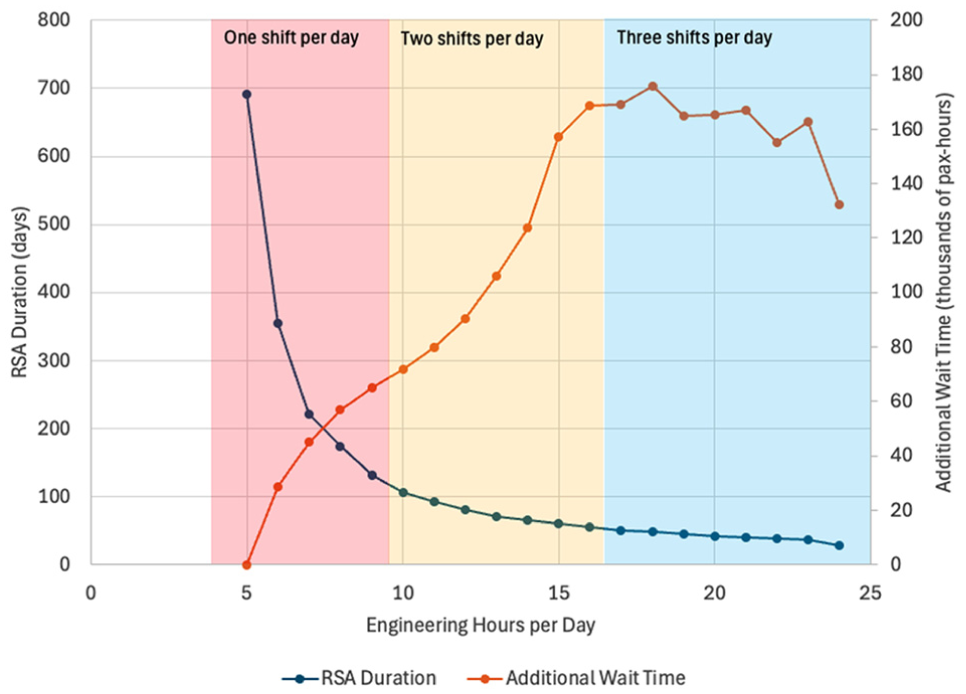
Revenue service adjustment (RSA) duration versus additional wait time. (Color online only.)
LOS impacts are measured as regards additional wait time, which is the total increase in wait time over the entire duration of the project. This is shown with the orange line and corresponds to the right y-axis. (Color online only.) At 5 engineering hours per day, (i.e., without any RSA), the additional wait time is zero, as the service is identical to baseline conditions. Between 5 engineering hours and 15 engineering hours, the LOS impacts grow steadily, although the marginal increase in wait time is highest between 14 engineering hours and 15 engineering hours, when the 5 p.m. to 6 p.m. PM peak service is affected. However, past 15 engineering hours, the marginal decrease in RSA duration largely cancels out the marginal increase in wait time per day, leading to a relatively steady trend in the additional wait time. Between 23 engineering hours and 24 engineering hours, the additional wait time drops considerably. This is attributed to the efficiency benefits of a 24/7 RSA; specifically, that daily set-up and clear-out is no longer needed and therefore the RSA duration decreases substantially from 23 engineering hours to 24 engineering hours.
It should be noted that points on the plot between 10–12 engineering hours per day and 23 engineering hours per day are not likely to be encountered in real life, as they affect peak demand periods. If the benefits of work productivity or project cost are compelling enough to enact an RSA during the peak period(s), then it is more productive and less impactful (owing to the shorter RSA duration) to schedule a 24/7 RSA.
To more directly illustrate the trade-offs between LOS and cost, Figure 9a shows the comparison between pay hours and total additional wait time. The trend of diminishing returns is more pronounced for pay hours than for RSA duration. However, there is still a large decrease in the total pay hours for the first few additional engineering hours.
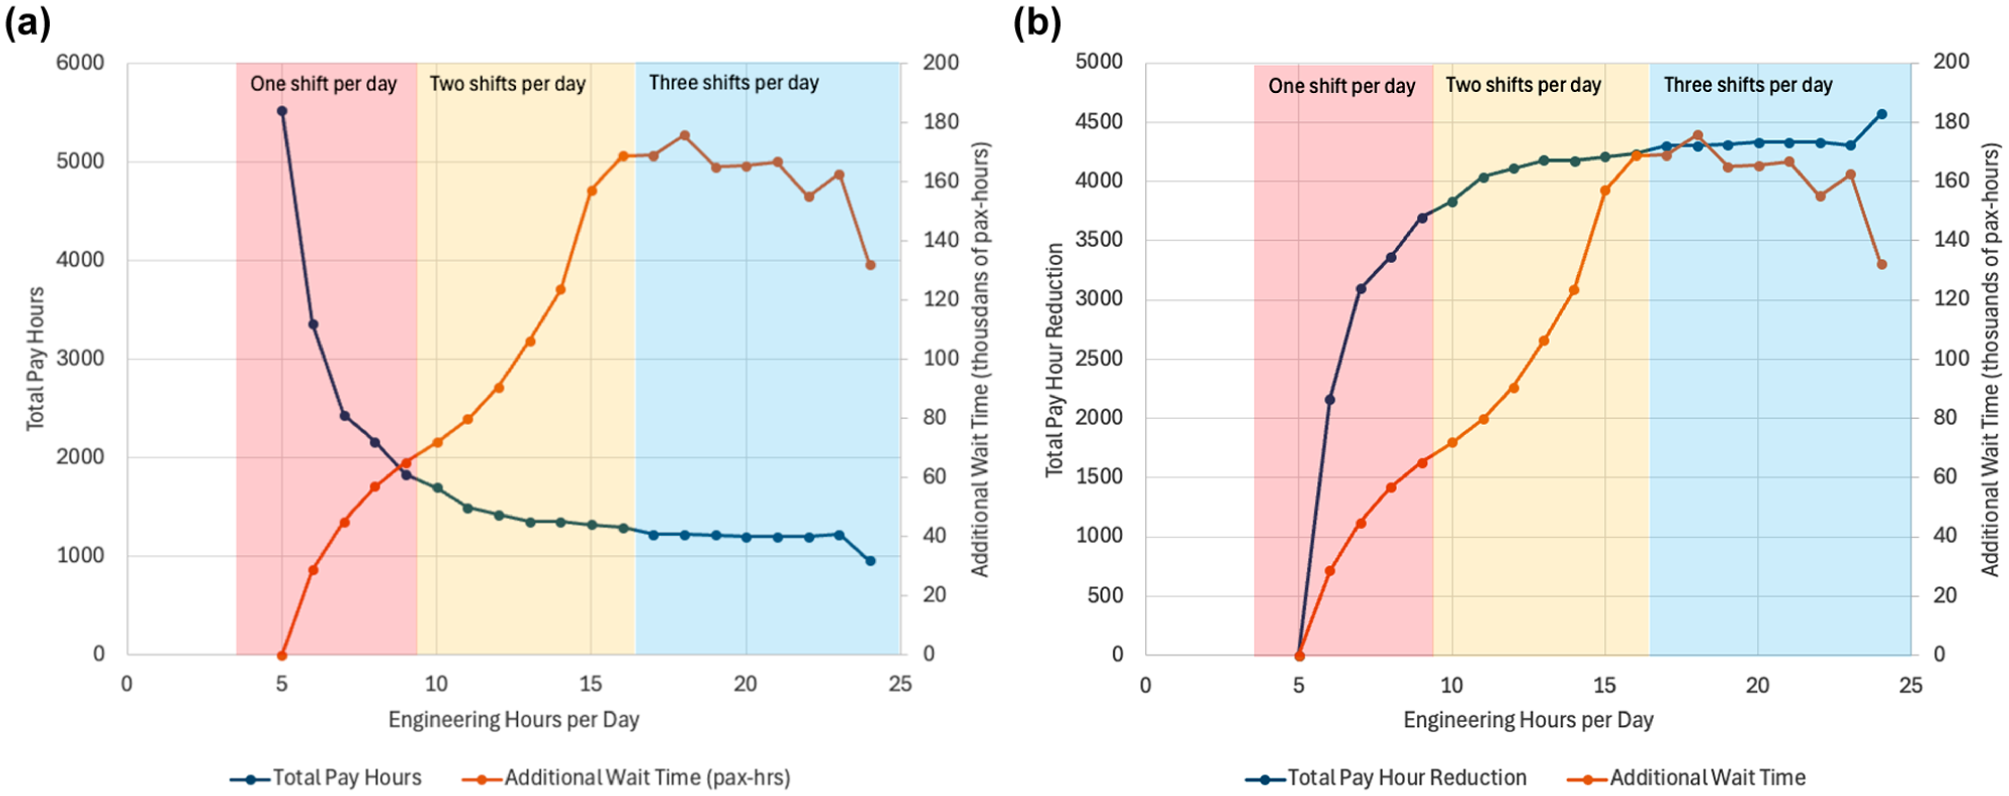
Total pay hours: (a) and pay hour reduction and (b) versus additional wait time.
Figure 9b shows the pay hours expressed relating to reduction from the baseline case (i.e., 5 engineering hours, which does not require an RSA). For example, 5,528 pay hours would be required to complete the project with 5 engineering hours per day. If 6 engineering hours per day are provided, 3,363 pay hours are required, resulting in a pay hour reduction of 2,165. By comparing the pay hour reduction with the additional wait time, it can be observed that the slope of the pay hour reduction curve is steeper than the slope of the additional wait time curve between 5 and 8 engineering hours per day. Although the two lines are on different scales, one interpretation is that, compared with a 24/7 RSA, which has maximum work productivity but near-maximum passenger impacts, an RSA of two hours per night provides roughly 72% of the pay hour benefit of a 24/7 RSA with only 34% of the wait time impacts.
A similar but distinct trend can be observed when comparing the total number of shifts with the additional wait time, as shown in Figure 10a. The sensitivity of the number of the shifts to shift scheduling rules is demonstrated by the increases in number of shifts between 9 and 10 engineering hours and again between 16 and 17 engineering hours.
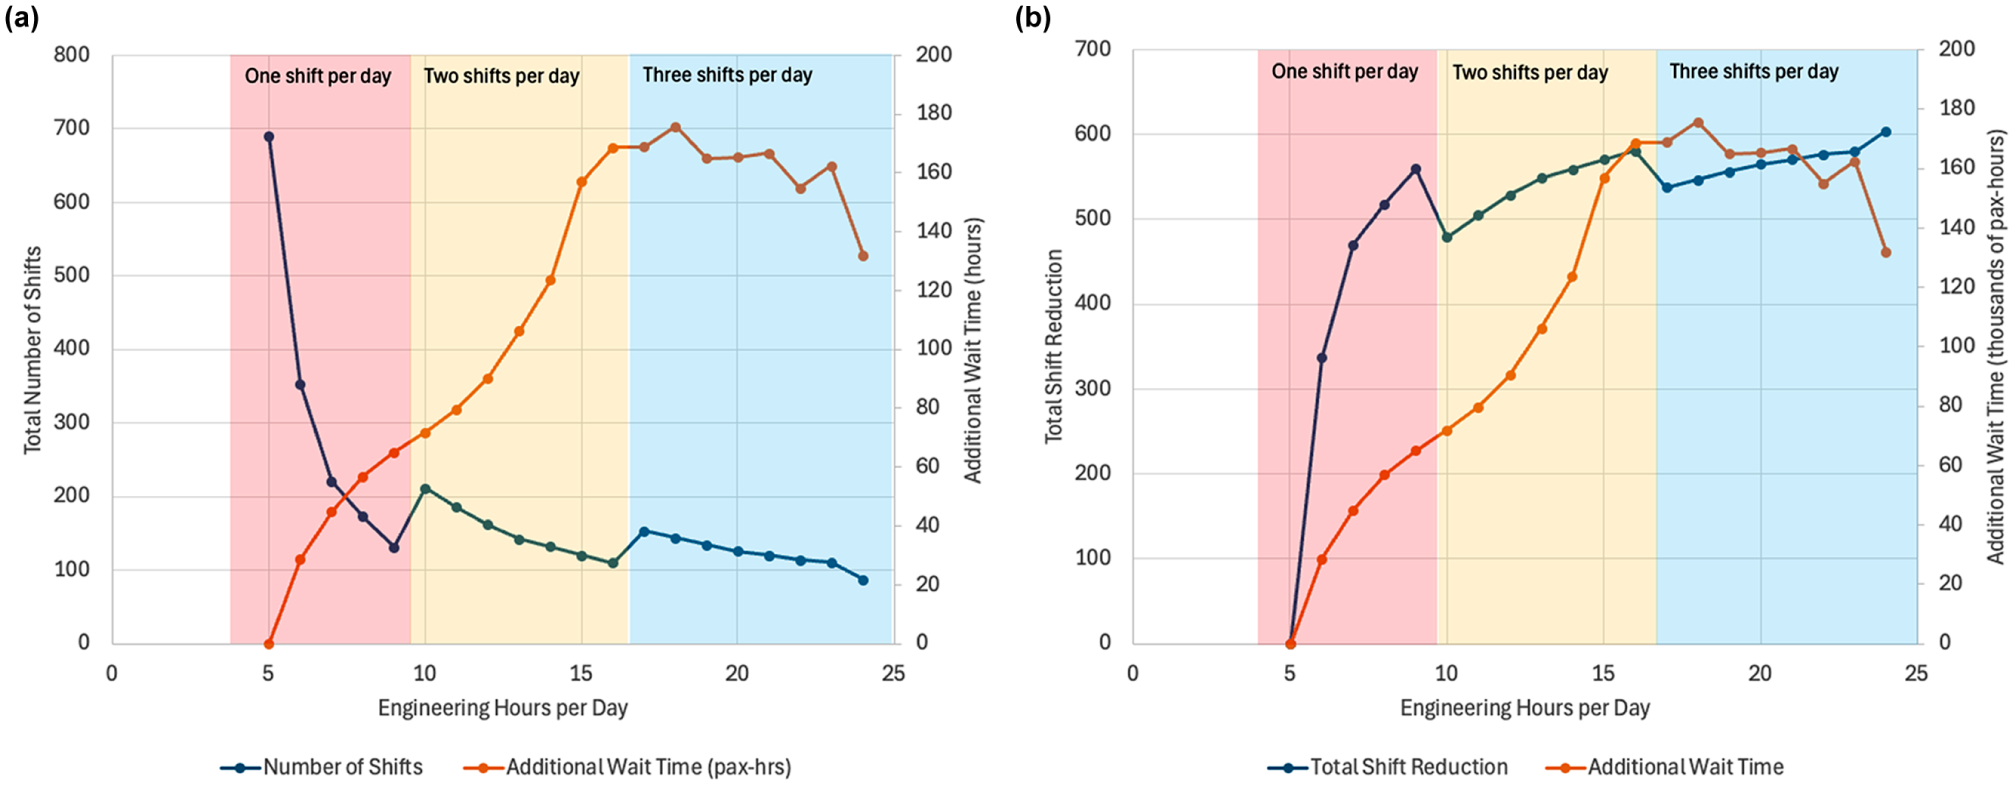
Number of shifts: (a) and shift reduction and (b) versus additional wait time.
In general, however, the productivity gains for shifts when adding additional engineering hours beyond the baseline follow a similar trend to that of pay hours. As shown in Figure 10b, which shows the reduction in shifts relative to the total required in the baseline case, RSAs of shorter durations (2 to 3 h, for a total of 7 to 8 engineering hours per day) reduce the number of shifts by 78 to 86% relative to the reduction of the 24/7 RSA, respectively, whereas the additional wait time impacts are less than half of what is observed in the 24/7 RSA.
While the above plots are helpful for comparing relative impacts and costs, it is difficult to generalize an absolute comparison between LOS impacts and work productivity/costs. The LOS impacts of an RSA are largely dependent on the demand along the OD flows affected by the RSA, which vary depending on their location in the network. Likewise, a project that involves large crew sizes or long set-up and clear-out times will benefit more from the productivity benefits of higher engineering hours per day than projects with small crew sizes and short set-up and clear-out times.
Conclusion
LOS impacts from RSAs are difficult to avoid, as urban railway systems provide high-frequency operations under normal conditions, and building network redundancy can be prohibitively expensive. However, a thorough and holistic process to design and compare RSA service delivery options early on in the planning process gives operators more flexibility to mitigate LOS impacts.
A taxonomy of RSA service delivery strategies allows for all options to be initially considered, with their typical LOS impacts and operational considerations weighed against the operator’s goals. Then, optimization of each of the service delivery strategies under consideration results in a set of actionable service plans to compare and contrast. By measuring impacts at the OD level, the trade-offs between the strategies become more visible, and operators can tailor strategies to meet the needs of their passengers. This also provides more visibility toward the passengers most affected by RSAs in the planning process, allowing operators to better target resources at these passengers to mitigate the impacts of the RSAs, such as by bolstering alternative services, updating trip planning tools, or improving communication. Lastly, considering different work planning options for the duration and timing of RSAs can allow for work productivity to be balanced against LOS impacts.
Overall, identifying RSAs with lower LOS impacts can increase opportunities for operators to perform critical maintenance activities during revenue hours, taking pressure off night crews and reducing the long-term risk of infrastructure failures. Although RSAs are inconvenient for passengers, the impacts of deferred maintenance can be far worse, and an array of high-performing, low-impact RSA options is a critical tool for keeping operations safe and efficient.
Footnotes
Acknowledgements
The authors would like to thank various staff and groups at the Washington Metropolitan Area Transit Authority for their input and collaboration. In addition, the authors would like to thank members of the MIT Transit Lab for overall feedback on the research direction and presentation.
Author Contributions
The authors confirm contribution to the paper as follows: study conception and design: John Takuma Moody, Haris N. Koutsopoulos; data collection: John Takuma Moody, Haris N. Koutsopoulos; analysis and interpretation of results: John Takuma Moody, Haris N. Koutsopoulos; draft manuscript preparation: John Takuma Moody, Haris N. Koutsopoulos. All authors reviewed the results and approved this version of the manuscript.
Declaration of Conflicting Interests
The authors declared the following potential conflicts of interest with respect to the research, authorship, and/or publication of this article: John Takuma Moody and Haris N. Koutsopoulos have received funding from the Washington Metropolitan Area Transit Authority (WMATA), the case study in this research.
Funding
The authors disclosed receipt of the following financial support for the research, authorship, and/or publication of this article: Funding for this research comes from the Washington Metropolitan Area Transit Authority (WMATA) through their Academic Research Partnership with the MIT Transit Lab.