
Abstract
This paper considers the impact of state-owned enterprises on economic growth in China. We consider several possible channels through which state-owned enterprises might play a pro-growth role: first, stabilizing growth in economic downturns by carrying out massive investments; second, promoting technical progress by investing in riskier areas of technology; third, by following a high-road approach to treating workers by paying a living wage which is favorable for China to move toward a more sustainable growth model in the future. Our empirical analysis finds that a higher share of state-owned enterprises is favorable to long-run growth and tends to offset the adverse effect of economic downturns on the regional level.
1. Introduction
State-owned enterprises (SOEs) have played an important role in the Chinese economy. By SOEs, we refer both to state-owned enterprises and state-holding corporations, not including state-owned or state-holding financial institutions. In 2015, the total profits of SOEs reached 2.3 trillion yuan, which accounted for 13.2 percent of the total operating surplus in the whole economy. SOEs’ role is even more important in taxes. In 2015, taxes from SOEs accounted for 30.9 percent of China’s total tax income (SASAC 2016; NBS 2017). In China’s industrial sector for which more data are available, 1 SOEs accounted in 2015 for 38.8 percent of assets, 21.8 percent of revenue, 17.2 percent of profits, and 18.2 percent of employment (NBS 2017). In 2015, the pre-tax profits of China’s SOE sector were roughly one half of the amount of pre-tax profits in the US non-financial corporate sector (BEA 2017).
In this paper, we investigate the impact of SOEs on China’s economic growth. While a sole focus on GDP growth is not desirable for a developing country, a high but sustainable output growth rate is an important goal. This paper finds evidence that a large share of SOEs has a positive impact on long-run GDP growth and also on macroeconomic stability.
The growth effect of SOEs has always been controversial in the literature. Conventional wisdom suggests that SOEs reduce economic growth because they are inefficient on the micro level (e.g., Chen and Feng 2000; Lin and Liu 2000; Brandt and Zhu 2010), or they absorb scarce resources that could be used more efficiently by private enterprises (e.g., Jefferson 1998). We argue that there are major deficiencies in both the empirical and theoretical aspects of the conventional wisdom.
First, the conventional wisdom has not taken into account the difference in working hours between SOEs and private enterprises when it compares micro efficiencies based on labor productivity or total factor productivity. Working overtime is far more common in private enterprises than in SOEs in China. According to the Sixth National Survey on Workers’ Conditions, conducted by the All-China Federation of Trade Unions in 2006, the working week (i.e., working hours per week) was 46.14 hours in SOEs, compared to 53.16 hours in private enterprises (ACFTU 2010). 2 Measuring labor input by the number of workers instead of working hours will overestimate the micro efficiency of private enterprises relative to that of SOEs.
Second, the conventional wisdom conflicts with the evidence that SOEs have performed quite well in promoting technical progress, which we present in Section 3.3 below. Technical progress plays a central role in economic growth.
Third, enterprise efficiency is a micro issue, but economic growth is a macro process. One cannot tell whether enterprises are favorable for economic growth on the basis of micro efficiency. Greater micro efficiency means higher potential profitability, but a series of conditions have to be met in order to transform potential profitability into sustainable and rapid economic growth, among which sufficient demand, technical progress, and the reproduction of labor power are most important. Although SOEs might be less profitable than private enterprises, they can create economy-wide positive externalities that promote economic growth. For instance, Bai et al. (2000) argued that SOEs provide a social safety net to the unemployed, which is important to social stability and the productivity of the whole economy. Lo and Zhang (2010) and Lo and Li (2011) argued that SOEs are the institutional basis of the Kaldor-Verdoorn effect that has promoted productivity growth in China.
In this paper, we argue that SOEs have played a pro-growth role in the Chinese economy in several ways: first, SOEs play the role of an economic stabilizer, offsetting the adverse effect of economic downturns; 3 second, SOEs promote technical progress by carrying out investments in risker technical areas. In addition, SOEs have established a high-road approach to treating workers by providing workers with a living wage, which is crucial for the reproduction of labor power. We suggest that this high-road approach has a potential pro-growth role, which is favorable for the transition of the Chinese economy to a more sustainable growth model in the near future. SOEs appear to be less profitable than private enterprises; however, the higher profitability of private enterprises to a large extent results from the intense exploitation of their workers. If the profits of private enterprises are invested, the result is growth—but profits of private enterprises also go to dividends and non-productive uses such as speculative purchase of existing assets. This line of argument motivates an examination of the data to determine whether SOEs are associated with faster growth. We use a fixed-effect model to estimate the effect of SOEs on regional economic growth.
In what follows, this paper is organized into four sections. Section 2 is a literature review. Section 3 discusses possible ways in which SOEs in China contribute to economic growth. Section 4 empirically examines the effect of SOEs on economic growth. Section 5 concludes the paper.
2. Literature Review: Is There a Consensus?
The theoretical literature concentrates on micro efficiency rather than the growth effect of SOEs. Zhang (1995) and Zhou (2000) suggest that SOEs are inefficient at the micro level due to the principal-agent problem and the soft-budget problem. However, given the separation of ownership from management, all modern enterprises have to confront the principal-agent problem. The typical large corporation in capitalist economies is operated by hired managers, not by the distant shareholders that own it. The problem of how to make top managers act in the interest of the ultimate owners is common to all large organizations. The soft-budget problem arises in the private sector of capitalist countries as well, such as the government bailouts of only large financial institutions and large non-financial firms, such as General Motors and Chrysler during the 2008 financial crisis. State ownership of enterprises is not the underlying cause of the soft-budget problem, since this problem may also occur in private firms when the state serves private capital’s interests. 4 Hence, the arguments claiming SOEs are inefficient can also serve to demonstrate that private enterprises are inefficient. In this sense, these arguments have failed to show the causality between state ownership and micro efficiency. On the other hand, Kaldor (1980) suggests that public firms could overcome the deficiencies derived from private firms’ shortsighted behaviors. Chang and Singh (1993) maintain that public firms could create a better environment for investments through mobilizing savings and stimulating investments.
In empirical studies, cross-country studies have obtained mixed results for the impact of SOEs on economic growth. Fowler and Richards (1995) and Jalilian and Weiss (1997) find that SOEs have no significantly adverse effect on economic growth in either developed or developing economies. Doamekpor (1998) and Zhu (2005) find that SOEs significantly contribute to economic growth. Cook and Uchida (2003) find that privatization of SOEs has a significantly negative effect on the economic growth of sixty-three developing economies over the period 1988–97. On the other hand, Plane (1997), Barnett (2000), and Gylfason, Herbertsson, and Zoega (2001) find that privatization has a significantly positive effect on economic growth, suggesting that SOEs are unfavorable to economic growth.
The results of empirical studies on China are also mixed. A closer look at these studies finds some of these results are not robust or consistent, due to econometric issues. Chen and Feng (2000) find that SOEs are unfavorable to economic growth in cross-sectional regressions, using regional data, and attribute this adverse effect to SOEs’ micro inefficiency. However, compared to panel regressions, cross-sectional regressions may obtain inconsistent results, due to unobserved variables. Lin and Liu (2000) adopt a fixed-effect model to improve consistency and find that a larger share of private enterprises was favorable to economic growth. Although their regional panel data cover a relatively long period (N = 31, T = 24), no unit root test is carried out in their study. Some other studies apply the same econometric method as Lin and Liu (2000) and confirm the negative effect of SOEs (e.g., Phillips and Shen 2005). Due to the lack of unit root tests, these results possibly suffer from spurious regressions. Furthermore, not all these regressions have controlled both region and year fixed effects.
In a related study on entrepreneurship, Li et al. (2012) use the share of private enterprises in total employment to measure entrepreneurship and find that this measure has a positive effect on economic growth. In this study, the authors apply the generalized method of moments (GMM) to regional panel data (N = 31, T = 31) without reporting the number of instruments. It is noteworthy that GMM is less reliable when the size of the panel is relatively small (Bazzi and Clemens 2013). On the other hand, Huang, Li, and Lotspeich (2010) argue that SOEs could contribute to social stability by preventing massive unemployment, which could offset SOEs’ micro inefficiency. Using the regional panel data covering the period 1992–2007, they find no significant difference between the effects of SOEs and private enterprises on economic growth. In their estimations, they take two-year or three-year averages based on the data, so their regional panel is shorter, and they control both region and year fixed effects.
There is no consensus in the literature on the growth effect of SOEs. The theoretical studies have emphasized the principal-agent problem and the soft-budget problem but fail to establish causality between state ownership and these problems. In contrast to these studies, we focus on the macro efficiency instead of micro efficiency. We emphasize that SOEs are embedded in the specific institutions that make SOEs behave in a distinct way. These behaviors may appear inefficient at the micro level but support economic growth at the macro level. The inconsistency between micro and macro efficiencies can be traced back to Marx and Keynes. The current empirical literature is not sufficient to provide a solid answer to the question we are addressing, due to econometric issues. These studies are mostly focused on the contemporaneous effect of SOEs. This paper instead examines both the contemporaneous and the long-term effects, since the macro effect on growth can only be observed in the long run. This paper also explicitly examines the effect of SOEs in countering economic downturns, which has implications for long-term growth.
3. How SOEs Can Promote Economic Growth
SOEs can promote economic growth in several ways. First, SOEs maintain and raise investments and thus aggregate demand in economic downturns when private enterprises reduce their investments. Thus, SOEs stabilize economic growth and reduce the damage of economic downturns. Second, along with investments, SOEs carry out major technical innovations that private enterprises are reluctant to do, which fosters economic growth. In addition, SOEs take a high-road approach in their treatment of workers, which is favorable to maintaining the reproduction of labor power, improving workers’ skills, promoting innovations in production processes, and increasing consumption demand. This high-road approach should have a pro-growth role if China moves toward a more sustainable growth model.
3.1. The boundary of SOEs
To investigate the pro-growth role of SOEs, we need to compare SOEs with non-SOEs, which requires a clearly defined boundary between the two. As mentioned above, SOEs refer to both state-owned enterprises and state-holding corporations. State-holding corporations appeared only after the reform of the state-owned sector in the second half of the 1990s. Table 1 presents China’s employment structure, in which SOE employment is in categories XII and XIII. Only non-corporate SOEs belong to XII; all other SOEs, which are the majority, belong to XIII. We do not include category IX (state-owned unit employment) because a large part of IX is not enterprise employment.
The Structure of Total Employment in 2015.
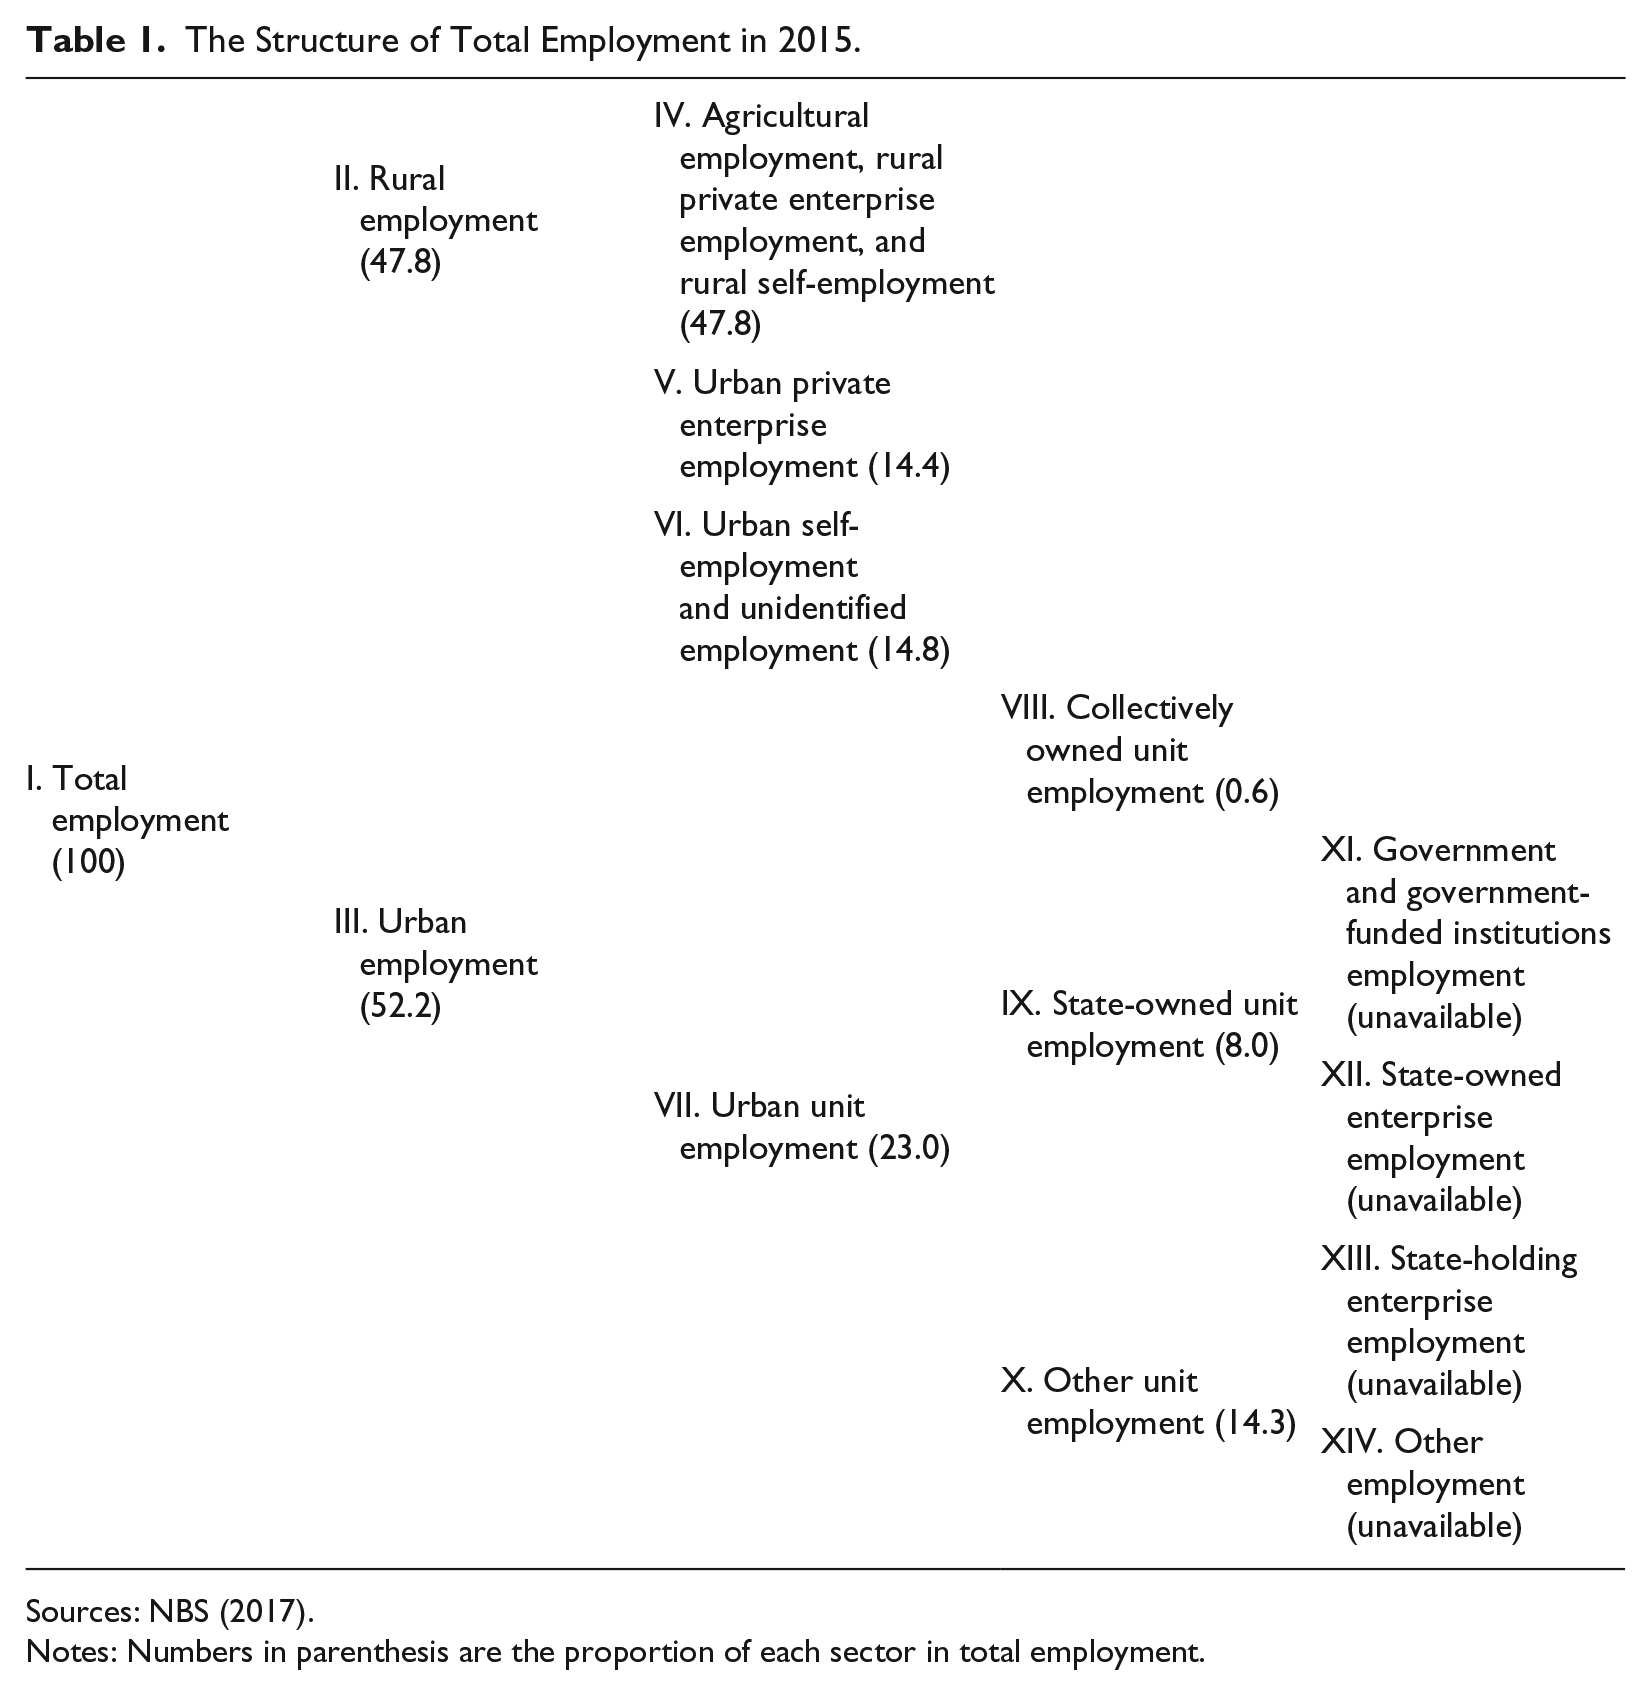
Sources: NBS (2017).
Notes: Numbers in parenthesis are the proportion of each sector in total employment.
Unfortunately, most of the available data on major economic variables such as wages and investments are for state-owned units rather than SOEs, and the data on state-holding corporations only exist for the above-scale industrial enterprise sector (ASIE). Therefore, we need to scrutinize whether a measure is actually reflecting the characteristics of SOEs and remind the reader when a measure might be biased.
With the boundary of SOEs defined, we compare SOEs to non-SOEs or to private enterprises. Non-SOEs is a larger category than private enterprises. Besides private enterprises, non-SOEs include foreign-funded enterprises, collectively owned enterprises, 5 and share-holding corporations that are not state-holding ones. However, when data for non-SOEs are unavailable, we use the data for private enterprises.
3.2. An economic stabilizer
SOEs’ investment has been more stable than private investment in China. This has played a crucial role in maintaining aggregate demand, preventing recessions, and reducing uncertainty for all investors. Since 2004, China has released data on monthly investments completed by all enterprises and SOEs, which can be used to show the reaction of SOEs when total investment slows down. As Figure 1 shows, SOE investment grew particularly fast over 2008–09 and 2015–16 when the growth of non-SOE investment slowed down.

Annual Nominal Growth of SOE Investment Versus Non-SOE Investment, 2004–17.
The role of economic stabilizer results from the central government’s control over SOEs’ investment decisions. The State-owned Assets Supervision and Administration Commission (SASAC) is the dominant shareholder in the 106 largest SOEs, also known as central enterprises, among which forty-seven enterprises have made the 2015 Fortune Global 500 list (SASAC 2015). The Central Committee of the Chinese Communist Party appoints the president of the board and party secretary of the fifty-one most important central enterprises. With these institutions, the central government can command SOEs to carry out massive investments when necessary. While SOEs have some say in their own investment decisions, those decisions are institutionalized in the context of a stable relationship between the government and SOEs. On the one hand, the central government needs SOEs to meet macro targets; on the other, SOEs, especially the largest ones, need policy and financial support from central government as well as stable macro conditions. This government-enterprise interdependence motivates SOEs to fulfill the central government’s commands. Moreover, SOEs’ investments benefit from the stable relationship between SOEs and financial institutions. In economic downturns, banks tend to maintain or even increase funds for SOEs.
Theoretically, the stabilizing role has both short-term and long-term effects on economic growth. In the short run, SOEs’ investments can reduce the severity of an economic downturn. Since an economic downturn may have a permanent effect on long-term growth, SOEs can also contribute to long-term growth by offsetting the adverse effect of economic downturns in the short run. Thus, the stabilizing role of SOEs can effectively release a “hysteresis” effect—which was found in the US economy after the 2008–9 recession (Summers 2014). 6 The long-term effect of SOEs also depends on the efficiency and profitability of SOE investments. SOE investments may induce overcapacity in the long run, imposing an extra burden on long-term growth, especially when the central government has loose control over the areas of SOE investments and SOEs carry out those investments in an anarchic way. Given the conflicting possible effects of SOEs on long-term economic growth, this calls for empirical testing.
The role of SOEs as an economic stabilizer implies that there might be simultaneous causality between the share of SOEs in the economy and economic growth. We hypothesize that a higher share of SOEs leads to faster growth, but it is also expected that slower growth leads to a higher share of SOEs. A positive effect of SOEs on growth might be hidden by the second relation by which faster growth leads to a smaller share of SOEs. This must be taken into account in the empirical analysis to avoid simultaneous causality.
3.3. Promoting technical progress
To measure the growth of SOEs’ technical progress, we calculate research and development (R&D) expenditure as a proportion of output, the industrial output brought by new products, and the number of patents per 1,000 employees, as shown in Table 2. We make use of China’s industrial census or economic census conducted in 1995, 2004, and 2008 because it provides data on both state-owned industrial enterprises and state-holding industrial corporations, consistent with our definition of industrial SOEs. It is worth noting that we have not yet considered the quality difference in new products or patents between SOEs and non-SOEs. Table 2 shows that the technical progress performance of SOEs was superior to that of non-SOEs by all three measures in every year, except for output of new products in 1995. The relative advantage of SOEs increased over time through 2008. Li and Xia (2008) observed similar facts. In addition, Hsieh and Song (2015) found that the total factor productivity growth of SOEs was faster than that of private enterprises from 1998 to 2007. 7
Technical Progress of SOEs and Non-SOEs.
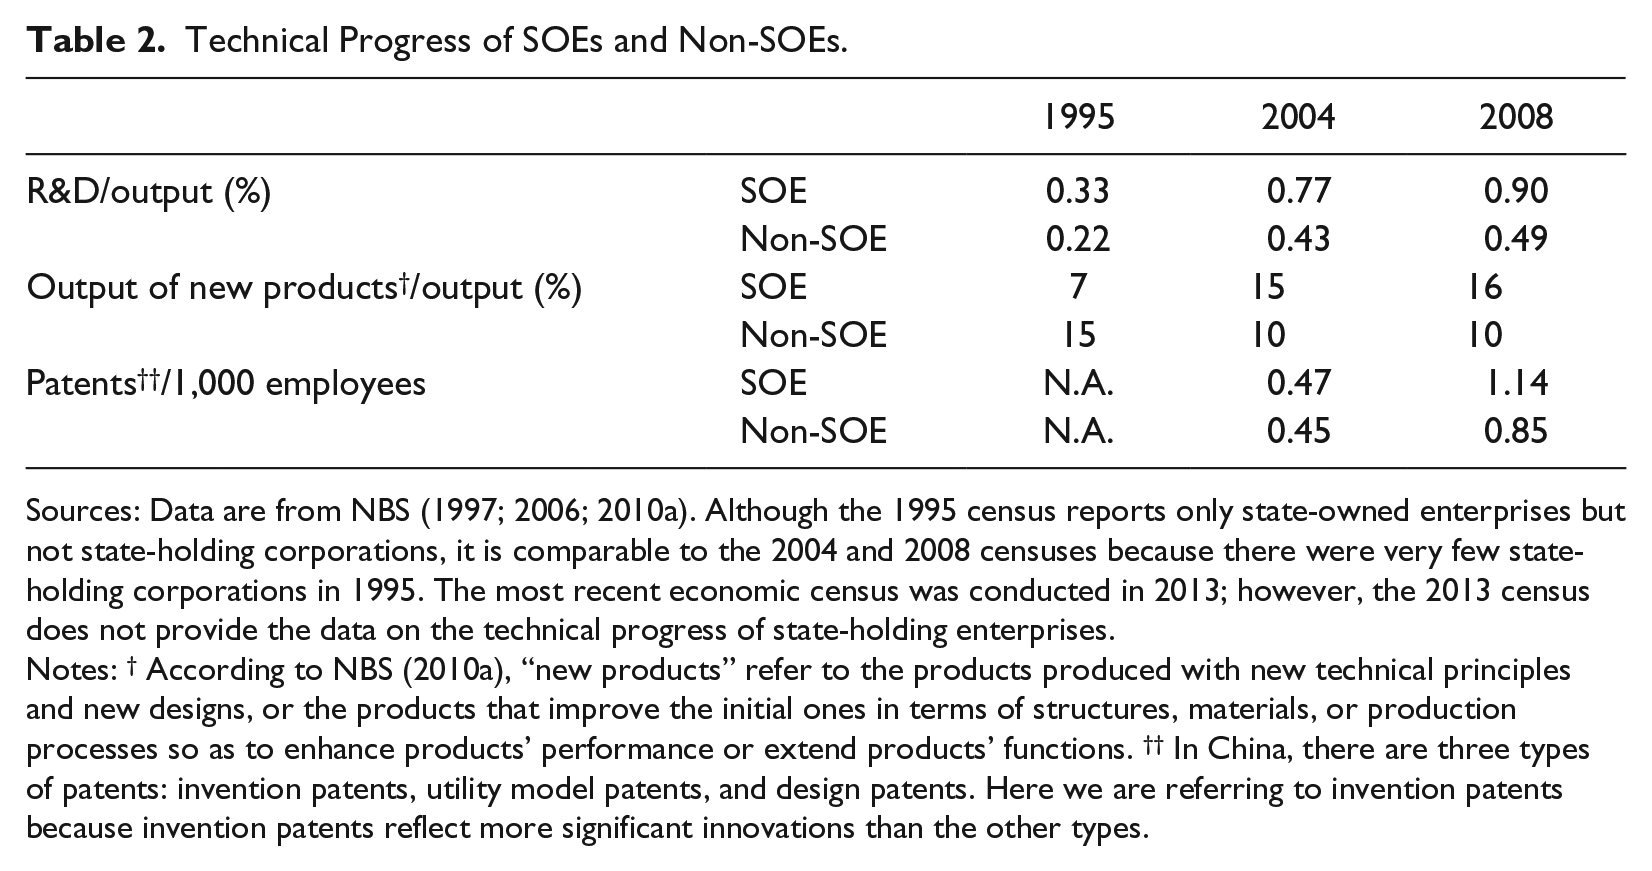
Sources: Data are from NBS (1997; 2006; 2010a). Although the 1995 census reports only state-owned enterprises but not state-holding corporations, it is comparable to the 2004 and 2008 censuses because there were very few state-holding corporations in 1995. The most recent economic census was conducted in 2013; however, the 2013 census does not provide the data on the technical progress of state-holding enterprises.
Notes: † According to NBS (2010a), “new products” refer to the products produced with new technical principles and new designs, or the products that improve the initial ones in terms of structures, materials, or production processes so as to enhance products’ performance or extend products’ functions. †† In China, there are three types of patents: invention patents, utility model patents, and design patents. Here we are referring to invention patents because invention patents reflect more significant innovations than the other types.
One could question the role of SOEs in promoting technical progress by taking account of the opportunity cost of R&D activities. In other words, if the efficiency of R&D activities in SOEs was lower than that of non-SOEs, the same performance in technical progress could be achieved more efficiently in non-SOEs. If that were the case, there might be more technical progress associated with fewer SOEs. Along this line, in an influential study, Wei, Xie, and Zhang (2017) argue that SOEs’ performance in innovation is lackluster compared to private enterprises because they find the number of patents for every 10 million yuan of firm-level investment in R&D is much higher in non-SOEs than in SOEs. The authors use a measure of the efficiency of R&D activities based on patent achievement. 8 However, technologies are highly heterogeneous. A simple comparison of the number of patents omits the quality difference in the patents of SOEs and those of non-SOEs. Major technical innovations require massive investments but do not necessarily bring significantly more patents, which would reduce the measured “efficiency” of R&D activities by that method. Therefore, the evidence raised by Wei, Xie, and Zhang (2017) does not demonstrate that SOEs are less efficient in innovation; on the contrary, it might be the case that SOEs concentrate their R&D on major innovations.
The State Science and Technology Progress Award provides a way to compare the performance of different types of enterprises in technical progress, given that only major innovations can compete for this award. This award is one of the five most important state prizes for science and technology; it is also the only one that can be given to organizations. Every year, the State Council gives this award to Chinese citizens or organizations that have made creative contributions in technological research, development, and innovations, popularized the application of advanced technologies, promoted the industrialization of new technologies, or accomplished major technological projects. This award is open to universities, research institutes, hospitals, and enterprises. The awarded projects represent the most influential technical advances in China, providing an opportunity to see how different enterprises have contributed to extending the technological frontier of the country. 9
We use the latest data for comparison, for the year 2016 (MOST 2017). These data do not contain ownership information, and we use the National Enterprise Credit Information Publicity System, complemented by the China Stock Market and Accounting Research Database as well as open information from the websites of enterprises, to determine whether an enterprise is an SOE or a non-SOE. In 2016, there were 610 awarded organizations, among which 306 organizations are enterprises; of those enterprises, 60.5 percent were SOEs. This result suggests that SOEs have played a crucial role in promoting major innovations.
Most of these awards go to a group project involving several organizations, with one of the organizations listed as the “first” one or leader. Of the 132 awarded projects in 2016, the first organization was an enterprise for thirty-six projects. Of those thirty-six project-leading enterprises, thirty-one were SOEs and only five non-SOEs. Thus, SOEs played the main role among enterprises leading major technical projects.
We define the first of the organizations working jointly for an awarded project as “the leader” and the rest of the organizations as “followers.” It is interesting to see who are the leaders, given the type of followers. Table 3 gives this leader-follower relation. Given an SOE follower, the leader is most likely also an SOE but very unlikely a non-SOE. On the other hand, given a non-SOE follower, the leader is most likely a non-enterprise organization but again very unlikely a non-SOE. Table 3 shows that twenty-one non-SOE followers worked with SOE leaders, while only two SOE followers worked with non-SOE leaders.
Leaders and Followers.
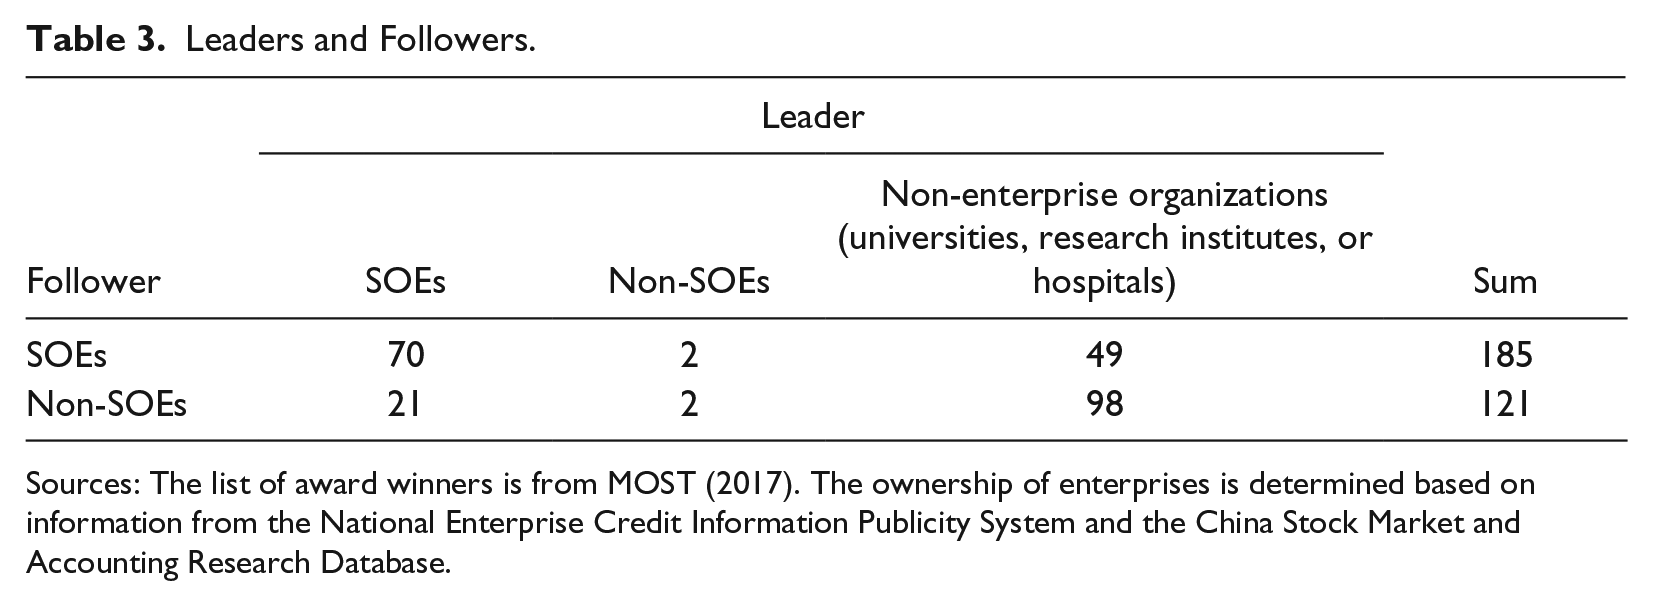
Sources: The list of award winners is from MOST (2017). The ownership of enterprises is determined based on information from the National Enterprise Credit Information Publicity System and the China Stock Market and Accounting Research Database.
The State Science and Technology Progress Award is classified into three grades: the grand prize, the first prize, and the second prize. Projects receiving the grand prize or the first prize are of monumental significance in certain areas, such as the Beijing-Shanghai High-Speed Railway project, the ultra deep-water semi-submersible drilling platform, and two-line hybrid rice. It is noteworthy that these projects were not only of scientific importance but also of economic importance—they aimed at reducing transportation costs, ensuring energy supply, or enhancing productivity, all of which may contribute to economic growth. From 2002 to 2016, SOEs as leaders contributed 63.6 percent of grand prizes and 44.6 percent of first prizes, while non-SOEs as leaders only contributed 3.8 percent of first prizes and no grand prize. This shows the importance of SOEs in conducting major innovations that may generate substantial positive externalities across sectors. Despite this dominant role in major innovations, the R&D expenditure of industrial SOEs accounts for only about 40 percent of all R&D expenditure in the above-scale industrial sector. 10 This suggests that SOEs are relatively efficient in use of funds to pursue major technical innovations.
One can still argue that, hypothetically, if non-SOEs spent the same amount of money in R&D activities aimed at major innovations, they might achieve better performance than what we observe in SOEs. However, private enterprises are reluctant to invest in major innovations, which are usually highly risky investments. Major innovations help enhance national competitiveness and bring benefits to the country as a whole. Facing intensified competition, private enterprises tend to focus on marginal innovations to lower their costs or diversify their products. However, major innovations require an enterprise to have a less intensified competitive environment, a long view for its investment decisions, and stable relations with other stakeholders such as shareholders, employees, and financiers. SOEs are more likely to meet these requirements than private enterprises.
Finally, the high-road wage strategy of SOEs can have a positive effect on innovation performance. The relatively high wages of SOE employees puts pressure on SOEs to enhance technology in order to survive in market competition against low-wage non-SOEs.
3.4. A high-road approach in treating employees
SOEs take a high-road approach in the treatment of employees. As we mentioned above, the working week is shorter in SOEs than in private enterprises. Moreover, SOEs pay a significantly higher wage than private enterprises: in 2015, the average wage was 65 percent higher in SOEs than in private enterprises (NBS 2017). 11 Even if education and gender are controlled, employees of SOEs still enjoy a significant wage premium (Ge and Yang 2014). 12 Taking the average disposable income per employee of urban households as a living wage standard, in 2015, the average wage in SOEs is 10 percent higher than the standard; whereas that in private enterprises is one-third lower than the standard (NBS 2017). By not paying a living wage, private enterprises are indirectly subsidized. 13 Li et al. (2013) and Li and Qi (2014) showed that the profits of private enterprises would become negative if they were required to pay wages according to China’s Labor Law. Besides, most SOE employees have access to social security, while only a few private enterprise employees have access to it. According to the National Bureau of Statistics, the share of migrant workers who participated in pension insurance and medical insurance was only 16.7 percent and 17.6 percent, respectively, in 2014; most migrant workers are hired by private enterprises (NBS 2015). If private enterprises paid the same wages and benefits and had the same working hours as SOEs, they would not be as profitable and efficient as they now appear to be. 14
Paying high wages to workers is not necessarily favorable to economic growth. As we see in Section 4, the econometric results show that the Chinese economy over the two decades from 1993 to 2012 exhibits a profit-led growth model, which means that a higher wage share in GDP induces slower economic growth. Nevertheless, SOEs’ high-road approach may promote economic growth both within the current growth model and in the transition to a more sustainable one.
First, paying higher wages does not necessarily correspond to a higher wage share in GDP, since the wage share in GDP depends not only on wages but also on labor productivity. The high-road approach to treating employees can promote the growth of labor productivity which, if it rises faster than the rate of wage increase, would increase the profit share rather than lowering it. Higher wages and better benefits enhance employees’ loyalty and morale; they are also good for improving working skills and stimulating innovation. A high-road approach can create mutual trust and relatively harmonious management-employee relations. Comparative studies on the labor process have suggested that the mutual trust management-employee relation is a crucial factor underpinning the success of Japan’s auto manufacturing firms in relation to their US competitors (Helper and Henderson 2014).
Second, SOEs’ high-road approach in treating workers may have a forward-looking role in economic growth. This role is important because some crucial aspects of the current economic model are unsustainable. Sustainable economic growth requires sustainable reproduction of labor power, which in turn requires employers to pay a living wage. Failing to pay a living wage, which is widespread in private enterprises, will sooner or later generate social and economic obstacles to economic growth. Low wages and the overtime work that low wages induced have squeezed time for labor reproduction and sacrificed workers’ health. Poor working conditions and meaningless long working time have intensified capital-labor conflicts and undermined social stability.
Another aspect of unsustainability is the overreliance on investment and exports (Zhu and Kotz 2010). With low wages, the consumption demand of the economy has been insufficient, making the economy vulnerable to overinvestment, trade conflicts, and external shocks from the global economy. Thus, moving to a more sustainable growth model requires steadily increasing wages and consumption in aggregate demand and moving away from reliance on investments and exports. It is easier for SOEs to accept higher wages given their high-road approach to treating workers. Thus, SOEs can be the bridge that connects the old and a more sustainable new economic model.
In conclusion, there are a number of reasons to expect SOEs to contribute to economic growth, although the effect might not appear in the short run. Regarding the role of an economic stabilizer, given the mutual causality between SOEs and economic growth, one might observe that more SOEs seem to be associated with lower economic growth. That is one reason for the conflicting views about the impact of SOEs on economic growth, although ideological bias is another reason for the belief that SOEs “must” be harmful for economic growth. Regarding the role of promoting technical progress, it usually takes time for an innovation to be economically profitable and to spread across the economy, which also makes the positive effect of SOEs likely to emerge only in the long run. Possible benefits of the high-road approach for technical progress would be realized in the long run. The forward-looking role in transition to a sustainable economic model would be visible only after the transition happens. In sum, the hypothesis we can test in the following econometric analysis is whether SOEs offset economic downturns and promote long-run economic growth.
4. An Empirical Analysis
4.1. The empirical model
In this section, we estimate the growth effect of SOEs, based on a panel dataset covering twenty-nine regions (province, autonomous region, or municipality; Chongqing and Tibet are excluded, due to data availability) and twenty years (1993–2012). To overcome the impact of economic cycles on the measure of SOEs (as discussed above), we take five-year averages of all the variables. Thus, the averaged panel dataset covers twenty-nine regions and four non-overlapping periods (1993–97, 1998–2002, 2003–07, and 2008–12). We establish the following empirical model:
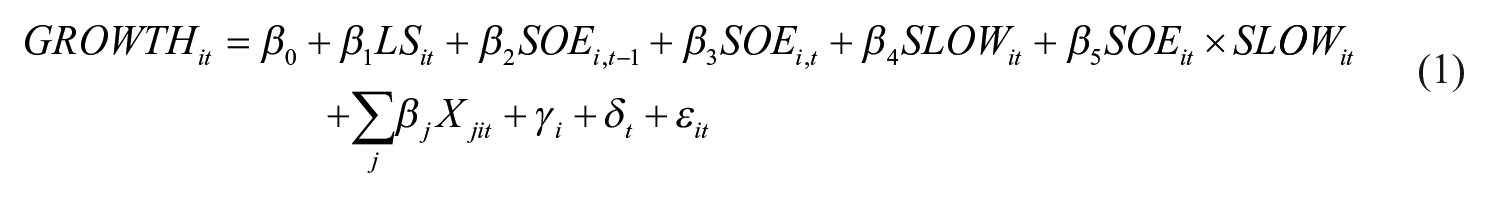
In Equation (1), subscripts
Next, we add SOE variables to the basic growth-distribution framework. The SOE variables measure the share of state-owned enterprises in the economy. How to measure SOE is discussed in the next section. We add a one-period (i.e., five-year) lag of SOE to capture the effects of major technical innovations, which means it takes on average five years for those innovations to be effective economically. These effects cannot be realized immediately in that whole process of application, cost reduction, and market formation, and the spread of technology may take years to realize; thus, the economic effect of technical progress tends to be associated with the activities of SOEs that took place a few years ago. If
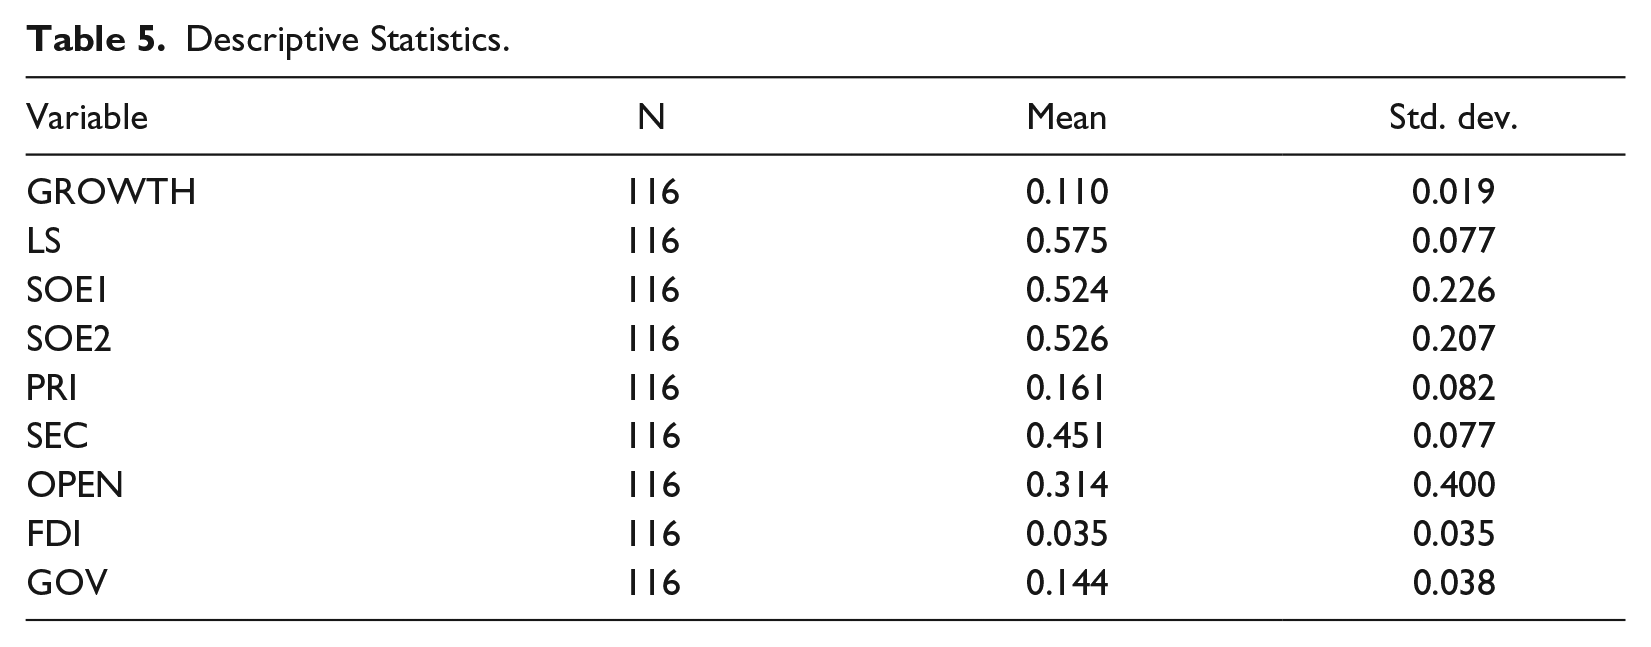
In addition to the SOE variables, we also include control variables that often appear in the empirical studies on China’s economic growth: PRI and SEC capture the sectoral structure; OPEN captures trade openness; FDI captures inward foreign direct investments; GOV captures the size of governments. Table 4 gives variable definitions and data sources. Table 5 gives descriptive statistics.
Variable Definitions and Data Sources.
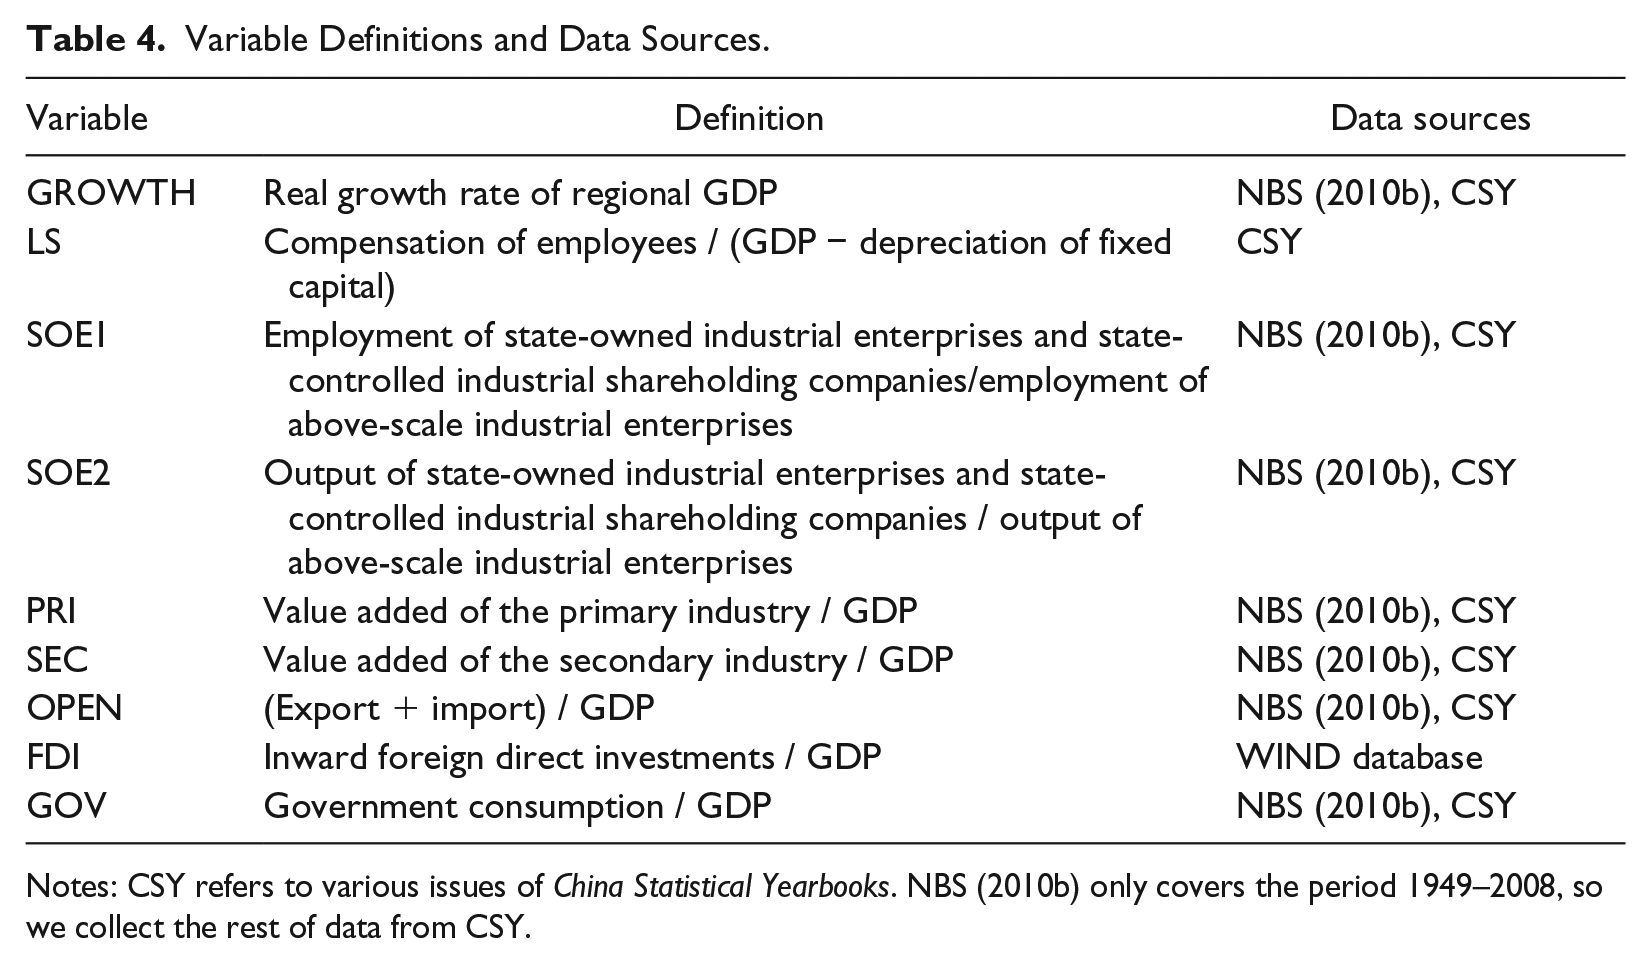
Notes: CSY refers to various issues of China Statistical Yearbooks. NBS (2010b) only covers the period 1949–2008, so we collect the rest of data from CSY.
Descriptive Statistics.
4.2. Measuring SOE
The variable of interest in Equation (1) is the share of SOEs in the economy. Current studies use a variety of definitions of the SOE variable. For example, Lin and Liu (2000) measure the share of private enterprises with private enterprises’ share in total industrial output. Phillips and Shen (2005) adopt five measures: SOEs’ share in total employment, in total industrial output, in the construction sector, in retail sales, and in fixed investments.
Among all the possible measures, we first exclude SOEs’ share in the construction sector or in retail sales because these measures only reflect the share of SOEs in some minor sectors. Second, SOEs’ share in the number of zhigong (formal employees) may overestimate the share of SOEs because the share of zhigong in urban employment declined substantially from 81 percent in 1993 to 38 percent in 2008, as a result of the reforms in the urban formal sector (NBS 2010c). Third, SOEs’ share in total employment is not an appropriate measure. This measure is in practice calculated by dividing the employment of state-owned units by total employment, and the employment of state-owned units includes the employment of governments and non-profit institutions but excludes the employment of state-controlled shareholding corporations. The same problem exists in SOEs’ share in fixed investment.
To measure the share of SOEs in the enterprise sector, we have to make a compromise to focus on the ASIE sector. The official statistics provide data on the SOEs in the ASIE sector. We adopt SOEs’ share in the employment of the ASIE sector and SOEs’ share in the output of the ASIE sector. 15
4.3. Methodology and results
We use a fixed-effect model to estimate Equation (1). Recently it has become popular to apply GMM to China’s regional panel data; however, GMM is designed for “large N and small T” panels, but our panel has a small N. Meanwhile, given that we have a short panel (T = 4), we cannot explore the time series dimension of the panel, and a panel unit-root test is meaningless. Although it is simple, the fixed-effect model can improve the consistency of estimation by purging the unobserved unit effects. We also add period dummies to all the specifications. Given that China’s reform was a gradual process that took place in different regions with different speed, it is likely that the explanatory variables are correlated with periods. The Hausman test also suggests that period dummies should be added.
We do not deal with the possible endogeneity of key variables using instruments. It is difficult to find suitable external instruments for a growth model, since many factors can have a direct impact on economic growth. Nevertheless, our treatment of the original data by taking five-year averages has already dealt with the simultaneous causality between GROWTH and contemporaneous SOE caused by the counter-cyclical fluctuation of SOE. Also, the lag of SOE is exogenous to GROWTH. To avoid omitted variables, in addition to the regional fixed effect, we controlled time dummies and variables capturing the major factors of economic growth. Therefore, although the estimation is imperfect in terms of endogeneity, we believe that the results provide some evidence regarding the question we are addressing.
Table 6 gives the estimation results with SOE1 as the measure. Model (1) is a simple relation between growth and distribution. The coefficient of LS is negative and statistically significant, showing that the growth regime is profit-led, which echoes the results of Molero-Simarro (2015). Across all specifications in Table 6, the coefficients of LS are all negative; in particular, the absolute value of the coefficient is greater in Model (6), which means that the growth regime became more profit-led from 2003 to 2012. Model (2) adds the lagged SOE variable, which has a positive and statistically significant effect. This positive effect remains in all specifications. Model (3) adds the contemporaneous SOE variable and SLOW. Model (4) further adds the interaction term. The coefficient of contemporaneous SOE is negative, but statistically insignificant in both Model (3) and (4). The coefficient of the interaction term in Model (4) is positive and statistically significant, meaning that SOEs offset some adverse effects from economic downturns. The result of Model (4) implies that SOEs promote growth in the long run and in economic downturns, although SOEs have no significant contemporaneous effect on growth in normal times. This result remains in Model (5), when control variables are added. These control variables have no statistically significant effect on growth. Model (6) focuses on the period from 2003 to 2012. The result of Model (6) shows that both the long-run effect and the offsetting effect in economic downturns of SOEs become larger. Among the control variables, GOV has a negative and statistically significant effect on growth, which might indicate that productive functions of former government agencies were transferred to enterprises after the SOE reform in the second half of the 1990s and early 2000s; other variables are still insignificant.
Estimation Results with SOE1.
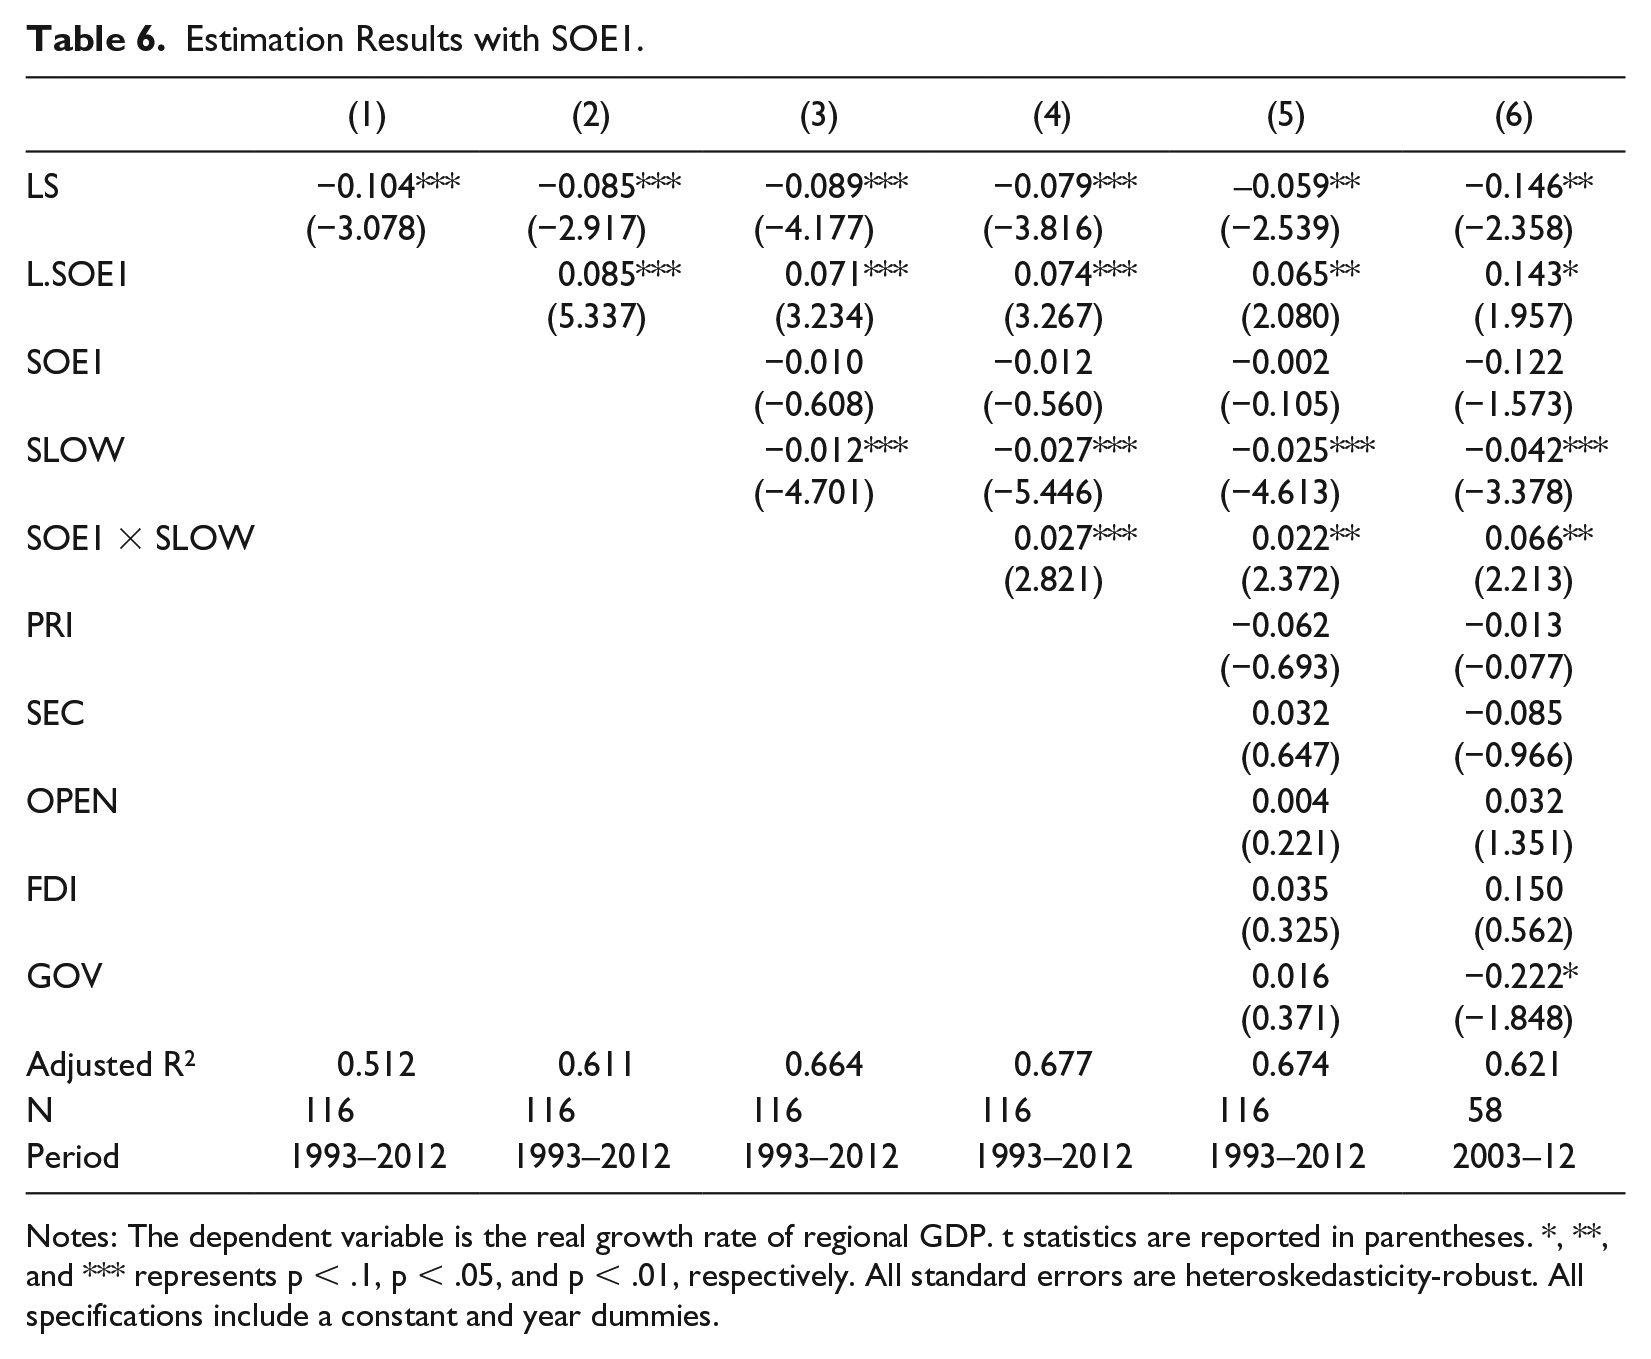
Notes: The dependent variable is the real growth rate of regional GDP. t statistics are reported in parentheses. *, **, and *** represents p < .1, p < .05, and p < .01, respectively. All standard errors are heteroskedasticity-robust. All specifications include a constant and year dummies.
Table 7 gives the results with SOE2 as the measure. Models (7)–(11) corresponds to Models (2)–(6) in Table 6, respectively. As in Table 6, the results of LS show that the growth regime is profit-led. The coefficient of contemporaneous SOE is statistically insignificant in all specifications. The long-run effect of SOEs is positive and statistically significant in Models (7), (8), (9), and (11) but statistically insignificant in Model (10) under common confidence levels (it is significant at p = .15). The coefficient of SOE2 × SLOW is positive and statistically significant in Models (9), (10), and (11). In Model (10), all control variables are statistically insignificant. In contrast, in Model (11) focusing on the period 2003–12, PRI and SEC have negative and statistically significant effects; OPEN has a positive and statistically significant effect; GOV has a negative and statistically significant effect. The difference between the results of control variables in Models (10) and (11) might indicate that growth after 2003 relied more on real estate (which is a big sector in the tertiary industry) and the global market.
Estimation Results with SOE2.
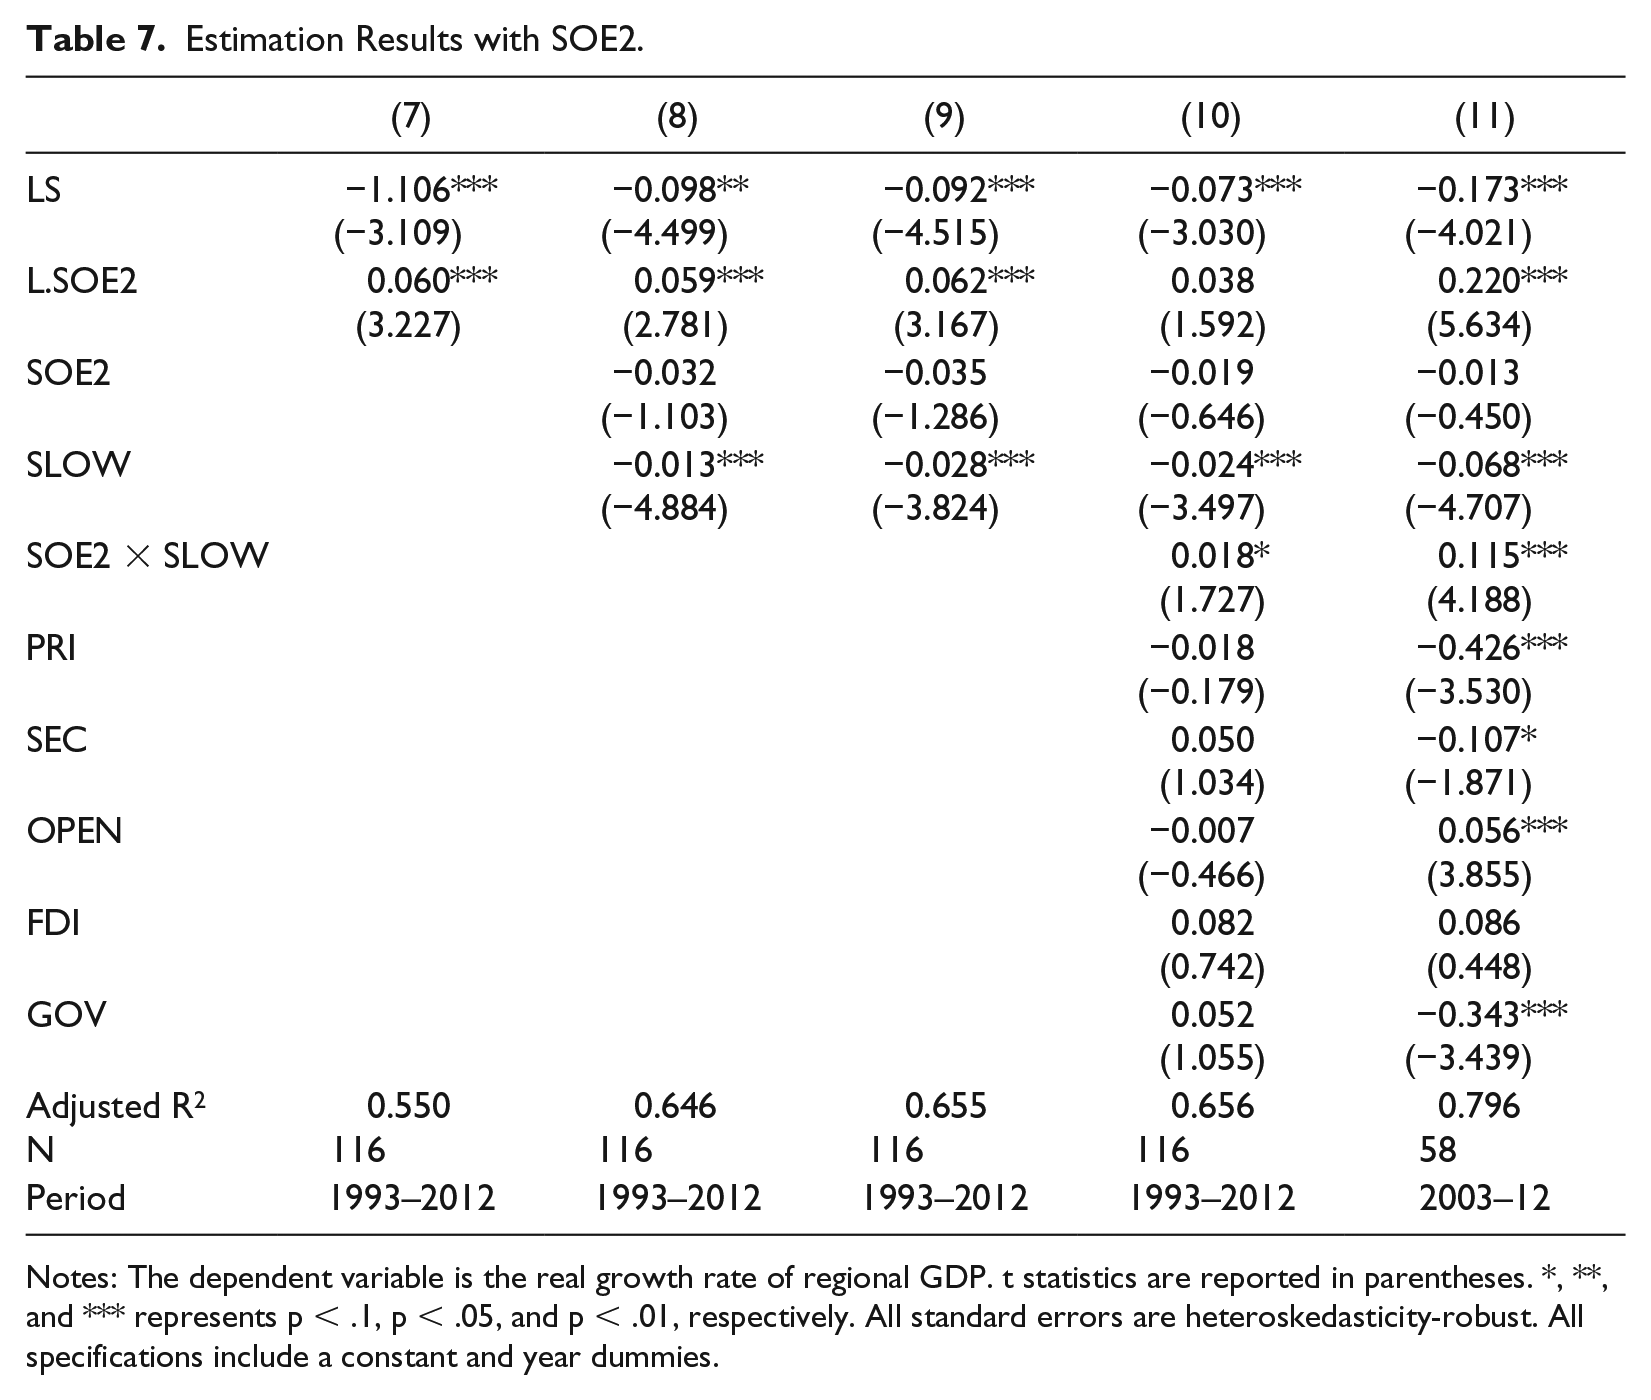
Notes: The dependent variable is the real growth rate of regional GDP. t statistics are reported in parentheses. *, **, and *** represents p < .1, p < .05, and p < .01, respectively. All standard errors are heteroskedasticity-robust. All specifications include a constant and year dummies.
Thus, the econometric analysis finds that SOEs have no significant contemporaneous effect on growth both in normal times and economic downturns. The contemporaneous effect of SOE in economic downturns, which is
Finally, we conduct a series of robustness checks. First, we replace SOE1 and SOE2 with SOEs’ share in the value added of the ASIE sector and SOEs’ share in total industrial value added. Second, we adopt the SOE share in a larger sector, i.e., the sector that combines the above-scale industrial sector and the construction sector. Third, we use yearly data instead of five-year averages. In that case, we conduct unit root tests and find that the variables in the panel are either I(0) or I(1) variables, so we apply the pooled mean group method to the data. In general, the key result remains in the robustness checks. 17
4.4. Policy implications: Short-termism vs. long-run growth
As noted above, it is likely that for some regions SOEs appear to have a negative correlation with contemporaneous growth, since SOEs tend to grow faster when the economy slows down. We found the coefficients of the contemporaneous effect in some specifications to be close statistical significance. Moreover, some more advanced regions (e.g., Zhejiang Province) have very few SOEs now, which might send a false signal to other regions that privatization can promote growth everywhere.
As a result, it might be tempting to state and local officials to privatize SOEs, 18 even if privatization harms growth in the long run and makes the economy more vulnerable to economic slowdowns brought by either external shocks or internal contradictions. However, given the intense competition between local officials for promotion, their behaviors are often characterized by short-termism. Local officials may seek to privatize local SOEs based on a belief that it will accelerate GDP growth or that “reforming” SOEs will polish their resume, leading to a promotion, while the official leaves the region before the negative effects of privatization are realized. Such opportunistic behavior may be promoted by the personal material benefits that officials can often gain from privatization.
This short-termism in privatization may also arise at the central state level. However, competition among officials is not a driving force for the state. There is more room for the state and the leadership to consider long-run goals and restrain local short-termism. The establishment of SASAC to oversee the largest SOEs in 2003 has allowed the state to enforce attention to long-run goals and to some extent insulate the largest SOEs from local short-termism. 19 Under this circumstance, the state’s attitude toward privatization matters for the future of SOEs.
In recent years, particularly since the global financial crisis and China’s massive stimulus package, China’s economy entered the so-called “new normal” stage characterized by slower growth, a high debt/income ratio, overcapacity in some sectors, a housing bubble, and rising wages. Rising debt and overcapacity are serious problems for SOEs because they were encouraged to borrow heavily to finance big investments during the financial crisis. It is a critical time for the state to think about how to solve SOEs’ problems and whether initiating another round of privatization would contribute to solving these problems. Our study suggests that privatization would be harmful to economic growth in the long run. In our view, privatization would destroy a central pillar for China to be able to achieve sound economic growth under unfavorable conditions.
5. Conclusion
In this paper, we attempt to address the classic question in China’s context: what is the impact of state ownership on economic growth? The earlier literature fails to consider that private enterprises treat their workers badly, violate China’s labor laws, and provide workers with a wage lower than a living wage. Such practices undermine the contribution of private enterprises to economic growth in the long run. Most of the current studies ignore the role of SOEs in stabilizing economic growth and promoting technical progress. We argue that SOEs are playing a pro-growth role in several ways. SOEs stabilize growth in economic downturns by carrying out massive investments. SOEs promote major technical innovations by investing in riskier areas of technical progress. Also, SOEs adopt a high-road approach to treating workers, which will be favorable to the transition toward a more sustainable economic model. Our empirical analysis indicates that SOEs in China have promoted long-run growth and offset the adverse effect of economic downturns, while they have no statistically significant contemporaneous effect on growth.
Compared to a typical capitalist economy, China is distinguished by a large state-owned sector. Historically, the economic transition and institutional changes in China’s reform era continuously shaped SOEs’ roles in the economy. The changing roles reflect the dynamic contradictions of the economy. These enterprises shifted from the basic production and welfare-provision units to autonomous firms facing market competition while also serving as instruments of the state. SOEs’ role in providing welfare was replaced by the role of stabilizing growth. One can expect that the role of SOEs will change further in the future. How the SOEs evolve will be crucial for resolving the contemporary contradictions of China’s economy and for finding a path toward a sustainable economic model.
Footnotes
Acknowledgment
The authors are grateful to Davide Gualerzi, Dic Lo, Andong Zhu, and the participants of the workshops at Nankai University, Peking University, and Ritsumeikan University for their valuable comments. The usual disclaimer applies.
Declaration of Conflicting Interests
The author(s) declared no potential conflicts of interest with respect to the research, authorship, and/or publication of this article.
Funding
The author(s) received no financial support for the research, authorship, and/or publication of this article.
1
In China, the industrial sector refers to the sum of mining, manufacturing, and production and distribution of electricity, gas, and water.
2
The normal working week stipulated by China’s Labor Law is forty-four hours.
3
Some economists believe that long-run growth is independent of cyclical behavior. We reject this view. A recession, or slowdown in growth, can reduce the long-term growth rate of an economy.
4
A possible soft budget constraint may be a bigger problem for the case of SOEs than for troubled private companies. SOEs often have a strong claim on state resources, and while states do bail out big companies at times, the managers of a big private company cannot be certain that state support will be provided when needed.
5
Collectively owned enterprises are, like SOEs, public firms. However, these enterprises have become a very small sector since the 1990s, and excluding them does not affect our results.
6
Hysteresis means that, since a recession retards the increase in and updating of the capital stock and allows labor skills to degrade, the short-term effect of a recession is permanent. The Congressional Budget Office reduced the projected full-capacity GDP growth path of the US economy several times after the Great Recession as a result of the long-term effects of the Great Recession.
7
8
9
While these awards are open to private enterprises, it is possible that the State Council, which grants these awards, has a bias in favor of SOEs.
10
We estimate the SOE share in R&D expenditure with the data of the 2008 economic census, which might be slightly different in 2016.
11
We use the average wage of state-owned units because the official statistics do not report the average wage of SOEs.
12
The higher wage is associated with the higher capital intensity in SOEs. Technologies in SOEs are more advanced so that labor productivity in SOEs is higher; thus, SOEs are capable of paying higher wages. However, there are also historical and institutional factors that ensure workers can benefit from the higher labor productivity through higher wages.
13
Private enterprises that fail to pay a living wage are subsidized by their employees, employee family members, and/or the state.
14
While the aggregate data indicate better wages and working conditions at SOEs, they do not always take a high-road approach to employees. Recently there has been increasing use of contract employees by SOEs.
15
The ASIE data is available only after 1998. For the period 1993–97, we instead use the SOE share in the number of industrial zhigong and the SOE share in the industrial output of “enterprises with an independent accounting system.” As mentioned above, the share of zhigong in urban employment declined substantially from 1993 to 2008. This decline happened mainly after 1998, when the SOE reform accelerated; thus the measure we use can still reflect the SOE share before 1998. Besides, Model (6) in Table 6 and Model (11) in ![]() report the result for the period 2003–12—the data are all about the ASIEs—which can be seen as a robustness check.
report the result for the period 2003–12—the data are all about the ASIEs—which can be seen as a robustness check.
16
It is statistically significant and positive only in Model (11).
17
The robustness checks are available upon request.
18
In China’s context, the state refers to the central government.