



Abstract
This is the fifth in a series of teaching notes on quality-differentiated demand. With an eye on accessibility to undergraduate economics majors, the focus here is on peak-load pricing and highway tolls. Once quality considerations are accounted for, a richer set of insights is derived to guide social planners in deciding optimal levels of traffic flow and tolls.
Introduction
Among various applications of intertemporal price discrimination in undergraduate microeconomics, congestion tolls are often cited as a way to enhance economic efficiency. Whether under a monopolist exerting market power or a social planner exerting regulatory power, charging a higher price for service at more costly peak periods of demand brings pricing closer to marginal cost pricing and greater allocational efficiency. As a guide to policy formulation, however, such treatments provide no insight into optimal levels of spending and pricing. To achieve such insight requires a quality-differentiated demand structure.
The paper begins with a brief summary and critique of a conventional intertemporal pricing scheme. A quality-differentiated demand structure is then introduced as a guide to public spending and pricing policies associated with peak and off-peak periods of highway traffic. More broadly, this paper and earlier teaching notes are aimed at introducing quality considerations into the undergraduate microeconomics core, drawing on concepts underlying consumer choice theory that are familiar to undergraduate students majoring in economics.
The Standard Peak-Load Pricing Scheme
Figure 1 illustrates the standard peak-load pricing scheme. With marginal costs increasing at higher levels of service and with higher levels of peak-period demand, D2, compared to off-peak demand, D1, marginal cost pricing dictates a price, P2, in the peak period and a lower price, P1, in the off-peak period. Peak-load pricing.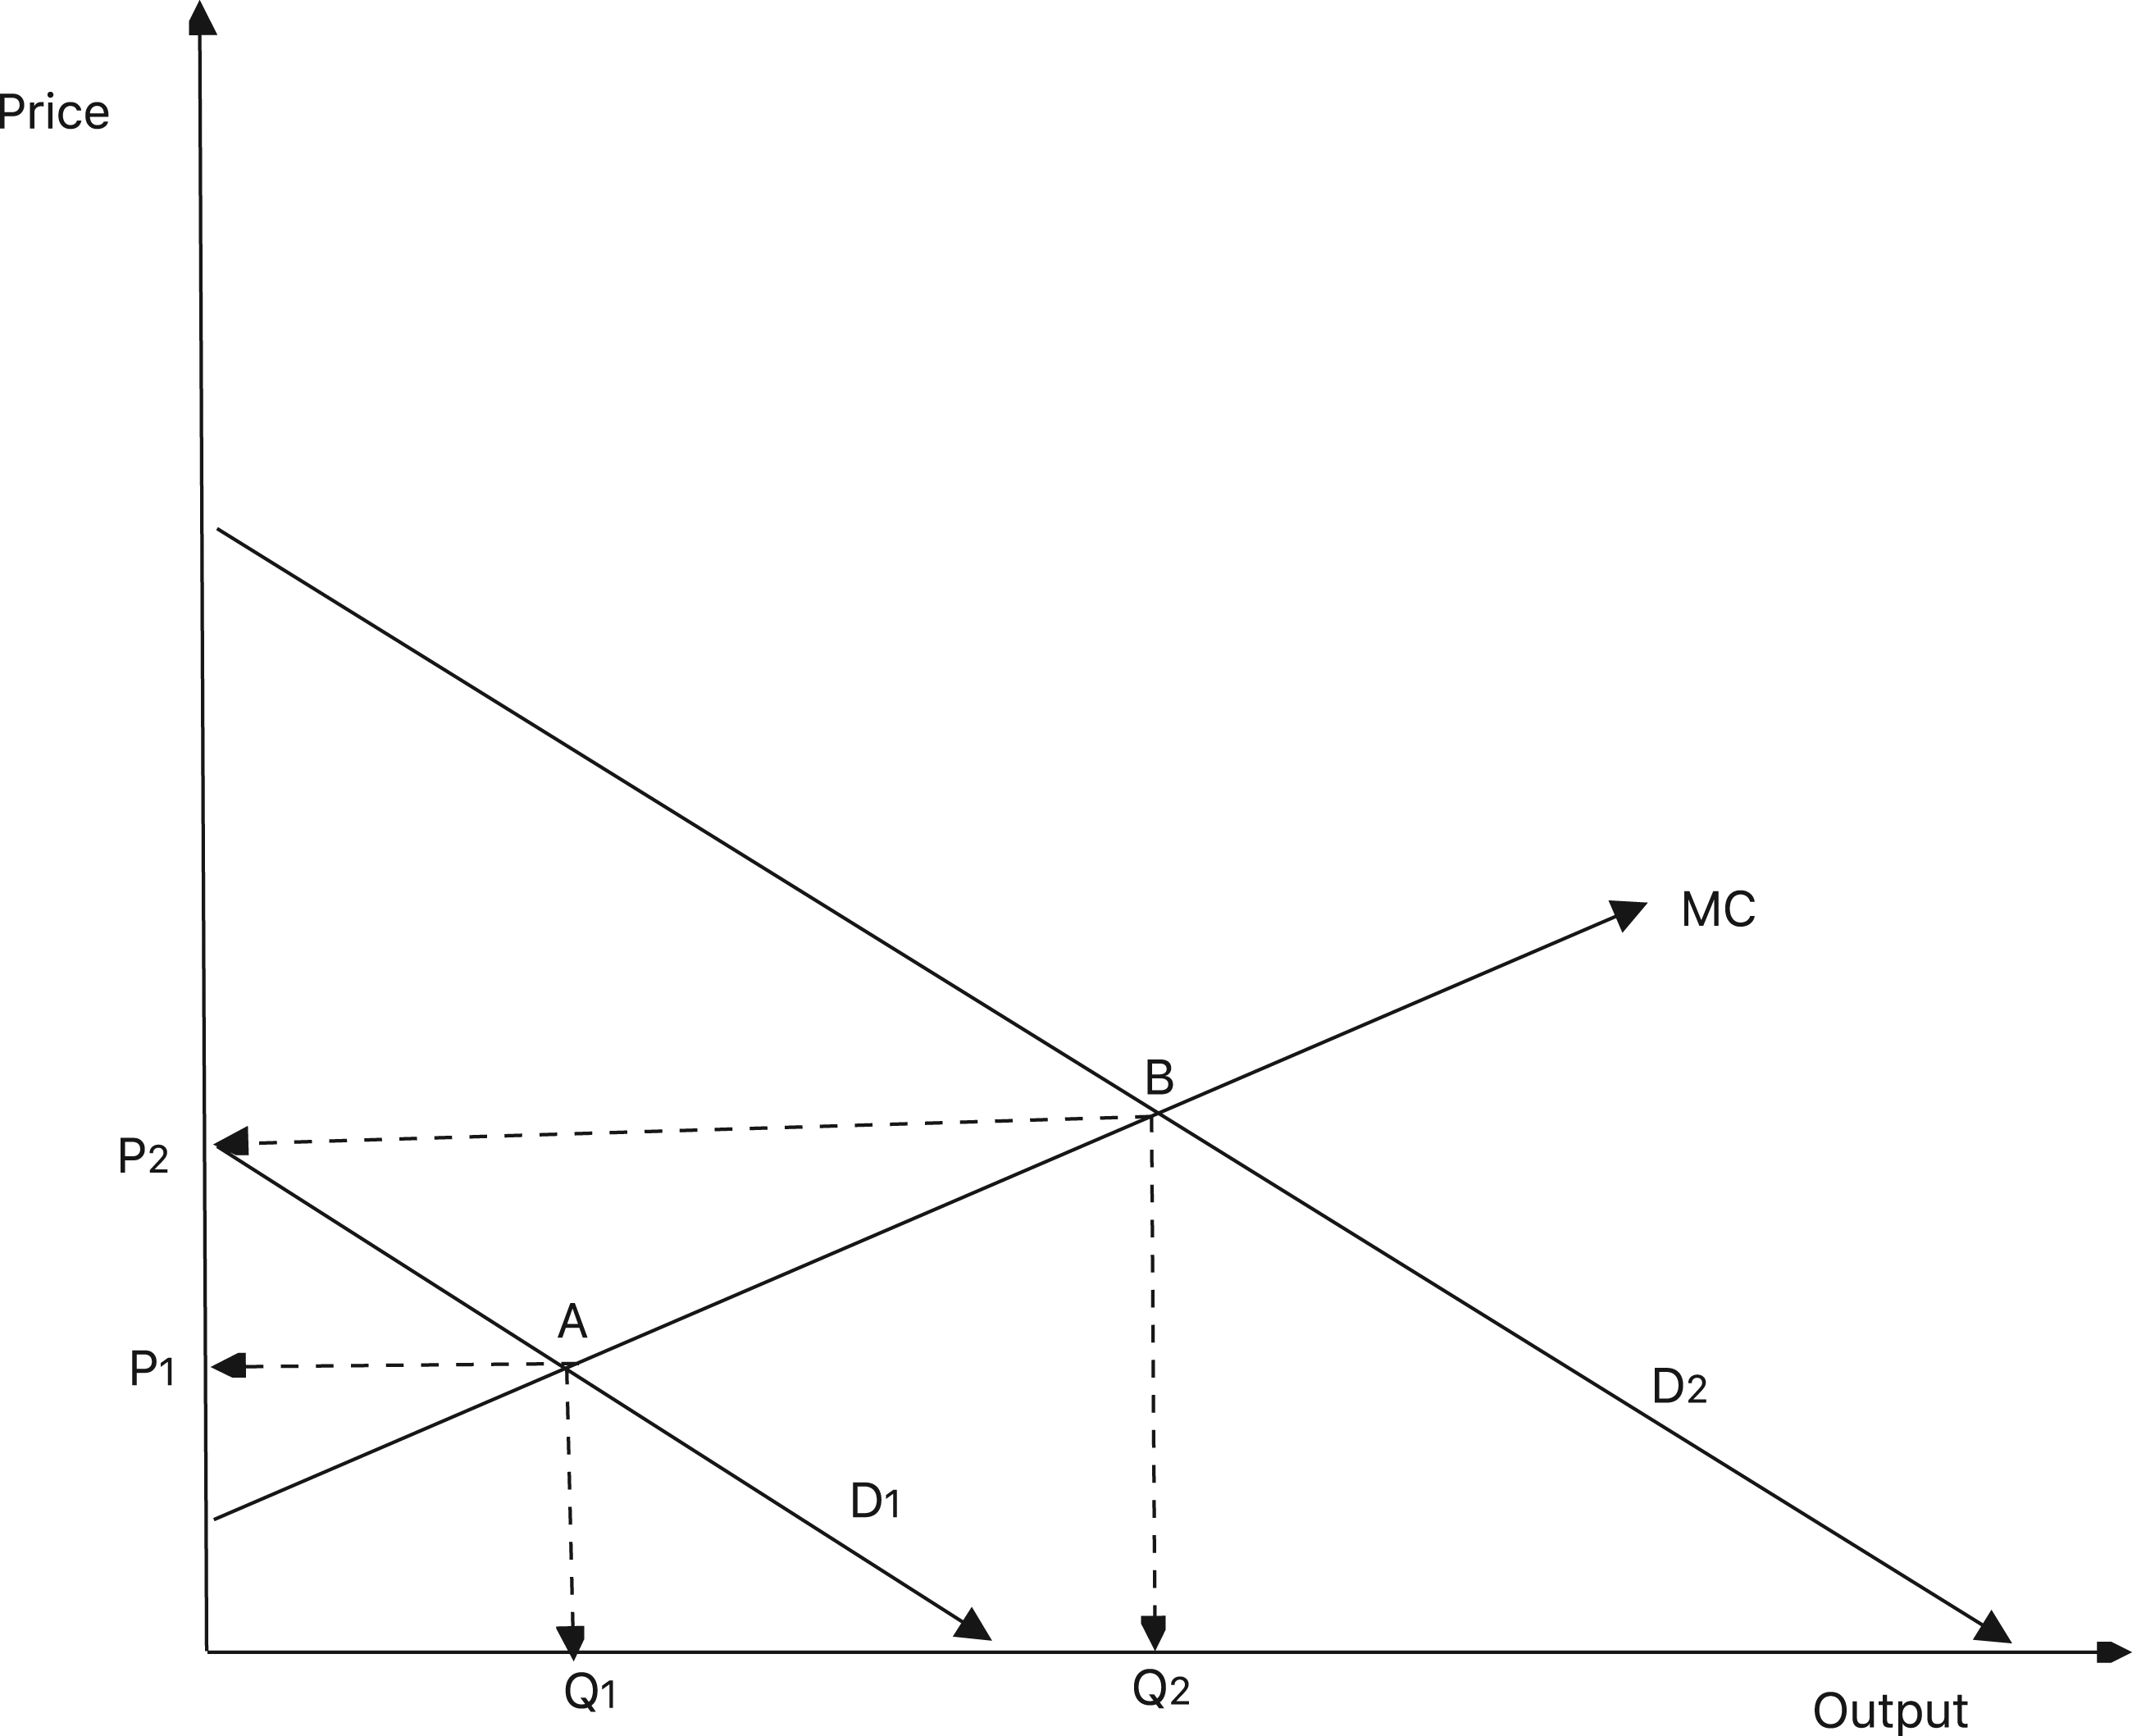
In this connection, Browning and Zupan (2015) emphasize that the same service is produced in each period but at a higher marginal cost in the peak period. Highway tolls are higher in the peak period to reflect increasing variable costs to maintain the same traffic flow as more cars enter the highway, for example, more toll takers, more traffic supervision, more support services at the ready to respond to vehicle breakdowns and accidents, and more timely road repairs. With a peak period surge in highway services, expected travel time for any segment of the toll road is the same in the peak and off-peak periods.
As far as it goes, this is an interesting elaboration on price discrimination. 1 However, it’s predicated on a static cost and demand structure which limits its applicability. There is no insight into whether enhanced quality of highway service with improved traffic flow results in a net gain in efficiency. Such an analysis requires a comparative static framework that allows for shifts in underlying cost and demand structures to reflect changes in the quality of highway service.
Peak-Load Pricing with Quality-Differentiated Demand
Figure 2 illustrates the case of two levels of quality in highway service with MCH representing costs for the higher quality service and MCL, the lower quality. Marginal costs increase with traffic volume as before, and MCH is everywhere above MCL to reflect the higher costs of maintaining an improved traffic flow. Corresponding shifts occur on the demand side with DH everywhere higher than DL for both the peak and off-peak segments of the market.
2
The higher and lower quality demand structures reflect vertically differentiated services, and for both market segments, DH must lie above DL. In a world of linear demand, the most logical and versatile representation consistent with vertical differentiation is one of strict proportionality between the higher and lower quality demand schedules.
3
Peak-load pricing with quality-differentiated demand.
As developed in an earlier teaching note (Adams, 2020), proportionality implies a constant marginal rate of substitution and therefore, perfect substitution between higher and lower quality highway services in each market segment. With perfect substitution, there is a stable a priori juxtaposition of the quality-differentiated market demand schedules in each segment; movements along either schedule occur without causing shifts in the other, and this facilitates the comparative statics.
Off-Peak Optimization
Comparing the potential higher and lower quality equilibria C and A for the off-peak period indicates that these highway users optimize at the lower quality equilibrium, A. By inspection, the ratio of the higher quality equilibrium price P1H to the lower quality equilibrium price P1L exceeds the constant marginal rate of substitution of higher for lower quality service indicated by the ratio D1H to D1L. 4 Hence, with D1H/D1L = MRSH,L = MUH/MUL < P1H/P1L over the range from the higher to lower quality equilibrium, MUH/P1H (the expected utility from the marginal unit of higher quality highway service per dollar spent) is everywhere less than MUL/P1L (the expected utility from the marginal unit of lower quality highway service per dollar spent). Were these off-peak drivers at the higher quality equilibrium, C, they would realize enhanced economic well-being by switching (or being switched by our social planner) from the higher to the lower quality highway service and the lower quality equilibrium, A.
Peak-Period Optimization
Comparing the potential higher and lower quality equilibria D and B for the peak-period market indicates that these consumers optimize at the higher quality equilibrium, D. By inspection, the ratio of the higher quality equilibrium price P2H to the lower quality equilibrium price P2L is less than the constant marginal rate of substitution of higher for lower quality service indicated by the ratio D2H to D2L. Hence, with D2H/D2L = MRSH,L = MUH/MUL > P2H/P2L over the range from the higher to lower quality equilibrium, MUH/P2H is everywhere greater than MUL/P2L. Were these peak-period drivers at the lower quality equilibrium, B, they would realize enhanced economic well-being by switching (or being switched by our social planner) from the lower to the higher quality highway service and the higher quality equilibrium, D.
Social Optimum
While the peak-load pricing story is more complex once quality variation is factored in, there is also additional insight to guide our social planner. First, it’s not necessary to stipulate that quality be the same in both periods. In our example, peak-period drivers optimize at the new higher quality level with a more predictable/steady flow of traffic. For these drivers, the higher toll to cover the higher costs of maintaining the new and improved flow is worth it. But for our off-peak drivers, these quality enhancements are not worth the higher toll, and they optimize at the lower toll and more congested traffic flow.
Our model also suggests a pattern of price and quantity shifts to guide social planning. For the peak-period market, the response to quality enhancement manifests itself as increased peak-period highway use; not only is there an improved flow of traffic, but also an increase in traffic itself from Q2L to Q2H. Meanwhile, if the same quality enhancement were implemented in the off-peak period, our off-peak drivers would register their aversion to the higher priced service with a reduction in use from Q1L to Q1H. This signals to the social planner that the more costly, higher quality services such as better traffic control, quicker response time to breakdowns and accidents, more convenient scheduling of road maintenance, etc. are only warranted for the peak period.
The Limiting Peak-Period Case
With this model, the most socially efficient quality level for the peak-period market is determined through iterations in enhanced quality improvements in traffic flow. If additional spending to improve traffic flow with correspondingly higher peak-period tolls results in increased traffic, the social planner can be confident in the efficacy of the enhanced quality. However, one would expect a limiting case to emerge where further enhancement in service quality combined with a higher peak-period toll results in reduced peak-period traffic. Such a case is illustrated in Figure 3. The limiting case of quality improvements for peak-period drivers.
Enhanced quality of highway service is reflected in the new quality-differentiated demand schedule, D2H', and marginal cost schedule, MCH', with a new equilibrium established at E. Comparing the initial equilibrium D with E, it is apparent that our peak-period drivers have reached a limit in their valuation of improvements in highway services. By inspection, the ratio of the new toll P2H' to the previous toll P2H exceeds the marginal rate of substitution given by the ratio of the new higher quality demand schedule, D2H', to the previous demand schedule, D2H. If our social planner implements the enhanced services and the higher toll, there will be a reduction in peak-period traffic from Q2H to Q2H', signaling that this iteration in improved traffic flow is not socially efficient. Our peak-period drivers are better off at the quality level generating D2H and MCH with the higher volume of peak-period traffic, Q2H. While the very best level of enhanced highway services cannot be directly deduced from the model, it appears that the optimal peak-period demand and cost structures fall somewhere between D2H and D2H' and MCH and MCH'.
Conclusion
This analysis contributes to the peak-load literature by explicitly factoring quality considerations into the underlying demand and cost structure. To improve traffic flow is to produce a higher quality highway service. The model provides a framework to better inform decisions about the production and pricing of such enhancements. Moreover, as with other applications of quality-differentiated demand, this analysis should be accessible to undergraduate economics majors and make for broader policy application and more lively analytics.
Footnotes
Declaration of Conflicting Interests
The author(s) declared no potential conflicts of interest with respect to the research, authorship, and/or publication of this article.
Funding
The author(s) received no financial support for the research, authorship, and/or publication of this article.
