




Abstract
This study investigates ethnic discrimination in the Dutch labor market, using field experiments. Two thousand eighty applications were sent to 1340 job vacancies; one applicant had a Dutch-sounding name, the other a name that signaled immigrant descent. Our aims were (a) to test for the persistence of discrimination in the Dutch labor market; (b) to study the interactions of ethnic background with job characteristics; (c) to study the complexity of discrimination against a background of multiple group membership. Results indicate that discrimination continues to be a problem in selection procedures. Interactions with job characteristics and multiple group membership are discussed.
In many West-European countries, immigrants occupy a disadvantaged position in the labor market (Heath & Cheung, 2007). Gaps relative to the native population are observed in several indicators of labor market position, for example unemployment, occupational level and employment contract status (permanent or temporary). The Netherlands is no exception: Non-Western ethnic minorities are more often unemployed and less often have permanent employment contracts than comparable native Dutch citizens (Huijnk, 2012). The differences remain after correcting for human capital characteristics (e.g., Andriessen, 2010; Andriessen & Dagevos, 2007; Bijwaard & Veenman, 2006; Dagevos, 2009). It is therefore suggested that discrimination plays a role. However, in survey studies it is almost impossible to include all relevant variables in the analyses. For example, host language proficiency, ethnically constrained social networks and declining work motivation due to expectations of discrimination have been linked to migrants’ limited access to jobs (Perreira, Mullan Harris, & Lee, 2007). The omitted variables may bias the component that is attributed to ethnic origin, making it difficult to interpret and impossible to label it irrefutably as discrimination.
Due to the methodological difficulties in measuring discrimination, the sociological and economic literature is displaying a growing interest in field experiments as a method of empirical investigation of labor market discrimination (Riach & Rich, 2006). Typically, two (or more) fictitious job candidates, equal in all aspects but for the target variable such as ethnic background, apply for the same job vacancy. Differences in outcomes for the equivalent job candidates point to ethnic discrimination. This method is regarded as the most competent method for isolating ethnic origin from other relevant characteristics. In the Netherlands, no large-scale research using field experiments to detect ethnic discrimination has been performed recently (cf. Bovenkerk, Gras, & Ramsoedh, 1995). The first aim of this study was therefore to test for the persistence of ethnic discrimination in the Dutch labor market.
In the growing body of studies that use field experiments, increasing attention is paid to the complexity of discrimination by studying the interactions of ethnic background with job characteristics (Nelson & Probst, 2004). These studies aim to investigate whether some segments of the labor market are more open to discrimination than others. For example, discrimination may be found more in jobs involving customer contact (Becker, 1957). Unfortunately, to date there is little by way of empirical verification. For one thing, the number of studies that have addressed this question is still very small. Second, most studies that do include job characteristics suffer from a limitation in the research design. Job characteristics (sector, segment, and customer contact) are merged into a limited number of jobs, thus possibly entwining effects (see Table 1 for an overview of recent studies). The second aim of this study is therefore to disentangle possible effects of sector, segment, and customer contact by including a sufficient number of jobs, with and without customer contact, varying in skill level (low, intermediate, and high) and from five economic sectors.
An Overview of the Inclusion of Target Variables in Recent Studies Using Field Experiments
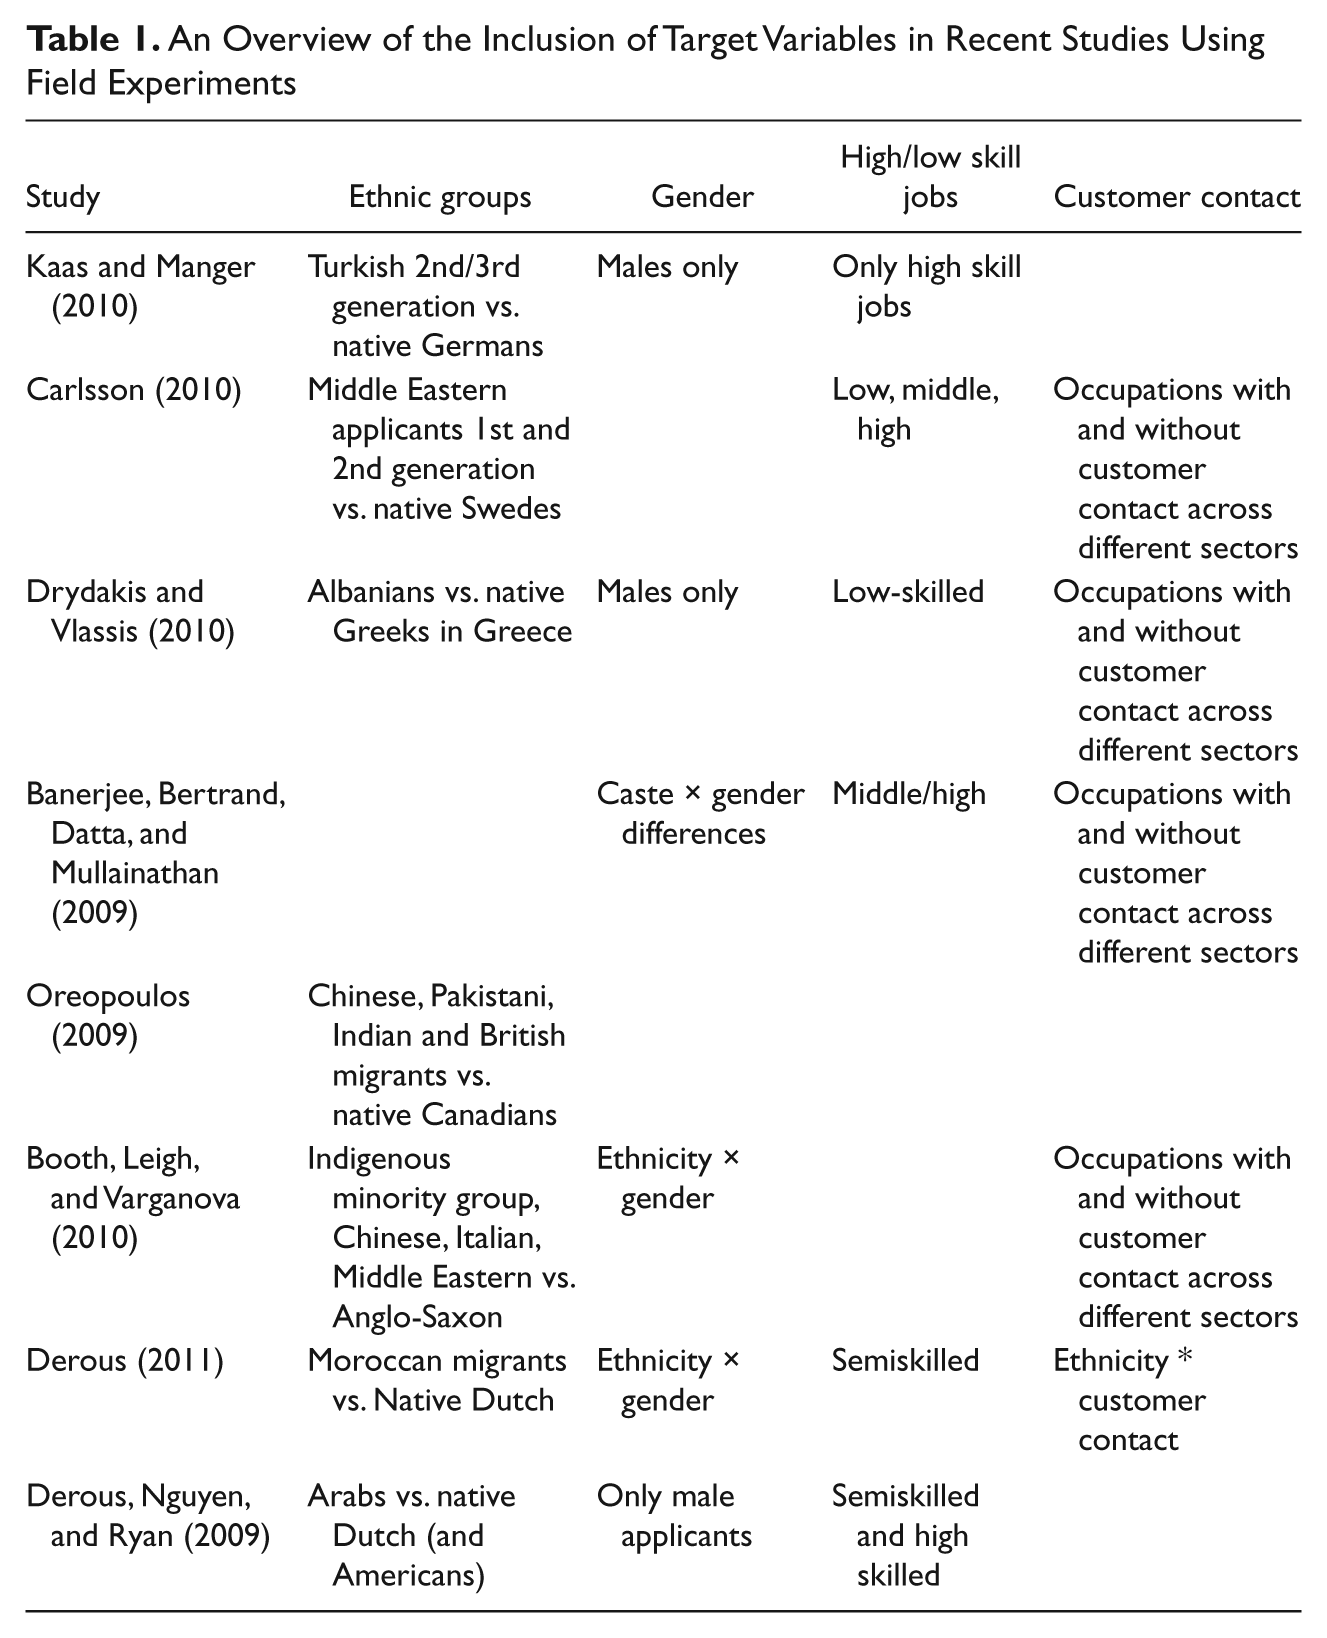
In addition, most field experiment studies focus on discrimination against one minority group in comparison to a majority group (Oreopoulos, 2009; also see Table 1). However, societies are multiethnic and people are members of multiple groups (such as gender and ethnicity) at the same time. Discrimination should therefore be studied against a more complex and realistic background. This has been done in studies analyzing labor market surveys which demonstrate that ethnic penalties are greater for some ethnic groups than for others (Heath & Cheung, 2007) and studies that show interaction effects between gender and ethnicity (Epstein, 1993). However, studies using field experiments to investigate these questions are scarce. Due to the well-known limitations of survey research in detecting discrimination, the observed differences in the labor-market position of groups may not necessarily be due to ethnic discrimination. Third, therefore, we aim to study the complexity of discrimination against a background of multiple group membership: We measure whether different ethnic groups are discriminated against in varying degrees (people of Turkish, Moroccan, Surinamese, and Antillean origin) and whether migrant men or migrant women suffer more from discrimination.
Theoretical background
In economics, discrimination is often explained on the basis of employers’ (or customers’, or coworkers’) negative preferences toward individuals from a certain group, e.g. migrants (Becker, 1957). Because of these negative preferences (a given “taste”), employers are reluctant to hire migrant workers, unless some form of financial compensation (i.e., lower wages for migrant workers) can be arranged. In a similar way, coworkers may object to working with migrants, and customers may refrain from engaging in transactions with migrants unless products or services can be acquired at cheaper rates.
The other main economic theory, that of statistical discrimination, focuses on employers’ expectations about an individual’s productivity. For employers, selection decisions involve estimating a future employee’s productivity. Job resumes and job interviews are used to gain an impression, but can never provide an employer with enough information to calculate risks and productivity with any precision. To supplement this incomplete information, employers use information on the productivity (or risk) of the average member of the group to which the individual is perceived to belong (Aigner & Cain, 1973; Arrow, 1973). Thus individual job candidates are judged on characteristics that are attached to a particular group and that need not necessarily apply to the individual candidates. Here, bias seeps in to the risk calculations that form the basis of selection decisions.
In social psychology, discrimination, stereotyping, and prejudice are treated as inevitable consequences of social categorization (see Fiske, 1998 for a review). Social categorization is the basic tendency of the human mind to group self and others into categories in order to make the complex world more intelligible (Allport, 1954). However, categorization is not without its negative consequences. There is a strong desire to maximize differences between categories and to view individuals within categories as maximally similar (Tajfel, 1982). These desires can distort perceptions and create biases: We tend to see all members within a particular category as possessing the trait that has come to characterize the group. This tendency refers to stereotypes: “the traits that we view as characteristic of social groups, or of individual members of those groups and particularly those that differentiate groups from each other” (Stangor, 2009, p. 2). Stereotypes are overgeneralizations, inaccurate and negative (Allport, 1954). Thus, when stereotypes are used in distribution problems (e.g., who gets the job), discrimination may be the outcome. In this sense, stereotyping forms a valuable addition to the theory of statistical discrimination. The group estimates that employers use as supplementary information in their selection procedures may not be based on actual group differences, but may be enlarged through a process of stereotyping (Pager & Karafin, 2009).
In sociology, explanations are mostly framed within a perspective of ethnic group conflict: Discrimination arises because groups are in competition for scarce resources (such as jobs), and/or perceive threats of a more symbolic kind (Crocker, Major, & Steele, 1998). The perceived threat that may arise from the presence of another group in the competition for scarce resources leads to more in-group solidarity and out-group derogation and hostility. Discrimination against the out-group is a possible manifestation of this process.
For our purpose of studying ethnic discrimination in combination with job characteristics and against a background of multiethnic societies, we will draw on these theories. The following sections review more specifically the literature and recent empirical results for (a) differences in discrimination rates across ethnic groups; (b) the intersection of ethnicity and gender; and (c) the interaction of ethnicity and job characteristics. First, however, we will briefly look at the background of the four immigrant groups involved in our study.
Migrants in The Netherlands
In this study we explore discrimination rates for the four main ethnic groups in the Netherlands: people of Turkish, Moroccan, Surinamese and Antillean origin. According to Statistics Netherlands (CBS), in 2010 there were 342,000 people of Surinamese origin, 349,000 people with a Moroccan background, 383,000 people of Turkish origin and 138,000 of Antillean origin living in the Netherlands. These minority groups together represent about 8% of the total Dutch population of over 16 million.
People of Turkish and Moroccan origin were originally labor migrants to The Netherlands, recruited in Turkey and Morocco to feed the expanding Dutch labor market in the mid-1960s. Following the oil crisis in 1973, this recruitment came to a halt, but Turks and Moroccans continued to enter The Netherlands for family reunion and family migration purposes. As Turks and Moroccans were originally recruited for unskilled or low-skilled jobs, the level of education in the first generation is rather low. However, the second generation are rapidly improving their educational status. Native Dutch citizens perceive a relatively wide cultural distance from migrants of Turkish and Moroccan origin, mostly due to differences in religious background, since people of Turkish and Moroccan origin are predominantly Muslims (Gijsberts & Vervoort, 2007; Pepels & Hagendoorn, 2000).
The Surinamese and Antillean groups are postcolonial migrants. The population of both migrant groups in the Netherlands has a rather diverse background The first wave of migrants from Surinam came to The Netherlands mainly for reasons of study or social mobility (Van Amersfoort, 1968). The next wave of Surinamese migrants arrived in The Netherlands in the second half of the 1970s, around the time when Surinam gained independence in 1975. Their educational background is on average lower than that of the first wave, leading to a rather mixed composition of the Surinamese population in The Netherlands (Van Niekerk, 1994). Until the 1960s, Antillean migration was also mostly motivated by a desire to study in The Netherlands. After 1990, however, economic motives for migration became more important. A proportion of this “new” group of immigrants are seen as problematic because they are associated with criminal activities such as drugs trafficking and theft. In terms of cultural distance, people of Surinamese and Antillean origin are felt to be closer to the native Dutch, as their colonial history exposed them to Dutch language and culture at an early stage.
Summarizing, in contrast to the more homogenous composition of the Turkish and Moroccan groups, which are at quite a wide remove from the native Dutch population culturally, people of Surinamese and Antillean origin form a mixed group, with wealthy and higher educated migrants at one end of the spectrum, and low-educated, lower class migrants at the other.
Differences in Discrimination in Different Ethnic Groups
Ethnic penalties on the labor market differ for different ethnic groups. For example, in the Netherlands, the ethnic penalty in unemployment is greater for the Moroccan than for the Turkish, Surinamese or Antillean groups, even after controlling for individual characteristics (Andriessen & Dagevos, 2007; Dagevos, 2001; Dagevos & Bierings, 2005). People of Turkish and Moroccan origin also more often have temporary employment contracts compared with native Dutch people who are the same age, have the same educational qualifications and gender (Andriessen & Dagevos, 2007; Dagevos, 2001).
In conjunction with findings on ethnic penalties, Hagendoorn and Hraba (1989) found that ethnic groups in a society are ranked according to the perceived cultural distance relative to the native population and the time spent in the country. In such ethnic hierarchies, the ethnic in-group is typically ranked first (most preferred) and ethnic out-groups are ranked in a specific order further down. The ranking of ethnic groups in a particular society shows to what extent out-groups are stereotyped as socially and culturally deviant (Snellman, 2007; Snellman & Ekehammer, 2005; Sniderman, Hagendoorn, & Prior, 2004; Verkuyten & Zaremba, 2005). Evidence has been found that there is a tendency to discriminate against groups who are placed further down in the hierarchy (Snellman, 2007).
In The Netherlands, the ethnic hierarchy consistently ranks people of Moroccan origin at the bottom (Gijsberts & Vervoort, 2007; Pepels & Hagendoorn, 2000; Verkuyten & Zaremba, 2005), with people of Turkish origin in a somewhat more favorable position, and those of Surinamese origin even more so. In addition to a “general” hierarchy that is shared by most members of a society, employers have been found to form an additional hierarchy concerning the preferred ethnicity of their employees (e.g. Veenman, 1984, 1995); employers have been found to prefer applicants of Surinamese and Turkish origin over their Moroccan and Antillean counterparts (Kruisbergen & Veld, 2002; Nievers, 2010; Veenman, 1995).
It is, however, unclear to what extent these preferences translate into actual behavior. Although the size of ethnic penalties is somewhat in line with expectations based on ethnic hierarchies, unobserved variables (other than preferences) could still account for the observed differences. Previous studies in The Netherlands using field experiments mostly include one ethnic minority group, thus complicating comparisons between multiple ethnic groups (cf. Büyükbozkoyum, Stamatiou, & Stolk, 1991; Derous, 2007, 2011; Derous, Nguyen, & Ryan, 2009, Dolfing & Van Tubergen, 2005). Although the ILO study by Bovenkerk et al. (1995) includes Moroccan and Surinamese participants, it does so in different studies, again complicating comparisons between groups. For semiskilled jobs, they report discrimination rates for both groups of between 35 and 40%, suggesting that both groups are equally affected by discrimination. This would mean that ethnic hierarchies do not translate into differences in discriminatory behavior for different groups, at least not in selection procedures. Also, Oreopoulos (2009) in Canada found rather small differences between applicants of Indian origin and those of Chinese or Pakistani origin, but large differences for these groups compared to applicants with English-sounding names. In contrast, Booth, Leigh, and Varganova (2010) did find evidence in line with the ethnic hierarchy in their Australian study: Italian applicants (a more established immigrant group) suffered less discrimination than Chinese and Middle Eastern applicants (immigrant groups that arrived more recently).
Our field experiment includes Moroccan, Turkish, Surinamese and Antillean applicants and explores possible differences in discrimination rates between these groups. In line with the ethnic hierarchy in The Netherlands we expect to find that Moroccans and Antilleans experience most discrimination, and Turks and Surinamese less.
Intersection of gender and ethnicity
Multiethnic societies bring complexity to the picture of dominant and subordinate groups (ethnic hierarchies), which is increased further as people belong to multiple social groups that are also susceptible to stereotyping and discrimination. A very prominent intersection of social group memberships is gender and ethnicity. The literature posits two competing hypotheses. The double burden hypothesis (DBH) states that migrant women face most discrimination (in comparison to migrant men, and men and women who belong to the majority group), as they belong to two lower status groups simultaneously (Berdahl & Moore, 2006; Nelson & Probst, 2004). By contrast, the subordinate male target hypothesis (SMTH) claims that migrant men will be discriminated against more, because they are perceived as more threatening (Sidanius & Pratto, 1999; Sidanius & Veniegas, 2000). Empirical studies seem to point in the direction of SMTH. For example, Fershtman and Gneezy (2001) found, using laboratory experiments, that women from lower status groups are trusted more than men from lower status groups. This effect is reversed for the high status group, where women are trusted less than men. Also, Epstein (1993) states that Afro-American women face less severe discrimination than Afro-American men. By contrast, a Dutch study in which recruiters judged resumes from fictitious Moroccan and Dutch candidates found no significant interaction effect of gender and ethnic background (Derous, 2011).
Ethnicity and Job Characteristics
Research analyzing large-scale surveys generally finds smaller ethnic residuals for higher educated migrants (e.g., Andriessen & Dagevos, 2007; Van Gent, Hello, Ode, Tromp, & Stouten, 2006). This does not necessarily mean that discrimination rates are lower in the upper segment of the labor market: Omitted variables might play a relatively larger role in the lower segment, resulting in the larger ethnic residuals. Unfortunately, not many studies using field experiments include different segments of the labor market (see Table 1). A notable exception is Carlsson (2010), who included jobs at the low, intermediate and high skill level for job applicants in Sweden. No differences in callback rates for these levels between migrant and native Swedish job candidates were observed. A study in India found no discrimination for software jobs that required high skill levels, but differences in callback rates were found for the intermediate skill level call center jobs (Banerjee, Bertrand, Datta, & Mullainathan, 2009). Also, the ILO study by Bovenkerk et al. (1995) in The Netherlands found much less discrimination against migrants responding to higher level job vacancies than for semiskilled vacancies. One possible interpretation is that demand for staff is higher for high-skilled jobs. The difficulty in finding qualified personnel forces employers to overlook trivial criteria such as group membership and focus on qualifications only. This interpretation is in line with the ethnic conflict theory, where higher levels of competition lead to increased intergroup hostility and out-group derogation. Empirically, this is supported by research finding that job shortages (lower demand) foster ethnic discrimination in the labor market (Andriessen, 2010; Esses, Jackson, & Armstrong, 1998).
Customer Contact
A high proportion of today’s workers are employed in the service sector (Lopez, 2010; McCammon & Griffin, 2000). Therefore, studying discrimination in service encounters is important. Becker’s theory on taste discrimination holds that employers, coworkers or customers hold negative preferences vis-à-vis individuals from a certain group. In the case of customer discrimination, employers think that (native/White) customers prefer to not engage in transactions with migrants (Kornrich, 2009). Because of this taste, customers will avoid businesses where services are provided by migrants. To avoid a loss in profits, the theory argues, employers prefer to hire nonmigrant workers for “visible” services (jobs involving customer contact), but hold no preferences for the nonvisible jobs (with no customer contact).
Evidence for the customer discrimination thesis in studies using field experiment methodology is at best meager. Few studies systematically explore differences in discrimination rates for jobs with and without customer contact. Those that do take this into account most often compare jobs from different economic sectors and/or skill levels, thereby confounding these factors with customer contact. For example, Dryakis and Vlassis (2010) find differences in their Greek study in callback rates across occupations with and without customer contact. The results are inconsistent with the customer contact hypothesis, and are hard to interpret because of the different economic sectors involved. Booth et al. (2010) also include occupations with and without customer contact from different economic sectors (data entry jobs and wait staff jobs). They find few differences between the callback rates for the different groups across these jobs, and conclude that that relatively little of the discrimination observed can be attributed solely to customer-based discrimination. Again, however, this interpretation is complicated by the involvement of different economic sectors. In a Dutch study, Derous (2011) asked recruiters to rate series of resumes for counter assistants and for clerical work. She found no evidence of customer discrimination. Although these jobs belong to the same economic sector, questions can be raised as to the external validity of this study, as it does not use field experiments, but is more akin to laboratory experiments. The present study includes jobs with and without customer contact in five economic sectors and across all skill levels, thus enabling us to separate effects of customer contact from other job characteristics. In line with the customer contact hypothesis, we expect to find more discrimination in jobs with customer contact than in jobs without customer contact.
Method
Occupations
For the purposes of this study, 62 professions were selected in five sectors (finance, local government, retail, hospitality industry, and health care), with and without customer contact and varying in required skill level (low, intermediate, and high). The relatively high number of occupations allows the effects of customer discrimination, occupational/skill level and economic sector to be disentangled. Selected occupations include store salesman, waiter, policymaker, cook, product manager, human resource adviser, food and beverage manager, cleaning staff, tax adviser and commercial assistant.
Ideally, our research design would be completely balanced, covering all possible combinations of sector, skill level, jobs with and without customer contact with the ethnic background and gender of the applicants. As this would require at least 34.000 observations, however, we have resorted to a correlational design in which we mix as many factors as we can, and subsequently control for possible confounding factors in the analyses. Thus, each ethnic group has responded to jobs with and without customer contact, to jobs in different sectors and to jobs at various skill levels. But, ethnic groups have not responded to the same job types, nor have men and women responded to the same job types.
To ensure reasonable progress in the collection of observations, we selected only occupations in which demand for labor was sufficiently high. Job openings were found through job portals on the Internet and geographically spanned all of The Netherlands. We had postal addresses in the four largest Dutch cities (which form the main economic region in The Netherlands), as well as in all quarters of the country.
The Applications
For each occupation, two job resumes and two application letters were created. For low-skilled occupations the application letters were very brief, merely stating that the sender wished to respond to a particular vacancy and that information on working experience and education was to be found in the attached resume. For each of the intermediate and high-skilled jobs, a standard application letter was written by a specialist agency. In the first part of this letter, the applicant stated his/her wish to apply for a particular vacancy. The second paragraph made clear why the applicant wanted to take the position and/or join the particular company concerned. This paragraph was adapted for each vacancy to demonstrate knowledge of technical terms and to ensure a good fit with the particular job opening. Lastly, the letter stated why the applicant would be a suitable candidate for the job in question, drawing on the working experience and educational information in the applicant’s resume.
The first drafts of both resumes and application letters were presented to a panel of employers with experience in selection processes in the appropriate sector. Five panels consisting of about five experts were consulted. They judged the resumes and letters for accuracy, appropriateness and equivalence. The resumes and letters were subsequently adapted, so that two accurate and equivalent resumes and application letters were obtained for each job.
Procedure
Applications at the intermediate and higher occupational level were either sent by e-mail or post. In the lower segment of the labor market, it is fairly common to respond to a job opening through direct contact with the employer: Candidates either apply in person, or they call the company on the telephone. Increasingly, however, these applicants also use digital means to apply for jobs, by either filling out application forms on the Internet or sending an e-mail to the recruiter. At the lower skill level, therefore, we responded to half the job openings by sending e-mails, and to the other half by telephone. The method used for individual vacancies did not vary, so either both fictitious candidates responded by mail or by telephone. The telephone applications were performed by professional actors, who were trained to act in accordance with the educational level stated on their fictitious resumes. Before the training of actors we made up a list of questions that might be posed by employers, with two different but equivalent answers. For example, if an employer were to ask the applicant his/her current wage, answer A would be the hourly wage, whereas answer B would be the same wage but reformulated as a monthly wage.
The actors responded to a job vacancy on the same day, with at least one hour between the two applications. We varied the order in which actors called the employer (half of the time the Dutch candidate called first, in the other half of cases the migrant candidate was first to call), and also varied their resumes (half the time resume A belonged to the Dutch applicant, in the other half of the tests resume A belonged to the migrant applicant).
For each vacancy, a native Dutch name and a name that signaled ethnic minority origin were randomly assigned to the two resumes and application letters. We selected frequently used Moroccan, Turkish, Surinamese and Antillean names. Surinamese and Antillean names may not always be easy to distinguish from Dutch names, and in the case of the fictitious Surinamese and Antillean candidates a birthplace in Surinam (Paramaribo) or the Netherlands Antilles (Willemstad) was therefore added to the resumes. In the telephone applications the Surinamese and Antillean actors were instructed to signal ethnic origin by using a slight accent. It was made clear in the resumes that the entire school career of the applicant had been completed in the Netherlands. The Moroccan and Turkish candidates were provided with a birthplace in the Netherlands. Native Dutch actors played Moroccan or Turkish job candidates in the telephone tests; they were trained to pronounce their Moroccan or Turkish names with a clear accent in order to signal ethnic origin. During the remainder of the conversation, however, they spoke Dutch fluently and without an accent.
The employer could contact the fictitious applicants by e-mail, post or telephone. We had set up six different voicemail boxes with the telephone service provider’s standard message (“You have reached the number [. . .]. Please leave a message after the beep”), which was ethnically and gender-neutral.
Employers’ messages were recorded and subsequently coded. Only tests with clear outcomes were included in the analyses. Efforts were made in all cases to ascertain the meaning of a callback. For example, employers who left a message asking the applicant to call back were contacted by e-mail by the fictitious applicant to determine whether the employer had any interest in the applicant or wanted to let them know in person that they were not considered suitable for the job. If the purpose of the employer’s call remained unclear, the test was not included in the analyses. Thus, our dependent variable measures the job interview invitation rate (1 = invitation rate, 0 = rejection). Most studies use a callback rate, where all contact by the employer is interpreted as interest. This is however not always the case: Some employers had additional questions and subsequently rejected a candidate, others preferred to explain by telephone why a candidate had been rejected. By investing extra effort to ascertain the meaning of the calls, we obtained a clearer dependent variable.
Results
Descriptive Results
We conducted the experiment between May 2008 and December 2008. Table 2 shows that during this period we sent 2,680 applications for 1,340 job vacancies. 1,140 were written applications; the remaining 200 were submitted by telephone. Each job vacancy received an application from two equivalent candidates, who differed only in ethnic origin. Other factors in the research design, such as gender, were kept constant in each test, so as not to confound the ethnic factor with other variables.
Descriptive Results for Correspondence Testing
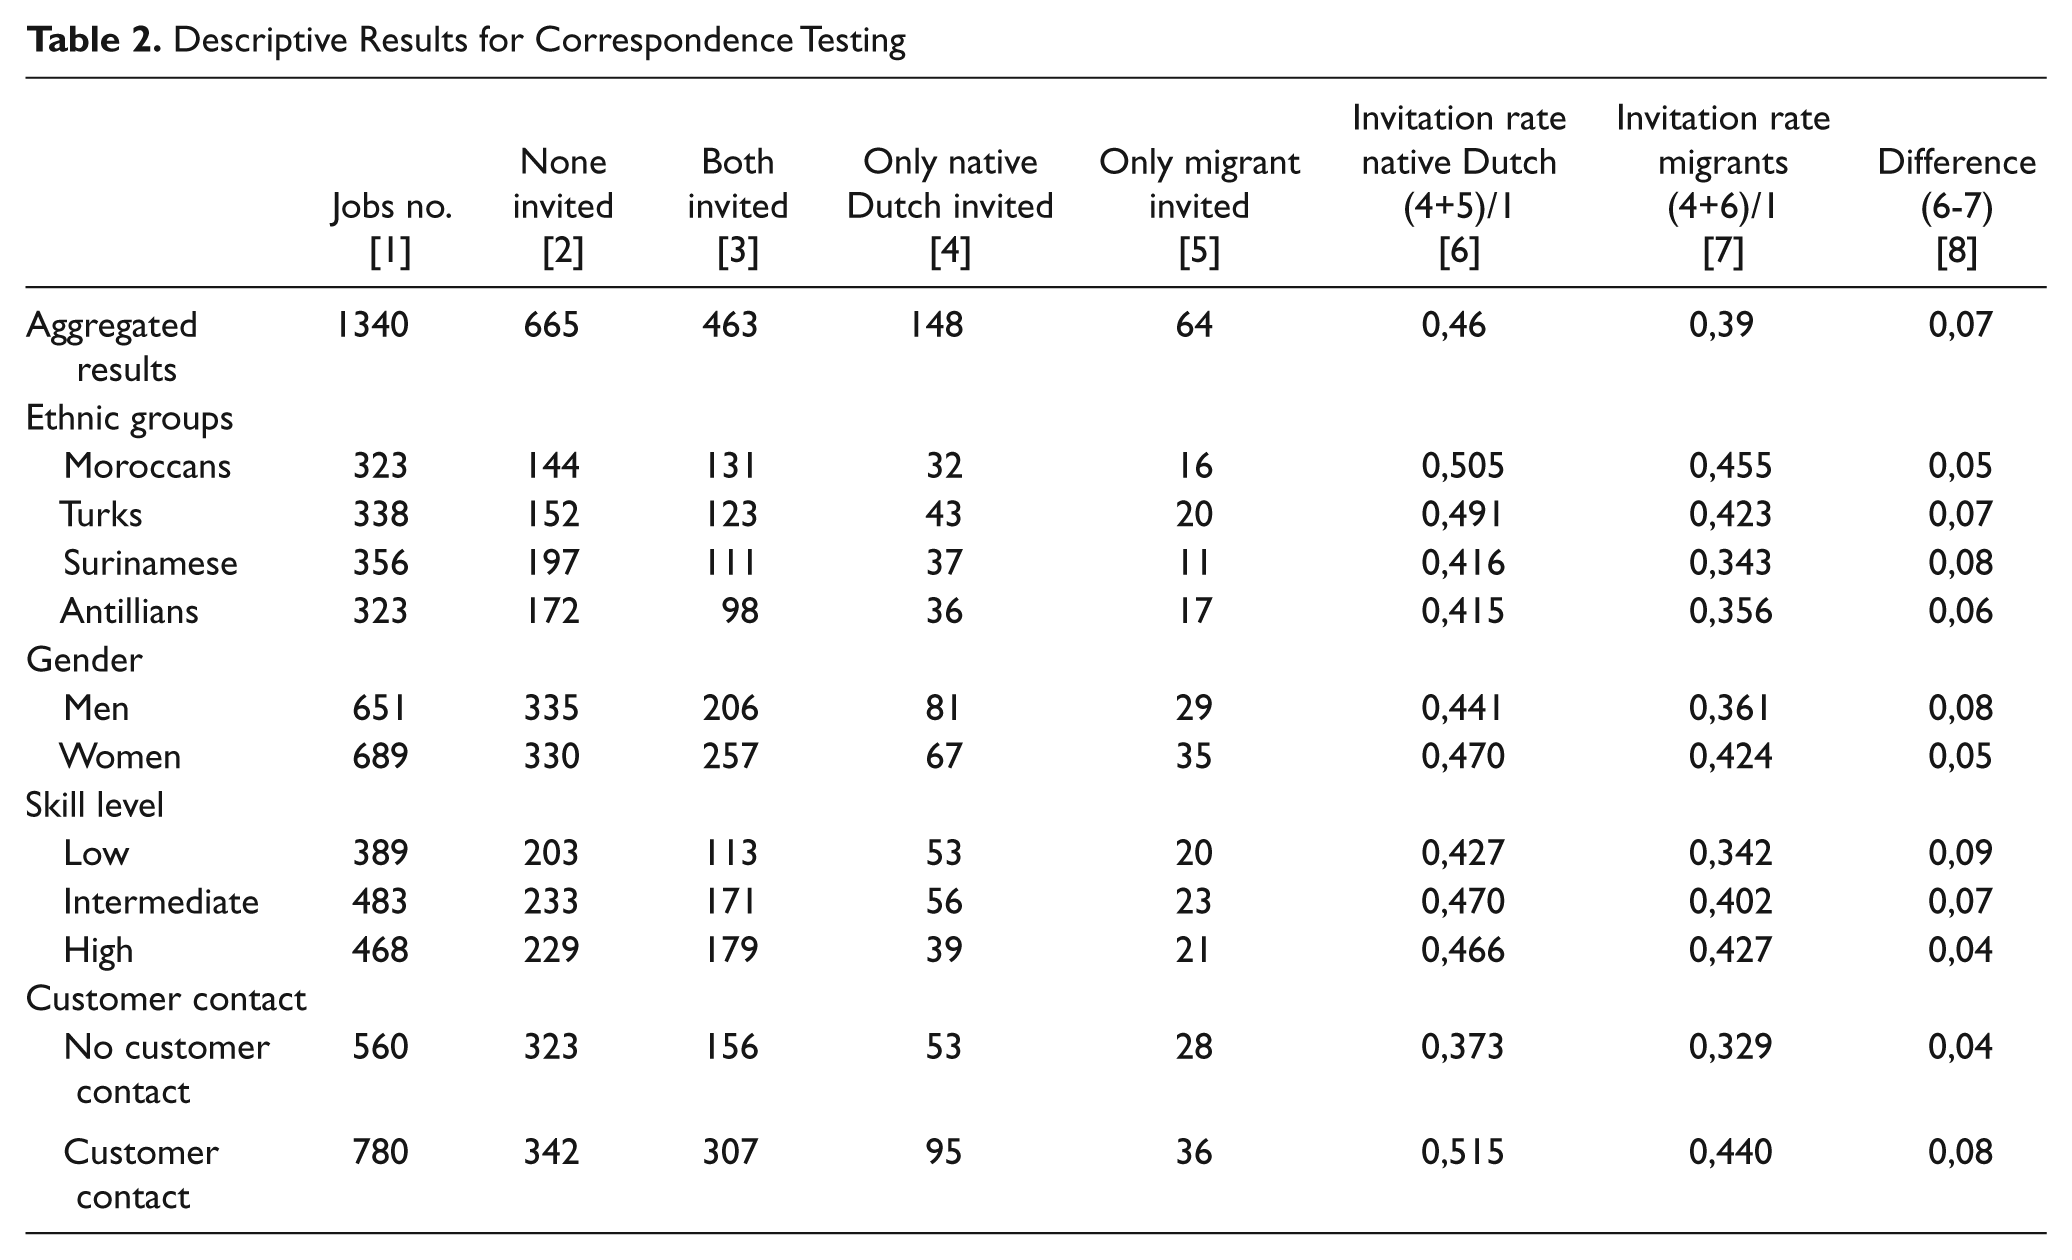
A test has four possible outcomes: neither of the applicants is invited for a job interview, both are invited for a job interview, only the native Dutch candidate is invited, or only the migrant applicant is invited. From the first row in the table we see that in 665 cases neither applicant was invited, while in 463 cases both applicants were invited. In 148 cases only the native Dutch applicant was invited (and the migrant was rejected), and in 64 cases only the migrant applicant was invited (and the native Dutch candidate rejected). Note that a preference for a native Dutch candidate over an ethnic minority candidate is most often interpreted as discrimination on the part of the employer, whereas a range of explanations is provided for the opposite case in which an employer prefers an ethnic minority candidate, for example, to provide a cultural or linguistic fit between the customers and employees of a firm (Gordon, Edwards, & Reich, 1982), to acquire a self-recruiting labor supply (Rodriguez, 2004), to pay lower wages (Browning & Rodriguez, 1985), or out of a desire for positive image-building by having a diverse workforce or because of a perceived moral obligation to society (Nievers, 2010).
The interview invitation rates are calculated in column 6 and 7. This is the number of times a particular applicant was invited for a job interview divided by the total number of job vacancies they applied for. The last column calculates the difference between the callback rate for native Dutch and migrant applicants. The other rows in the table show the descriptive results for the different ethnic groups, for migrant men and women, for jobs at different skill levels and for jobs with and without customer contact.
Empirical Analyses
We analyzed the differences in the probability of being invited for a job interview by means of multilevel logistic regression analysis because of the hierarchical structure of the data. Multilevel techniques make it possible to simultaneously analyze variables at their appropriate level.
Multilevel techniques are well suited to analyze our data, because of their nested structure. At the lowest level, 2,684 individual (fictitious) job candidates are distinguished. Two candidates applied for the same job vacancy, forming the second level (1,342 vacancies). The selected occupations form the highest level: 62 occupations. We also chose to use multilevel techniques to take into account the fact that different categories of candidates (men, women, different ethnic groups) applied for different job types. The chances of being invited for a job interview may differ between job types. For example, the chances of being invited are much higher for policymakers than for human resource managers. However, the fictitious job candidates applying for policymaker jobs were males, human resource candidates were females. A multilevel analysis allows these and similar differences between job types to be taken into account. In addition, in the analyses we controlled for all other differences apart from ethnic background between the job candidates. Control variables included gender (except when testing for gender differences), age, years of work experience, skill level (except when testing for differences in skill level), whether customer contact was part of the job (except when testing for differences between jobs with and without customer contact), sector, whether it was a written or a telephone test and the competition level in a job type. This last measure represents the relative proportion of job vacancies within a specific job type where both fictitious candidates were rejected. The higher the proportion, the lower the chance of being invited for an interview in that particular type of job. By including this measure in the analyses we seek to control for differences between job types in the chance of being invited for a job interview.
Discrimination in the Dutch Labor Market?
We estimated a model to analyze the probability of native Dutch and migrant applicants being invited for a job interview with the interview invitation dummy as the dependent variable and ethnic background as a predictor (Model 1 in Table 3). Despite being comparably qualified, ethnic minority candidates have a significantly lower chance than equivalent native Dutch candidates of being invited for a job interview. The difference in calculated predicted probabilities of being invited for a job interview between native Dutch and migrant applicants amounts to 7 percentage points, or 16%. In other words, while the Dutch candidate has to write between 13 and 14 applications to receive six invitations, the migrant applicant has to send 16 applications to receive the same number of invitations. This difference is significant at the 1% level, and is very much in line with results found in Germany for callback differences between German and Turkish applicants (Kaas & Manger, 2010).
The Probability of an Invitation for a Job Interview
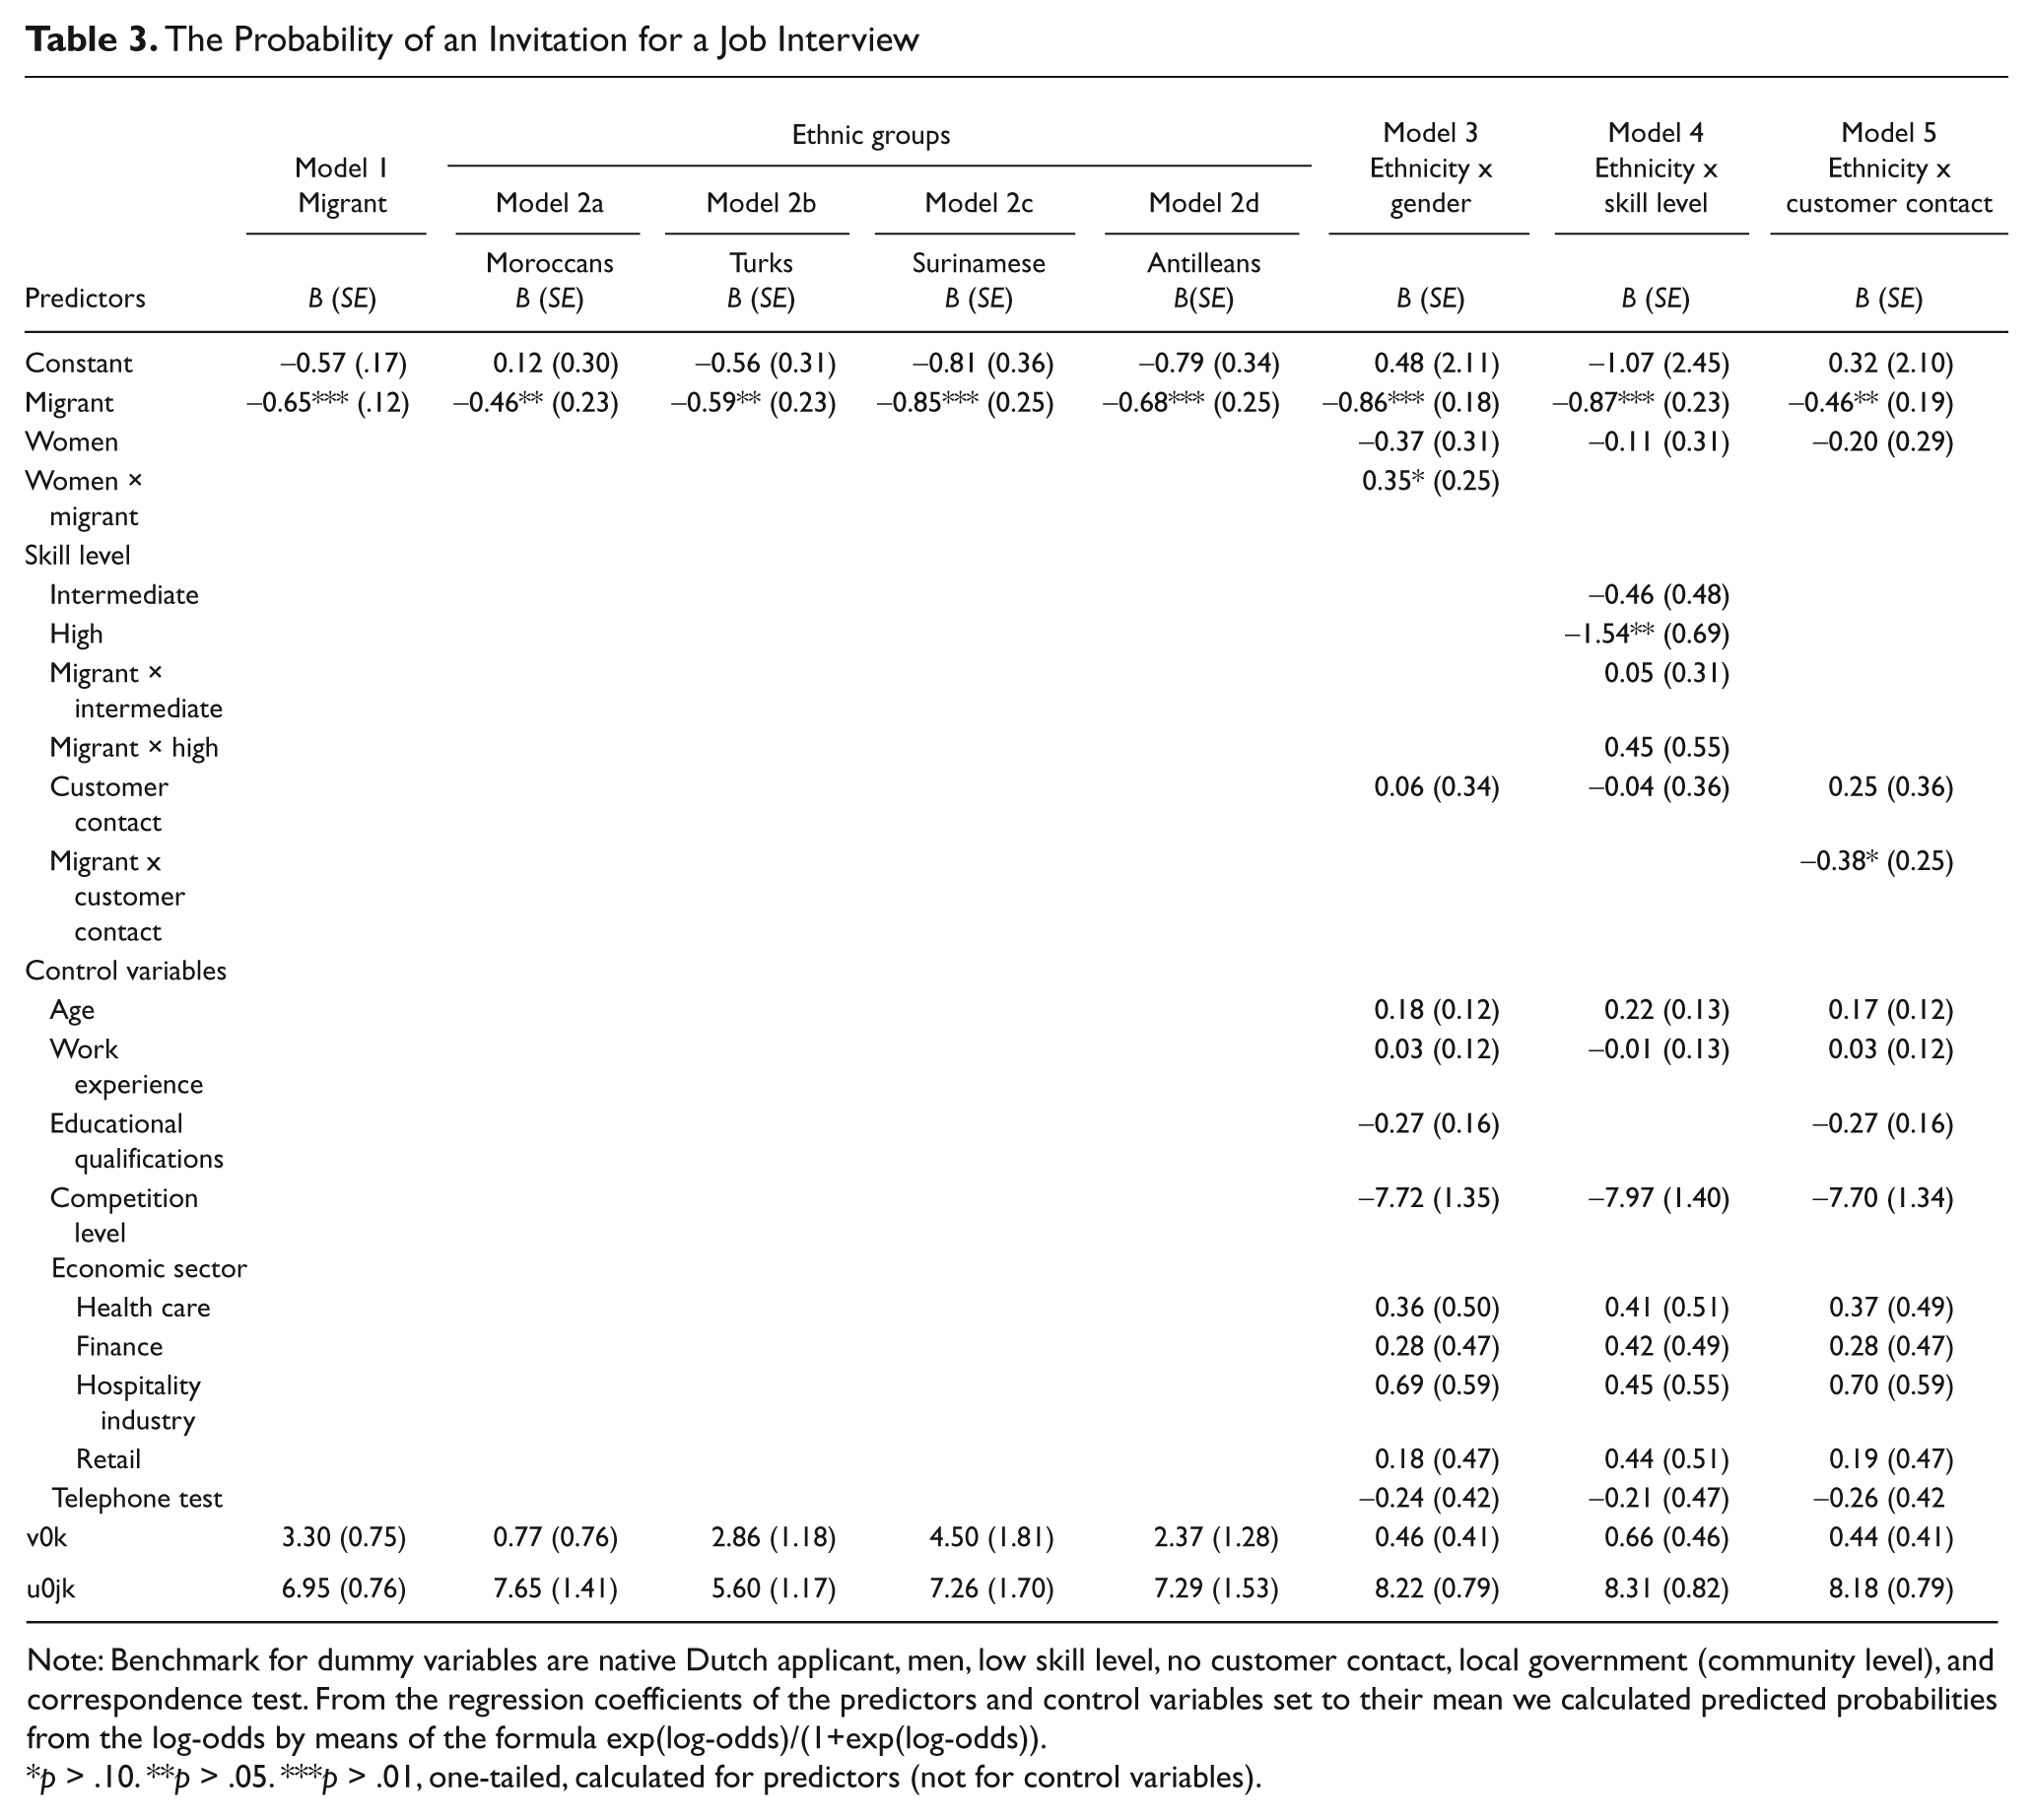
Note: Benchmark for dummy variables are native Dutch applicant, men, low skill level, no customer contact, local government (community level), and correspondence test. From the regression coefficients of the predictors and control variables set to their mean we calculated predicted probabilities from the log-odds by means of the formula exp(log-odds)/(1+exp(log-odds)).
p > .10. **p > .05. ***p > .01, one-tailed, calculated for predictors (not for control variables).
Differences Between Ethnic Groups?
Next, we explored discrimination rates for the four ethnic groups separately. We estimated probabilities of being invited for a job interview for the different ethnic groups compared to their matched native Dutch applicants (Model 2a to Model 2d in Table 3). All ethnic groups have a significantly lower chance of being invited for a job interview than equivalent native Dutch candidates. Surprisingly, the differences compared with the native Dutch candidates are quite similar across ethnic groups, ranging from 5 percentage points for applicants of Moroccan origin to 8 percentage points for those of Surinamese background. To illustrate the meaning of these figures, where a native Dutch applicant has to send ten applications in order to receive five invitations, Moroccan applicants have to send 11 applications (5 pp. difference) and Turks 12 (7 pp. difference). The jobs to which Surinamese and Antillean applicants responded require 12 applications to obtain five invitations for native Dutch applicants, while the Antillean applicants need to send 14 applications (6 pp. difference) and Surinamese candidates between 14 and 15 (8 pp. difference). The differences between the ethnic groups are not in line with the expected order from the ethnic hierarchy in The Netherlands, which place Moroccans and Antilleans at the bottom, and Surinamese and Turks above these groups. Also, the small size of the differences suggests that employers hardly distinguish between the ethnic groups, but do seem to draw the line between native Dutch candidates and migrant groups as a whole.
Double Burden or Increased Threat?
Discrimination against migrants and discrimination against women have been documented quite frequently in the literature. This begs the question of whether the combination of the two characteristics (being a migrant AND a woman) makes people even more vulnerable to discrimination. In contrast to this double burden hypothesis, it is also argued that migrant men face more discrimination since they are seen as more threatening. We tested for these competing hypotheses in a logistic multilevel model with a main effect for being a migrant and being a woman and an interaction effect of the two terms (Model 3). This model also includes a number of control variables to adjust for possible confounding effects of other variables such as job characteristics. The difference in the probabilities of being invited for a job interview are smaller between native Dutch and ethnic minority women than between native Dutch men and ethnic minority men. The interaction effect is significant at the 10 percent level, indicating a weak effect. The difference for men amounts to 9 percentage points, which is equivalent to saying that ethnic minority men have 20% less chance of being invited for a job interview. The differences in probabilities for the women are not as great as for men: The absolute difference is 5 percentage points, meaning that ethnic minority women have an 11% less chance of being invited for a job interview. The findings offers some support, albeit weak, for the subordinate male target hypothesis, suggesting that migrant men are perceived as more threatening and are therefore discriminated against to a greater extent than migrant women.
Job Characteristics and Discrimination
As regards the effect of job characteristics on discrimination, we first looked at differences in discrimination rates across skill levels. There is some empirical evidence that more discrimination is found in the lower segments of the labor market (Bovenkerk et al., 1995; Carlsson, 2010). We tested for possible differences in a multivariate multilevel logistic regression, calculating the probabilities of being invited for a job interview for native Dutch and ethnic minority applicants with lower, intermediate and higher educational training. In the analysis we controlled for gender, age, years of experience, customer contact in the job, sector, type of test (telephone or correspondence) and level of competition in job type (see Model 4). We found the difference between native Dutch and ethnic minority applicants to be larger for lower educated candidates than for higher educated candidates. The difference in probabilities of being invited for a job interview for lower educated native and ethnic minority candidates amounts to 8 percentage points, indicating that lower educated members of ethnic minorities have 20% less chance of being invited for a job interview than equally qualified native Dutch candidates. The difference between native Dutch and ethnic minority applicants with intermediate levels of training is about the same (19%). For the higher educated applicants, however, the difference in probability is much smaller: Ethnic minority candidates have 6.5% less chance of being invited for a job interview than comparable native Dutch candidates. The difference is still significant, implying that higher educated members of ethnic minorities are also discriminated against, but the analyses show that the extent of discrimination is much greater at the lower end of the labor market. This is a troubling result, given that the majority of ethnic minorities in the Netherlands have a lower or intermediate educational level.
Secondly, we compared discrimination rates for jobs with and without customer contact. An interaction effect of migrant and customer contact was added to a model with main effect for migrant and customer contact. The model also included the usual control variables (Model 5). Overall, the chances of securing a job interview are higher for occupations with customer contact. At the same time, however, the differences in invitation rates for native Dutch applicants and migrants are also higher for jobs with customer contact compared to jobs that do not involve customer contact. This effect is significant at the 10 per cent level, indicating a weak effect. Hence, we do find some evidence for customer discrimination, but conclude that relatively little of the discrimination observed can be attributed solely to this phenomenon.
For the sake of completeness, we added a model that included the interaction effect of migrant and employment sector to test for differences in discrimination rates between sectors (see Table 4). We found that in all sectors, except for the local government, discrimination is an issue in selection procedures. Although absence of observed discrimination in the local government sector is a positive finding, this does not imply that this is a discrimination-free environment. For example, Byron (2010) has shown for the United States that promotion discrimination is a particular issue in the public sector.
The Probability of an Invitation for a Job Interview in a Model With Migrant × Economic Sector

Note: Benchmark for dummy variables are native Dutch applicant, men, no customer contact, local government (community level), correspondence test. From the regression coefficients of the predictors and control variables set to their mean we calculated predicted probabilities from the log-odds by means of the formula exp(log-odds)/(1+exp(log-odds)).
p > .10. **p > .05. ***p > .01, one-tailed.
Furthermore, most discrimination was found in the retail sector and the hospitality industry, regardless of customer contact and skill level. These sectors have a relative higher share of migrant workers, compared to the financial and the health care sectors. A possible explanation can be found in statistical discrimination due to negative experiences (cf. Nievers, 2010). In sectors with higher shares of migrants, chances of having a negative experience with a migrant worker increase. Employers may extrapolate a negative experience with a migrant worker to the ethnic group and subsequently estimate a higher risk factor for individual job candidates from that group. In addition, a higher share of low skilled jobs in the retail sector and hospitality industry may attract more migrants with few educational training. Employers report more negative experiences and attitudes about lower educated migrants, than with higher educated migrants (Nievers, 2010). Thus, the higher discrimination rates in retail and hospitality may be due to the workings of statistical discrimination. Apart from these possible explanations, the difference in discrimination rates across sectors underlines our point about measuring discrimination across target job characteristics (e.g., customer contact) within employment sectors, so as not to confound effects of different job characteristics.
Discussion
Migrants suffer from enduring disadvantage in the labor market all over Europe (Heath & Cheung, 2007). However, it is not easy to determine whether (alleged) ethnic origin is the factor behind exclusion and disadvantage. People in general have become much less willing to admit that they are prejudiced or uphold stereotypes (Devine & Elliot, 1995). Therefore, simply asking employers whether they consider ethnic origin in itself to be a sufficient reason to reject a job candidate may not elicit valid information about the amount of ethnic discrimination in the labor market. In similar vein, reported experiences with discrimination by members of ethnic minorities may give rise to biased estimates of the extent of labor market discrimination. For example, someone may feel that their ethnic origin was the reason for not being offered a job, whereas in reality the employer based their choice on differences in relevant work experience between the candidates. Similarly, a person may not feel discriminated against, when discrimination was actually the reason for rejection. Also, comparative statistical analyses are unable to isolate ethnic origin unambiguously as a cause for the disadvantaged labor market position of ethnic minorities, due to the omitted variable bias. The shortcomings of these methods in isolating ethnic origin as a responsible factor from other characteristics or tendencies is one of the reasons behind the increasing popularity of field experiments as a means of studying discrimination.
Field experiments are however rather time-consuming, forcing researchers to limit themselves to studying parts of labor market. At the same time, researchers are increasingly aware of the complexity of discrimination. Not only does discrimination take place in multiethnic societies where people belong to different social groups simultaneously, but different mechanisms also seem to play a role in different segments of the labor market. For example, (alleged) preferences of customers may cause employers to discriminate against migrant workers in jobs that involve contact with these customers; while greater competition for jobs may result in increased hostility between groups. Recent field studies have therefore focused more and more on interactions between the applicant’s ethnic background and other personal characteristics (such as gender) or job characteristics (such as customer discrimination). Despite limitations in some of these studies, studying interactions is a promising way forward, as it allows for a better understanding of the complexity of intersections and mechanisms that play a role on the labor market. Our study fits in with this new approach, and aims to add to this body of literature by situating it against a complex background (including multiple ethnic groups, men and women) and by disentangling effects of sector, segment and customer contact.
Multiple Group Membership and Discrimination
This study shows that ethnic minorities do encounter discrimination on the Dutch labor market. Despite being comparably qualified, ethnic minorities have a smaller chance of being invited for a job interview than their native Dutch counterparts. Social exclusion of groups based on ascriptive characteristics is a serious form of social injustice. In addition, exclusion of workers on the basis of group membership is ultimately a waste of talent and potential. For example, discrimination in recruitment procedures may lead to job segregation within firms, which in turn adversely affects performance-related attitudes on the part of minority workers (Dickerson, Schur, Kruse, & Blasi, 2010).
The very favorable economic environment in which the study took place, as well as the excellent resumes of the (fictitious) non-Western candidates, leads us to consider the amount of discrimination found as substantive. During a period of economic strength, which was the case in The Netherlands at the time the fieldwork was performed, the need for labor is high. Companies therefore have to accept more deviations from their envisaged ideal candidate. Nonetheless, names and/or birthplaces signaling a nonnative background were sufficient to create inequalities. It seems probable that in an economic recession the extent of discrimination will be higher than we find in the present study (Andriessen, 2010; Bean, Leach, & Lowell, 2004).
In line with earlier Dutch research (Bovenkerk et al., 1995), we found no pronounced differences in discrimination rates between ethnic groups. Apparently, employers distinguish between native Dutch and immigrants, with no further distinctions between different immigrant groups. This could mean that the more negative stereotyping of some ethnic groups does not translate into acts of discrimination. Alternatively, absence of intergroup differences might be explained by a process of subtyping (Richards & Hewstone, 2001): When individual members of a minority group deviate markedly from the prevailing stereotype of that group, they are not regarded as being a member of that group, but as a subtype to that group. The prevailing ethnic hierarchy in The Netherlands would predict the most vulnerable position for Moroccan migrants. The fictitious Moroccan applicants in this study all had excellent resumes, showed themselves to be highly motivated and having a perfect command of the Dutch language. Employers therefore could consider stereotypes about Moroccans as not being applicable to this specific applicant. There is some empirical support for this interpretation: In interviews, employers have expressed their admiration and support for Moroccans with good resumes (Nievers, 2010). To look into this phenomenon more deeply, we suggest setting up field experiments that vary the degree to which ethnic groups correspond to their dominant stereotypes. Lastly, we cannot completely rule out confounding effects of the research design in which the ethnic groups responded to different job types. It is possible that a non-Dutch ethnic background is an advantage for certain types of jobs as a form of allocative discrimination (e.g., youth worker or social worker in communities with a substantial share of immigrant youth; Huffman & Cohen, 2004). As Moroccans in particular seem to be overrepresented for these types of jobs in our sample, discrimination rates for this group will possibly be higher when other occupations are studied. Also, for applicants of Antillean and Surinamese origin, additional markers were used to signal ethnic origin (birthplace, having a slight accent). We cannot rule out possible effects of these markers.
With a view to multiple social group membership, we studied interaction effects of ethnic background and gender. We found that, in contrast to the double burden hypothesis, migrant men are more vulnerable to discrimination than migrant women. This supports the subordinate male target hypothesis, which predicts higher levels of discrimination for groups with mixed status (men = high, migrant = low), because they are perceived as more threatening. The finding of less discrimination against migrant women in the first phase of the selection process is not necessarily at odds with the observation that migrant women are among the most vulnerable workers, as their employment position is less stable and they are more likely to experience employment hardship, such as unequal pay or inequalities in promotion (Donato, Wakabayashi, Hakimzadeh, & Armenta, 2008; Robinson, Taylor, Tomaskovic-Devey, Zimmer, & Irvin, 2005).
Discrimination and Job Characteristics
Our research design included jobs requiring low, intermediate and high skill levels in all five sectors, allowing us to test for differences in discrimination rates across these levels. We found that discrimination occurs more in low-skilled jobs requiring a minimum amount of training, than in high-skilled jobs requiring extensive and specialized training. This finding concurs with results from comparative survey studies that find higher ethnic residuals in the lower segment of the labor market. We can think of several interpretations. First, higher skilled jobs might require more specific skills (e.g., a specific bookkeeping task), whereas lower skilled jobs require more general skills (e.g., being hospitable or friendly) and can therefore be less precisely judged on the basis of a job resume. It may be possible to regard a waitressing job as an example of the need to be hospitable and friendly, but interpretations as to what counts as being friendly may vary more widely than the question whether a person is able to perform a specific bookkeeping task. A wider scope for interpretation area may lead to more opportunities for discrimination.
At the same time, we can also think of other explanations for the results. For one thing, recruiters at the higher skill level tend to have a higher education themselves, and more highly educated people tend to be less prejudiced. On the other hand, fewer migrants work at the higher skill levels. As a result, people at the higher skill levels have fewer experiences with migrants in their jobs, and consequently also have fewer negative experiences with migrants to extrapolate to other migrants (Nievers, 2010). Despite the undetermined explanation for the higher rate of discrimination in the lower segments of the Dutch labor market, the finding remains important as this segment of the labor market is also the main employment arena for migrants in The Netherlands.
As well as studying effects of skill levels on discrimination, we set out to study the effect of customer contact on discrimination. To this end, we included jobs with and without customer contact across skill levels and economic sectors. In line with Becker’s taste for discrimination, we found that employers favor native Dutch applicants more than migrants, and more so for jobs which involve customer contact than for jobs without customer contact. The result holds across economic sectors and skill levels, and is therefore an important addition to previous field studies where customer contact, skill level and economic sector could not systematically be separated.
Questions Raised by This Study
The results of our study show that discrimination persists in the Dutch labor market: Migrants have a smaller chance of being invited for a job interview than native Dutch candidates with the same qualifications. Similar results have been found in many other countries. Strikingly, the extent of ethnic discrimination that we found is rather similar to that found in field studies in Germany (Kaas & Manger, 2010) and Sweden (Carlsson, 2010), but is rather different from the main Dutch study in 1995 (Bovenkerk et al., 1995); Bovenkerk found a much higher discrimination rate. This poses several questions. First of all, has discrimination declined over the past 15 years? And if so, what has caused this decline? Is this a trend for The Netherlands only, or can it be observed in other countries as well? These questions call for international comparative research on both the magnitude of ethnic discrimination across countries and the factors that may explain differences or similarities across countries. For example, do jurisdiction, law enforcement, political climate or welfare state arrangements matter for discrimination?
Our study fits into an upcoming strand of research in which field experiments are used to study intersections of membership categories and job characteristics. This approach makes it possible to study discrimination in all its complexity, as well as to identify segments and groups that are most vulnerable to discrimination. We have found only weak support for the relationship between job characteristics and multiple group membership on the one hand and discrimination on the other. Apparently, the most relevant distinction is that between native Dutch and migrant citizens. Economics, sociology and psychology have each offered their own (persuasive) explanations for this phenomenon. Our study is not able to determine whether the mechanism underlying discrimination is a matter of taste, of stereotypes and prejudice or of using information on the average group member. More research is needed to investigate these underlying mechanisms. In addition to the comparative research line mentioned above, we believe it would be fruitful also to incorporate a more micro-perspective. Companies and organizations within the different skill levels and sectors vary in terms of the amount of observed discrimination. This begs the question of what causes these differences. Is it mainly the personal characteristics of recruiters? This line of reasoning has been taken up for example by research that uses Implicit Association Tests (e.g., Rooth, 2010). Or do company characteristics matter for discrimination (e.g., a company’s organizational context, its policy on inclusion of difference, workforce composition)? This is a theme that has remained relatively underdeveloped in quantitative stratification research (Reskin, McBrier, & Kmec, 1999; Robinson et al., 2005). Future research may focus on these matters.
Footnotes
Declaration of Conflicting Interests
The authors declared no potential conflicts of interest with respect to the research, authorship, and/or publication of this article.
Funding
The authors disclosed receipt of the following financial support for the research, authorship, and/or publication of this article:
This research was supported by the Dutch Ministry of Social Affairs and Employment and by the Netherlands Institute for Social Research.