



Abstract
We use a population-based longitudinal survey in China from 2002 to 2005 to examine age differentials in the association between severity of visual impairment and mortality risk in older adults. Controlling for numerous factors and baseline health, a substantial age difference is found. Young-old women and men aged 65 to 79 with severe visual impairments have 161% (hazard ratio = 2.61) and 52% (hazard ratio = 1.52) higher risk of death respectively as compared to their unimpaired counterparts. Mild impairment does not increase mortality risk among young-old adults, while both mild and severe impairment increase mortality risk by 33% and 32% for women and 24% and 34% for men among the oldest-old as a whole when all factors are controlled for. We conclude that visual impairment is an independent predictor of mortality and severe visual impairment likely plays a stronger role in determining mortality risk among young-old adults than among the oldest-old.
Introduction
Visual impairment is very common among older adults and accelerates with age due to age-related diseases such as macular degeneration, senile cataracts, and presbyopia (Kovacs, 2005; Wun, Lam, & Shum, 1997). Low visual capacity is associated with adverse health conditions, poorer psychological well-being, and lower quality of life (Berger & Porell, 2008; Broman et al., 2002; Chou & Chi, 2005; Horowitz, 2004; Ivers, Cumming, Mitchell, & Attebo, 1998; Jacobs, Hammerman-Rozenberg, Maaravi, Cohen, & Stessman, 2005; Mann, Hurren, Tomita, & Charvat, 1995; Rovner, Zisselman, & Shmuely-Dulitzki, 1996; Wang, Chan, Ho, & Xiong, 2008). With few exceptions (e.g., Klein, Klein, & Moss, 1995), most studies from Western populations have found that visually impaired persons carry a greater risk of mortality, independent of demographic, socioeconomic, and health factors (Berdeaux, Brézin, Fagnani, Lafuma, & Mesbah, 2007; Christ, Lee, Lam, Zheng, & Arheart, 2008; Lee, Gómez-Marín, Lam, & Zheng, 2002; McCarty, Nanjan, & Taylor, 2001; Wang et al., 2001).
Several studies further find that the association between visual impairment and mortality may be weaker among people aged 75 or older than among people aged 74 or younger (e.g., Cugati et al., 2007; Karpa et al., 2009). The weaker association among very old participants is mainly related to their selective survival that produces a relatively robust oldest-old subpopulation (Karpa et al., 2009). Yet no studies have looked at age differences in the association between visual impairment and mortality and whether it differs among octogenarians, nonagenarians, and centenarians, a group that will rapidly increase in size in the next few decades (McCormark, 2004). Furthermore, it is unknown whether the weaker association among old adults beyond age 75 is still valid once the severity of visual impairment is also taken into account, a topic inadequately studied in the literature (Cacciatore et al., 2004; Christ et al., 2008). Finally, a number of studies have articulated that visual impairments can be prevented or treated in some degree with medical advancements (Chian, Javitt, & Metrick, 1994; Orr, Barrón, Schein, Rubin, & West, 1999). Findings from developing countries where medical technology and development are limited would produce valuable knowledge about the association between visual impairment and mortality outside of health services interventions. So far, only a handful of local studies in China have found an increased mortality risk for visually impaired persons among adults aged 50 or older (e.g., Li et al., 2011; Xu, Cui, Wang, & Jonas, 2008). Thus it remains largely unclear whether associations between visual impairment and mortality found in Western countries still hold in China where most people have few resources to mobilize and limited access to medical services for visual care and treatments (Li et al., 2004; Xu et al., 2006; Xu, He, Wu, & Li, 1999; Zhao, Sui, & Jia, 2001).
In this article, we aim to examine age differentials in the association between low visual functioning and mortality among older Chinese adults using a national, longitudinal, representative sample from 2002 to 2005 in mainland China (hereafter China). We focus on differences by severity of impairment and between young-old adults and the oldest-old in China, an important distinction that has not been adequately addressed in prior research.
Method
Data
The data are from the 2002 and 2005 waves of the Chinese Longitudinal Healthy Longevity Survey (CLHLS). The CLHLS is the first national longitudinal survey of the oldest-old aged 80 or older in China. The CLHLS began in 1998 and has followed respondents every 2 or 3 years. The CLHLS sampling frame started with lists of centenarians that are available at the county/city level (lists of adults aged 80+ are not readily available at this level because their population size is too large). With few refusals, almost all centenarians were interviewed in a randomly selected half of the counties/cities of these 22 provinces totaling 871 counties/cities. For every centenarian, the CLHLS interviewed a randomly selected nearby octogenarian and a nearby nonagenarian with a predesignated age and sex. The term nearby refers to the same village or street, or the same town, county or city, where applicable. The goal of the sampling strategy was to include comparable numbers of randomly selected men and women at ages 80 to 99 so that each subsequent wave could have a sufficient number of very old respondents in the sample. Starting in the third wave in 2002, the CLHLS included young-old adults aged 65 to 79 as a comparison group. The sample selection strategy for the young-old adults was the same as that for the oldest-old. As all adults aged 65 to 99 were randomly selected, the CLHLS sample represents older adults in China very well (Gu, 2008).
A detailed description of the CLHLS design, sample distribution, and content of data collected can be found elsewhere (Zeng, Poston, Vlosky, & Gu, 2008). The data quality of the CLHLS was reasonably good and the psychometric measures were judged to be reliable and valid (Gu, 2008; Gu & Dupre, 2008). The total sample aged 65 to 109 in 2002 was 15,919, with 11,074 aged 80 or older and 9,114 women. The overall response rate for the 2002 CLHLS survey was 88%. Out of the total, 8,108 (50.93%) were reinterviewed in the 2005 wave, and 5,753 (36.14%) died before the 2005 follow-up. Dates at death were collected from officially issued death certificates whenever available for those who died between the survey intervals; reported dates from next-of-kin were collected as an alternative when death certificates were not available. All next-of-kin reported dates were verified with a local Residential Committee and/or neighborhood informants. There were 2,058 (12.93%) participants who were lost to follow-up with no information on survival status; thus the final analytical sample size with valid mortality information is 13,861.
Visual Assessment
The CLHLS collected data on performance-based visual functioning by examining whether the participant is able to see a break in a circle on a cardboard sheet under light 1 m away and distinguish the exact location of the break. The circle is about 13 cm in diameter and 0.3 cm thick with a 1-cm break. Possible outcomes include (a) able to see the break; (b) unable to see the break, but able to see the circle; (c) unable to see the circle; and (d) medically blind. Due to a small percentage of respondents who were medically blind (<2%), we collapsed categories into unimpaired (1), mildly impaired (2), and severely impaired (3 and 4). This performance-based visual assessment method is unique to the CLHLS. Comparison of prevalence rates of visual impairment in the CLHLS with other nationwide surveys using different methods found that the levels and patterns were similar (Gu & Dupre, 2008).
Control Variables
We controlled for various individual characteristics, including demographic factors (age, sex, ethnicity [Han vs. Non-Han], and urban-rural residence), socioeconomic conditions (white-collar job before retirement, self-perceived better living condition compared to neighbors, economic independence [daily expenses were mainly paid by respondents’ retirement wage/pension], any formal education, current access to health care services), family/social supports (marital status [married vs. nonmarried], number of living children, religious activities), health practices (ever smoked in the past 5 years [yes vs. no], ever used alcohol in the past 5 years [yes vs. no]), and self-rated health. All these factors have been documented to be associated with mortality and thus should be controlled in our analyses (Chen & Wu, 2008; Jacobs et al., 2005; Li et al., 2011; McCarty et al., 2001; Zeng, Gu, & Land, 2007).
Analytical Strategy
We fitted two nested Weibull hazard regression models by age group and gender among those who have information on survival status or dates at death to estimate the relative hazard (risk) of death from 2002 to 2005 associated with severity of visual impairment based on duration of exposure (days lived after the interview in 2002) and mortality status (died or survived at the 2005 interview). Model 1 adjusts for demographic variables, socioeconomic conditions, family/social support, and health practice, while Model 2 additionally controls for baseline health. Results excluding study participants without information on either survival status or date at death were comparable to those including these participants using a multiple imputation approach (Allison, 2002). We did not use weights in our models because we adjusted for factors related to sample design in multivariate regression modeling (Winship & Radbill, 1994).
Results
Table 1 presents frequency distributions for visual impairment and control variables by gender and age group. The observed age-sex-specific data on visual impairment in Figure 1 show that the prevalence rate of impairment (both severe and mild) increases from 6% to 10% at ages 65 to 69 to more than 50% to 60% at ages 100 or older. Figure 1 also indicates that the proportion of severe impairment among the impaired population increases from 40% at ages 65 to 69 to more than 60% at ages 100+. Women tend to have a higher prevalence rate of impairment and a greater proportion with severe impairment.
Sample Distribution by Study Variables, CLHLS 2002.

Note: Unweighted. CLHLS = Chinese Longitudinal Healthy Longevity Survey.
Reflecting % between 2002 and 2005, and all others were measured in 2002.
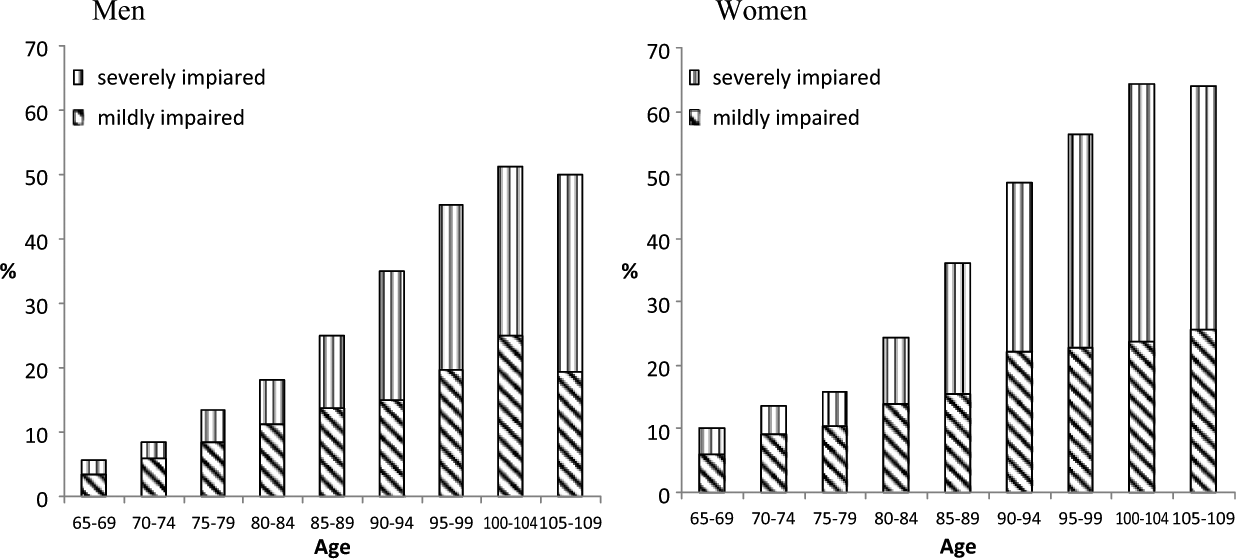
Observed age-specific prevalence rates of vision impairment by severity, CLHLS 2002.
Table 2 shows significant differences in mortality risk by age (young-old aged 65-69 vs. the oldest-old aged 80+) and by severity of visual impairment. Mildly impaired young-old adults (both men and women do not have significantly higher mortality risk as compared to their unimpaired counterparts. Yet, with an exception for mildly impaired male nonagenarians, mild visual impairment is associated with significantly greater mortality risk for all three oldest-old age groups analyzed compared to those who are visually unimpaired for both sexes. Severe visual impairment is associated with increased mortality risk for all age groups and sex groups, but the association is strongest among young-old women. The hazard ratios for severely impaired young-old adults reach 2.78 (95% CI: [1.83, 4.21]) for women and 2.01 (95% CI: [1.24, 3.23]) for men in Model 1. When baseline health is further adjusted for (see Model 2), the hazard ratio for severely impaired young-old adults is 2.61 (95% CI: [1.72, 3.96]) for women and 1.52 (95% CI: [0.94, 2.48]) for men. The corresponding ratios are significant but much lower among the oldest-old.
Hazard Ratios of Vision Impairment on 3-year Mortality, CLHLS 2002-2005.
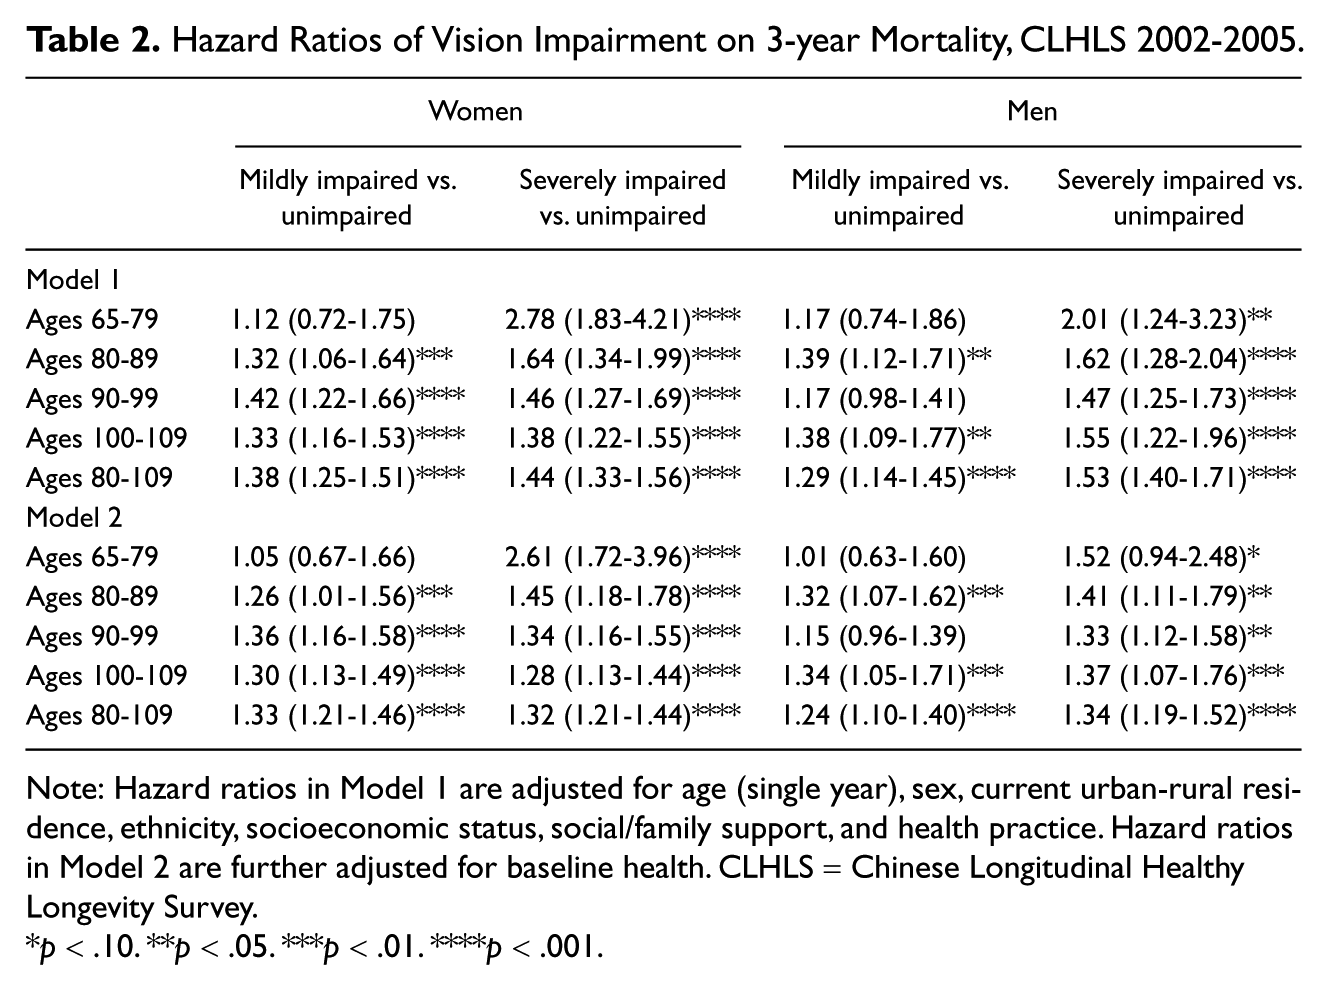
Note: Hazard ratios in Model 1 are adjusted for age (single year), sex, current urban-rural residence, ethnicity, socioeconomic status, social/family support, and health practice. Hazard ratios in Model 2 are further adjusted for baseline health. CLHLS = Chinese Longitudinal Healthy Longevity Survey.
p < .10. **p < .05. ***p < .01. ****p < .001.
Discussion
The link between visual impairment and mortality is not intuitive, yet visual impairment could be a predictor or associate of mortality for several reasons. First, visually impaired older adults are more likely to fall or have accidents that may be life-threatening (Ivers et al., 1998). Second, visual impairment is an indicator of aging, which is directly related to morality risk. Third, visual impairment might cause some functional impairments and morbidities (Berger & Porell, 2008; Broman et al., 2002), which affect psychological well-being (Jacobs et al., 2005), or may be linked to other diseases with unknown underlying mechanisms.
Using a nationally representative data set with more than 13,861 older adults from China, our analyses show that the association between severity of visual impairment and mortality differs by age group. Among the oldest-old, mildly and severely impaired men and women have similar excess mortality hazard compared to their unimpaired counterparts controlling for various confounders including baseline health. However, mortality risk varies significantly by severity of impairment among young-old adults. Mild impairment in vision has no significant effects on mortality risk for both sexes. Yet severely impaired young-old adults have much higher mortality risk than their unimpaired counterparts, a difference that is greater among young-old adults than among oldest-old adults. These findings indicate that severe visual impairment is more detrimental to the young-old than it is to the oldest-old. Gender patterns are similar by age group and severity.
These findings not only strengthen the growing consensus that visual impairment is an independent risk factor of mortality (Berdeaux et al., 2007; Jacobs et al., 2005; Lee et al., 2002; Li et al., 2011; Wang et al., 2001) but also highlight differences by severity and age, which extend previous findings by Karpa et al (2009). We speculate that several factors may contribute to this distinct age pattern by severity. First, visual impairment is not only an indicator of age but also an indicator of chronic illnesses for those aged 65 to 79. For example, diabetes and hypertension, which are risk factors of mortality and barriers to longevity, are more common among people aged 65 to 79 and can result in retinopathy or other forms of vision impairment (Klein, 2002). Thus visual impairment may be an indicator of more serious illness among young-old adults. Second, compared to their oldest-old counterparts, persons aged 65 to 79 are physically active and are generally expected to take care of themselves unless they are very sick or weak. Severe visual impairment may make them vulnerable to falls or other accidents and increase their level of distress. Third, because the likelihood of mortality in the oldest-old is very high and is determined by multiple risk factors, the independent risk from severe visual impairment could be very limited. It may be also plausible that the oldest-old are more genetically robust to dying from conditions related to visual impairments than those younger old adults (Cugati et al., 2007; Jacobs et al., 2005; Karpa et al., 2009). Fourth, the oldest-old with severe visual impairment may receive better care and family/social support compared to the old adults aged 65 to 79 in China because their children have a higher prevalence of filial piety compared to children of those aged 65 to 79 (China National Research Institute on Aging, 2003: Table 6-29, p. 222). More research on the interactions between age and severity of visual impairment in old adults is clearly warranted.
Nevertheless, conclusions of this study should be interpreted with considerations of several limitations of our study due to unavailability of data on (a) curative treatment or surgery that may underestimate the associations of visual impairment on mortality by coding respondents with poor vision that is corrected as unimpaired; (b) duration of impairment; (c) the causes of impairment (Barrett, 2005; Hodge, Whitcher, & Satariano, 1995; Horowitz, 2004; Quillen, 1999; Wun et al., 1997) and different types of visual impairments that likely have different effects on mortality; and (d) physical environments that are likely to be associated with mortality risk (Armstrong, Barnett, Casper, & Wing, 1998; Bell & Dominici, 2008; Wen, Cagney, & Christakis, 2005) and risk of visual impairment (Barrett, 2005).
Excess mortality risk associated with visual impairment among the oldest-old and substantial increases in mortality risk among young-old adults with severe visual impairment imply that it is important to identify comorbidities associated with visual impairment and that improving the health status of the oldest-old and those aged 65 to 79 with severe visual impairment may be a way to achieve healthy longevity. Our findings also have potential implications for improving China’s public health care system as it is currently facing unique challenges from rapid population aging. Finally, our findings may improve a physician’s repertoire for determining appropriate treatments and intervening at preclinical stages of impairment or before phenotypic criteria are detectable for old adults.
Footnotes
Acknowledgements
This article is based on a publicly available dataset derived from an ongoing project of the Chinese Longitudinal Healthy Longevity Survey (CLHLS), which is supported by R01 AG023627-01 (Zeng Yi, principal investigator) awarded to Duke University. The CLHLS was also supported by the United Nations Population Fund (UNFPA), China Natural Science Foundation, China Social Sciences Foundation, and Hong Kong Research Grants Council. The views expressed in this paper are solely those of the authors and do not reflect those of authors’ organizations. Jessica Sautter’s work was supported by AHRQ training grant T32HS000079. We thank reviewers for their very helpful comments.
Declaration of Conflicting Interests
The authors declared no potential conflicts of interest with respect to the research, authorship, and/or publication of this article.
Funding
The authors received no financial support for the research, authorship, and/or publication of this article.