



Abstract
As increasing numbers of adults are living longer and remaining in their communities as they age, city planners and leaders are exploring how cities need to adapt to ensure their community is age-friendly and a good place for residents to age-in-place. Using secondary data collected from mid-Atlantic city residents aged 45+ years, quantitative analyses were conducted to determine what makes a community a good place to live and grow old. Path model analyses revealed significant relationships among self-reported quality of life and the beliefs that the City and the neighborhood were good places to live and grow old. Features of the built environment and perceived help from neighbors were significantly correlated to separate factors in the models, but not significant contributors to the models. Findings support conceptualizing age-friendly community models and community initiatives using a neighborhood-level lens and engaging older residents to capture the context of their lives and lived experiences.
Keywords
Introduction
Today, older adults are living longer and experiencing fewer years with disabilities than their parents and grandparents (Crimmins et al., 2016). This shift has led to larger and healthier senior populations with increasing numbers of residents remaining in their homes into old age. The ability to “age-in-place” or remain “in one’s own home and community safely, independently, and comfortably, regardless of age, income, or ability level” (Centers for Disease Control and Prevention, 2009) is the intention of nearly 90% of U.S. adults aged 65+ years (American Association of Retired Persons [AARP], 2017). That desire is meaningful because it is within those places that people have established roots and a sense of place, engage in daily activities, socialize with family and friends, and create memories (Rowles & Watkins, 2003).
From a community planning perspective, aging-in-place can be problematic. A community’s built environment (i.e., “that part of the environment made by people for people”; Northridge & Scalar, 2003) may need to be modified as populations age and older residents become increasingly reliant on services and support to maintain their independent lifestyles. Features in the built environment (i.e., housing, roadways, public utilities, parks and public spaces, and public transportation) need to be assessed for physical attributes (e.g., universal design features that provide accessibility) and systemic barriers (e.g., policies, procedures, and guidelines) that can potentially prevent access and use (Warner et al., 2017). For example, public transportation vehicles and their routes may not be responsive to older riders’ schedules or destinations nor provide accessible bus stops for people with diminished mobility (National Research Council, 1988).
Like residents of all ages, when older residents cannot access the built environment, it impedes and diminishes their opportunities to age-in-place even if family, friends, and local services are available to help (Warner et al., 2017).
Through strategic planning, community planners and government leaders prioritize the repair, replacement, and development of the built environment on an ongoing basis. They understand that any issues left unaddressed can negatively affect population health, economic development, and opportunities of growth (Jackson & Kochtitzky, 2001; Schulz & Northridge, 2004).
Understanding what makes a community a good place to live has been of interest for centuries. There are well-documented efforts by urban planners and public health officials during the U.S. industrialization period (mid to late 1800s) when rural residents descended into cities looking for work (Northridge & Scalar, 2003). Their experiences in addressing urban problems (e.g., sanitation, housing, education, and health care) provided a foundation for conceptualizing how community infrastructure facilitates population growth and quality of life (QoL).
By the mid-20th century, interest in creating livable (i.e., inhabitable) communities coalesced globally and led to the convening of the 1976 United Nations’ Habitat conference held in Vancouver, Canada, to address the conditions of settlements (housing, transportation, sanitation, water, and public health) in light of rapidly expanding populations (Habitat: United Nations Conference on Human Settlements, 1976). From that conference, efforts to create livable communities to improve QoL emerged worldwide.
Today, the growing interest in age-friendly communities aligns well with that of livable communities. Although both support the health, safety, and well-being of residents, age-friendly communities tend to focus on older adults and the services and supports they need to remain as independent as possible in the community (Wood et al., 2008), regardless of health, ability, and stage of life (Menec et al., 2011).
Of particular interest are features of the built environment, which a city can control. If features are not available, accessible, and affordable to residents at all times, their satisfaction with the community will drop, QoL will suffer, and the prospect for aging-in-place will be uncertain.
Yet, creating livable and age-friendly communities re-quires thoughtful discussions of how residents interact with the built environment, and for older residents, their ability to age-in-place (Ruth & Franklin, 2014). Taking multidisciplinary approaches (theoretical and practical) to unpack the meaning of a livable and age-friendly community can advance understanding of the role of city government and issues of equitable access for all residents (Buffel & Phillipson, 2018; Keyes & Benavides, 2017).
Thus, communities are increasingly interested in examining the built environment to ensure their community is age-friendly and a good place to live and grow old. The purpose of this study was to facilitate recognition of what makes a community a good place to live and grow old.
Literature Review
Age-Friendly Cities and Communities
Efforts to engage U.S. community leaders in creating age-friendly communities are credited largely to AARP’s role as the U.S. network affiliate of the World Health Organization (WHO) Global Network of Age-Friendly Cities and Communities (AFCC) Program (AARP, 2019a). The WHO launched the AFCC program in 2005 to address the needs of older adults in densely populated urban areas and implemented it through its Global Age-Friendly Cities project (WHO, 2007). At the core of the AFCC model is the Active Ageing Policy Framework (AAPF; WHO, 2002), which emphasizes interdependent domains representing the built (i.e., housing, transportation, outdoor spaces and buildings, community support, and health services) and social (i.e., communication and information, civic participation and employment, respect and social inclusion, and social participation) environments. Assessment of features within each domain enables communities to identify gaps in age-friendly programs, practices, and policies.
By 2012, AARP was promoting the AFCC program within the United States to connect cities, communities and organizations worldwide with the common vision of making their community a great place where people can grow old (AARP, 2019b). Their promotion complemented their livability program, which addresses environmental, social, and economic issues that affect health, well-being, and QoL in old age (AARP, 2019a).
Livability and the Built Environment
There has been limited research on how the livability/AAPF domains intersect. Public health research has consistently pointed to the influence of location, condition of the built environment, and economic development on resident health, well-being, and ability to make social connections (Kweon et al., 1998; Spring, 2018). Consequently, underserved areas within a community are often the recipients of coordinated service and program efforts that address health care, nutrition, physical activity, and job training.
Urban planning research has typically explored the importance of available, accessible, and affordable transportation (Kim et al., 2020), housing (Gitlin, 2003), and community safety and security (Levasseur et al., 2015, 2017). Research has also revealed that the quality of the built environment directly affects residents’ QoL, life satisfaction, and health (Cerin, 2019; Chaudhury & Oswald, 2019; Frank et al., 2010; Frumkin, 2003; Kim et al., 2020; Stephens et al., 2018). Features such as walkability, sidewalks, mixed-use properties, and public spaces contribute to better health and physical activity in residents and enhance opportunities for developing and maintaining social ties (Brown et al., 2009; Frank et al., 2010; Kweon et al., 1998; Spring, 2018).
In addition, residents with access to green spaces and common spaces engage in more neighboring activities and possess a stronger sense of community and neighborhood satisfaction than residents with less access hold (Choi et al., 2020; Kweon et al., 1998). Moreover, increased opportunities for face-to-face interactions (Wood et al., 2010) and neighboring activities help build sense of community (e.g., shared feelings of belonging, support, and unity) and strengthen emotional connections with neighbors and the neighborhood (Kweon et al., 1998).
Neighbors and Neighborhoods
Neighbors are an invaluable component of neighborhood life (Wenger, 1990). They are resources who fill gaps in support and assistance when family members and friends are unavailable. Unlike friends and family, neighbors are potentially available to help at a moment’s notice when timing is crucial (e.g., lend helping hand to move a heavy object or provide a missing ingredient when baking) or critical (e.g., assist in emergency medical care). Once family members or friends arrive to help, neighbors back away from the situation. The relationship between neighbors is short term and not based on any obligation to help or shared interests. It exists because of collective efficacy and the shared beliefs and expectations that neighbors help neighbors in times of need (Sampson et al., 1997; Wenger, 1990).
Although the neighborhood is not specified in the AARP AFCC model, it is recognized as a potential point of focus for addressing age-friendliness. Neighborhoods are the cornerstones of community life and their features (e.g., services, transportation, public spaces) influence residents’ identities (Coulton et al., 2013), QoL, health, and social networks (Guest et al., 2006; Levasseur et al., 2017). The American Planning Association concurs and defines well-designed neighborhoods as functional, sustainable, and safe built environments, which facilitate social connectedness among residents (Talen et al., 2015).
Yet, defining neighborhoods becomes challenging when government entities and residents conceptualize them in different ways (Chaskin, 1998; Coulton et al., 2013). Institutional definitions (e.g., census blocks, building subdivisions) are objective, whereas residents’ subjective definition of their neighborhoods is based on their interactions with people and places and the boundaries shift as their social interactions change (Chaskin, 1998; Coulton et al., 2013). Thus, relying on either definition has limitations. However, the resident definition is better at capturing the lifestyles and needs of residents (Spring, 2018).
Becoming Age-Friendly
Information about the process communities undertake to become age-friendly remains limited. (Greenfield et al., 2015) and measuring their achievements in establishing an age-friendly community is not straightforward (Alley et al., 2007). Cities may seek an age-friendly designation by first reviewing Milken Institute’s Best Cities for Successful Aging List (Kubendran et al., 2017) and AARP’s Livability Index (AARP, 2018) to gauge their progress or ranking; however, that step does not guarantee new polices will be implemented (Keyes & Benavides, 2017). Still, both tools utilize indicators from local secondary data to score communities on features such as the built environment, social program and service use, health care utilization, crime rates, and employment opportunities. However, the aggregated scores do not necessarily paint an accurate picture of community life and priorities, as they do not reflect planned changes and efforts already underway. Moreover, assessment scores do not include residents’ perspectives and experiences, which provide context for the indicator scores.
To bridge the assessment gap, some communities survey both city administrators and residents on the community’s age-friendliness. This is also problematic as city leaders and managers tend to overestimate a cities’ age-friendliness when compared with residents’ subjective ratings (Menec et al., 2016). While such differences may be informational and useful in planning, it is a reminder that city officials and residents view their city through different lenses. Thus, results need to be evaluated based on respondents’ qualifications to assess (Choi et al., 2020; Grogan-Kaylor et al., 2006; Menec et al., 2016).
Purpose and Hypotheses
The purpose of this study was to increase understanding of what features in the built and social environment city leaders might focus on to help the city be a good place to live and grow old. A conceptual model was developed (Figure 1) incorporating relationships between features known to contribute to the development of livable or age-friendly communities: built environment (e.g., sidewalks, parks, outdoor spaces), resident characteristics (e.g., age, income, health, QoL), and neighbor relations (e.g., neighbor interactions, perception that neighbor is willing to help). As shown in Model 1, we identified three factors that we hypothesized to influence ratings of the City as a good place to live and grow old: built environment (H1), neighbor relations (H2), and resident characteristics (H3).
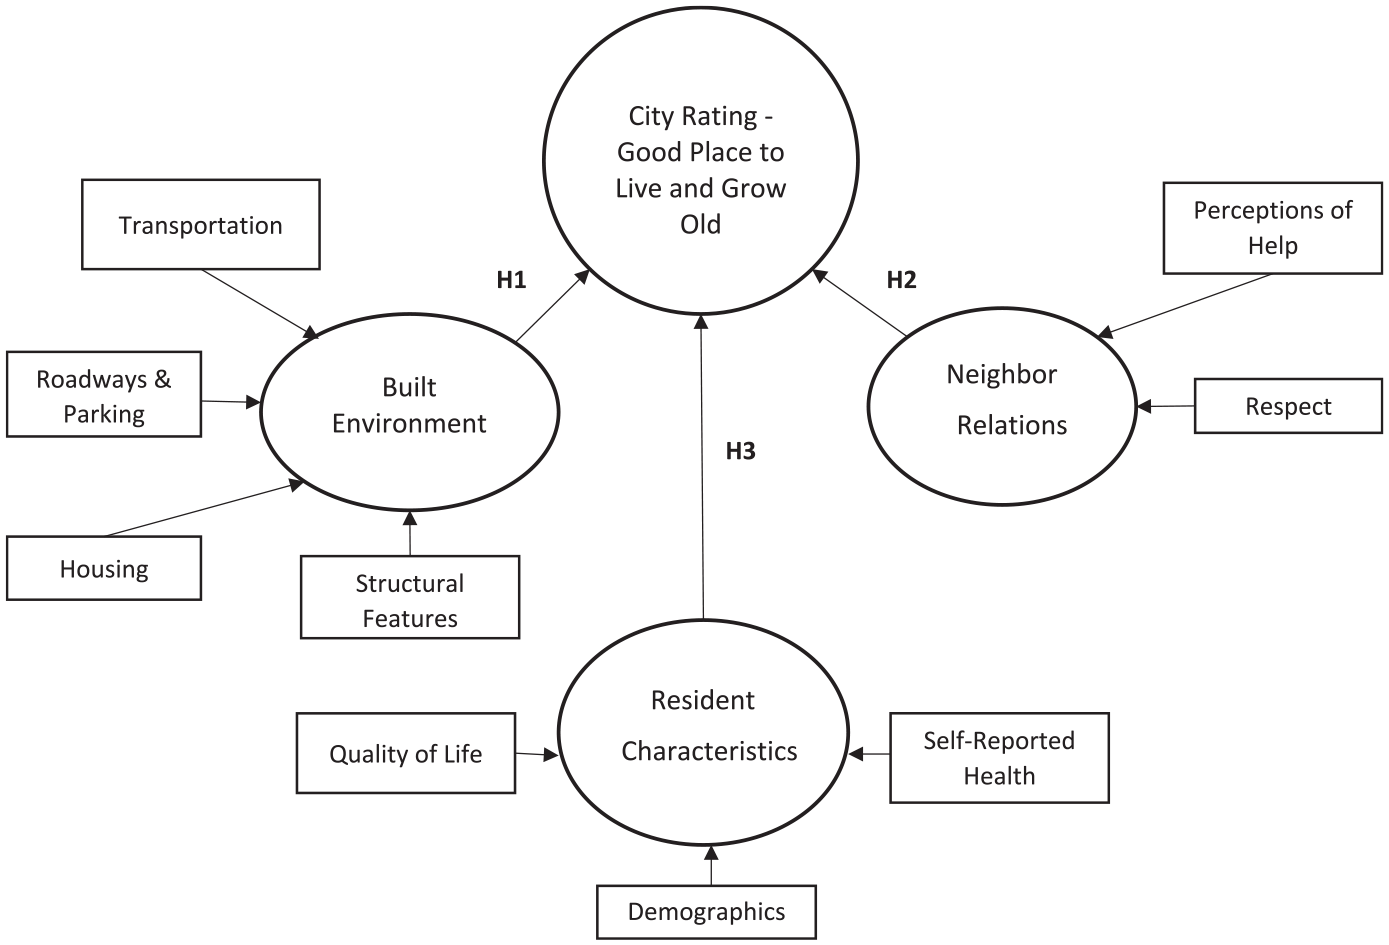
Hypothesized model.
Method
Data and Sample
Secondary survey data from a mid-Atlantic AARP AFCC member city (City) were analyzed for this study. The survey was designed to gauge if residents perceived the City as a good place to live and grow old and to identify features of the community that were important to the City’s livability.
The survey included 53 multiple-choice items selected from the AARP national livability survey mostly on the accessibility, availability, importance, and condition of the City’s built environment (see Online Appendix). An additional 23 multiple-choice questions focused on respondents’ social connections with their neighbors, self-rated health and well-being, QoL, and demographics. The variable, How would you rate the City as a good place to live and grow old? was the dependent variable. Similarly, respondents were asked, How would you rate your neighborhood as a good place to live and grow old? because the City recognized the role of neighborhoods in promoting livability.
Residents aged 45+ years were recruited across the City’s 49 City-designated neighborhoods (hereafter referred to as Neighborhood) using convenience-sampling strategies (e.g., neighborhood activities, word of mouth, television news, websites, Next Door app, and email listserv). Because AARP’s interest in older adults extends to upcoming generations, residents aged 45+ years were recruited to participate.
The final sample included 623 respondents (376 online and 247 paper surveys). Compared with the 2010 U.S. Census estimates, respondents mirrored City residents aged 45+ years by age (M = 63 years), age groups 65+ (56% aged 65–74 years and 26% aged 75–84 years), race (27% Black, aged 65–84 years), and annual household income (59% earning over US$30,000). Responses for ethnicity were not available for analysis. Each respondent identified their Neighborhood from a predefined list of 49 City-designated Neighborhoods resulting in representation from 45 City-designated Neighborhoods.
Missing data were handled using listwise deletion, resulting in 448 complete case surveys used in analyses. The 448 respondents represented were aged 45 to 64 (57%), 65 to 74 (25%), 75 to 83 (13%), and 85+ (4%) years. Among respondents aged 45 to 64 years, 82% identified as White and 18% Black, which increased to 25% Black in the 65+ age group. Sixty percent of all respondents had annual incomes above US$30,000.
Most respondents were female (64%). More than half (63%) called the City home for more than 5 years and among them 37% had lived there for 15+ years. Most respondents (84%) reported being in excellent, very good, or good health, and 88% of all respondents rated their quality of their life as either excellent, very good, or good. Statistical analyses indicated that there were no significant differences in responses based on the data collection method (online vs. paper survey) nor by Neighborhood, due to small Neighborhood samples.
Measures
Outcome variables
City (and Neighborhood) as a good place to live and grow old
Using a 5-point Likert-type scale ranging from 1 (Excellent) to 5 (Poor), respondents were asked to rate their City (and Neighborhood) as a good place to live and grow old.
Independent variables
Neighbor relations
Perceptions of respondents’ relationship with their neighbors were measured using three items on a 5-point Likert-type scale ranging from 1 (Strongly Agree) to 5 (Strongly Disagree). Items assessed if respondents felt respected by their neighbors, would be willing to help their neighbors if they needed it, and if they perceived that their neighbors would help them if they needed it. A test of reliability of the combined items revealed a Cronbach’s alpha of .83.
QoL
Respondents rated their QoL with a single item using a 5-point Likert-type scale response set ranging from 1 (Excellent) to 5 (Poor).
Built environment
Respondents were asked to rate the importance of having specific structures, features, and attributes in the community using a 5-point Likert-type scale ranging from 1 (Extremely Important) to 5 (Not at All Important). The 24 items represented features (e.g., availability, affordability, reliability, accessibility) under the categories of housing, transportation, structural features, and roadways and parking.
Analyses
All analyses were conducted using the statistical analysis program Stata 15.1 (StataCorp 2015). The study variables were assessed for and the data were found to be multivariate nonnormal. This violation of normality was addressed during path analyses using adjustments to the test statistics. The hypothesized models tested the effects of the importance of various built environment features and social perceptions on ratings of the City and Neighborhood as places to live and grow old. A third model included only the significant connections found in the first two models to assess effects on ratings of the City and the Neighborhood simultaneously.
Results
Descriptive Analysis
A factor analysis of the built environment items resulted in four categories represented by nine significant items used in this study (see Table 1 and 2 for descriptive statistics, correlations, and reliability scores). Variables identified as structural features included parks (“well-maintained and safe parks within walking distance of your home”), sidewalks (“in good condition, free from obstruction, and are safe for pedestrian use and accessible for wheelchairs or other assistive devices”), and public benches (“public spaces with enough benches”). Public transportation variables only included the attributes of affordable and reliable public transportation and well-maintained public transportation vehicle. Features of roadways and parking were represented by the variables of well-maintained streets, affordable public parking, and public parking (“lots, spaces, and areas to park”). Housing feature variables had nonsignificant correlations with other variables and, thus, not retained in analysis.
Study Variable Descriptives.

Correlations Between Study Variables.

Note. Reliabilities of composite variables can be found on the diagonal. Correlations of p < .05 are indicated by bold font.
As shown in Table 2, significant correlations (p < .05) emerged among the ratings of the City and Neighborhood as good places to live and grow old, QoL, and neighbor relations. In addition, there were significant correlations between structural features and the transportation, roadways and parking, neighbor relations, and the rating of the City as a good place to live and grow old. Thus, all of those factors were retained for the path model analysis. Only respondent characteristics for age, income, and self-reported health significantly correlated with those factors so were retained and controlled for in analysis.
Path Models
Model fit statistics were estimated using Stata 15.1 and using maximum likelihood estimation with robust standard errors as well as Satorra–Bentler scaled test statistics to account for the multivariate nonnormality of the data (Finney & DiStefano, 2006; Satorra & Bentler, 1999). Due to the significant relationships identified between respondent ratings of the City and Neighborhood, neighbor relations, and the mediating role of perceived QoL, separate path models were tested to identify any differences that might exist between ratings of the City and Neighborhood.
Model 1: City
Model 1 (Figure 2) demonstrated good levels of overall model fit, χ2(93) = 245.90, p < .01, root mean square error of approximation (RMSEA) = .05, comparative fit index (CFI) = .95, Tucker–Lewis Index (TLI) = .93, and standardized root mean square residual (SRMR) = .06. Although the chi-square test produced a significant p value, this is not uncommon in large samples. Consistent with recommendations for the remaining fit statistics (Hu & Bentler, 1999), RMSEA met the .05 threshold, both the CFI and TLI were above .90, and the SRMR was just above the threshold of .05.
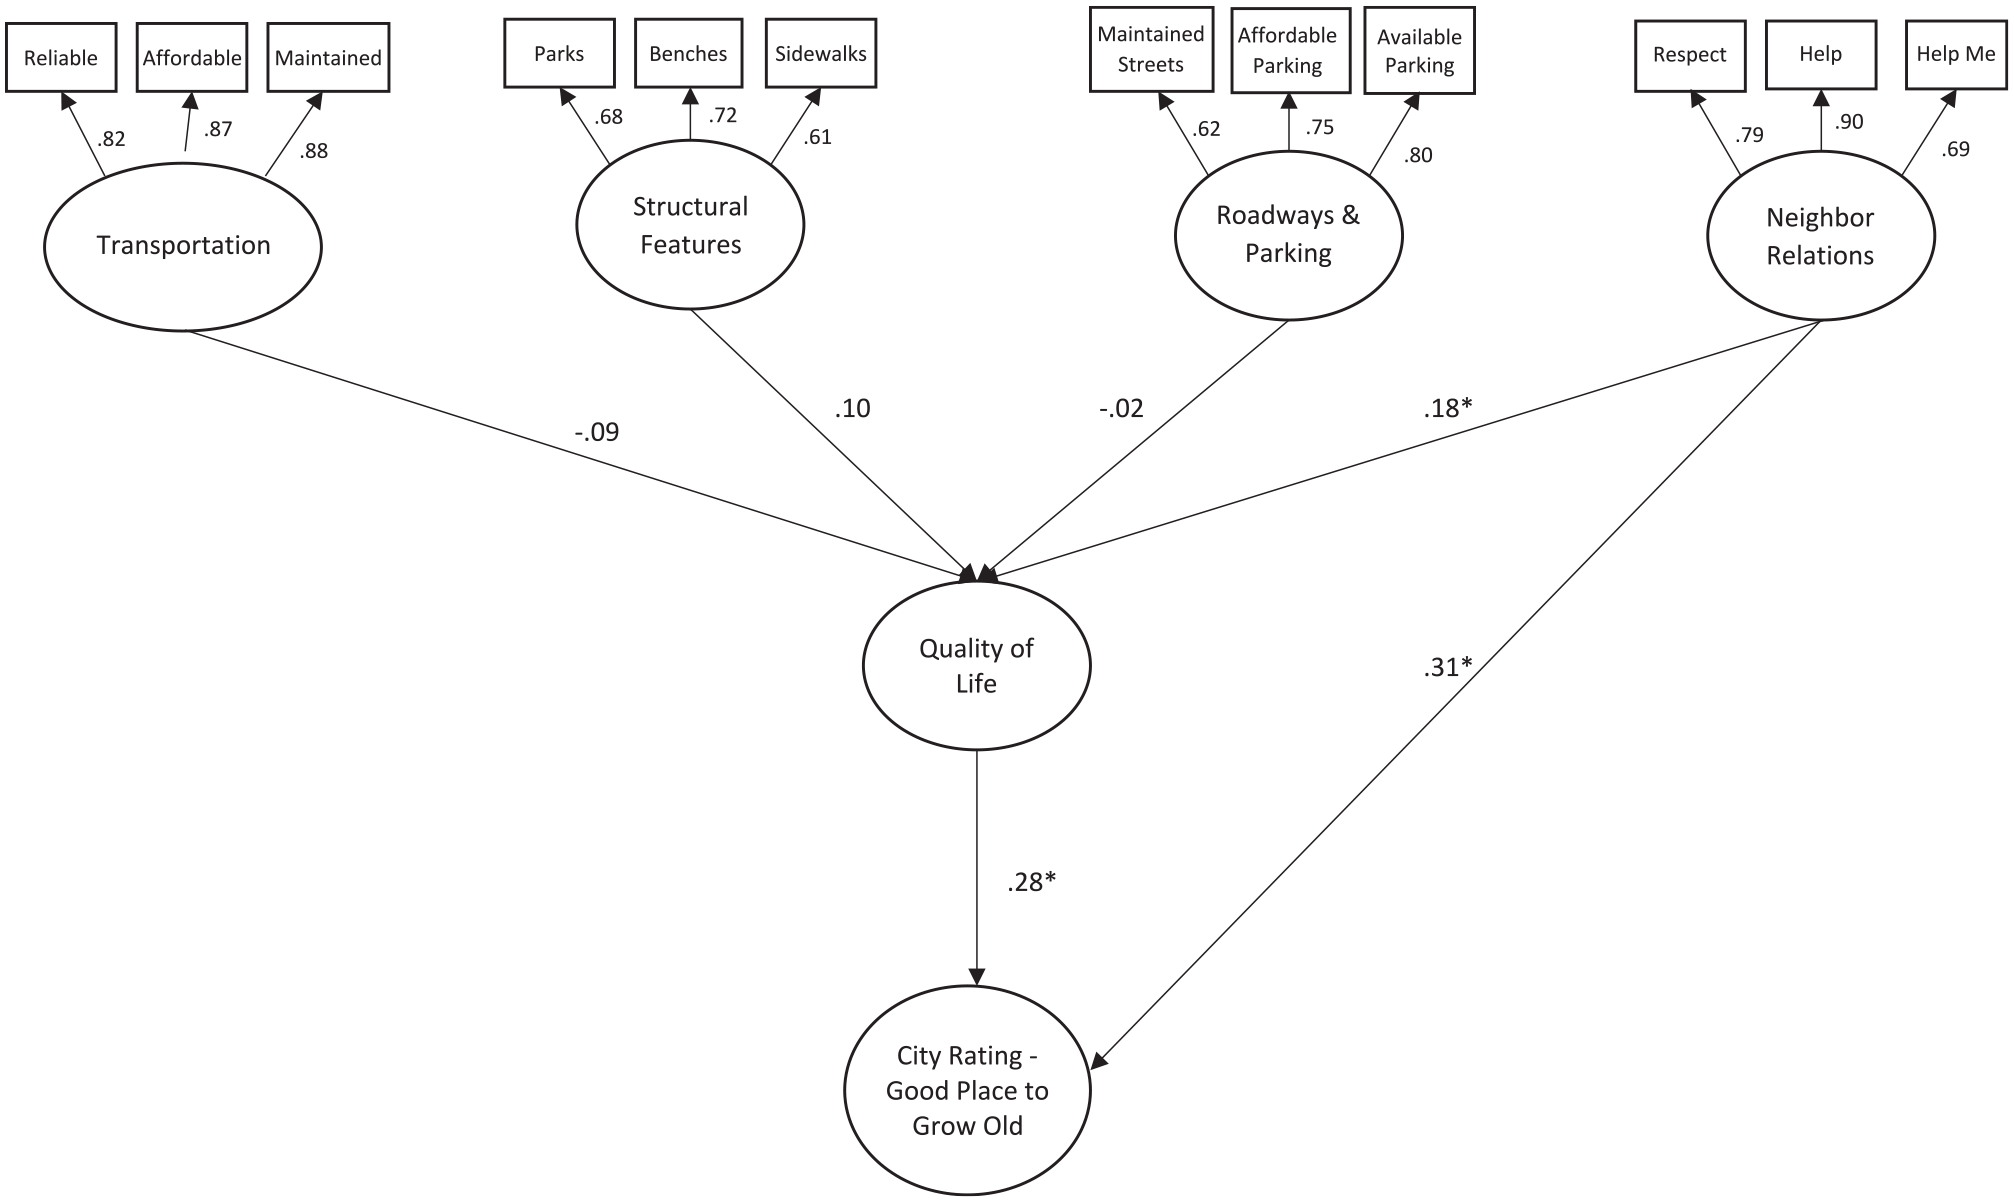
Model 1.
Model 1 showed a significant, direct positive effect of neighbor relations on perceived QoL (β = .18, p < .01). Moreover, QoL ratings had a significant positive effect on ratings of the City as a good place to live and grow old (β = .28, p < .01). However, none of the built environment features had significant direct effects on QoL ratings.
Model 1 also showed a significant direct positive relationship between neighbor relations and respondents’ ratings of the City as a good place to live and grow old (β = .31, p < .01), indicating that positive perceptions of neighbor relations are related to positive ratings of the City as a good place to live and grow old.
Model results also showed a significant indirect effect of neighbor relations (β = .05, p < .01) on ratings of the City as a good place to live and grow old, with QoL partially mediating the relationship between them. Coefficient estimates for the model can be found in Table 3.
Path Coefficients for Model 1.
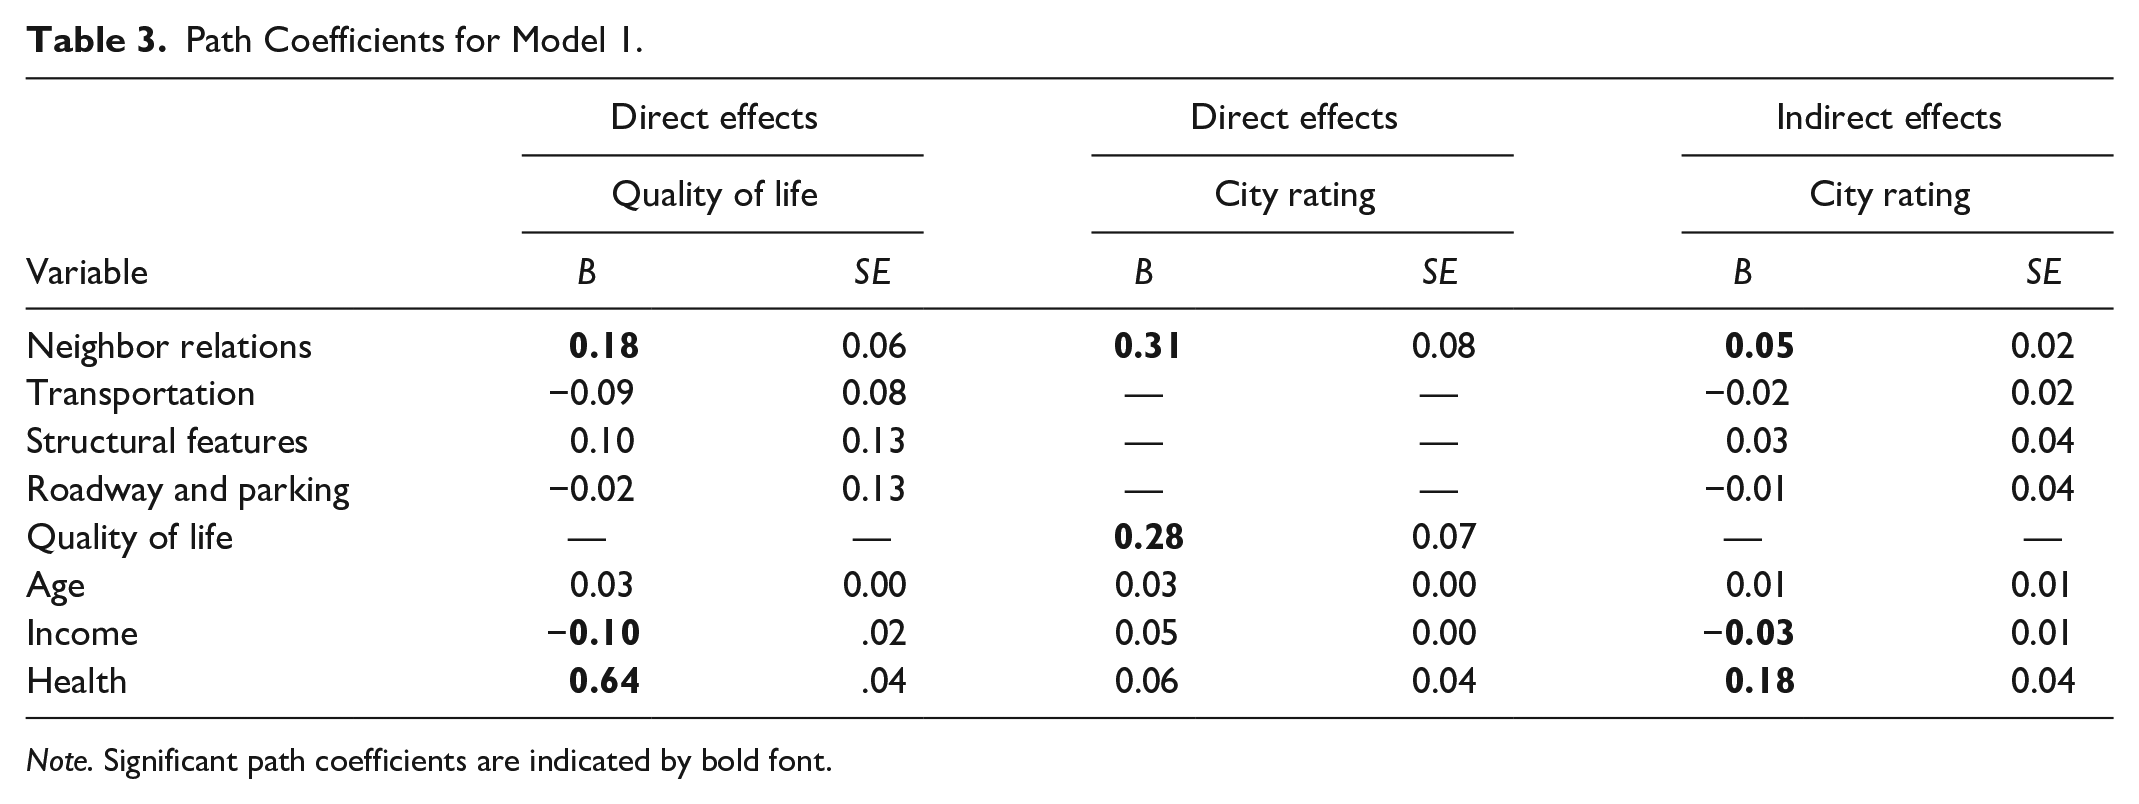
Note. Significant path coefficients are indicated by bold font.
Model 2: Neighborhood
Model 2 (Figure 3) also demonstrated good levels of overall model fit, χ2(93) = 229.66, p < .01, RMSEA = .05, CFI = .96, TLI = .94, and SRMR = .05. Similar to Model 1, Model 2 showed a significant positive direct effect of neighbor relations on QoL (β = .18, p < .05), which had a significant positive effect on ratings of the Neighborhood as a good place to live and grow old (β = 24, p < .01).

Model 2.
Model 2 also showed a significant direct relationship between neighbor relations and the Neighborhood as a good place to live and grow old (β = .43, p < .05). Indirect effects for the model were assessed by examining the mediated effects of QoL on neighbor relations and ratings of the Neighborhood as a good place to live and grow old. Results indicated a significant indirect effect of neighbor relations on ratings of the Neighborhood (β = .04, p < .05). Coupled with the significant direct effect, these results indicate that QoL partially mediates the relationship between neighbor relations and ratings of the Neighborhood as a good place to live and grow old. Significant indirect effects on the ratings of the Neighborhood as a good place to live and grow old were not observed for the built environment variables. Coefficient estimates for the model can be found in Table 4.
Path Coefficients for Model 2.

Note. Significant path coefficients are indicated by bold font.
Model 3
Based on the significant relationships in Models 1 and 2 that showed QoL ratings and neighbor relations were important factors in influencing respondents’ ratings of the City and the Neighborhood as good places to live and grow old, an additional path model was created to test the simultaneous effects of each factor. As seen in Model 3 (Figure 4), both neighbor relations (β = .61, p < .01) and QoL ratings (β = .32, p < .01) had significant direct effects on ratings of the neighborhood as a place to grow old. Neighbor relations also had a significant (although smaller) direct effect on ratings of the city as a place to grow old (β = .39, p < .01) as did QoL ratings (β = .33, p < .01). Results from the path analyses can be found in Table 5.
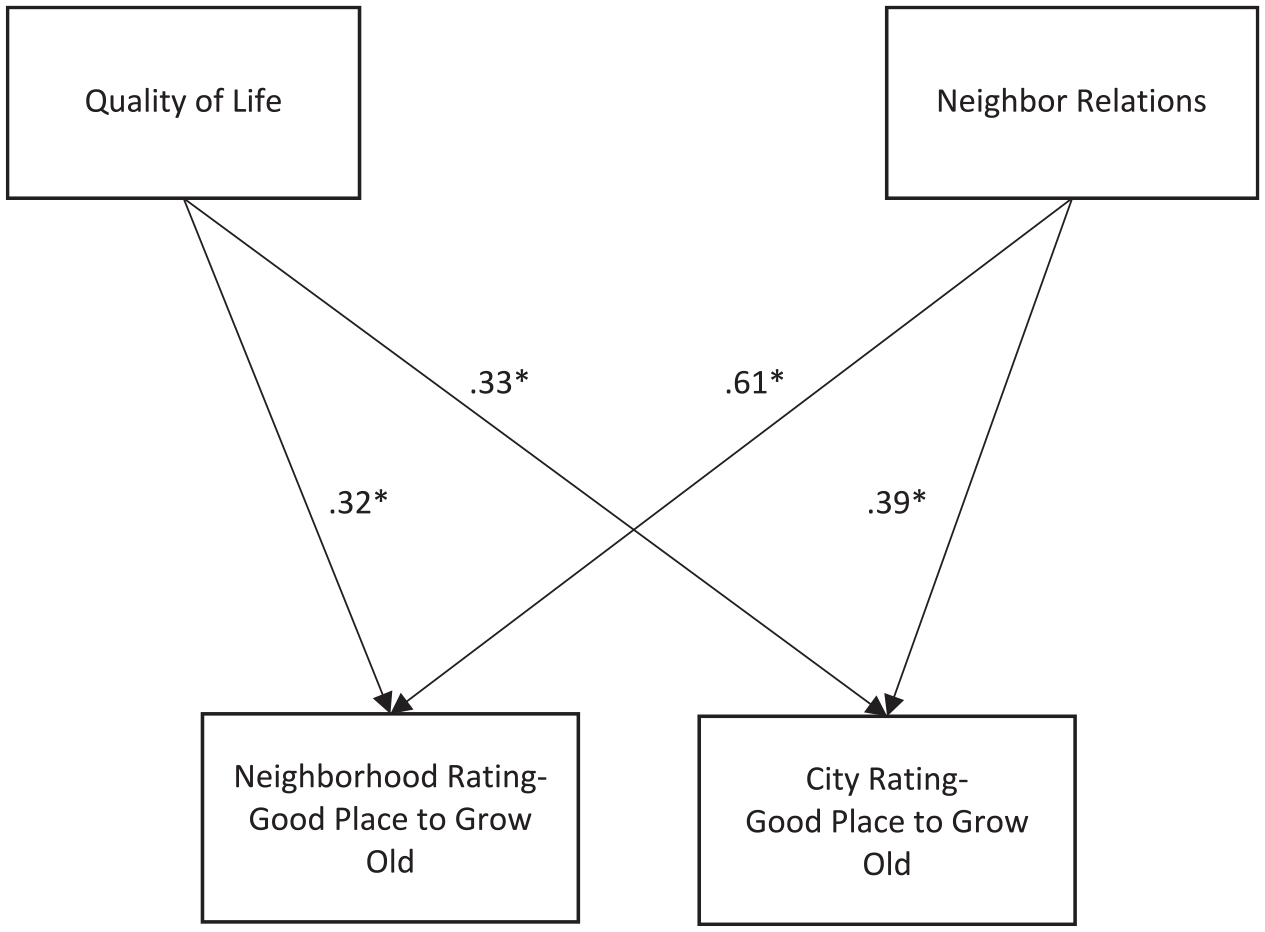
Model 3.
Path Coefficients for Model 3.
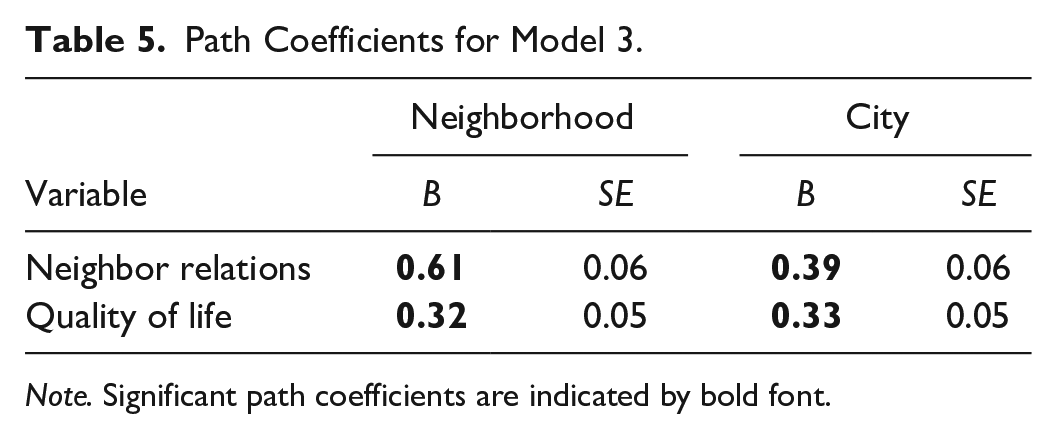
Note. Significant path coefficients are indicated by bold font.
Respondent Characteristics
Respondent characteristics (i.e., age, income, and self-reported health) were included as control variables in Models 1 and 2. Age did not have any significant effects on QoL nor ratings of the City or Neighborhood in either model. However, income exhibited a negative direct effect on QoL ratings in both models (β = −.10, p < .01 [Model 1] and β = −.09, p < .01 [Model 2]). Due to the coding of income and QoL ratings, the results suggest that as income increases, QoL ratings become more positive. Respondents’ self-reported health also had a significant direct effect on
QoL ratings (β = .64, p < .01 [Model 1] and β = .64, p < .01 [Model 2]), meaning that respondents in better health held positive perceptions of their QoL. Both income and health had significant indirect, but not direct, effects on ratings of the City and the Neighborhood as good places to live and grow old, indicating QoL mediates their effects on City and Neighborhood ratings. Coefficient estimates for the demographic variables can be found in Tables 3 and 4.
Summary and Discussion
Our assumptions about what makes the City a good place to live and grow old were partially confirmed:
Perhaps the subjective built environment measures chosen were not influential characteristics or salient in respect to the City/Neighborhood being a good place to live and grow old. Or, if respondents were familiar with features, they may have perceived less importance in terms of the City/Neighborhood being a good place to live and grow old. However, it is noteworthy that significant correlations between the structural features (i.e., parks, benches, and sidewalks) and the other factors included in the model suggest that the variables within the construct may potentially contribute to making the City a good place to live and grow old.
Although this study did not delve into what QoL meant to respondents, it had a powerful influence on the path models. The built environment features included in analysis, yet found to be nonsignificant contributors to the models, likely inform QoL. Future studies could explore this further by building on the work of Frank and colleagues (2010) to demonstrate how outdoor features (e.g., parks and open spaces, public buildings, benches, sidewalks, recreational areas) facilitate opportunities to strengthen social connections, build relationships with neighbors, and reinforce a sense of place that makes a community a good place to live and grow old.
Perceived QoL played a significant role in mediating factors in each path model. This is consistent with the positive relationship between QoL and housing (Costa-Font, 2013; Stephens et al., 2018). Because QoL was only represented by a single item, further research is warranted to determine which aspects of the construct (e.g., physical and psychological health, level of independence, social connectedness, natural and built environment, and personal beliefs) are significant contributors.
Thus, the path models for this study suggest that if a resident believes the Neighborhood is a good place to live and grow old, then they are apt to believe the City is a good place to live and grow old. Utilizing a neighborhood lens in assessing age-friendliness and affecting change can provide insights into how residents interface with their community. As Chaskin (1998) noted, neighborhoods are not only geographic locations but also places where people live, build social connections, and enter into relationships (real or perceived), activities that enhance attachment to the community.
For city administrators, planners, and AFCC teams, this finding provides empirical support for using the neighborhood as a cornerstone in planning for and assessing age-friendliness. For scholars, it can direct future research on AFCCs and support age-friendly community theory development.
Limitations
There were four main limitations to this study. First, the sample was not random. Even though the sample mirrored the City population aged 45+ years, the sample did not equally represent all neighborhoods and was not generalizable.
Second, the sample included generally healthy and active residents living independently in the City. Their responses may suggest different needs and experiences than less healthy and able-bodied peers. Similarly, immigrant groups (approximately 7.5% of the adult population in 2010) were not well represented in the sample, and their perceptions may differ from residents in the majority in their neighborhoods. Future studies should be mindful of including underrepresented elders.
Third, the scope and validity of the items used to measure the City’s age-friendliness was limited. The battery of items included many facets of U.S. city life (i.e., housing, transportation, structural features, roadways and parking). However, it may be that other important features or factors the City could influence were overlooked (e.g., utility costs, access to fresh foods and markets, employment opportunities, variety of available housing options) and should be considered for future studies. Similarly, ratings of each feature’s importance may have a different level of significant influence and predictive abilities than reports of rates of use or history of use.
Fourth, despite knowing which Neighborhood respondents lived, how they envisioned their neighborhood boundaries when responding to the survey was unknown. Future assessments might include questions about neighborhood conceptualization to understand better respondents’ identification of built environment features and assignment of importance on age-friendliness.
Conclusion
The results of this study support an alternate way of conceptualizing age-friendly communities and age-friendly initiatives, specifically focusing on neighborhood context and perceived QoL as meaningful influences in the daily lives of residents. This approach may provide more insights into a community’s age-friendliness than typical strategies focused on developing affordable and accessible housing and transportation options (Keyes & Benavides, 2019).
Taking this approach does not preclude the involvement of local government and community stakeholders. Rather, it encourages broad interdisciplinary participation to understand better the social, structural, and cultural influences on a neighborhood and the larger community.
Ramaswami and colleagues’ (2016) ecological framework for effective community transformation is ideally suited for this approach. They posit community life as interactions across overlapping sectors (i.e., neighborhood, city, and region), which share and generate infrastructure, resources, and policies. Affecting community-level change begins by taking a multisectorial approach using interdisciplinary teams of residents and stakeholders representing key systems in each sector (e.g., education, health, industry). Participants become partners and collaborators who raise awareness of issues that hamper or promote age-friendliness (Firestone et al., 2018), address unmet needs, and bolster existing community initiatives designed to build a healthy, equitable, and sustainable community (Greenfield et al., 2015; Keyes & Benavides, 2019; Lehning et al., 2012).
By engaging residents in the process, the team can learn about the challenges residents face, which then provides context to their lives and neighborhood (Buffel & Phillipson, 2018; Firestone et al., 2018; Keyes & Benavides, 2019; Levasseur et al., 2017) and introduces cultural influences (Konig et al., 2019) on their QoL. The voices of all seniors, especially the overlooked and disenfranchised (e.g., socially isolated, ethnic and racial minorities, LGBTQ+, homeless, and physically or mentally challenged) need to be heard. If diverse voices are not sought, then age-friendliness will not be achievable nor will the ability for residents to age-in-place.
Supplemental Material
Appendix_1_FINAL – Supplemental material for What Makes a City a Good Place to Live and Grow Old?
Supplemental material, Appendix_1_FINAL for What Makes a City a Good Place to Live and Grow Old? by Nancy Brossoie and Derek Burns in Journal of Applied Gerontology
Footnotes
Declaration of Conflicting Interests
The author(s) declared no potential conflicts of interest with respect to the research, authorship, and/or publication of this article.
Funding
The author(s) received no financial support for the research, authorship, and/or publication of this article.
IRB Approval
Virginia Tech IRB # 19-120 approved this study.

Supplemental Material
Supplemental material for this article is available online.
References
Supplementary Material
Please find the following supplemental material available below.
For Open Access articles published under a Creative Commons License, all supplemental material carries the same license as the article it is associated with.
For non-Open Access articles published, all supplemental material carries a non-exclusive license, and permission requests for re-use of supplemental material or any part of supplemental material shall be sent directly to the copyright owner as specified in the copyright notice associated with the article.
