



Abstract
This study maps and discusses the status of the age-friendly community movement in a United States (U.S.) residential-geographic context using the AARP Livability Index and Hamilton County, Ohio, as a case study. The framework for the construction of this index shares multiple commonalities with the World Health Organization’s widely adopted Age-Friendly Cities and Communities framework. Via visual inspection of maps and spatial analytics, this study compares geographic locations and spatial patterns of census tracts in terms of their residence desirability for older adults based on the Livability Index and actual residence locations of adults aged 65+ in Hamilton County. The comparison reveals that the actual residence locations of older adults differ from those that are most desirable. Given this difference between actual location choices and ideal or age-friendly residential environments, the age-friendly movement needs to discuss the gap between its framework, exemplified here by the AARP Livability Index, and reality to promote and implement its policies more effectively, especially in the U.S.
Keywords
Background and Objectives
Population aging is a global phenomenon; in the United States (U.S.), the majority of older adults would prefer to age in place (Binette & Vasold, 2018). Simply put, aging in place is a term that describes people living in their homes and neighborhoods as long as they want (Wiles et al., 2012), receiving necessary support and services as they age. Researchers from various disciplines, including environmental gerontology and human geography, have studied how people can live as satisfactorily as possible in their own places as they age and how our built and social environments can help achieve this condition (Alley et al., 2008; Wahl & Oswald, 2016). In this regard, an “age-friendly” environment can be defined as a place or space in which older adults experience a positive, that is, healthy and active, aging experience (World Health Organization, 2007).
There are many different factors to consider in determining whether a residential environment (built/physical and social) is age-friendly and thus supports aging in place. Individual aging processes are idiosyncratic, and therefore individual aging experiences and necessary support systems tend to be extremely diverse (Chaudhury & Oswald, 2019). One could argue that places where older adults choose to live may not necessarily reflect the age-friendliness of the communities or question the assumption used in this study (i.e., that a neighborhood with a higher proportion of older adults is necessarily more age friendly). Furthermore, revealed location choices do not reflect the qualitative nature of residence decisions as voluntary or involuntary (e.g., whether residents are willfully aging in place or are unwillingly stuck in place) (Perry et al., 2014) or temporal aspects of such behavior (e.g., whether residents have stayed put for a longer period or are newly moved in) (Golant, 2003), which are crucial distinctions that should be assessed in evaluations of the age-friendliness of residential environments. Simply, where people live in later life is not only a matter of preference and choice.
Support for aging in place is advocated by an emerging international movement, the age-friendly environment policy movement, represented by the widely adopted World Health Organization (WHO) Global Age-Friendly Cities framework (World Health Organization, 2007). Despite some minor differences, the WHO framework shares many commonalities in its inductive constructs with other frameworks, such as the AARP Livable Communities program and its assessment tool, the Livability Index (AARP Public Policy Institute., 2018a), and the American Planning Association’s Aging in Community framework (American Planning Association, 2014a) (see Figure 1). (Another AARP program, the AARP Network of Age-Friendly States and Communities, established in 2012, is the U.S. affiliate of the WHO Global Network for Age-Friendly Cities and Communities.) These frameworks assume that physical and social residential environments (Wahl & Lang, 2003) are crucial to achieving the goals of the aging in place movement and commonly promote higher density (i.e., urban) residential environments as more desirable for aging in place or in community (AARP Public Policy Institute., 2018b; American Planning Association, 2014a; World Health Organization, 2007). However, as individual aging processes, experiences, and support systems differ, appropriate residential environments can be very diverse (Golant, 2015), and where the older adult population actually lives, especially in the U.S., might reveal different aspects about their preferences (Litwak & Longino, 1987) for aging in place (e.g., in less dense, suburban or rural areas) and pose practical challenges to promoting and implementing the movement’s policies in the country. Notable age-friendly environment policy frameworks and their focus areas. Note. The figure was created by the author and based on previous references (AARP Public Policy Institute, 2018a; American Planning Association, 2014a; World Health Organization, 2007).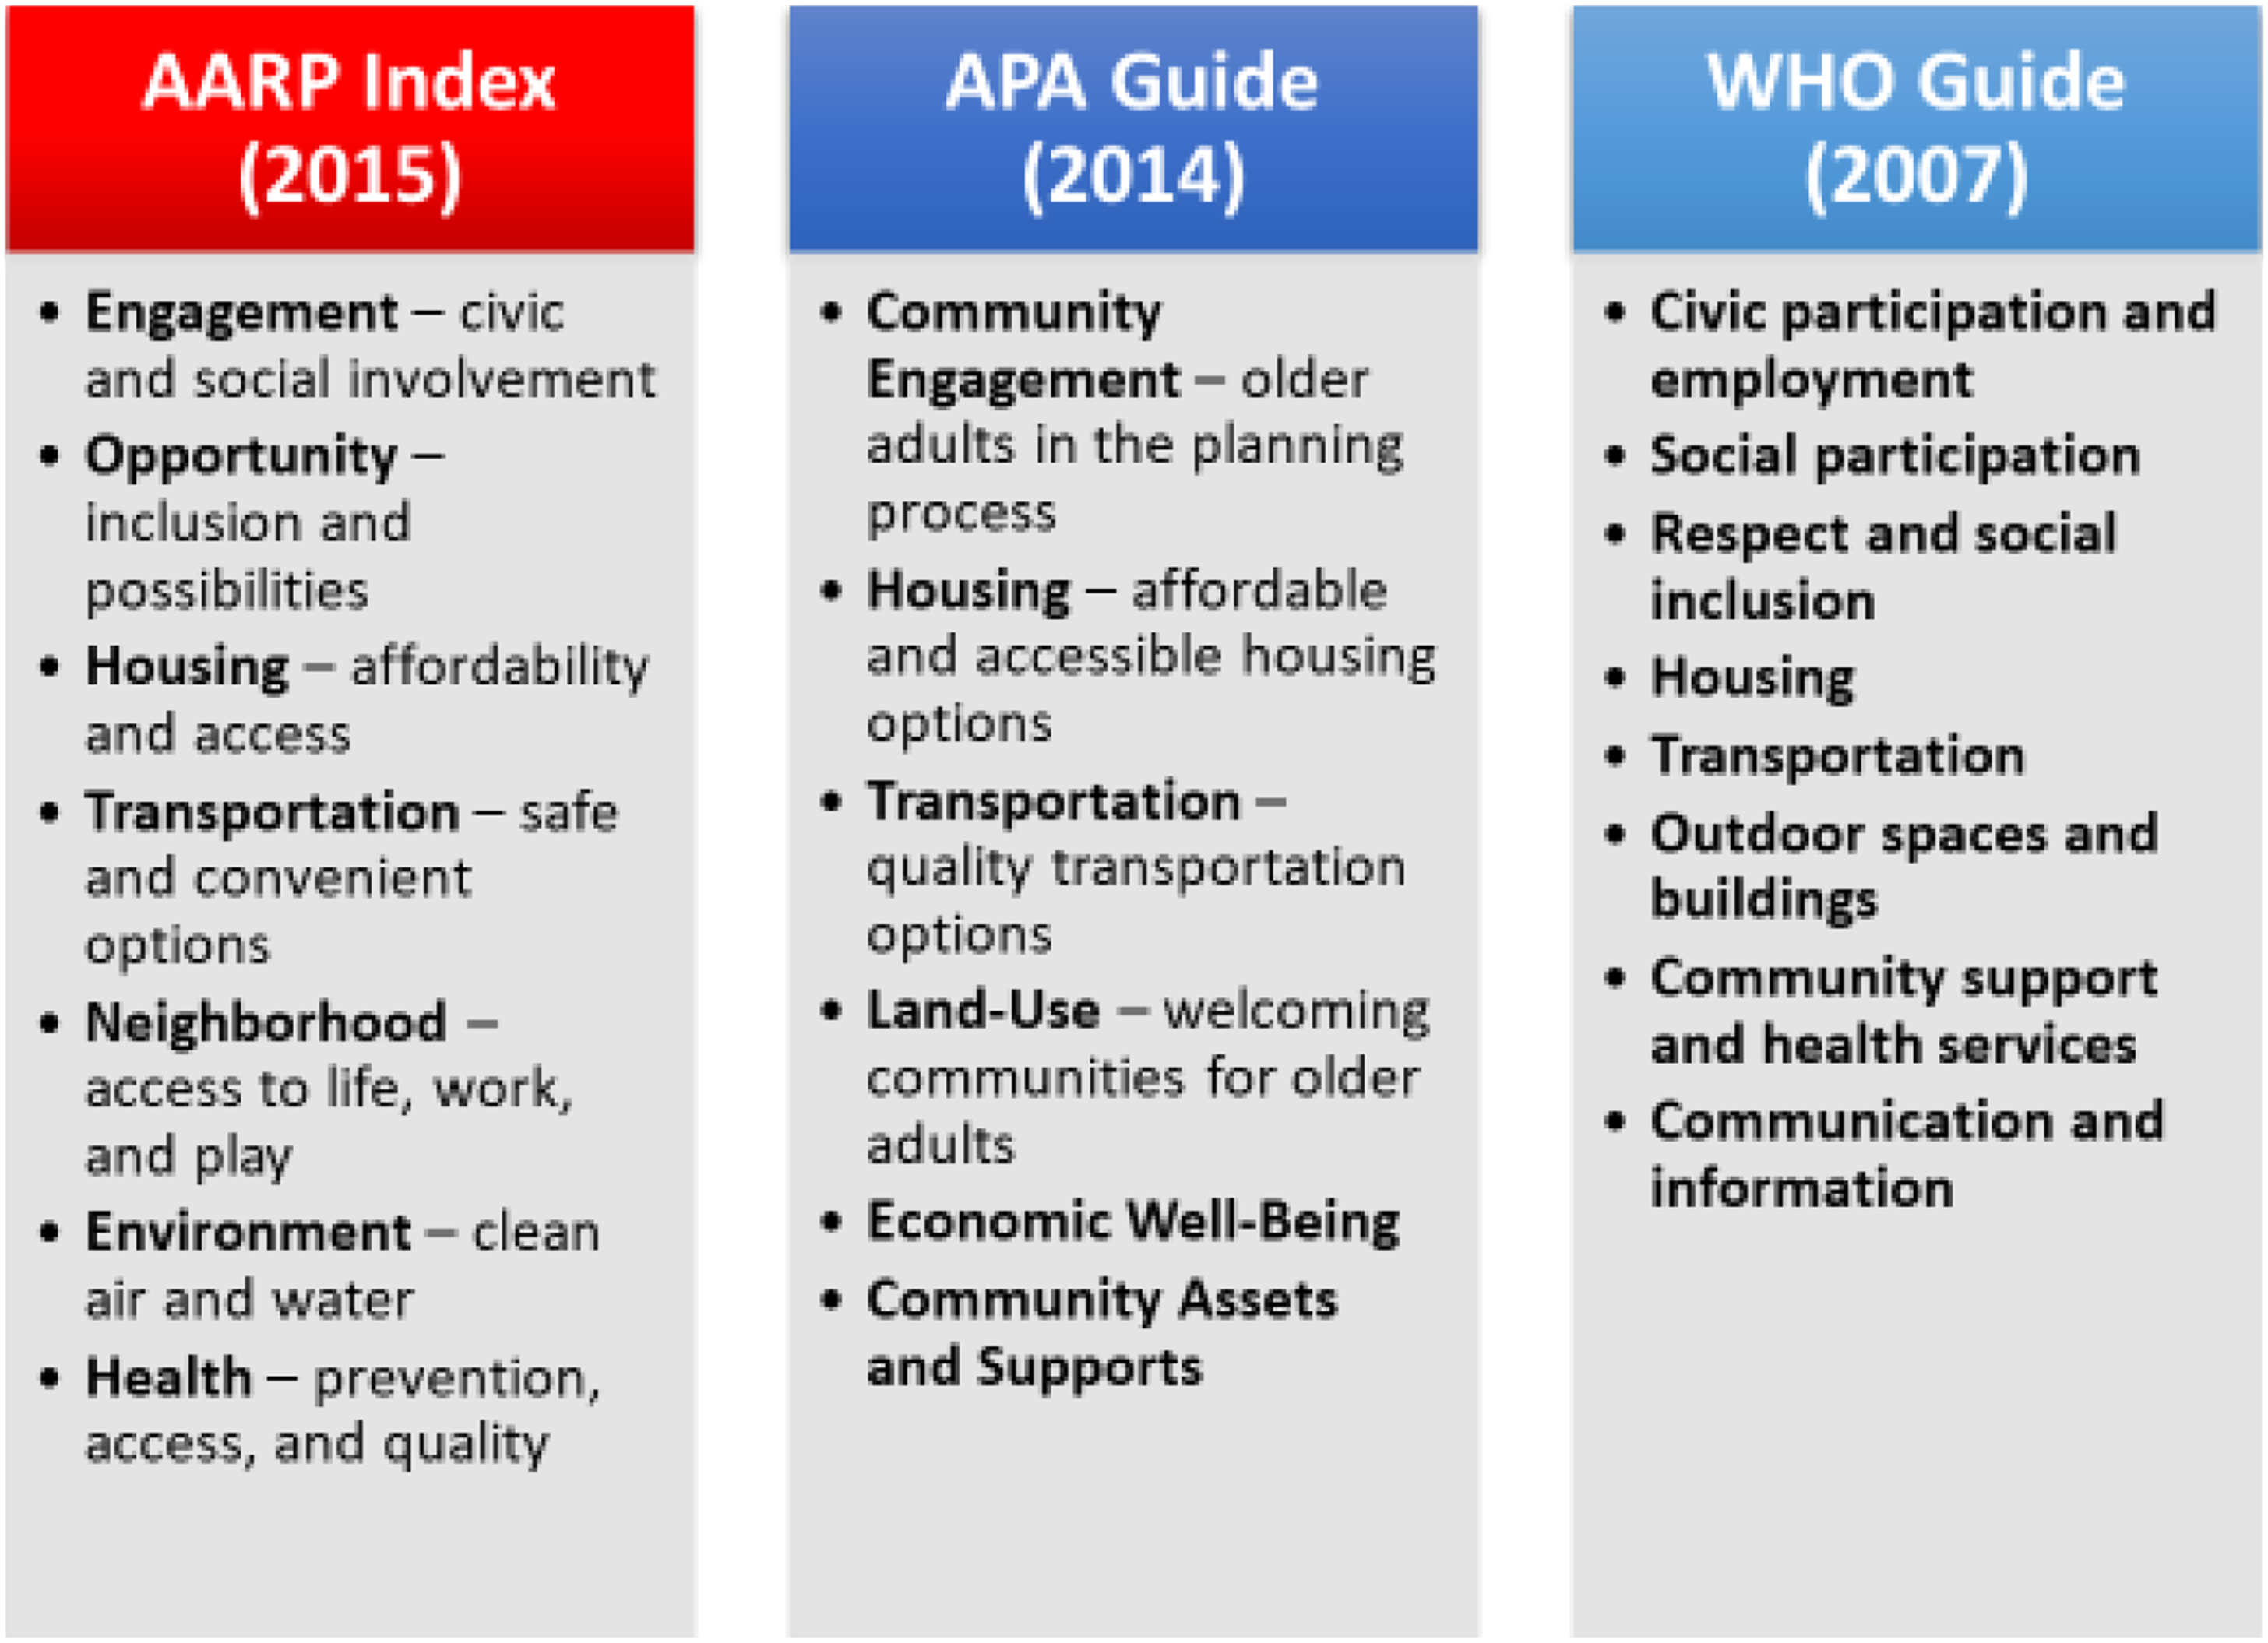
The AARP Livability Index is a web-based tool that measures a community’s livability on a scale from 0 to 100 and allows users to search an overall index score, along with seven livability category scores, by any street address, ZIP code, city, or county. It was developed by the AARP Public Policy Institute in 2015 and has been periodically updated since then (most recently in 2018). The tool was developed to fill a particular gap, as “AARP determined that nothing as comprehensive as the Livability Index existed to assess livability at the neighborhood level … [and] needed an on-the-ground picture of how to improve neighborhoods and communities … to prompt community conversations and action regarding livable communities” (AARP Public Policy Institute., 2018c). However, a recent report from the AARP/Joint Center for Housing Studies (Molinsky et al., 2020) based on descriptive statistical analyses (e.g., cross-tabulation) finds that most older adults in the U.S. do not reside in livable communities; more precisely, “more people ages 50 and older are living in neighborhoods that score lower on the Index than in neighborhoods that receive the highest scores” (Molinsky et al., 2020). While there is a lack of academic literature that examines the index’s validity as a policy-guiding tool, this report using the index provides the insight that there might be a general mismatch nationwide, whereby areas with the highest livability scores are not the areas where older adults live (or necessarily prefer to live).
This study aims to substantiate this mismatch visually using geospatial methods and compares census tract scores on the AARP Livability Index and census tract measures of age composition (i.e., the percentage of adults aged 65 years and older). It uses data from Hamilton County, Ohio, with Cincinnati located in the county’s south-central region. The examination involves visual inspection of maps as well as a hot-/cold-spot analysis of whether geographic areas with higher scores on the Livability Index are also areas with greater percentages of older residents. The AARP/Joint Center report also discusses how livability varies by geography; for instance, the Northeast and Midwest and city neighborhoods across the country rank highest on the index overall (Molinsky et al., 2020). Justification for the selection of this case can be found from the fact that Hamilton County is in Ohio, a midwestern state, and contains both urban and suburban neighborhoods, which enables a direct comparison of the two geographies, and Cincinnati, the cultural, economic, and political center of the county as well as the county seat, is regarded as one of the most “American” cities based on the closeness of its demographics to the national average (Bernardo, 2016). Although this single case study’s results may not be replicable across a greater variety of geographic locations, these facts make the county an ideal candidate for the case study, which intends to demonstrate the aforementioned mismatch and discuss possible social and historical context and reasons for it that are specific to this geographic location.
The ultimate aim of this study is to contribute to advancing the development of broader knowledge of strategies to characterize the livability of geographic-based communities, as the framework for the construction of the AARP Livability Index shares multiple commonalities with the widely adopted WHO framework. Since the actual residential location choices of older adults may not necessarily indicate the appropriateness or age-friendliness of the residential environments, age-friendly community policymakers and multidisciplinary experts on aging in place will need to discuss any gaps between the policy movement’s framework and its applicability under existing conditions, especially in the U.S. residential context. This study also intends to discuss whether frameworks of age-friendly communities can explain older adults’ residential patterns or instead diverge (and to what extent and in which areas) from their actual residential preferences. The investigation has practical policy ramifications because it is predicated on the premise that if older adults' residential patterns are significantly correlated with high livability scores, our aging society would require fewer resources to adapt our residential and social environments to be age-friendly and, thus, be better prepared for the future.
Research Design and Methods
Using visual inspection of maps and spatial analytics such as spatial autocorrelation and hotspot analysis, this study intends to compare and demonstrate the mismatch between the geographic locations and spatial patterns of census tracts in Hamilton County that the AARP Livability Index highlights as more or less desirable places for older adults to live and the tracts where older adults actually live (the percentage of residents aged 65+ in a census tract) based on the 2016 American Community Survey (ACS) dataset (U.S. Census Bureau, 2017). Other census measures, such as education and race/ethnicity, which might have significant correlations with the AARP index (and might help explain the residential patterns of older adults), are not examined in this study to focus solely on the saturation/clustering of the older adult population within a community.
These geospatial examinations are particularly useful to visually characterize the livability and age composition of neighboring census tracts, helping legislators, policymakers, and planners better understand the issue and make better locational decisions with regard to age-friendly policy goals. Aging in place and the policy movement are directly related to complex location-oriented problems, and it is important to better understand where and how these locational patterns emerge. In particular, hotspot analysis goes beyond mere mapping, allowing us to identify spatial clusters of phenomena, which can provide us with insight that lends a new perspective to policy decision-making. It examines each feature in a dataset in the context of neighboring features in the same dataset; for instance, a feature with a high/low value needs to be surrounded by other features with high/low values to be a statistically significant hot/cold spot. Beyond the visual inspection of census tract–level maps, the hotspot analysis method contributes by precisely indicating locations based on inferential statistical values and allowing estimation of the correlation between the concentration of older residents and the Livability Index score at the census tract level.
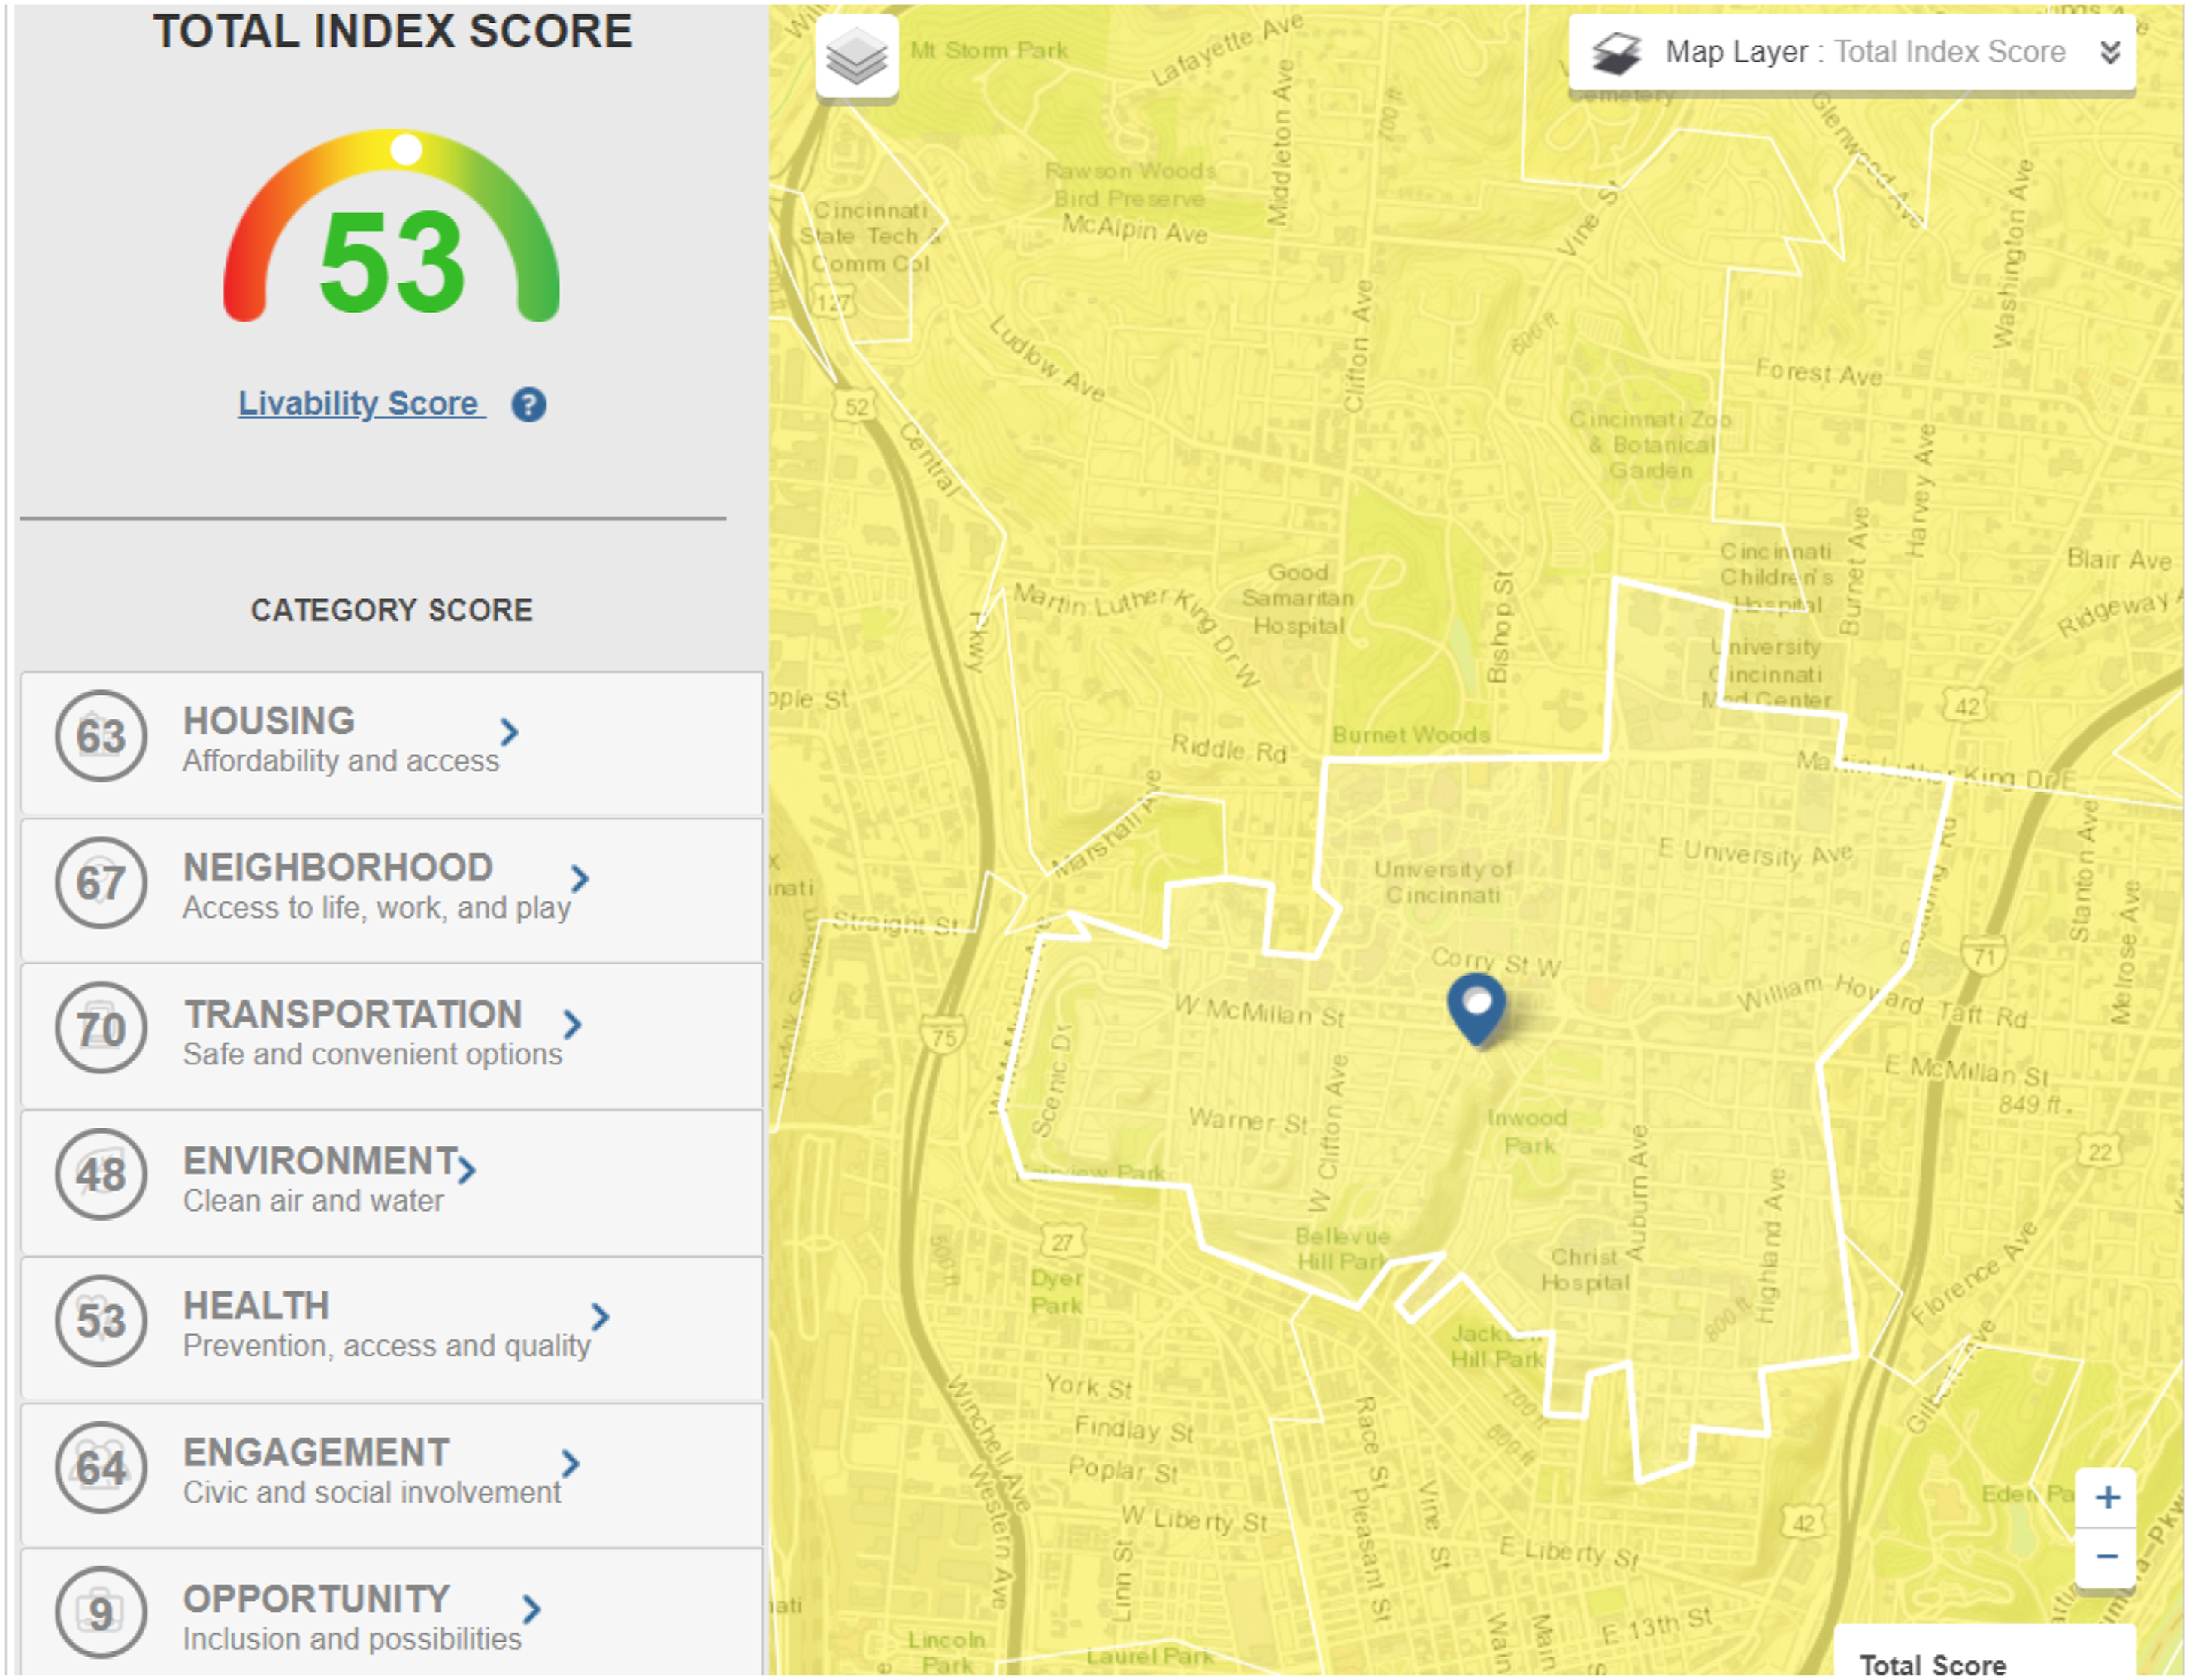
The AARP Livability Index is available through an interactive website (https://livabilityindex.aarp.org/) and database that scores the extent to which a geographic area, from a census block group to a state, is “livable” on a scale from 0 to 100. For example, a user can simply type in a street address in the search bar of the main webpage (see Figure 2), and then, the website produces a corresponding map with the location’s overall livability score/index and multiple category scores (see Figure 3) calculated from more than 70 indicators. Specifically, the overall score/index is calculated from seven equally weighted but adjustable category scores, namely, housing (“affordability and access”), neighborhood (“access to life, work, and play”), transportation (“safe and convenient options”), environment (“clean air and water”), health (“prevention, access, and quality”), engagement (“civic and social involvement”), and opportunity (“inclusion and possibilities”) (AARP Public Policy Institute., 2018b). Each category score is calculated from multiple quantitative “metric (e.g., housing affordability)” and qualitative “policy (e.g., whether a certain policy is available in that geographic area or not)” values (AARP Public Policy Institute, 2018d). It should also be noted that the Livability Index itself allows different weighting of the measures, which permits the tool to be programmed in ways more suited to different geographic contexts (e.g., rural communities). AARP Livability Index website main page. Note. Screenshot taken by the author. Example of AARP Livability Index and category scores. Note. Screenshot taken by the author.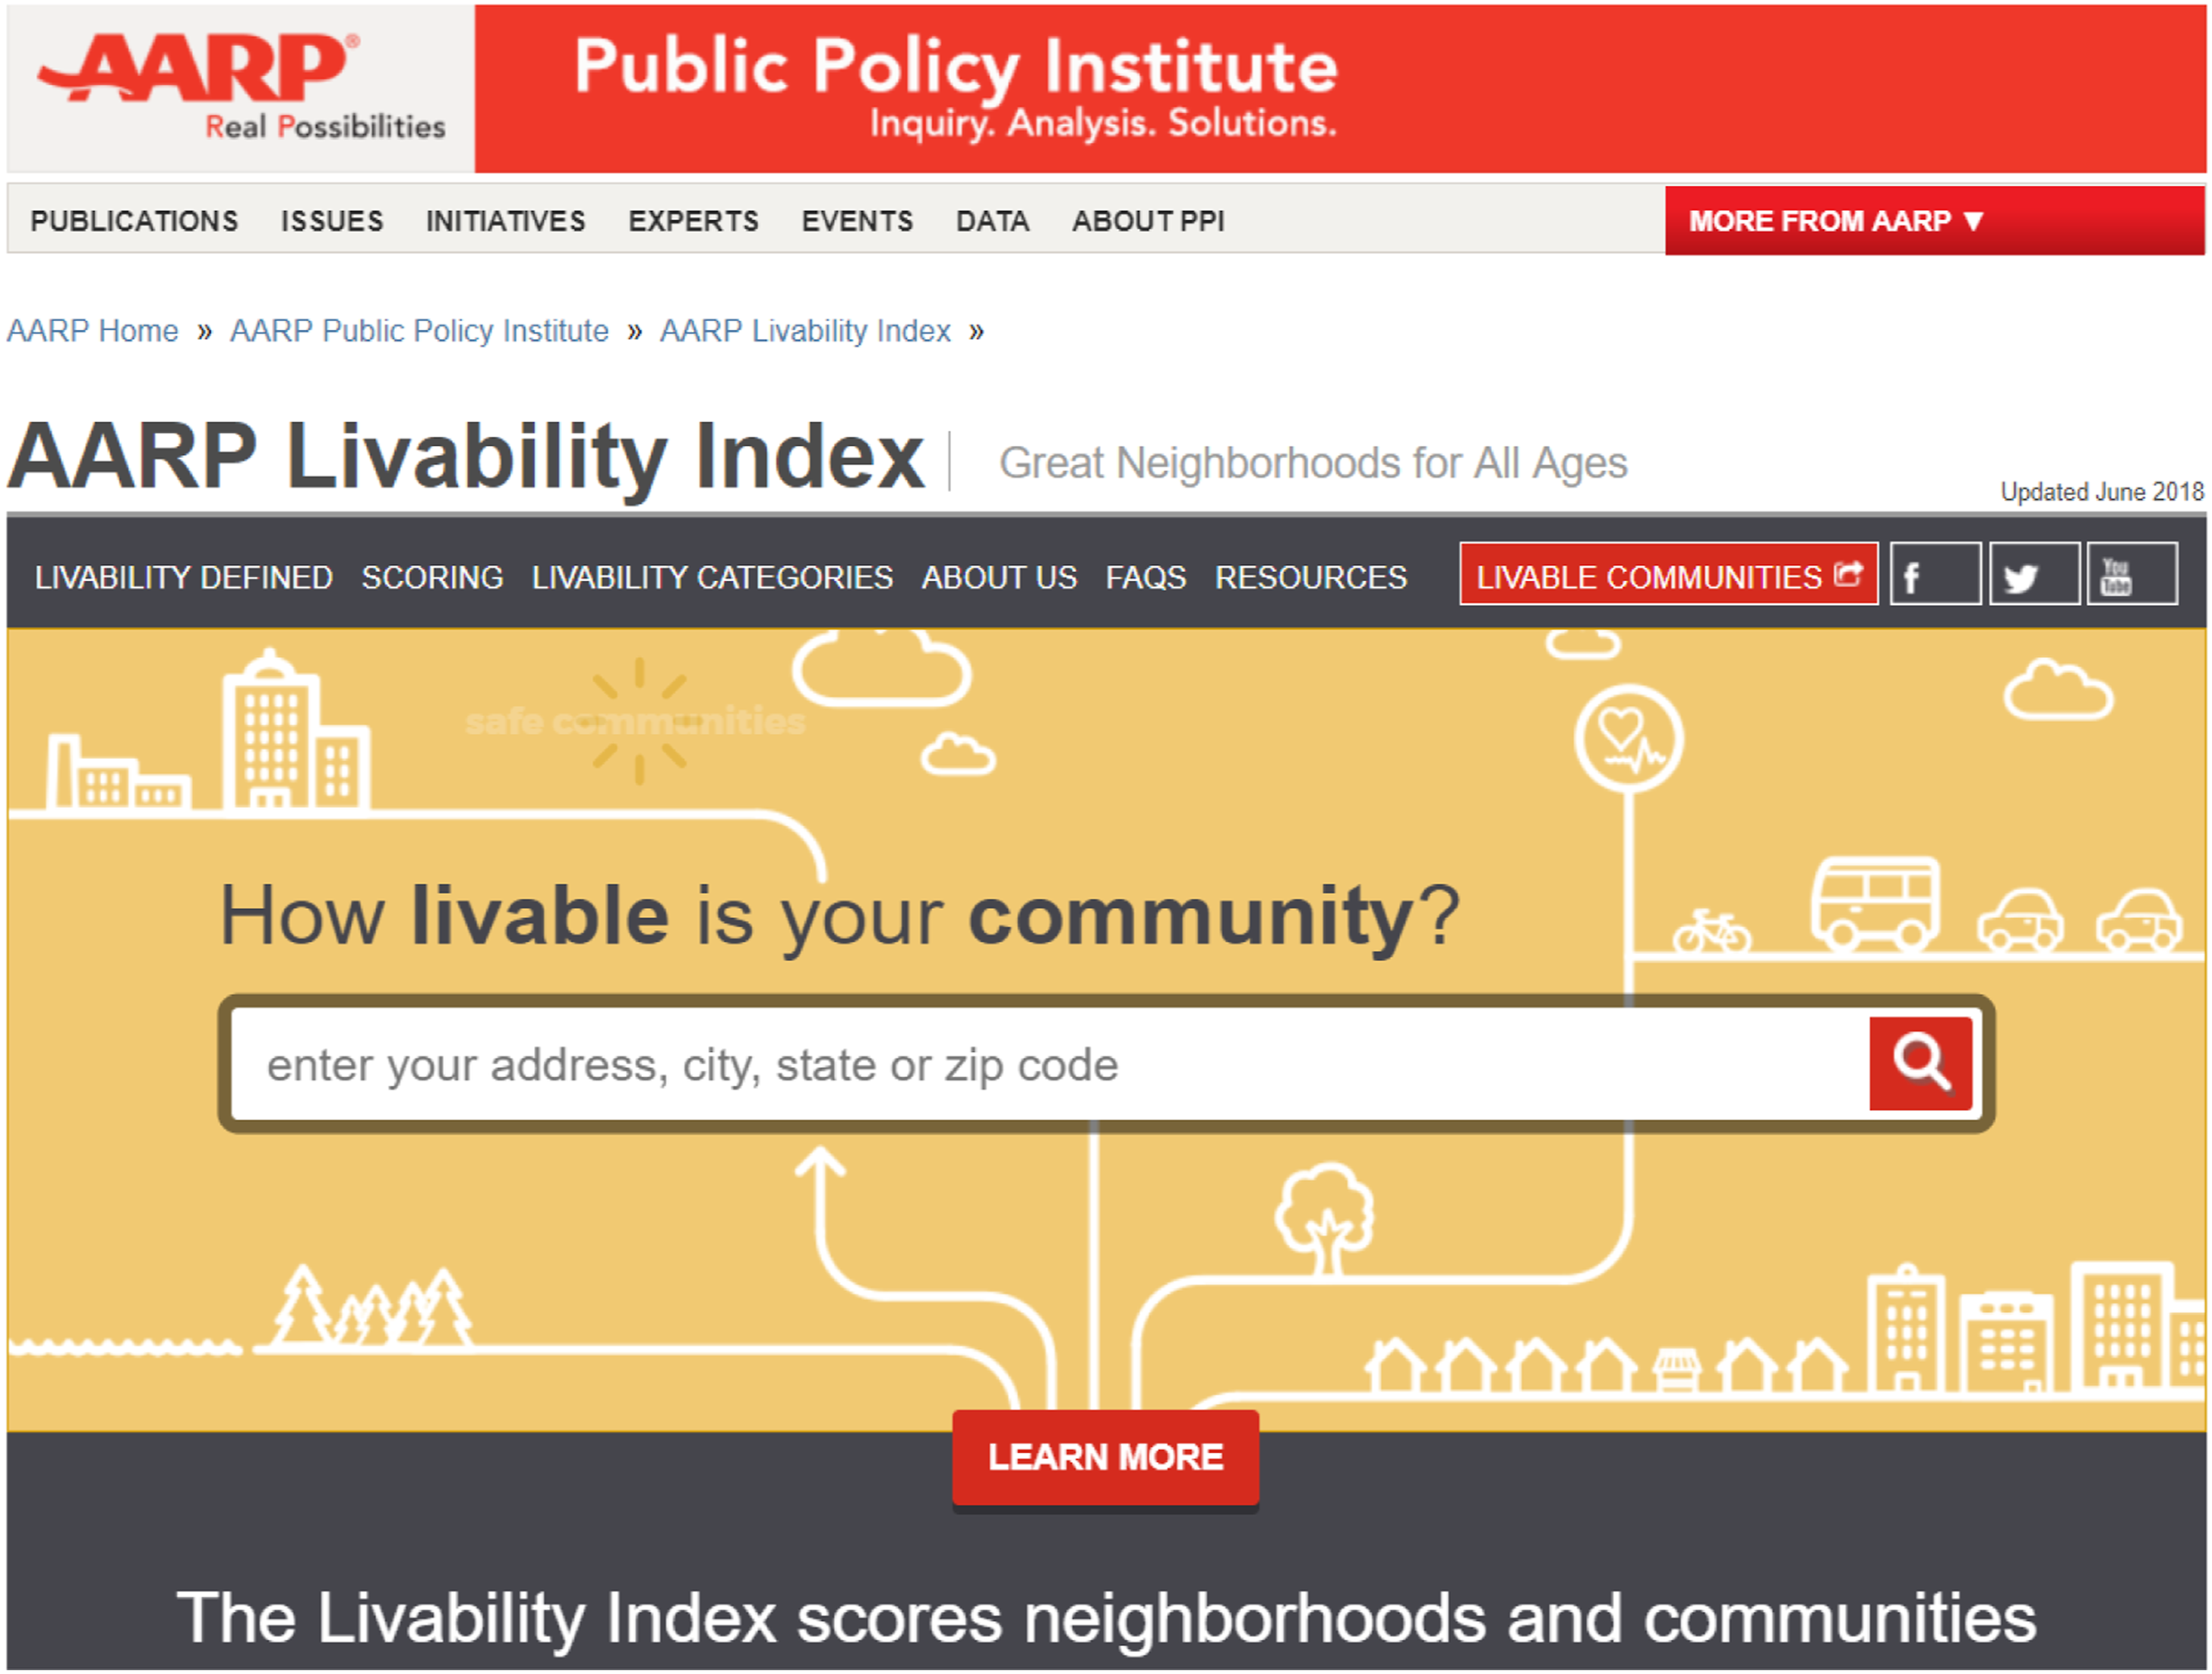
It should be noted that the AARP index is descriptive of current conditions, as it assesses and scores various geographies, but is also normative, in the sense that it explicitly promotes livability as defined by its own criteria within the tool/index. (While many of these individual index criteria and metrics may have been examined by relevant practitioners and scholars, their theoretical orientation is not entirely clear or explicit to the public audience, including the author, because the organization has not published on this subject.) We might not reasonably expect a geospatial area with a greater percentage of older adults to necessarily have age-friendlier community characteristics in the first place; indeed, it is precisely the problem that many communities where older adults live lack characteristics friendly to aging, and this is the premise, in part, of the age-friendly community policy movement.
There are 221 census tracts within Hamilton County’s administrative boundary. The values of the two variables under comparison, the AARP Livability Index (the overall livability score) and the percentage of adult householders aged 65 years and older from the 2016 ACS dataset, were coded in an Excel spreadsheet for each of these census tracts. Based on the Jenks natural breaks, the 221 values for each variable were then projected onto a separate thematic map of Hamilton County for initial visual inspection and comparison. These data were gathered by the author manually by visiting the AARP index website and inputting street addresses that correspond to all the census block groups within the county, and then, these scores were averaged for the corresponding census tracts, in the same way that the AARP index calculates its census tract–level scores from the scores of smaller geographic units. It should be noted that this data collection was conducted in 2016, so the 2016 ACS dataset was matched to the latest (2016 or older) data used in the AARP index.
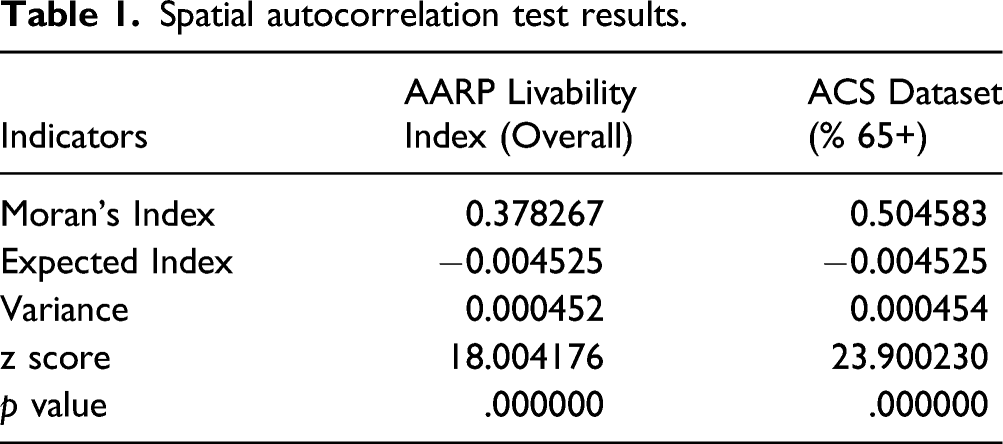
As the next step, spatial analytics such as spatial autocorrelation and hotspot analysis were conducted from the coded workbook in ArcGIS Pro (Version 1.4) to analyze and compare the spatial patterns of these variables. The spatial autocorrelation method (global Moran’s I) evaluates whether each pattern expressed is clustered, dispersed, or random, and the hotspot analysis method calculates the Getis-Ord Gi* statistic for each pattern, with the z scores and p values indicating where either high or low values cluster. Again, the hotspot analysis examines each feature in a dataset in the context of neighboring features in the same dataset; for instance, a feature with a high/low value needs to be surrounded by other features with high/low values to be a statistically significant hot/cold spot.
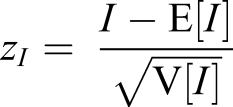
Moran’s I statistic for spatial autocorrelation is given as

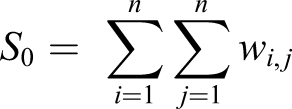
The


The Getis-Ord local statistic is given as
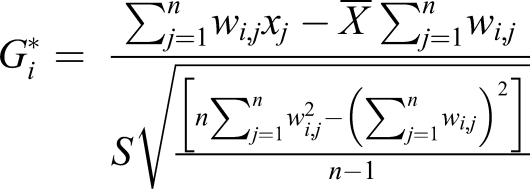


The
Results
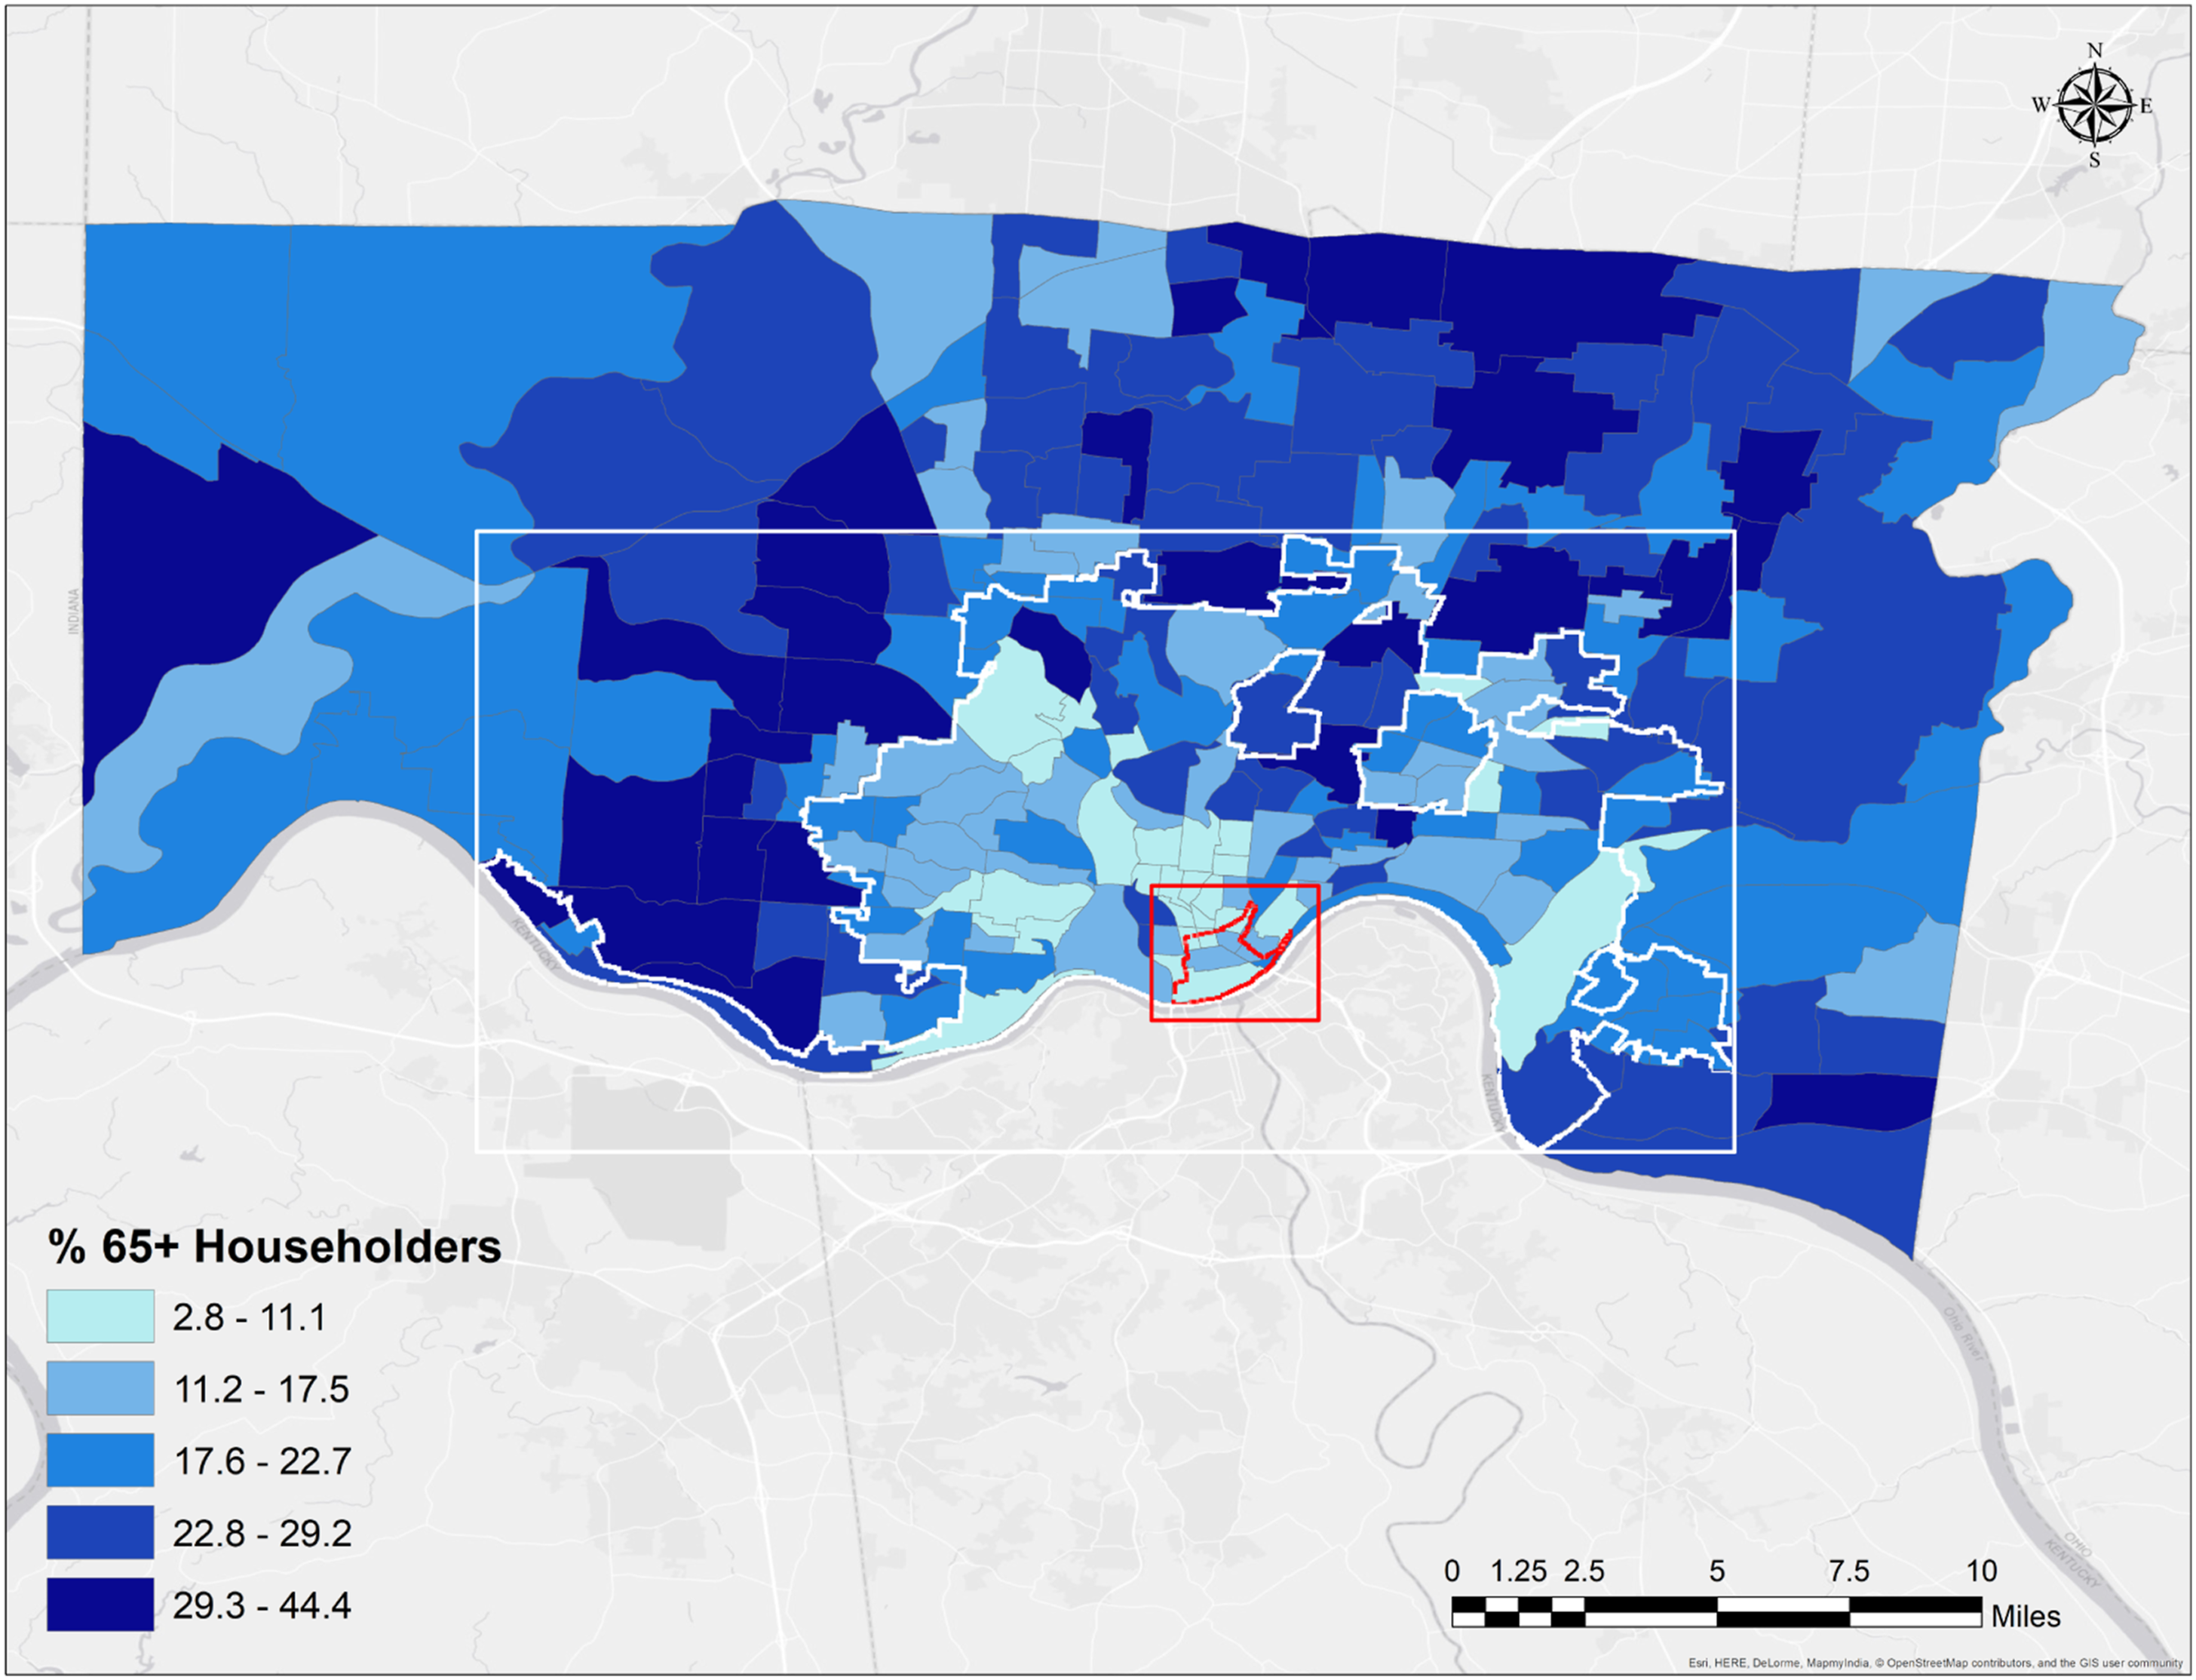
First, visual inspection led to the tentative observation that there might be contrasting patterns/clusters between each variable. At the census tract (or “neighborhood”) level, the AARP Livability Index values appear to identify denser, central/urban areas including the City of Cincinnati as more livable or age friendly (see Figure 4), while the ACS data (percent of householders aged 65+) seem to show that less dense, suburban/rural areas contain higher percentages of the older adult population (see Figure 5). The first map of Hamilton County (Figure 4) shows the highest Livability Index values/scores to be concentrated in central Cincinnati’s downtown/central business district (CBD) area, and the values for the outlying, suburban/rural areas gradually decrease. On the other hand, the census tracts with higher percentages of older adults are spread over the suburban/rural areas in the second map of Hamilton County (Figure 5). AARP Livability Index scores within Hamilton County, Ohio. *The red boundary within the red square indicates the central business district of Cincinnati. **The white boundary within the white square indicates the City of Cincinnati. ACS percentage of householders aged 65 years and older within Hamilton County, Ohio. *The red boundary within the red square indicates the central business district of Cincinnati. **The white boundary within the white square indicates the City of Cincinnati.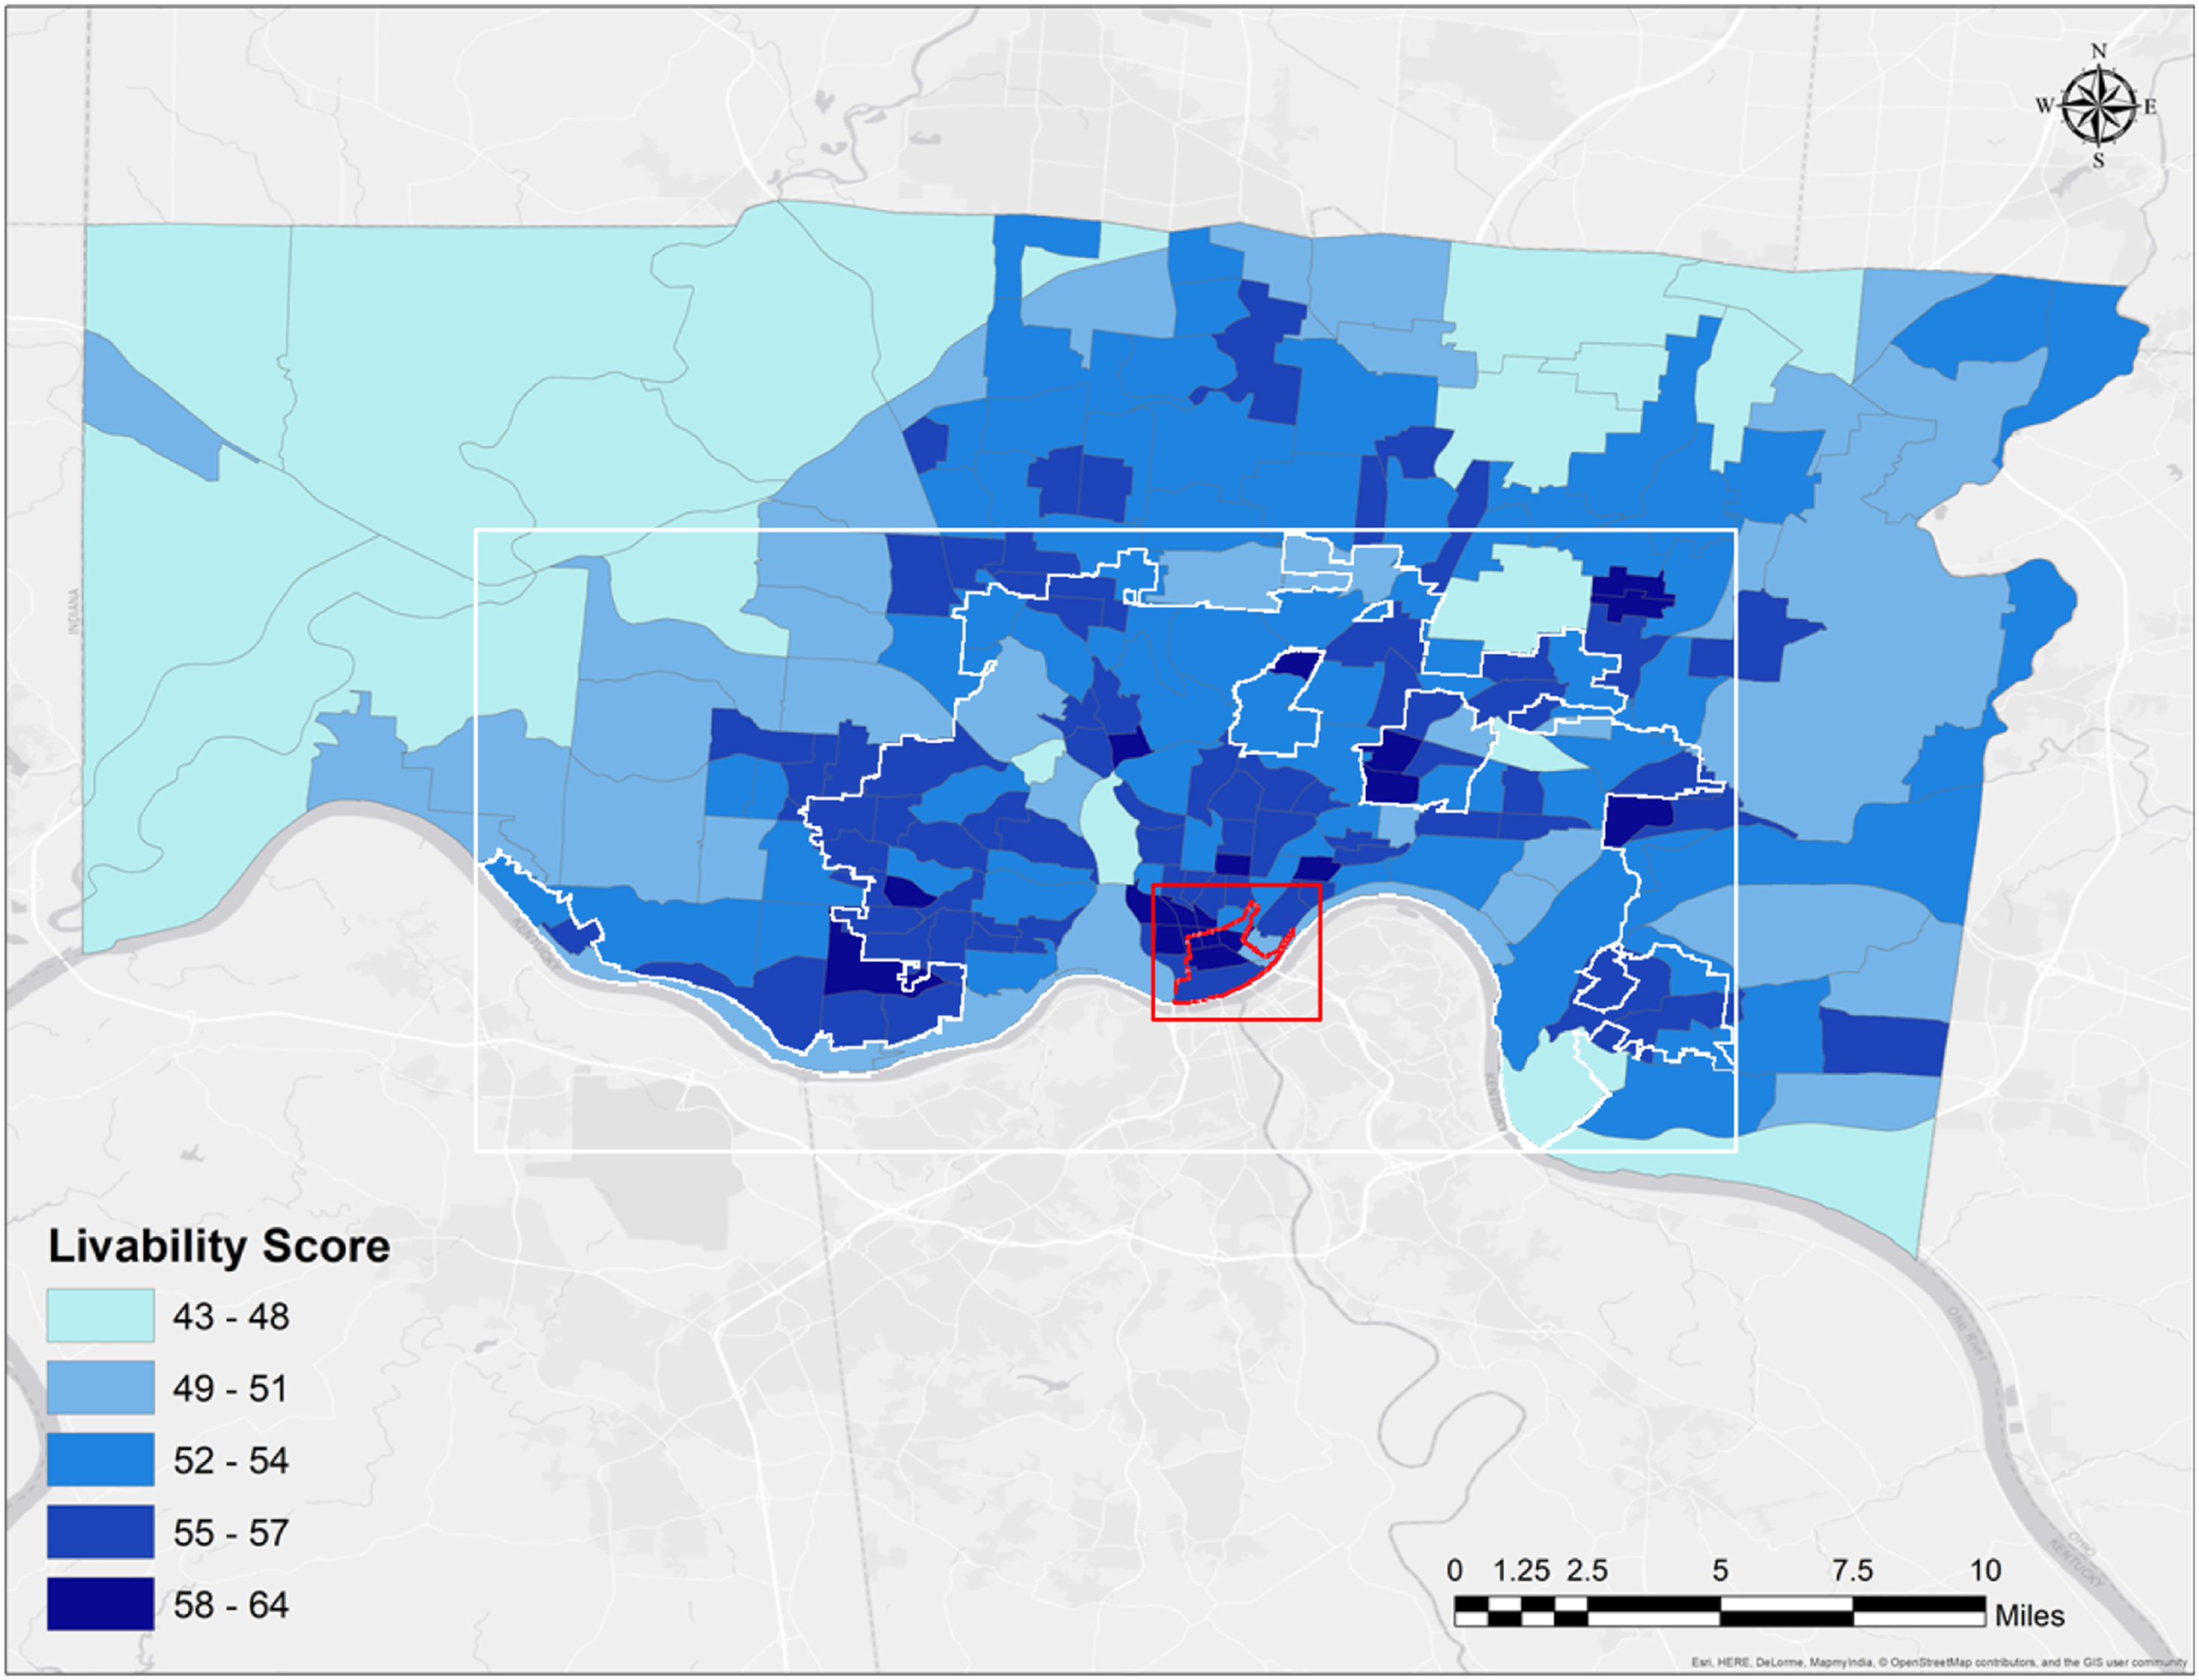
Spatial autocorrelation test results.
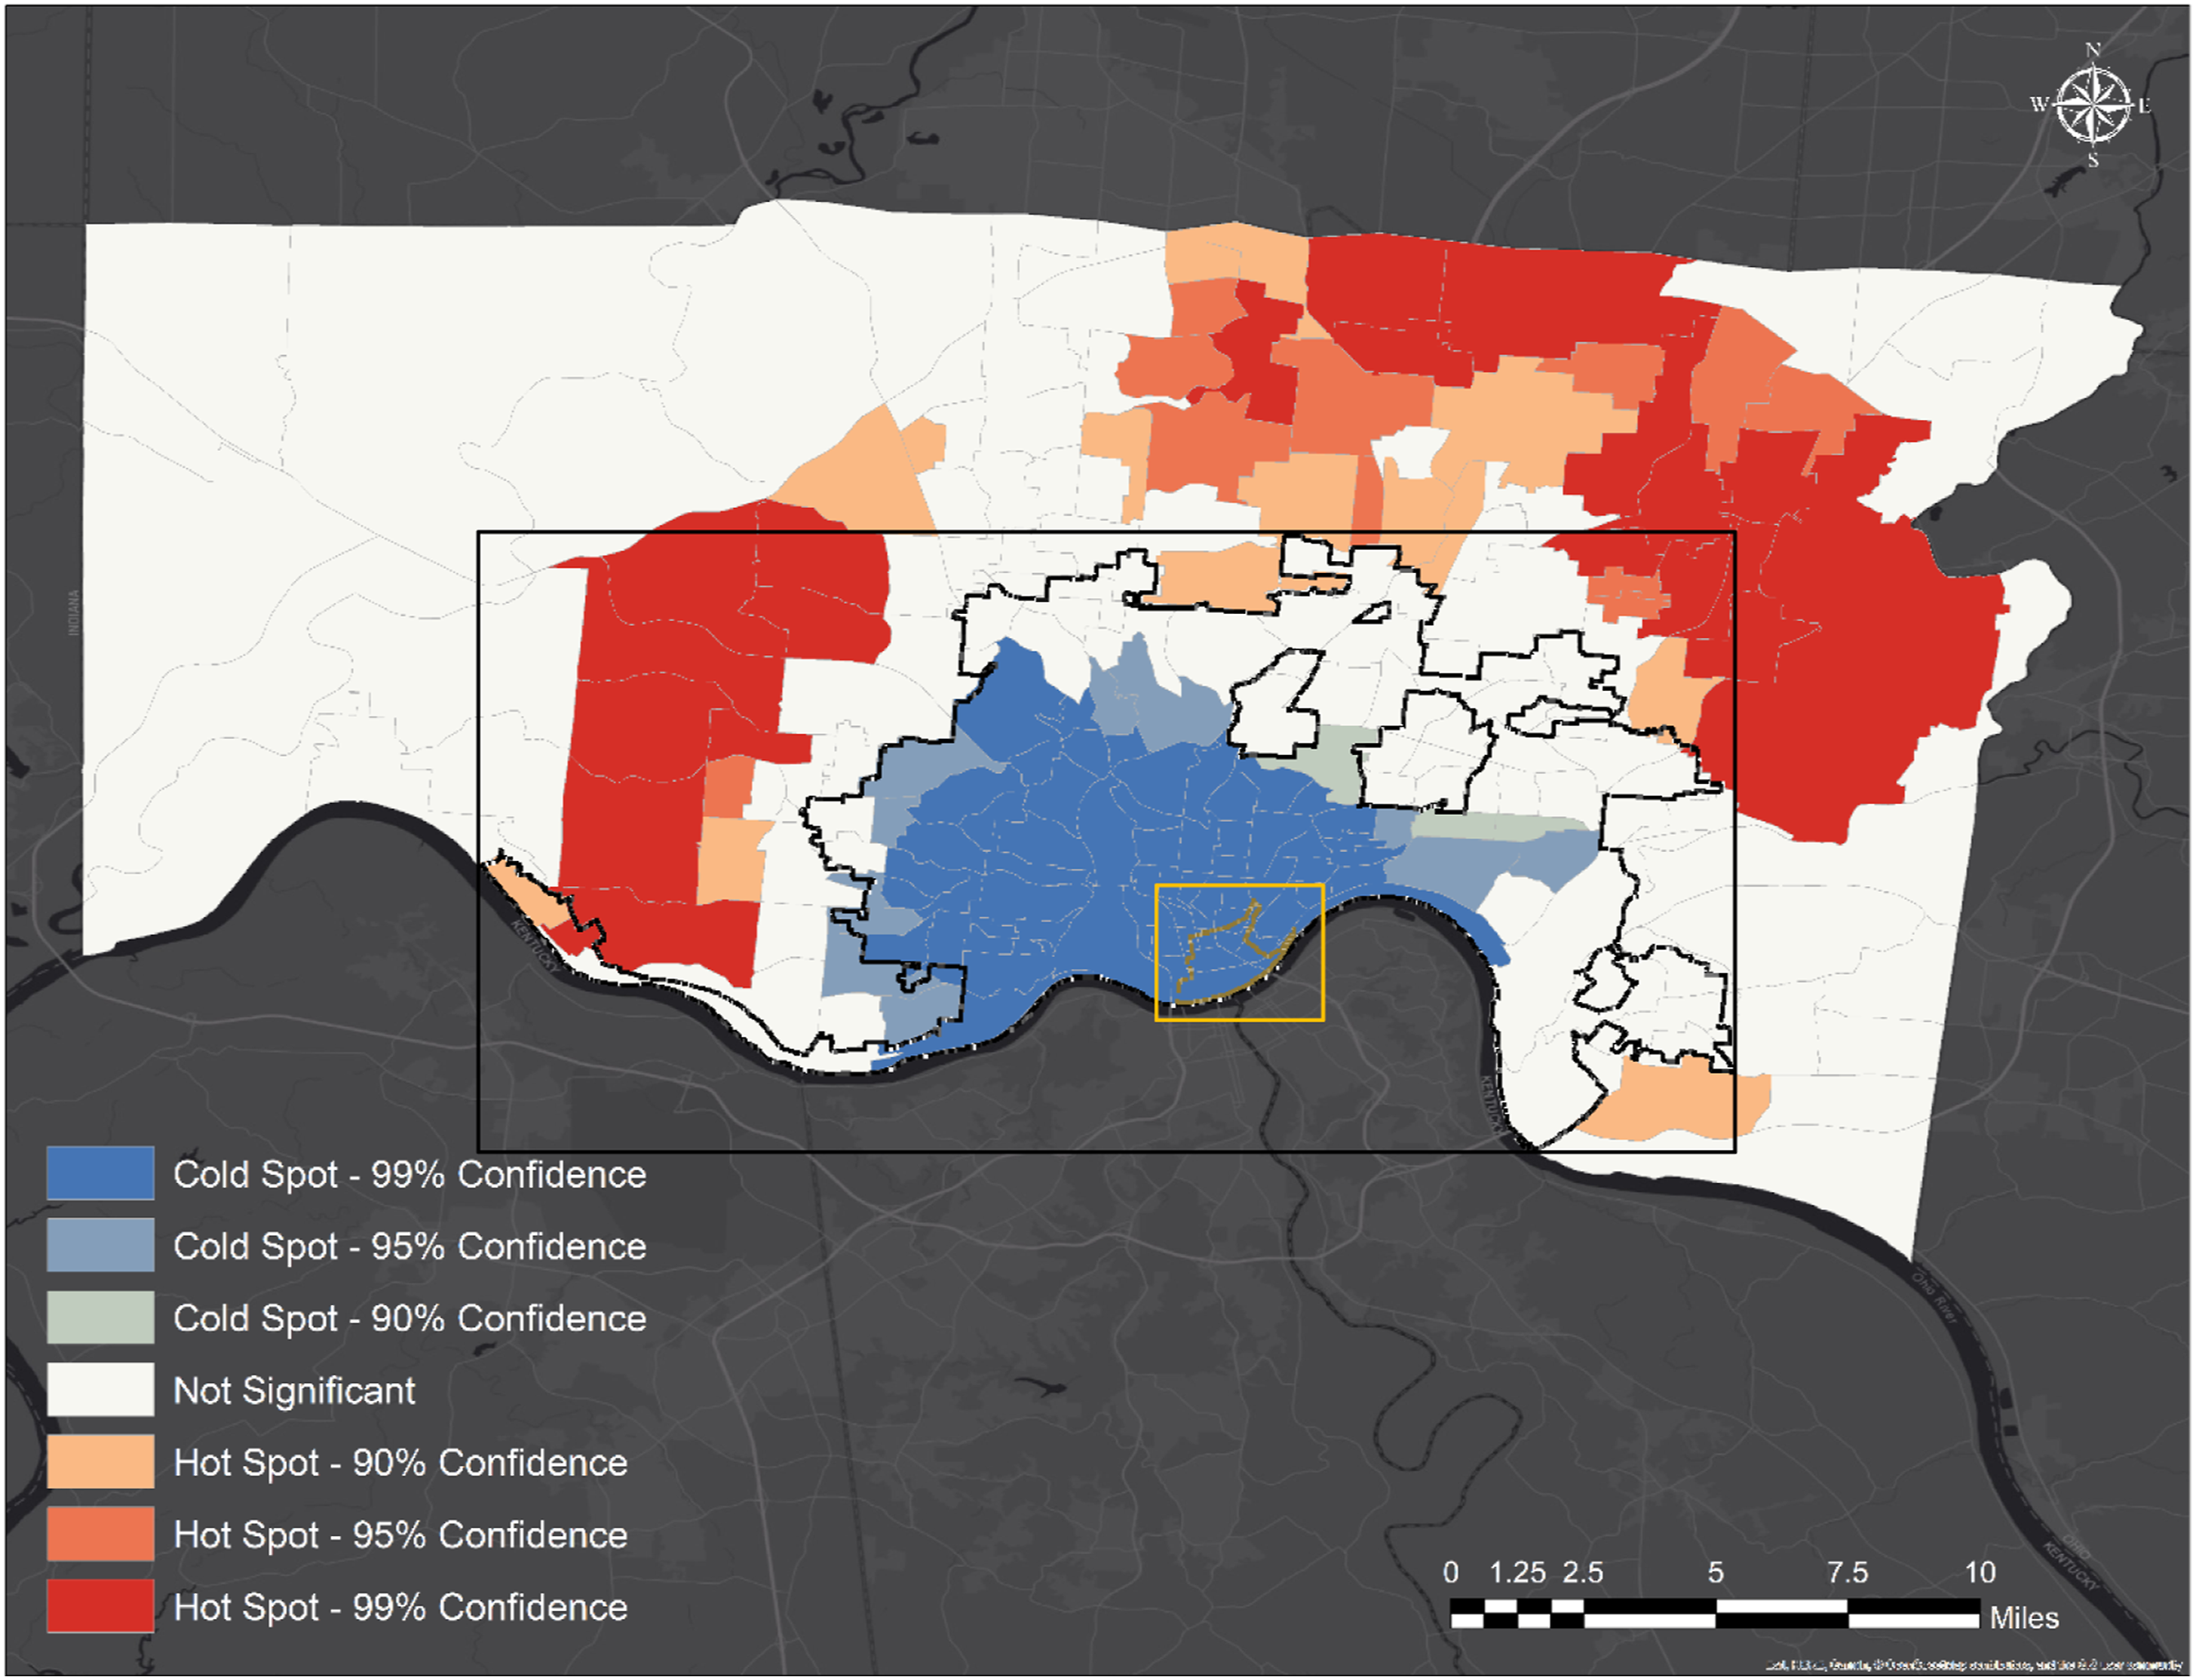
The hotspot analyses of the AARP Livability Index values and the ACS dataset values basically confirmed the same trend. The hotspot map of the index values (Figure 6), on which the clusters of hot spots (high values) and cold spots (low values) for the variable throughout the 221 census tracts are projected, confirms that higher values are concentrated in the center and its surrounding, denser areas, including a significant portion of Cincinnati. On the other hand, the hotspot map of the ACS dataset values (percentage of householders aged 65 and older) (Figure 7) reveals that low percentage values are concentrated in the center, covering most of Cincinnati, while high percentage values are spread over the suburban areas. Hot and cold spots of AARP Livability Index scores within Hamilton County, Ohio. *The yellow boundary within the yellow rectangle indicates the central business district of Cincinnati. **The black boundary within the black rectangle indicates the City of Cincinnati. Hot and cold spots of the ACS percentage of householders aged 65 years and older within Hamilton County, Ohio. *The yellow boundary within the yellow rectangle indicates the central business district of Cincinnati. **The black boundary within the black rectangle indicates the City of Cincinnati.
Discussion and Implications
This study contrasts existing policy frameworks of age-friendly communities, including the AARP Livability Index, with the actual locations in which older adults live using Hamilton County in Ohio as a case study. If older adults' residential patterns are significantly associated with high livability scores, our aging society would require fewer resources to adapt our residential and social environments to be age-friendly and, thus, be better equipped for the aged society in the future. The study uses geospatial methods to advance the empirical research and guide policy on age-friendly communities.
The study finds that older adults in Hamilton County more often live in less dense, suburban locations (deemed less livable under the AARP index) than in the denser, urban areas near the center of Cincinnati. Based on this result, we can first discuss why the suburban areas of Hamilton County are deemed less age friendly and livable by the AARP index. This is largely because the AARP index deems two factors, “proximity/accessibility to services and amenities” and “affordability of housing,” highly desirable for age-friendliness and livability, and the urban and denser neighborhoods of a typical U.S. metro area (with an urban-suburban dichotomy) like Hamilton County score highly on AARP livability. On the other hand, older adults in Hamilton County disproportionately live in suburban, less dense neighborhoods, while the housing, neighborhood, and transportation categories of the index tend to show higher scores for areas near the city center. Although a small number of neighborhoods with high livability scores display large percentages of older adults, the overall pattern of mismatch is significant and confirmed by the geospatial methods used in this study. This mismatch or gap is quite striking and exemplifies the challenges that the age-friendly community policy movement currently faces.
Age-friendly community policy frameworks such as the WHO Global Age-Friendly Cities and the AARP Livability Index share many commonalities in their framework constructs. One such commonality is the promotion of denser (i.e., more urban) residential environments (AARP Public Policy Institute, 2018e; World Health Organization, 2007). This guiding principle, which is justified by both intuition (e.g., proximity to resources for everyday needs typically translates into convenience) and evidence collected by the movement itself (Plouffe & Kalache, 2010; World Health Organization, 2007) and from other, predominantly urban contexts in Europe (Fitzgerald & Caro, 2014) and Asia (Yuen and Yap, 2020), is primarily a result of inductive reasoning/framing (Buffel et al., 2012). However, this generalized guideline may not be optimally applicable to certain geographies and locations in the U.S., such as Hamilton County, Ohio, a mid-sized U.S. metropolitan area dominated by the largest city or urban center with the highest density. The investigation of older adults in Hamilton County revealed that they are concentrated in less dense, suburban locations and residential environments (U.S. Census Bureau, 2017), which can potentially create some challenges in promoting and implementing policies for age-friendly environments in the county. Fortunately, the county’s older adults are served by the Council on Aging (COA) of Southwestern Ohio, which offers publicly funded programs and services in home- and community-based care with the aim of promoting the independence, health, and well-being of older adults in the southwest Ohio region (Council on Aging of Southwestern Ohio, 2021). In 2020 alone, the COA provided 5,396 county residents with home- and community-based services that can directly help these people in their desire to age in place in the community (Council on Aging of Southwestern Ohio, 2020). Additionally, Cincinnati joined the AARP Network of Age-Friendly States and Communities in 2018, enabling AARP to work with its local leaders and partner organizations to guide the city through the network’s assessment, planning, implementation, and evaluation processes, as well as through the sharing of resources and information on, for example, best practices from other network members (AARP., 2021; City of Cincinnati, 2021). As a condition of membership, the city conducted a community assessment and action plan (2021) based on the WHO’s framework for Age-Friendly Cities and Communities, the eight livability domains (Figure 1) (City of Cincinnati, 2021).
Nevertheless, the contrasting pattern or mismatch visually demonstrates the gap between frameworks for age-friendly communities and the reality of the living conditions of older adults, which is likely the consequence of larger sociohistorical patterns of residential migration in Hamilton County (and probably other U.S. metro areas as well). For instance, racial segregation and urban flight may explain the patterns of older adults’ residential locations in Hamilton County but are phenomena not accounted for under the AARP index. Certainly, the index, on the one hand, is normative and not a reflection of where older adults actually want or are able to live (or whether they are unwillingly “stuck in place”). Nevertheless, the findings in Hamilton County revealing that this gap might differ significantly from that of other U.S. counties such as New York County (Manhattan), where there are large concentrations of older adults in certain dense, urban neighborhoods. This leads to the conjecture that sociohistorical patterns and the extent to which older adults are aging in place within their communities might explain the gap found in the case of Hamilton County. Future research should consider other sociodemographic characteristics intersecting with age. It would also be helpful to conduct sensitivity tests across the specific subdimensions of the livability index and consider different age cutoffs (e.g., the percentage of the population aged 80 and older). The fact that many older adults live in places with lower livability scores is unlikely a reflection of conceptual failures of the AARP index but rather of geographic distributions of variables other than age. Controls for income and race would be helpful in this regard. Racial segregation, for example, could possibly account for the greatest mismatches between livability scores and concentrations of older adults, which also has implications for the prevalence and persistence of racial disparities in access to health and community services among older adults (Krok-Schoen et al., 2021). As decades of systematic and institutional discrimination in housing such as “redlining” and its resulting effects (e.g., disinvestment in urban areas) (Galster, 1990; Massey & Denton, 1998) significantly contributed to the establishment of a dual housing market system (Stearns & Logan, 1986), the white majority was incentivized to settle in suburban locations, while non-white minorities were coerced into settling in urban areas (Crowder, 2000; Dawkins, 2016; Flippen, 2001; South & Crowder, 1997).
This study has several methodological limitations as well as researcher-imposed constraints. First, because this is a case study, the study’s findings will be difficult to extrapolate to a larger group of municipalities, even though the research provides insight for future research. While Hamilton County may be representative of a larger group of geographically adjacent municipalities, such as those found in the Midwest’s “midsize” counties, the study’s scope was limited by the one case. Second, and related to the first limitation, replicating the study for other locations would be time-consuming and potentially costly (though not impossible), as the index data (metrics and indicators) analyzed in this study were manually obtained from the AARP Livability Index website because they were not readily and publicly available. The researcher’s ability to conduct a more complete assessment that included other counties and metropolitan areas was limited by this methodology utilized to collect the index data from the website. Related to the second limitation, a third limitation is the lack of longitudinal considerations, as the study did not quantify and measure changes or stability of the study variables over time due to the cross-sectional research design and difficulties in readily accessing the data. Fourth, qualitative components, such as focus group interviews and resident surveys, could possibly be added to this exploratory case study to allow for a more nuanced comparison of areas rated more/less age-friendly by the Livability index. Finally, due to its recent adoption and lack of measurable outcomes, this study was unable to analyze Cincinnati’s recently adopted Age-Friendly Cincy action plans (City of Cincinnati, 2021), which promote an AARP/WHO-guided, age-friendly community agenda, in the context of the study findings, which would have allowed for a more robust discussion of the study’s implications for the city and county.
A major challenge confronting the multidisciplinary group of researchers studying age-friendly cities and communities is the absence of a clear-cut theory guiding the concept of an age-friendly city/community, despite the fact that the WHO’s Global Age-Friendly Cities framework is the result of extensive focus group studies and has served as a model framework in a number of countries. To become a “theoretical model,” a “framework” may need to be empirically tested to confirm its operation and effectiveness, but this is simply not feasible unless we plan and build a new town with the desired characteristics of the WHO’s framework (and have older adults live there for a while and measure their satisfaction) and compare it to a control group of other cities and communities with no/fewer desired age-friendly characteristics. Additionally, because these frameworks are multidisciplinary in nature, competing perspectives and demands from each group of criteria would necessitate trade-offs in reality (e.g., from a real estate perspective, can we easily find an affordable home location in a major U.S. metropolitan area that is walkable, close to green open space, and accessible to decent amenities and public services?). To avoid being overly idealistic, future studies of age-friendly cities and communities could focus on developing more realistic frameworks with fewer competing groups of criteria. Fortunately, the AARP Livability Index recently included a feature that allows users to adjust the weighting of each criterion, which allows the framework to reflect actual conditions more closely. Additionally, as age-friendly environment policy frameworks advocate denser residential environments, the policy movement, especially in the U.S., might be better positioned by targeting younger and more amenity-oriented older adult groups (e.g., younger baby boomers) who may be more willing to age in or relocate to denser urban residential environments (American Planning Association, 2014b; Myers & Gearin, 2001; Myers & Ryu, 2008; William, 2010). In this regard, the policy movement’s initially intended coverage of “older adults at all ages” (AARP Public Policy Institute., 2018a) may be too broad to be effective immediately. Furthermore, to implement policy frameworks more effectively in the U.S., it is imperative for age-friendly environment policymakers and scholars to take into account how and why the older adult populations in some (and possibly many) U.S. metropolitan areas choose “counterintuitive” suburban or rural locations and residential environments (Litwak & Longino, 1987). There is likely to be a multitude of explanations from urban planners, geographers, sociologists, anthropologists, and demographers, among others, ranging from geographic (urban vs. suburban) inequality of education/employment to broad lifestyle preferences (e.g., spacious home and automobile ownership) underpinned by existing infrastructural and technological conditions. This exploratory study therefore calls for further discussions of these various factors and their ramifications within the framework of age-friendly environments to better achieve the ideal of aging in place through this emerging international policy movement in the U.S.
Footnotes
Acknowledgments
The author wishes to thank the anonymous reviewers for their valuable comments.
Declaration of Conflicting Interests
The author(s) declared no potential conflicts of interest with respect to the research, authorship, and/or publication of this article.
Funding
The author(s) received no financial support for the research, authorship, and/or publication of this article.
