
Abstract
Objective:
To determine the association of frailty with out-of-pocket expenses (OOPEs) during the last year of life of Mexican older adults.
Methods:
Cross-sectional secondary analysis of the Mexican Health and Aging Study (MHAS), a representative population-based cohort study. Health care expenses were estimated, and a probit model was used to estimate the probability that older adults had OOPE. A general linear model was applied to explain OOPE magnitudes.
Results:
A total of 55.8% of individuals reported having OOPE with a mean of 3,261 USD. Average OOPE for hospitalization during the last year of life was 7,011.9 USD. Older adults taking their own medical decisions during the last year of life expended less than those who did not.
Conclusion:
No affiliation to health services, frailty, and health decision-making by others increased the probability of OOPE. The magnitude is determined by age, hospitalization, medical visits, affiliation, frailty, and health decision-making by others.
Introduction
Aging is a global phenomenon that impacts almost every aspect of human life (Beard et al., 2016). It is particularly taxing for health care due to older adults’ complex biology, which often results in special needs that are not usually met by conventional health systems (Prince et al., 2015). In particular, this complex biology is usually presented in older adults as frailty, a multifactorial condition that renders the older adult vulnerable to a number of stressors. On the contrary, inadequate (and unprepared) health services lead to additional expenses faced both by the health system and the individual household (Shen & McFeeters, 2006).
Such household expenditure may be divided into prepaid expenses (both public and private insurance) and out-of-pocket expenses (OOPEs; defined as the family’s direct payment to cover a health need). This expense is considered inequitable and unfair, as it could lead families to catastrophic spending and consequent empoverishment. These OOPE account for a fifth of all the money invested in health care among the Organization for Economic Co-operation and Development (OECD) members. Among them, OOPE vary considerably, for example, Norway and India have the lowest and highest OOPE, 14% and 65%, respectively. On the contrary, Mexico is the fifth country with the highest OOPE, representing 41% of the total health expenditure of a given household (OECD, 2019).
The magnitude of the OOPE relies on several factors, including the affiliation with the health services and the fragmentation leading to duplication of financing and provision functions (OECD & The World Bank, 2020). In Mexico, individuals and their beneficiaries who belong to the labor force can access health and social security institutions (e.g., Mexican Social Security Institute, Institute of Social Security and Services of State Workers, Mexican Oil State Company, Minister of Defense and the Navy). In contrast, those who do not have formal employment, are covered by the Ministry of Health. Private health services are available through two alternatives: prepaid health service plans or private services paid at the point of access. The deficiencies present in any of these health services usually force their users to incur into OOPE of variable magnitude.
Noteworthy, Mexico has a population of 126.5 million people, from which about 11.0% (i.e., 13.93 million) are older adults (CONAPO, 2018). From this subgroup, 57.9% have social security, 40.9% Ministry of Health, 2.8% are attended in private health services, and 1.4% receive medical care from another institution. Health subsystems in Mexico appears to have more than 100% of population covered because of double or triple affiliations (OECD & The World Bank, 2020). Around 13% of older persons have no affiliation with public health services providers (National Institute of Geography and Statistics [INEGI], 2019).
Common conditions in older adults, such as dementia or frailty, are associated with higher costs, often OOPE (Cesari et al., 2016a; Moore et al., 2001). Specifically, frailty, a condition present in about 25% of Mexican older individuals (García-Peña et al., 2016) precludes the older adult from responding appropriately to common stressors, eventually leading to an accelerated health decline (Rockwood et al., 1994). Moreover, it has been shown to be related to an increased frequency of adverse outcomes when it fails to be detected on time, as well as tackled with countermeasures decreasing its impact (Apóstolo et al., 2018; Cesari et al., 2016b; Stillman et al., 2021). However, frailty is a relatively new concept, barely incorporated into current daily care, especially in settings with a limited number of specialized professionals in geriatric care (Gutierrez-Robledo, 2002; Walston et al., 2019). According to a recent review on the matter of the impact of social factors onto frailty, Duppen et al. argue that the social environment influences this condition by at least five different dimensions: social networks, social support, social participation, subjective neighborhood experience, and socioeconomic neighborhood characteristics (Duppen et al., 2019).
Economical factors are not considered a category by itself, but are interspersed along with others, including OOPE. As previously mentioned, frailty is a multidimensional condition with multicausality; therefore, it is not only impacted by biological characteristics, but is deeply shaped by other factors.
As an under-acknowledged condition, frailty can potentially increase care costs for older adults, particularly OOPE (Strulik, 2015). Moreover, the cost of care has been shown to reach its maximal point during the last year of life in older adults (Larsson et al., 2014), during which evidence points to a high prevalence of frailty (Gill et al., 2010). In addition, and in particular in Mexican older adults, care for severe diseases such as cancer, heart disease, and diabetes (present in 17.4, 24.4, and 39%, respectively, of people above 59 years) further contributes to this increase in OOPE (IHME, 2020). Finally, our group previously reported that in Mexican older adults who died from cancer, heart disease, or diabetes; the probability of a higher OOPE increases (Salinas-Escudero et al., 2019).
Therefore, we hypothesize that both frailty and health care costs in the last year of life will result in higher OOPE. Along the same lines, we intend to determine the association of frailty levels with OOPE during this period of Mexican older adults compared to other common factors also associated with higher OOPE.
Material and Methods
Design and Sample
This is a cross-sectional, secondary analysis of the Mexican Health and Aging Study (MHAS). Mexico is divided into 32 states and a capital city; the sample of MHAS is representative of these entities. Complete information regarding this study is available elsewhere (Wong et al., 2014, 2017). Briefly, MHAS comprises a cohort of 50 years or older Mexican individuals (and their spouses, regardless of age), with a population-based sample. It is currently constituted by five assessments conducted over the past two decades, from 2001 until 2018. It has a set of questionnaires with thorough information from social and health topics, with subsamples containing anthropometric measurements, physical performance tests, and biomarkers. Since 2003, assessments include data from those who died at follow-up and gathered from next-of-kin (Wong, 2017). In particular, this data set contains information about the last year of life of the deceased individual, with similar questionnaires to that of regular interviews. For this work, next-of-kin data from 2012 were analyzed. Participants aged 50 years or older who had died between 2001 and 2012, with next-of-kin information available in the 2012 data set were included.
Frailty Index
Frailty was measured with the frailty index (FI), composed of 30 items. The FI was integrated following a standardized procedure (Searle et al., 2008), including the transformation of each variable into a score of 0 to 1. These, in turn, were added and divided by the total number of variables included in the current list for each participant, with total scores for the FI ranging from 0 (absence of frailty) to 1 (highest potential frailty). Variables (also known as deficits) included in this FI were from multiple domains: self-rated health, chronic diseases, late-life depressive symptoms, and health complaints/manifestations. Details on its construction and validation are available elsewhere (Pérez-Zepeda et al., 2017).
OOPEs
The OOPE were calculated from the sum of the reported expenses from visits to a general physician (medical visits), hospitalizations (at least one overnight stay), and medications (see Supplementary Table 1). For the first two, MHAS captures the total annual expenditure amounts. In contrast, medications were asked as a monthly amount used in medicine. These were further multiplied by 12 to analyze data on a yearly basis. As the information on OOPE was gathered between 2003 and 2012, and since all values are presented in November 2019 prices (INEGI, 2019); an adjustment for inflation according to the deceased year of the individual (INEGI, 2003–2012) was included. The OOPE are reported in U.S. dollars corresponding to the December 2019 exchange rate (18.8 MXN =1 USD) (Banxico, 2019).
Health Services Affiliation
Affiliation to health services was considered to be present whenever access to the Mexican Social Security Institute, Institute of Social Security and Services of State Workers, Mexican Oil State Company, Minister of Defense and the Navy or the Seguro Popular, was reported. People without access to the aforementioned health services along with users of private health care services were considered without affiliation.
Cause of Death
The five causes of death included in MHAS were analyzed: accident/violence, cancer, diabetes mellitus (DM) complications, stroke, and heart disease. For those cases without a specific cause, the category “other” was used.
Health-Related Decision-Making
Information about who made these decisions for the deceased during the last year was included. The question was formulated as follows: “In the last year of life of your relative, when important decisions were to be made such as medical treatment, who had the greatest influence when taking such a decision?” Options offered to answer this question were: the deceased, spouse, siblings, or other people. This answer was further binarized into siblings and other people.
Statistical Analysis
Modeling health care expenses has challenges usually related to the distribution of the dependent variable. In our analyses, health care expenses displayed skewness with a long right tail, and the distribution had a substantial point mass at zero. Therefore, we used the following approach to address these results:
First, the fraction observation with zero expenses was controlled through a probit model. We modeled the probability that older adults had health care expenses (1) or not (0) and covered the goal of identifying the determinants of OOPE. Tests of goodness of adjustment and inflation of the variance were performed to assess this model. Finally, the variables’ marginal effect was estimated.
Second, a general linear model (GLM) was applied whenever the OOPE > 0 (i.e., only for those having OOPE). To identify the family of the model, a modified Park test was used, according to Manning and Mullahy (2001). The GLM model allows for identifying the variables that change the magnitude of the expenditure of the individual. It provides the added cost to the reference category (i.e., the mean of any given variable). The specification test was close to two coefficients that supported the use of gamma distribution. Besides, the values corresponding to the reference categories were also estimated with the GLM model. In both models, those variables that could have biological plausibility but did not show a statistically significant relationship were not included. The decision was taken to present the direct effect of the variable not adjusted by other nonsignificant variables.
Statistical analyses were performed with the software STATA 14 statistical package and tables with additional estimates in the Microsoft Excel 2010 program.
Results
General Description
Data were from 2,672 older adults, having a mean age of 77.3 years (±standard deviation [SD] 11; minimum 50 years; maximum 110 years), and a 51.3% (n = 1,370) prevalence of men (Table 1). A total of 55.8% (n = 1,492) individuals reported having OOPE with a mean of 5,840.8 USD (±SD 17,274.2). Medications represented the highest source of OOPE amount, 4,562.0 USD (±SD 16,388.9).
General Description Stratified OOPE, Subjects With OOPE Were Further Stratified Into Frailty Levels.
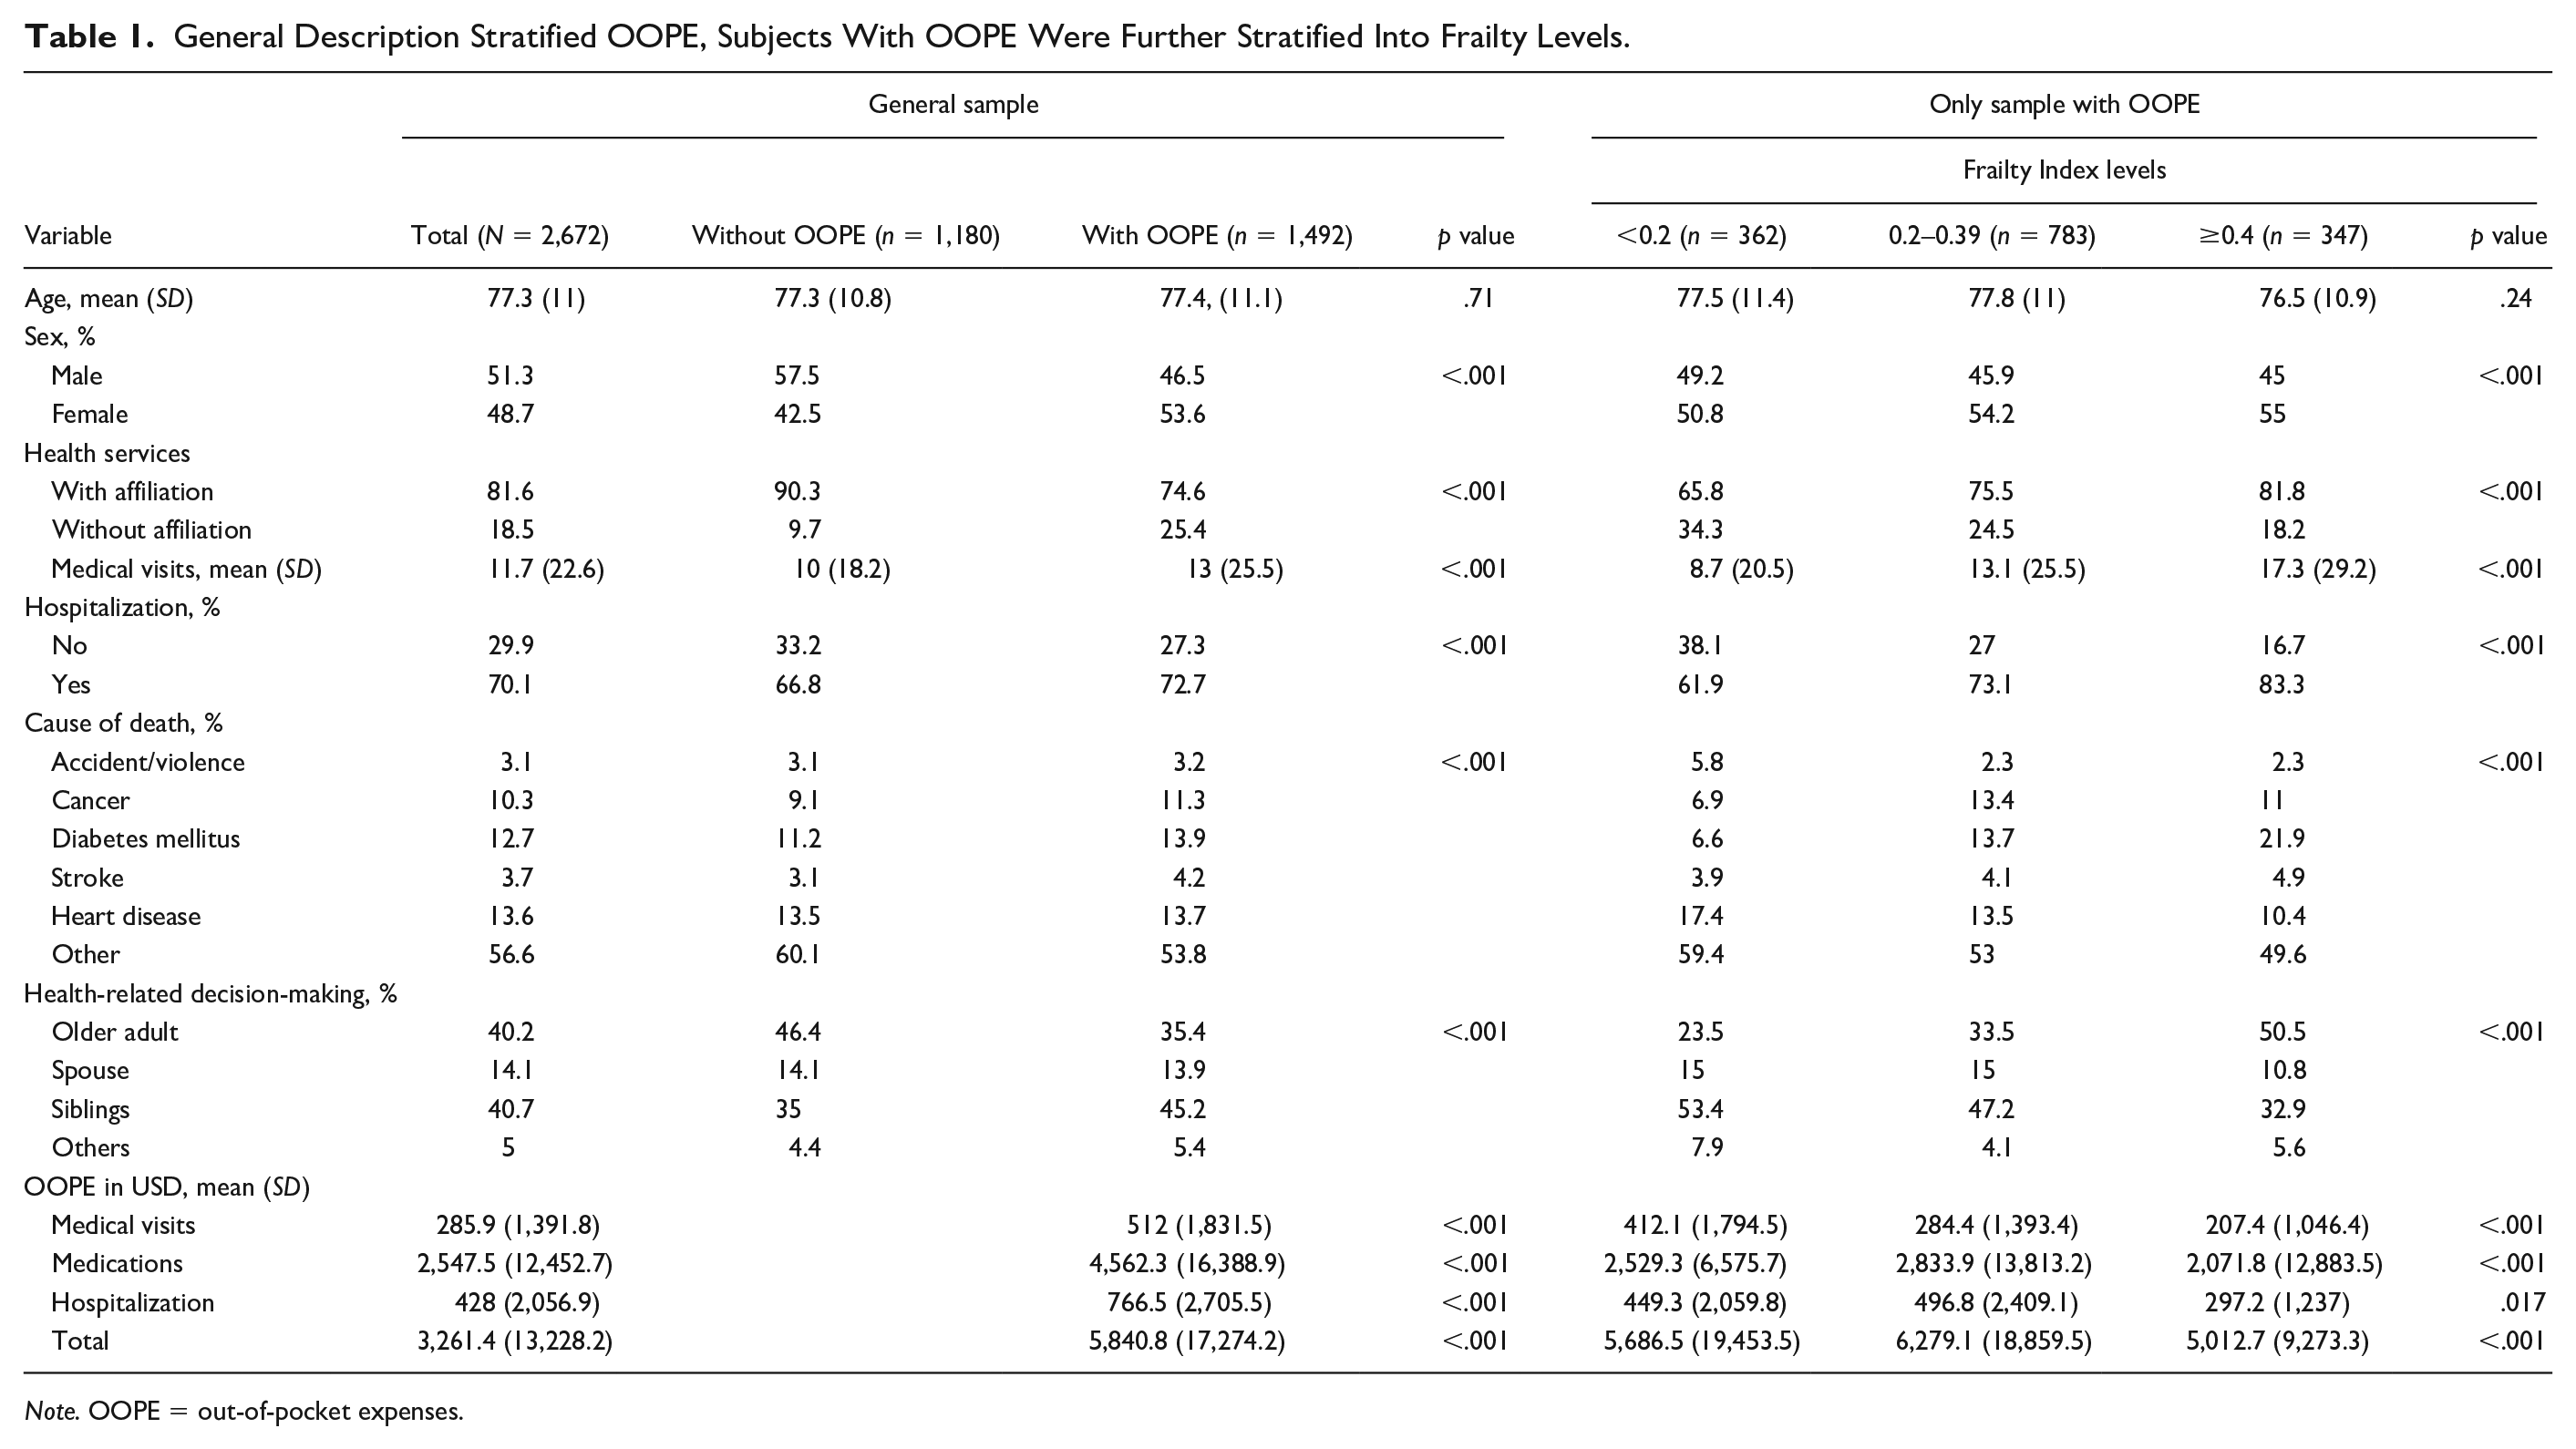
Note. OOPE = out-of-pocket expenses.
The mean FI was 0.27 (±SD 0.13) for the whole sample, being significantly higher in those with more relevant OOPE (0.29 vs. 0.24, p < .001). Those older adults with an FI 0.2 to 0.39 had the highest OOPE (mean of 6,279.1 USD, ±SD 18,859.5), a significant difference when compared to the other two groups (p < .001). Please refer to Table 1 for the complete description of the sample, according to OOPE status and frailty levels (see the second part of Table 1).
Probit Model (Having or Not OOPE)
As shown in Table 2, if the older adult had no health service affiliation, there was a 28.6% increase in the probability of having OOPE. Regarding specific expenses, each additional medical visit increased the likelihood of having OOPE by 0.1%. Also, there was a 7.7% reduction in the probability of having OOPE when the older adult made his or her own health-related decisions.
Marginal Effect Of Probit Model of Out-of-Pocket Expenses, Full Sample (n = 2,672).
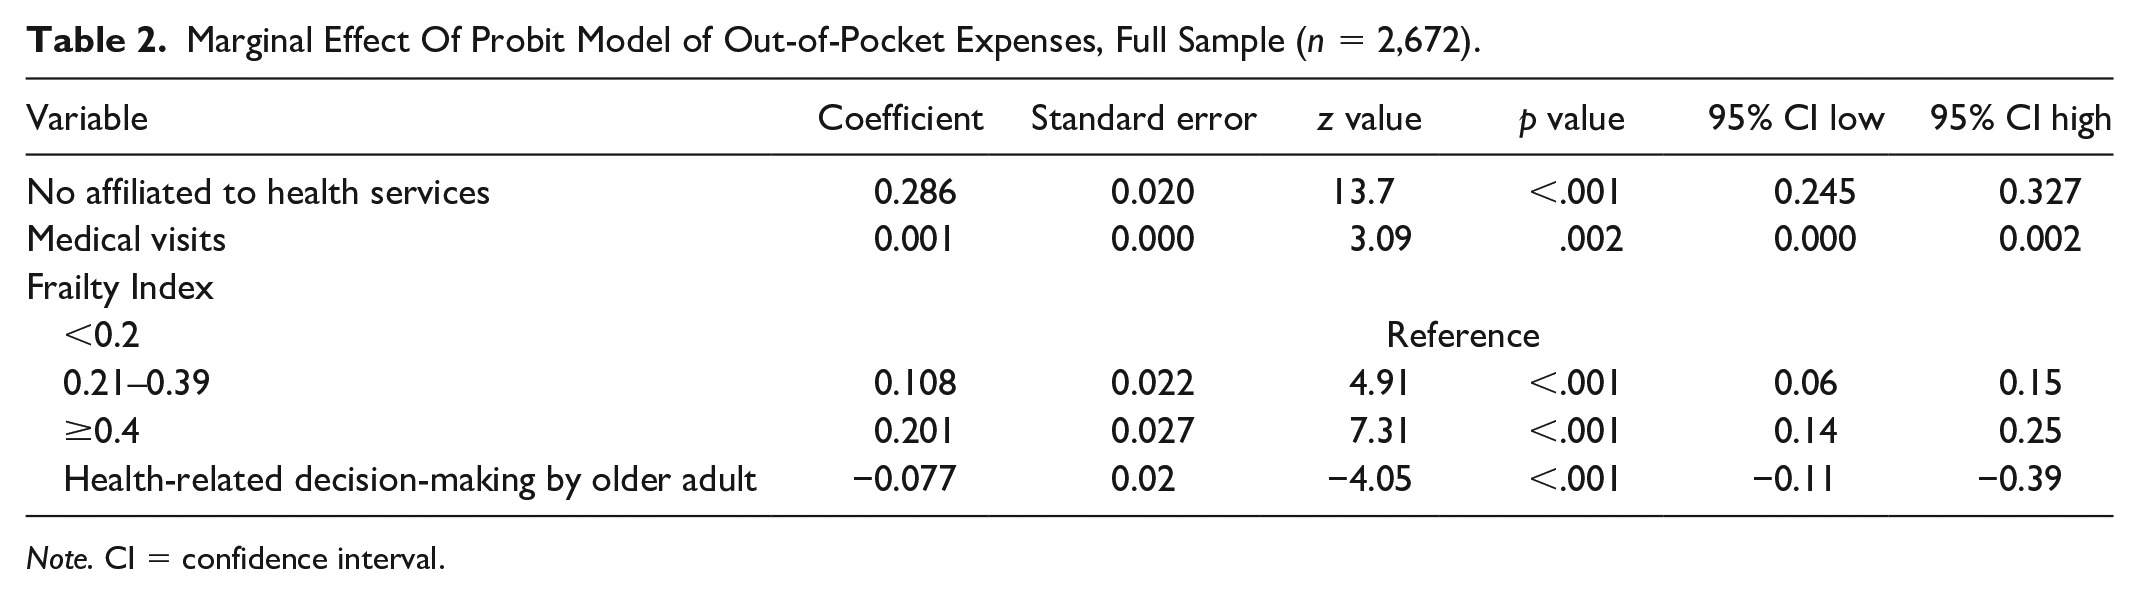
Note. CI = confidence interval.
The FI also modified the probability of having OOPE. Compared to the lowest FI levels (i.e., ≤0.2), those having a FI between 0.21 and 0.39 had a 10.8% increase in the probability of having OOPE. Likewise, individuals with FI ≥0.4 had 20.1% higher likelihood of having OOPE (Table 2). Regarding the characteristics of the full probit model, it had a goodness-of-fit for the null model (p value < .001) and an area under the curve of 66% with values of less than two for the inflation variance test.
GLM (Magnitude of the OOPE)
The full description is available in Tables 3 and 4; accordingly, Table 3 presents the USD values for each reference category excluding those without expenses, and Table 4 reports the incremental values of the rest of the categories concerning the reference category including those without expenses. The value of the reference category in USD (Table 3) was added to the corresponding incremental value (Table 4) to obtain the final average value for the rest of the USD categories.
General Linear Model of the Magnitude of Out-of-Pocket Expenses (Values of the Reference Category, USD), Excluding Those Without Expenses (n = 1,492).

Note. CI = confidence interval.
General Linear Model of the Magnitude of Out-of-Pocket Expenses (Incremental, USD), Including Those Without Expenses (n = 1,492).
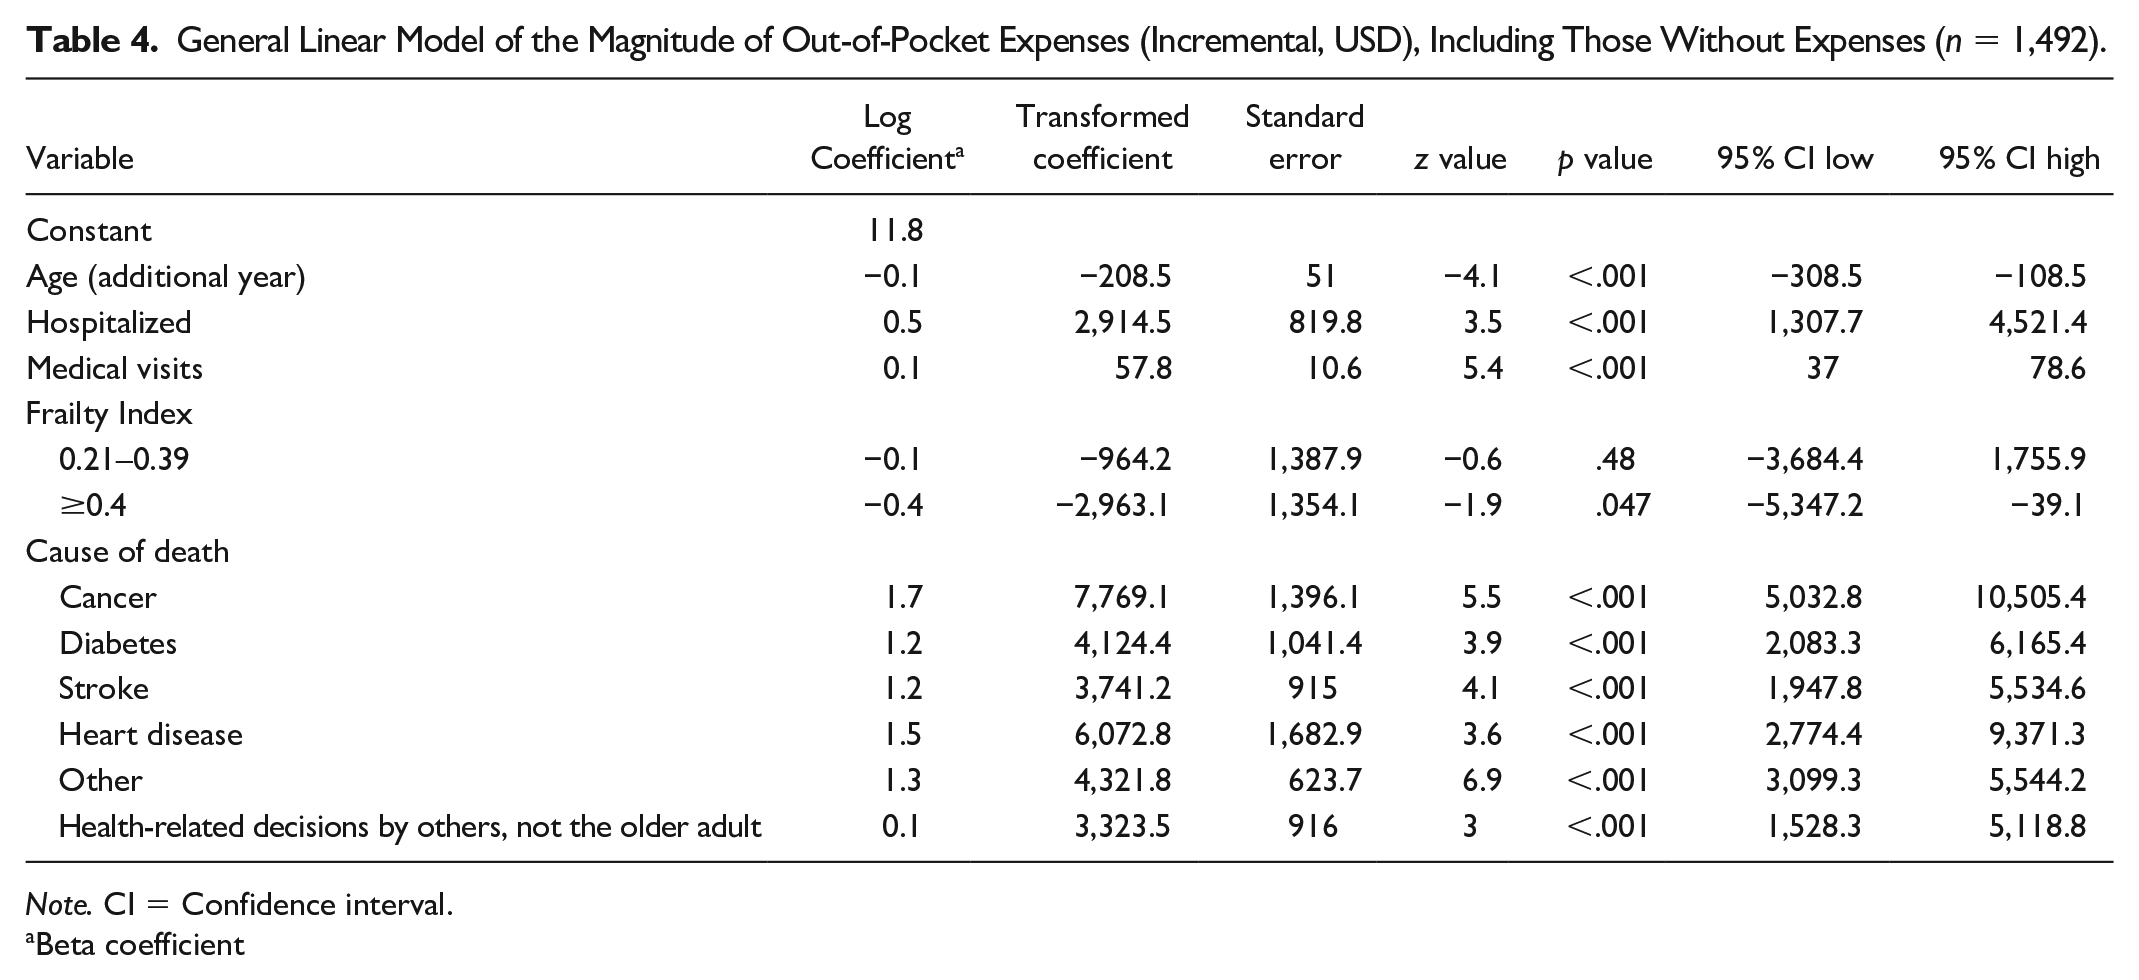
Note. CI = Confidence interval.
Beta coefficient
Regarding hospitalization, older adults not hospitalized during their last year of life had an average OOPE of 4,097.4 USD (±SD 650.5) (Table 3), while for those requiring hospitalization, the final average was 7,011.9 USD (±SD 618.0). The number of medical visits had a direct effect on the magnitude of the expenditure at 57.8 USD (±SD 10.6) for each additional visit (Table 4), for those individuals with only one visit at 47.8 USD (±SD 6.4) (Table 3).
Regarding death cause, the category with the lowest OOPE was accident/violence (mean 1,545.0 USD, ±SD 217.5) (Table 3). It can be stated that the causes of death with higher OOPE were heart disease and cancer with average expenses of 7,618.1 USD (±SD 1,662.1) and 9,314.3 USD (±SD 1,391.9), respectively.
According to health-related decision-making, if the older adult had more influence on the decision, the OOPE was 4,958.6 USD (±SD 463.0) (Table 3). In contrast, when another person influenced such decisions, the final average was 8,282.1 USD (±SD 990.7).
Age had an inverse effect on OOPE: for each additional year of life, expenses decreased by 208.5 USD (±SD 51.0) compared to the reference value of USD 13,893.6 (±SD 2,685.2) (Table 3).
An inverse relationship was also found with FI levels. The average expenditure for those individuals in the lowest FI levels (≤0.2) was USD 7,539 (±SD 1,340.4) (Table 3), while those with an FI between 0.21 and 0.39 had a final average expenditure of 6,574.8 USD (±SD 680.4). The final average OOPE, this is the sum of values in Table 3 and 4, for FI levels 0.4 and more were 4,575.9 USD (±SD 435.9). However, it is worth mentioning that the difference between lower and intermediate levels of the FI had only a trend to significance; the rest of the levels had a statistically significant difference. Further details on the GLM are found in Tables 3 and 4.
Discussion
To the best of our knowledge, this is the first work reporting the association of frailty and OOPE in older adults’ last year of life. According to the model that includes the total sample, the probability of incurring OOPE in older adults is directly related to FI level; the higher the FI level, the greater the probability of OOPE.
From the GLM model, we found an interesting phenomenon. Among older adults who reported OOPE, it appears an inverse relationship exists between the magnitude of the expense and FI level. This can be translated into fewer expenses in those older adults with the worst level of FI and can be explained by two facts: first, this group may be less willing to spend much money due to a significant deterioration in their health and, with much certainty, their socioeconomic level. Second, the affiliation status to health services is higher in those with higher levels of frailty, so that the health system could have covered the expenses of these subjects. However, we must acknowledge that this is just speculation since there is no clear evidence that those in most need receive more resources than those with better health status.
Our results could also be interpreted as a potential consequence of prejudice (i.e., possibly ageism), as suggested by the fact that both higher age and frailty levels were associated with lower OOPE. This phenomenon was observed in the COVID-19 pandemic, where older and frailest adults were those with the worst outcomes and were commonly excluded from critical care by guidelines worldwide (Cesari & Proietti, 2020; Emanuel et al., 2020). There is a long-standing approach in health care where decisions on who merits health services are age-driven instead of taking into account more recent geriatric paradigms focused on function and biology-centered observations (Pilotto et al., 2017). Besides, pressure and lobbying from pharmaceutical companies could increase the costs of medicines more than expected, leaving the health system no other option than to ask the family to incur in extra expenses for often unnecessary (if not detrimental) pharmacological treatments. Along the same lines, these results could point to a lack of knowledge regarding possible interventions aimed to improve the health status of older adults (i.e., physical therapy, physical activity, social interventions, lifestyle behaviors changes etc.). It is evident that therapeutic recommendations included in traditional guidelines are frequently not tailored for older adults but rather written to provide indications to younger individuals (who find an easier application of evidence-based medicine).
In addition, there is an evident lack of geriatricians in Mexico. Only 669 geriatricians are certified by the Geriatrics Mexican Council. Strictly speaking, each geriatrician should provide care to 20,830 older adults if we were to cover the whole population (CONAMEGER, 2020). This figure exceeds the WHO’s recommendation (435 patients per doctor or nurse) by 24 times (Organización Mundial de la Salud [WHO], 2020). Moreover, 95% of all Mexican geriatricians practice within the main cities, where only 48.4% of the total older adults are located (CONAMEGER, 2020). It being so, it is safe to assume that the WHO’s proposed ratio will not be achieved any time soon. However, modifying the medicine and nursing education programs to strengthen the skills related to the older adults’ attention at the primary care level can be a feasible option, potentially allowing to follow a larger number of older adults, regardless of their living arrangements.
Noteworthy, there is an utmost importance of the decision-maker—especially within the family—regarding a person’s health issues. Accordingly, the evidence shows heterogeneity on this issue. For example, in Europe, individuals tend to make their own decisions, while in Asia, older adults’ health decisions are often made by family members (Zager & Yancy, 2011). In Mexico, there is little information in this regard, but it has been documented that older adults’ monetary contribution enhances their participation in household decisions and health-related decisions, including their own health issues (Carrillo-Hernández & Vázquez-Garnica, 2014; Reyes-Beaman et al., 2004). Furthermore, according to our results, not taking care of one’s medical decisions may increase OOPE up to 2,653.9 USD.
According to the OECD, in Mexico, 63% of OOPE are used to acquire medical devices and medicines; while 13% of this expenditure is allocated to medical visits and 14% to hospitalizations. Such a distribution places the country in second place in lack of financial protection among OECD members (OECD 2019). With a per capita income of 10,159 U.S. dollars, Mexico allocates 5.5% of its gross domestic product to health, representing approximately 581.0 U.S. dollars per year (Banxico, 2019; INEGI, 2019). Data from the ENSANUT household survey of 2012 revealed that 35.6% of public health services users did not obtain all of their needed medications in the facility that they visited due to lack of supply and this could be one of the reasons of the high OOPE applied to medicines.
Given the unlikelihood of Mexico reaching universal health coverage in the near future, government financial support should cover some of the health needs of older persons. This is, for example, the case of the Wellness program for older adults, reformed in 2019 by the Mexican federal government, which offers a permanent monthly noncontributory pension to adults 68 years or older (Gobernación, 2019). Currently, the program covers 7,480,998 older adults, which represent 99% of the country’s indigenous communities (Instituto Nacional de los Pueblos Indigenas [INPI], 2015) but are only 53.7% of all the population 60 years and older (CONAPO, 2019). Along these lines, frailty levels in older adults should be taken into account while crafting health-related policies: while the ideal scenario would entail replacing the reductionist chronic-disease paradigm with a more holistic approach, a health care system that accounts for frailty in older adults would certainly delve upon the management and care of this segment.
It also should be mentioned that there are several reasons for older adults to indicate they have not been incurred in OOPE during a given period. First, it may be that they simply did not have health problems during the assessed period or did not seek medical attention at all. On the contrary, it is possible that they have sought attention but have not received it. Finally, there are others who received medical care without having to incur in OOPE thanks to social security or private insurance. In this regard, the 2018 Mexican National Survey on Household Income and Expenditure (available at https://www.inegi.org.mx/programas/enigh/nc/2018/) indicated that 42.9% of older adults did not present health problems in the last year that prevented them from performing their daily activities, 11.1% had health problems but did not seek medical attention, 0.2% sought medical attention but did not receive it, 25.6% received medical attention but did not pay for it, and finally, 20.2% paid for their medical expenses (i.e., OOPE). Curiously enough, among those who did not seek medical attention, there were still some expenses: 60.6% self-prescribed medications, 37.2% considered this unnecessary, and 5.3% even reported economic issues.
As previously stated, this is the first report on frailty and OOPE, an effort aimed at filling the knowledge gap on this topic. Further research will certainly be needed to confirm and extend our findings to different populations and health systems. Cross-cultural comparisons will probably provide important information on how phenomena are shaped by idiosyncratic factors.
It could be argued that one of our limitations is the way we measured frailty because there are in place several controversies around how to measure it (Abellan van Kan et al., 2010). However, since considerable work on MHAS uses the FI, including a previously validated FI, gathered from next-of-kin data, we used this approach (Pérez-Zepeda et al., 2017). Also, FI has been used previously in health care costs studies (Cesari et al., 2016a; Strulik, 2015). Further discussion on this matter would be out of the scope of our work. However, we acknowledge that the assessment of frailty is still in development and merits cautious interpretation of our results.
The potential limitations of this work invite the reader to interpret its results carefully. First of all, the MHAS did not obtain information on all the concepts that should be taken into account to calculate OOPE, such as laboratory and clinical studies, prostheses, equipment or special modifications in the home, transportation, food, accommodations, as well as expenses incurred by hiring caregivers. This translates into an underestimation of the actual OOPE. In addition, only information regarding the last hospitalization of the older person was obtained. To better interpret the present results, it should be considered that the probability of this population being frequently admitted is high. Second, next-of-kin sources could have a high memory bias because many individuals had passed away more than 10 years prior; a common problem presented in epidemiological studies and somehow mitigated by a cognitive screening. A third important limitation is that the Mexican health system has particular issues that would make it unwise for the reader to attempt to extrapolate the results to other populations; instead, we would advise to contrast them only with similar settings (e.g., Latin America, low-and-middle income countries, etc.). Finally, we did not compare expenses to alive older adults with similar age, and other characteristics; however ongoing work will eventually take us down that road.
This study can be compared with information on developing countries, especially from Latin American, where (a) health provision depends mostly on labor conditions and (b) health systems have poor performance. The evidence generated should also favor informed decision-making on public policy.
Conclusion
No affiliation to health services, FI, and health-related decision-making by others increased the probability of OOPE. The magnitude of the expenses is determined by the age, the hospitalization, the medical visits, the affiliation to health services, FI ≥0.4, and health-related decision-making by others.
In brief, it could be stated that the already complex biology of older adults only gets more complicated when it comes to OOPE during the last year of life.
Supplemental Material
sj-pdf-1-jag-10.1177_07334648211024790 – Supplemental material for Last Year of Life, Frailty, and Out-of-Pocket Expenses in Older Adults: A Secondary Analysis of the Mexican Health and Aging Study
Supplemental material, sj-pdf-1-jag-10.1177_07334648211024790 for Last Year of Life, Frailty, and Out-of-Pocket Expenses in Older Adults: A Secondary Analysis of the Mexican Health and Aging Study by Guillermo Salinas-Escudero, María Fernanda Carrillo-Vega, Carmen García-Peña, Silvia Martínez-Valverde, Luis David Jácome-Maldonado, Matteo Cesari and Mario Ulises Pérez-Zepeda in Journal of Applied Gerontology
Footnotes
Author Contributions
All authors gave final approval of the version to be published and agreed to be accountable for all aspects of the work in ensuring that questions related to the accuracy or integrity of any part of the work were appropriately investigated and resolved. Original idea: M.C., M.U.P-.Z. and C.G-.P. Conceptualization: G.S-.E. and M.U.P-.Z. Methodology: M.F.C-.V., C.G-.P., S.M-.V., L.D.J-.M. Validation: G.S-.E., M.F.C-.V., C.G-.P., S.M-.V., L.D.J-.M., M.C., M.U.P-.Z. Formal analysis: G.S-.E., S.M-.V. Data curation: L.D.J-.M. Writing—original draft preparation: L.D.J-.M., G.S-.E., M.U.P-.Z. Writing—review and editing: G.S-.E., M.F.C-.V., C.G-.P., S.M-.V., L.D.J-.M., M.C., M.U.P-.Z. Supervision: M.C.
Declaration of Conflicting Interests
The authors declared no potential conflicts of interest with respect to the research, authorship, and/or publication of this article.
Funding
The authors disclosed receipt of the following financial support for the research, authorship, and/or publication of this article: Publication of this article was supported by a grant from the Secretaría de Ciencia, Ciudad de México CM-SECTEI-041-20 “Red colaborativa de Investigación Traslacional para el Envejecimiento Saludable de la Ciudad de México (RECITES).
Supplemental Material
Supplemental material for this article is available online.
References
Supplementary Material
Please find the following supplemental material available below.
For Open Access articles published under a Creative Commons License, all supplemental material carries the same license as the article it is associated with.
For non-Open Access articles published, all supplemental material carries a non-exclusive license, and permission requests for re-use of supplemental material or any part of supplemental material shall be sent directly to the copyright owner as specified in the copyright notice associated with the article.