
Abstract
As more people die at advanced ages (Land & Yang, 2006), it becomes increasingly important to understand end-of-life (EOL) issues and to promote a high quality of life (QOL) through adequate and appropriate care at the EOL. To address this need, it is helpful to consider the lives of older adults in holistic manner, not limited only to illness, health conditions, disability, or vulnerability at the EOL but by also including other dimensions, such as capacities, daily well-being, and social interactions. The concepts of “total pain” (Saunders, 1964), “good death,” and “dying well” (Carr, 2003) are illustrative of this approach.
Conventional approaches to understanding EOL QOL have often focused on their relationship to diseases, existing conditions, or frailty based on biomedical frameworks (Fried et al., 2001; Lunney et al., 2003). These approaches are useful in developing care and treatment plans for those who are vulnerable and incapacitated. At the same time, however, they may neglect aspects of healthy aging that are also prevalent in this age-group, even in the last stages of life. Recent research suggests an alternative framework and approach that offers a holistic view of older adults’ health and well-being, across multiple health domains. McClintock and colleagues (2016) termed this a comprehensive model of health, applying latent class analysis (LCA) to a large set of variables, including medical, physical, psychological, functional, and sensory measures. They posit that such a comprehensive set of indicators more closely corresponds to the definition of health from the World Health Organization (WHO) than do conventional biomedical indicators (McClintock et al., 2016). Their findings show that this alternative approach predicts mortality better than the conventional, disease-based approaches (McClintock et al., 2016).
Employing this approach with some modifications, this study reevaluates older individuals’ lives in their final year to better understand the process of death and dying with a holistic view, and to examine how this approach may be useful in predicting high quality life and care at the EOL or nearing death. To this point, the comprehensive model of health has been limited to gauging the concepts of health and healthy aging as defined by the WHO, as it does not thoroughly account for psychosocial factors. We aim to extend its usefulness to better address EOL care and well-being.
The aims of this study were twofold. First, we use LCA to examine the patterns or clusters of daily functioning and well-being (including daily activities, symptoms, capacities, and experiences) of older adults during their final year of life. In addition, drawing on the comprehensive model of health (McClintock et al., 2016) and incorporating a multidimensional concept of health and healthy aging that includes psychosocial aspects (Gerlach et al., 2017; Luo & Li, in press), we investigate the relationship between the identified patterns or clusters and the QOL and QOC occurring near the EOL. Such an approach may be useful in helping older adults and healthcare professionals determine their patients’, their loved ones’, and their own odds for achieving a “good death” or “dying well.” The findings may also help those concerned about improving EOL care for older adults by identifying groups of older adults at greater risk. Finally, this study promotes high-quality life and care at the EOL by drawing on the lessons of those who maintain their well-being near and at the end stages of life.
Background
When considering EOL QOL, pain is one of the most common symptoms that patients experience near death. The concept of “total pain,” introduced by Saunders (1964), can be understood as a combination of experiencing physical symptoms, mental distress, social problems, emotional problems, and spiritual problems. A basis of current hospice and palliative care approach was built upon this concept of total pain, understanding pain as multifaceted and individualized concept that could serve as a guideline in managing patients’ pain and providing optimal care to these patients (Al-Shahri et al., 2003; Clark, 1999). Although this concept has been well acknowledged in the field of hospice and palliative care, clinical practice continues to focus primarily on the physical component of pain while overlooking other aspects (Steinhauser et al., 2000). Research also indicates that while hospice and palliative care have improved dramatically in terms of recognizing total pain concerns, patients with different types of health problems (e.g., heart failure) continue to face unmet needs, and, to this point, only limited scientific evidence exists to support the needs of these patients and their caregivers (Cagle et al., 2017). In addition, what is lacking is what total pain means for those community-dwelling older adults who are relatively healthy and independent at the EOL.
Another critical theoretical concept in this study includes a “good death” and “dying well.” According to the Institute of Medicine, a good death was defined as being “free from avoidable distress and suffering for patient, family, and caregivers; in general accord with patients’ and families’ wishes; and reasonably consistent with clinical, cultural, and ethical standards” (Institute of Medicine, 1997, p. 24). Although some research has applied this concept to various groups of people, the majority focuses on patients with terminal illness and severe health conditions (e.g., cancer), thus overlooking those with gradual declines in health or unexpected death living in community (Lloyd et al., 2016).
Recent reviews identify the principal features of good death or even “successful death” based on an assessment of empirical studies (Kehl, 2006; Meier et al., 2016); the three features that patients, family members, and healthcare providers commonly mention include maintaining preferences over the dying process (e.g., a sense of being in control), pain-free status (e.g., being comfortable), and emotional well-being. It is important to recognize, however, that each person’s views, roles, and experiences throughout the life span affect the concept of a good death, as it is highly individualized and can be fluid over time or depending on circumstances (Kehl, 2006).
These concepts of total pain, good death, and dying well share common notions that can be applied to older adults living in their last year of lives: (1) one’s EOL should be approached with a multilayered view, including pain, physical symptoms, psychological needs, and social aspects; (2) EOL experience implicates not only the dying individual but also the person’s family and friends, as well as professionals who provide care for the individual and their loved ones; and, (3) therefore, when developing effective screening tools and adequate interventions for these older adults and their family members, all aspects of their lives needs to be considered (Emanuel & Emanuel, 1998).
There is a need for well-designed studies to examine the deceased’s experiences of dying and the pre-death experiences with careful consideration of the length of time between the interview and the respondent’s death (Meier et al., 2016). Depending on proximity to death and the unique process that one goes through, the person’s wishes, desires, and needs, as well as his or her perceptions of a good death or dying well, may change in important ways (Carr & Moorman, 2009). This may affect care preferences and the person’s needs simultaneously, but individual’s values and beliefs could be also important when the person is nearing death.
Current Study
This study proposes to characterize older Medicare beneficiaries based on their daily functions, activities, symptoms, capacity, and well-being indicators in order to cluster patterns of the last year of these persons, by applying a modified version of the comprehensive model of health (McClintock et al., 2016). It then explores the relationship of these clusters to QOL and QOC at the EOL. Findings will help broaden our understanding of how older persons function before dying and whether there are certain patterns of EOL daily experiences in this older population. These would help us identify groups that may have a better chance of fulfilling their EOL wishes, while also providing insight into the older adults who face a higher risk of poor quality of life and care at the EOL and near death. In addition, this study aims to examine the association of these EOL characteristics in older adults with their QOL and care quality nearing death in order to provide guidance on EOL QOL and to address EOL care needs based on a holistic approach to their actual daily needs. Although there is little previous research that has adapted the modified version of the comprehensive model of health to the study of EOL QOL and QOC, from the existing evidence that applied the concept of healthy aging (Gerlach et al., 2017; Luo & Li, in press), we hypothesize that four groups of older adults will merge: a group of older adults who are healthy and well-functioning, those who experience mild declines but are otherwise relatively well functioning, unhealthy and poor-functioning older adults, and, finally, those who are psychologically, cognitively, or mentally vulnerable. In addition, we expect that EOL QOL and QOC will vary among the identified groups.
Methods
Data and Sample
The sample consists of the first five waves of the National Health and Aging Trends Study (NHATS, 2011–2015), a nationally representative longitudinal study of Medicare beneficiaries started in 2011. A total of 7550 Medicare beneficiaries aged 65 years and older and living in community and residential care settings (excluding nursing homes) completed in-person baseline interviews in 2011. Of this sample, 1329 respondents died during the follow-up period (2012–2015) and whose proxy informants completed questions about the QOL and QOC during the last month of life (LML) for the respondents. The NHATS obtained these proxy data for 95% of respondents who died. Using information from the LML interview, we identified and dropped 204 respondents who stayed in hospitals, hospice, and other places before moving to the place of death, which yield a total of 1125 respondents in the analytic sample. We removed these respondents due to the fact that they may have had systematically more acute medical conditions or may have already been in the last stage of life, and they might thus have been distinct from those living at home or in nursing homes in the final year of life in terms of daily functions, symptoms, capacities, or other health and well-being indicators. In our sample, those who resided in hospitals, hospices, and other places prior to moving to their place of death were younger (p < .01) and were more likely to live alone (p < .001) and less likely to live with others (p < .05) than those living at home or in nursing homes. However, no difference was found with respect to other key demographic, socioeconomic, and health-related factors between these two groups (not shown).
Measures
Health and well-being
We employ seven dimensions of health and well-being, corresponding to the theoretical and empirical definitions of health and well-being in previous research (Engel, 1977; McClintock et al., 2016; Misselbrook, 2014). They include physical symptoms, functional limitations, physical capacity measures, cognitive functioning, mental health, psychological well-being, and social participation, reported by the respondents in their own interviews before death. First, four physical symptoms were assessed using reported problems with (a) chewing or swallowing, (b) speaking, (c) breathing, and (d) pain. Second, functional limitations were assessed with three activities of daily living such as (e) eating, (f) bathing, and (g) toileting. Third, physical capacity was measured with five items that include (h) balance stands, (i) walking, (j) chair stands, (k) grip strength, and (l) peak airflow. Fourth, cognitive functioning was evaluated with three items such as problems with (m) orientation, (n) memory (Ofstedal et al., 2005), and (o) executive function (Royall et al., 1998). Fifth, mental health was assessed with four items, including two depressive symptoms: (p) lack of interest and (q) feeling down/depressed/hopeless, and two anxiety symptoms: (r) nervousness/anxiety and (s) degree of worrying. Sixth, psychological well-being was measured with two positive affect items: (t) cheerful and (u) full of life, and two negative affect items: (v) bored and (w) upset. Seventh, social participation was assessed with three items: (x) attending religious services, (y) participating in clubs, and (z) going out for enjoyment. For all indicators, 0 refers to no problem or better status, while one indicates having a problem or poorer status. All variables were used in developing profiles of health and well-being.
EOL quality of life and care
The deceased respondents’ QOL and QOC in their last month were assessed with multiple domains based on their proxy respondents’ reports. For QOL, we use EOL functional status and symptoms, and for QOC, the measures included overall QOC, quality of healthcare encounters (HEs), and dignified care (DC). We adapted and modified the concept of high-quality care at the EOL examined in previous research (Kricke et al., 2019; Luth & Prigerson, 2018; Teno et al., 2015). Note that we dichotomized all items for QOL and QOC into “positive (=1)” or “not positive (=0),” informed by previous studies analyzing the NHATS data (Sharma et al., 2017; Teno et al., 2015).
Quality of life
First, QOL was measured with two items that determine EOL functional status: whether the deceased (a) was alert (=1) and (b) was able to get out of bed (=1). Second, we used a measure of QOL focusing on three symptoms: pain, trouble breathing, and anxiety or sadness. The deceased was coded 1 for no symptom and 0 for experiencing the symptom.
We also created count variables for these two QOL measures, with EOL functional status ranging from 0 to 2 (by counting “yes” responses to the two items) and EOL symptoms ranging from 0 to 3 (by assessing “no” responses to the three items, which indicates better health). The first variable, EOL functional status, can be considered a measure of “good death,” whereas the second variable, EOL symptoms, can be viewed as an indicator of good care. In addition, we summed these two variables, EOL functional status and EOL symptoms, to create a QOL variable, ranging from 0 (low QOL) to 5 (high QOL). Missing cases were defined with 4 or 5 missing in these five items.
Quality of care
First, we measured the HE domain with four indicators: (a) whether EOL care decision was made with enough input from the deceased or his or her family, (b) whether there was no unwanted care or treatment, (c) whether family members were kept informed about the person’s condition, and (d) whether there was one doctor or clear doctor in charge of care, ranging 0–4. Second, the DC domain was measured with two items: (a) whether their personal care needs were met and (b) whether the deceased was treated with respect, ranging 0–2. Note that for all domains, respondents who received no care nearing death and those with missing values were identified and excluded from the analysis: for HE (a) no care (n = 68) and missing (n = 18), (b) no care (n = 53) and missing (n = 26), (c) no care (n = 54) and missing (n = 5), (d) no care (n = 48) and missing (n = 40); and for DC (a) no care (n = 51) and missing (n = 7), (b) no care (n = 47) and missing (n = 9). In addition, a summary variable of six yes/no items corresponding to the elements of HE and DC was created to measure QOC for those who received care in the LML, ranging from 0 (low QOC) to 6 (high QOC). Missing cases were defined with no responses for five or six of the six items. Last, overall QOC was assessed based on a question posed to proxy respondents asking how they would rate the deceased respondent’s care in the LML with five response options, from poor (0) to excellent (4). We dichotomized responses into “excellent (=1)” or “not excellent (=0).”
Covariates
We included a set of demographic, socioeconomic, and death-related characteristics: age at the last interview before death (in years), sex, race/ethnicity (non-Hispanic whites), education (less than high school vs. high school and more), marital status (married vs. unmarried), living arrangement (living alone vs. living with others), and number of months from the last interview to death (ranging 0–19). In addition, the respondent’s place of death (home, hospital, nursing home, hospice, and other) was included.
Analytic Plan
To group respondents into distinct classes based upon their multiple health and well-being indicators, we performed LCA (Magidson & Vermunt, 2004). Using commonalities among observable variables, LCA postulates an underlying latent structure within the sample that is not directly observable. To assess the fit and parsimony of LC models, we used the likelihood ratio chi-squared statistic (LL), Akaike’s information criterion (AIC), the Bayesian information criterion (BIC), adjusted BIC, and entropy, as well as the p-value obtained from a series of the Vuong–Lo–Mendell–Rubin test. A smaller value of the LL, AIC, BIC, and adjusted BIC indicates a better model fit. In addition, if the value of entropy approaches 1, then this indicates a clear delineation of classes (Celeux & Soromenho, 1996). Another way is the p-value testing by the Vuong–Lo–Mendell–Rubin test; a significant p-value indicates an increase in the explanatory power when adding the number of identified classes. We also carefully consider the proportion of identified classes to ensure parsimony in the LC models.
When the classes have been identified by specifying the patterns of values of selected health and well-being indicators, each respondent is assigned to the most suitable class based upon his or her values for each of these 26 indicators. In addition, the profile of each class as a function of the variables was examined.
Next, to examine the associations between the identified classes and QOL and QOC nearing death, we used two sets of measures as outcomes, QOL and QOC, and performed a series of ANOVA. Depending on the form of each outcome measure, we conducted ordinary least squares or logistic regression models. We used Mplus (version 7.4) for the LCA and STATA 14 for all other analyses. Due to missing values and those who did not receive care nearing death, the number of responses to each outcome item varies from 1037 to 1122 (out of 1125). In addition, three covariates (education, marital status, and the number of months from the last interview to death) were dropped from the final models. This provides a parsimonious model using the maximum number of responses (e.g., 18 missing cases in education and 47 in the number of months from the last interview to death). The results of the regression analysis for the major indicators do not differ with and without these three covariates.
Results
Sample Characteristics
Sample Characteristics by Class (N = 1125).
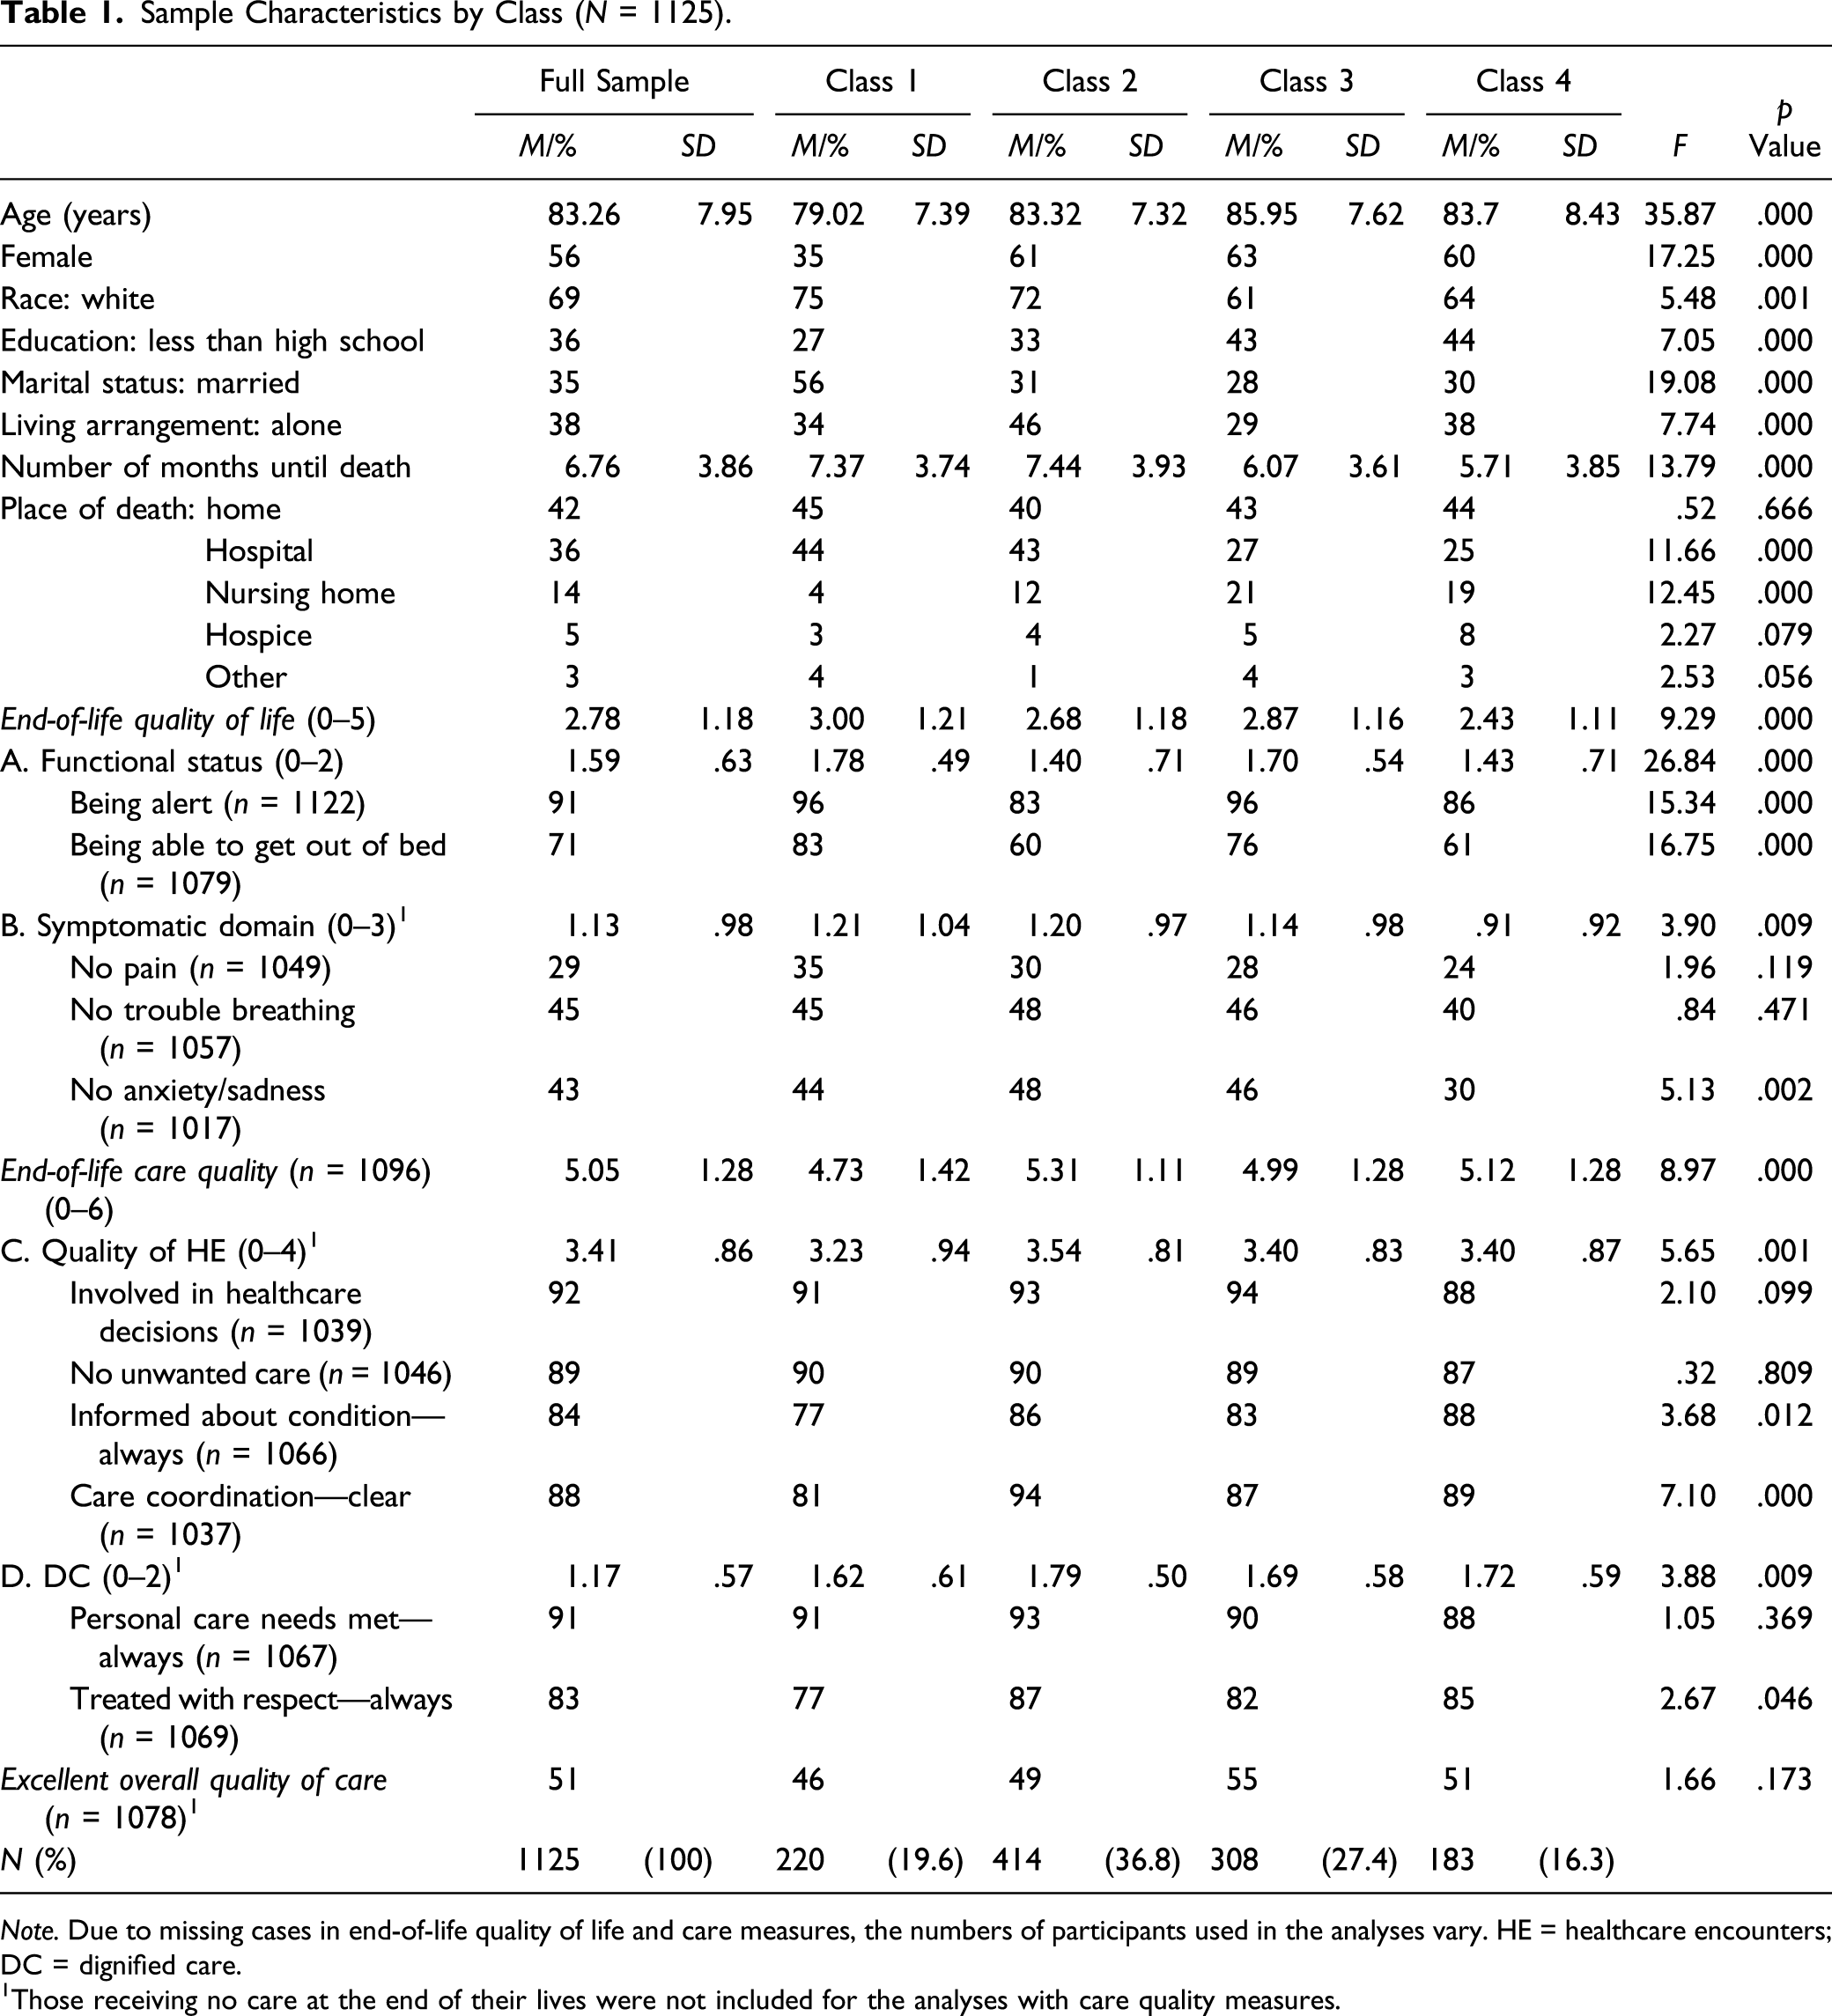
Note. Due to missing cases in end-of-life quality of life and care measures, the numbers of participants used in the analyses vary. HE = healthcare encounters; DC = dignified care.
Those receiving no care at the end of their lives were not included for the analyses with care quality measures.
Latent Classes of Health and Well-Being
Fit Statistics for Latent Class Models from the Sample (N = 1125).
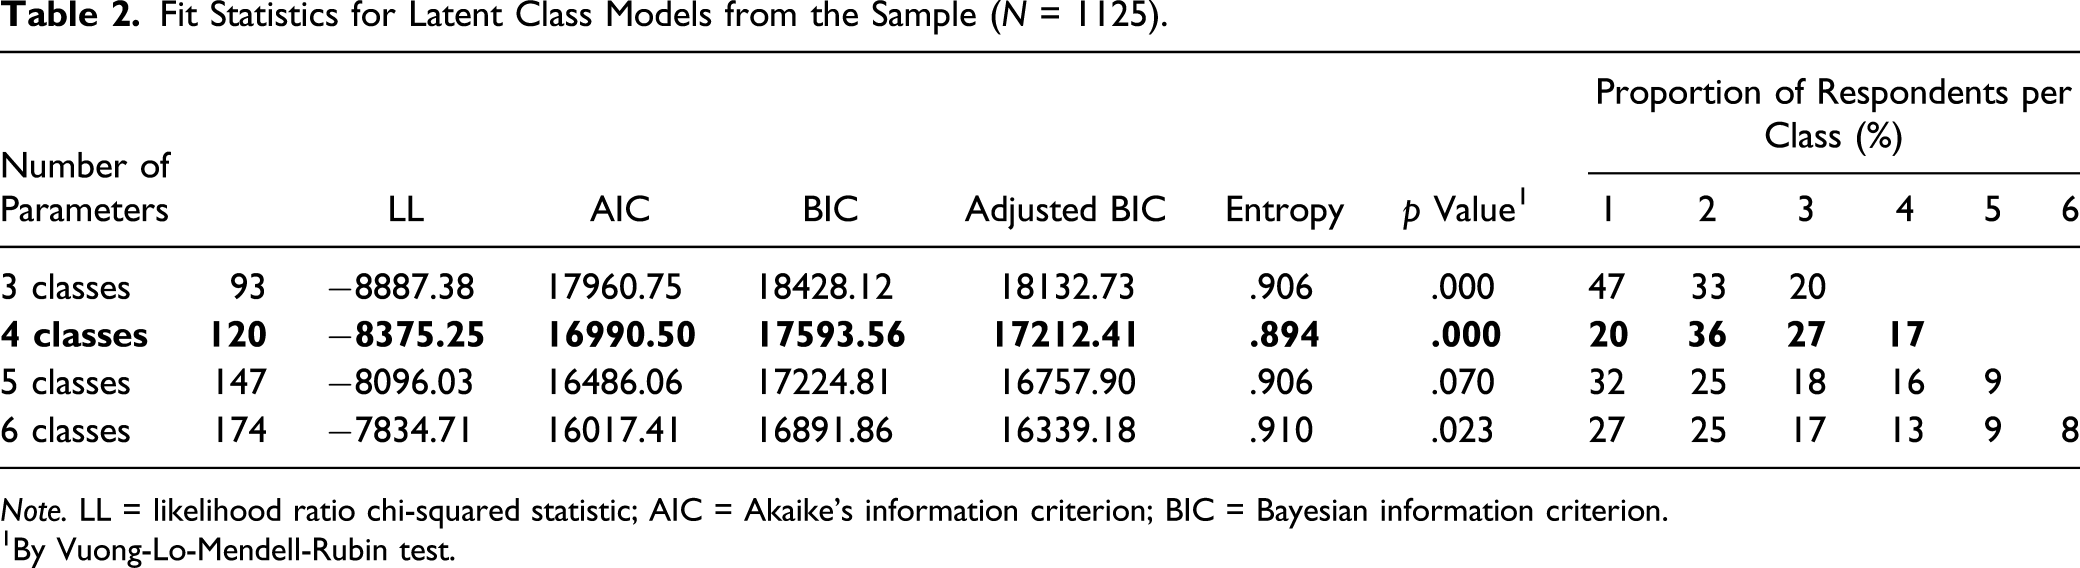
Note. LL = likelihood ratio chi-squared statistic; AIC = Akaike’s information criterion; BIC = Bayesian information criterion.
By Vuong-Lo-Mendell-Rubin test.
Next, we sought to understand health and well-being characteristics that distinguished each class by examining the mean values of the indicators used for each class. Figure 1 shows the indicators for the four classes in the study sample, sorted by the degree of separation among classes. Based upon these characteristics, we named the four classes as follows: Class 1: healthy and happy (20%), Class 2: frail but happy (37%), Class 3: cognitively impaired and moderately distressed (27%), and Class 4: highly impaired and distressed (16%). Differences in mean/standardized values of health/well-being indicators by class (N = 1125) [0 = better and 1 = poor]. Note. PS = physical symptoms, ADL = functional limitations; PC = physical capacity; CF = cognitive functioning; MH = mental health; WB = psychological well-being; SP = social participation.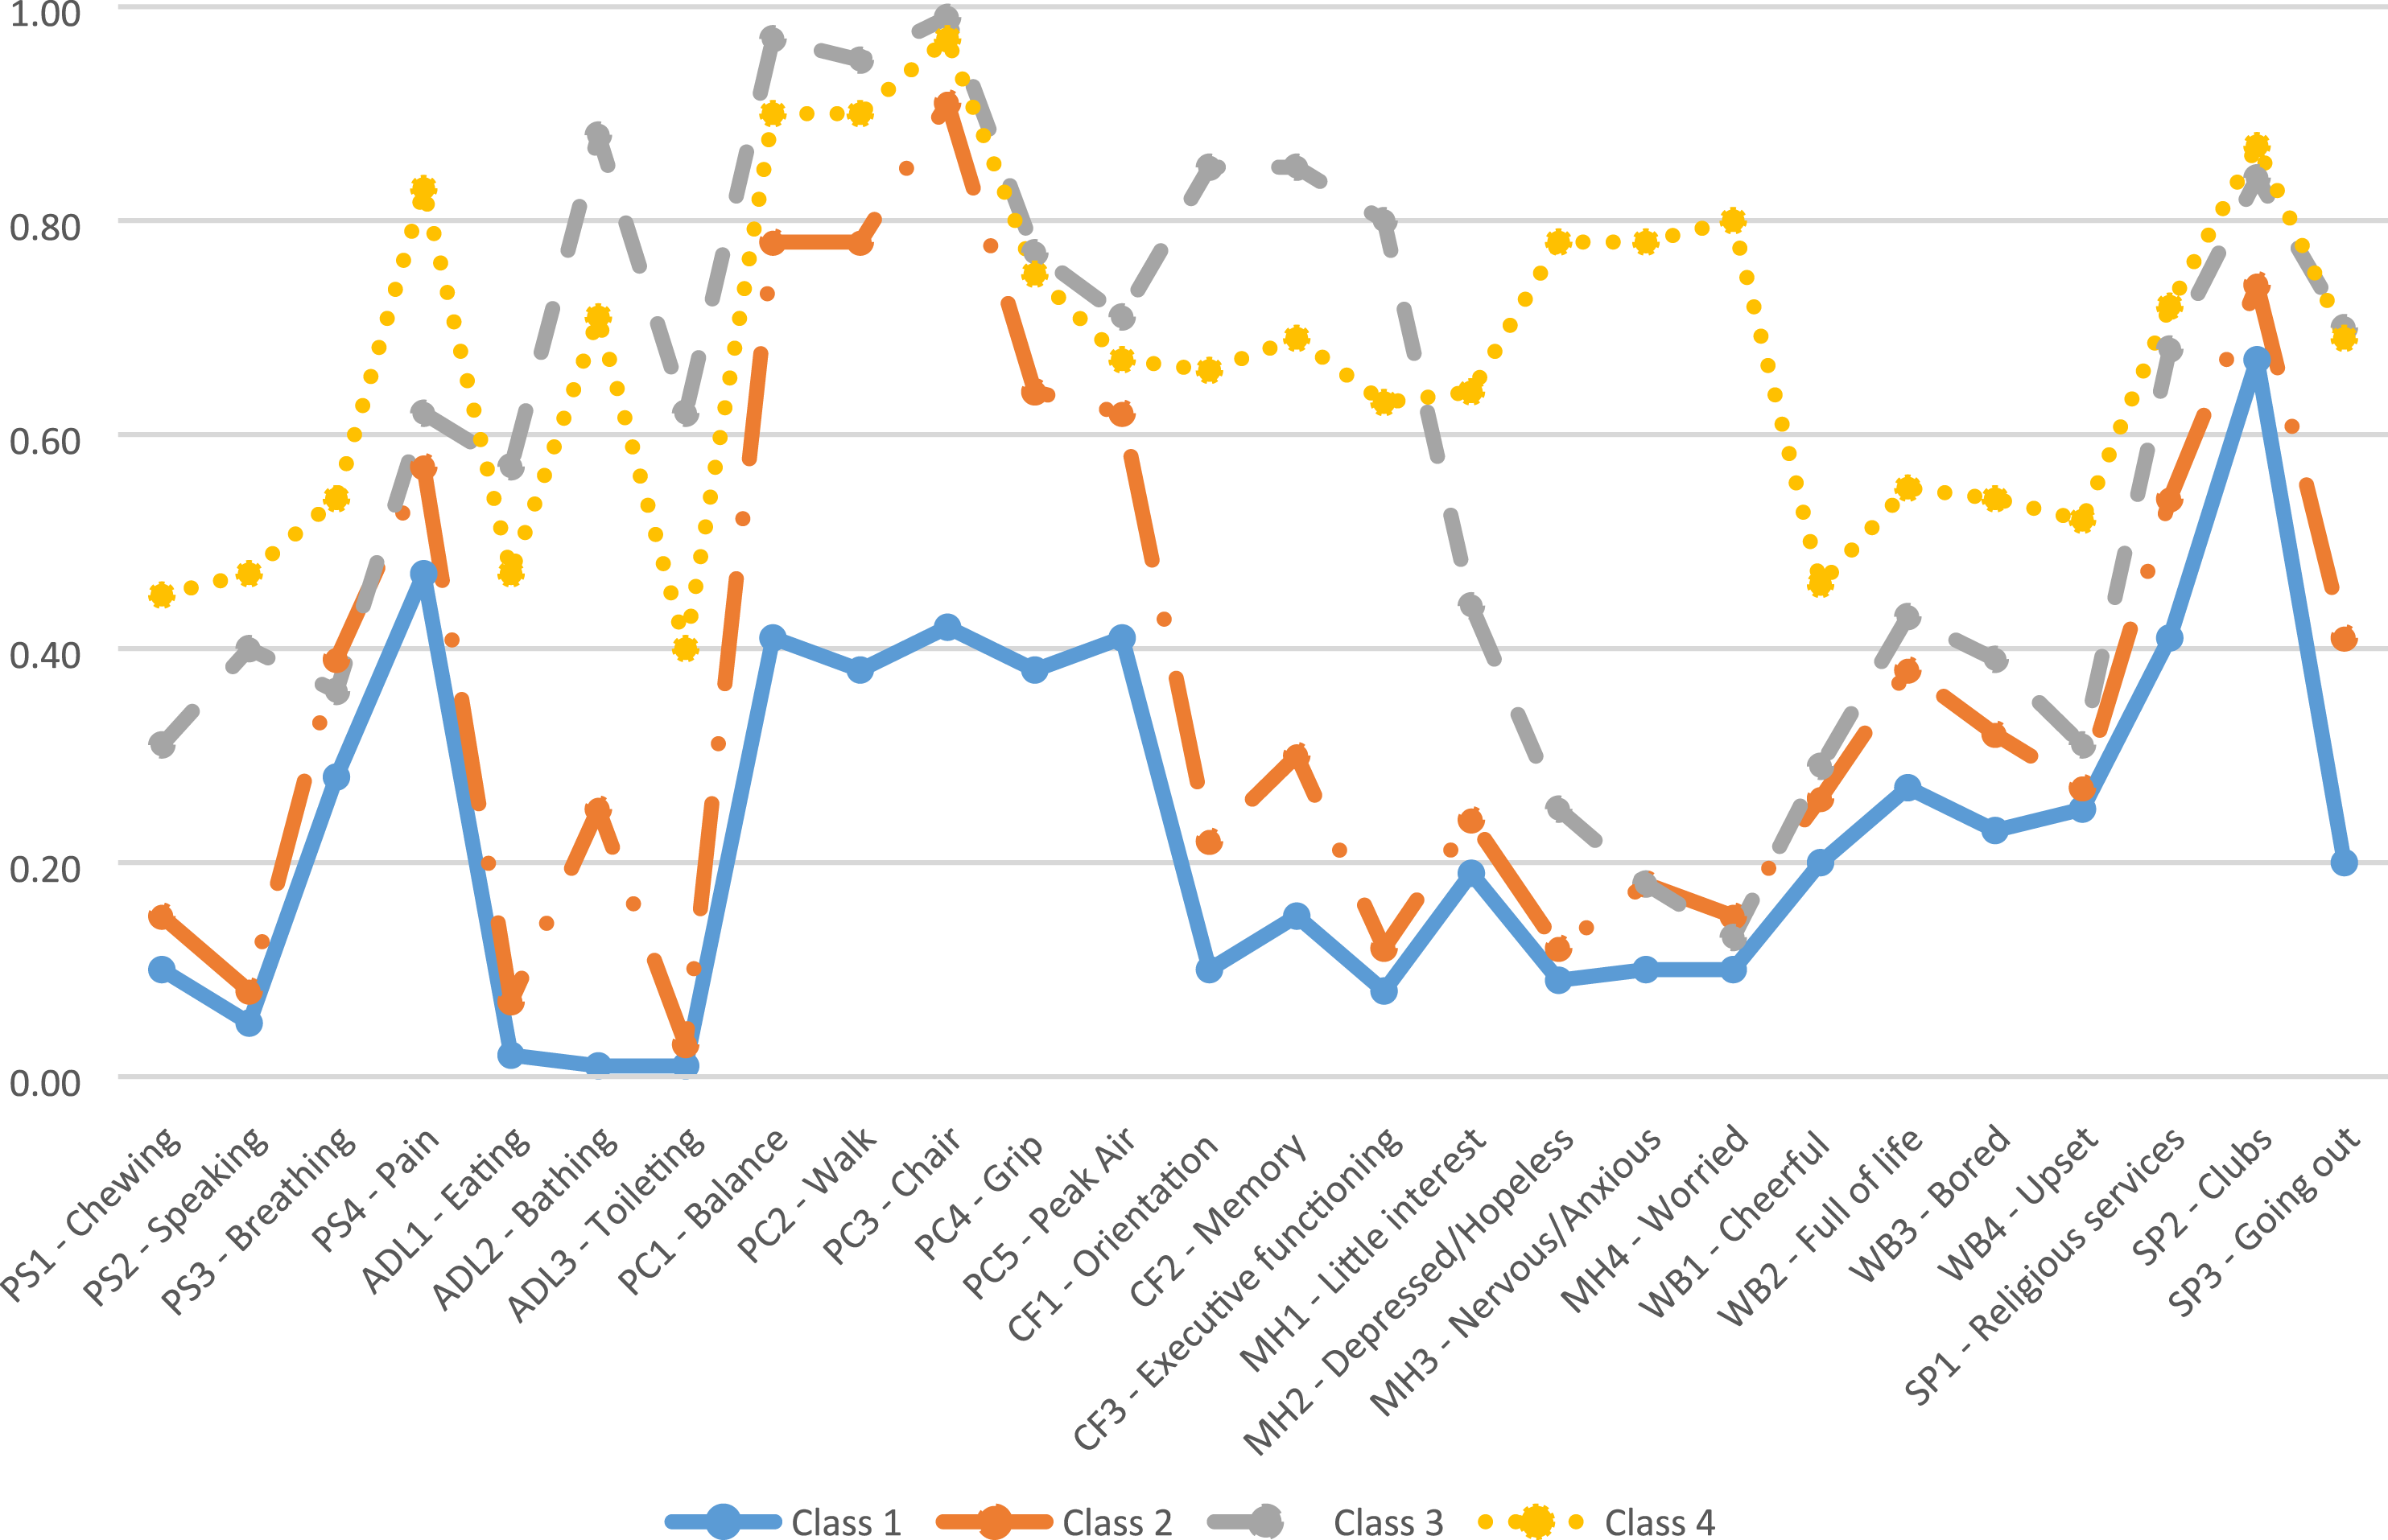
Profile of Classes
Health and well-being indicators
Class 1 (healthy and happy) and Class 2 (frail but happy) showed somewhat similar patterns in most health and well-being indicators, although Class 1 had notably better physical capacity and cognitive functioning, while Class 2 reported more prevalent physical symptoms (e.g., breathing and pain problem) as well as functional limitations (ADL) (e.g., limitation in bathing) than Class 1. Class 4 (highly impaired and distressed) and Class 3 (cognitively impaired and moderately distressed) were characterized by a greater rate of having physical symptoms and ADL limitations, as well as poorer physical capacities than the other two classes (Figure 1 and Supplemental Table A). Class 4, in particular, reported much higher levels of depression and anxiety, poorer well-being, and poorer (or less) social participation than any other class. Class 3 had the highest prevalence of cognitive functioning problems but showed relatively better psychological well-being and lower levels of depression and anxiety than Class 4.
Covariates
Respondents in Class 1 were the youngest (M = 79.02, SD = 7.39) and were more likely to be men (65%) and white (75%). In addition, this class was more likely to be educated (high school degree and more (73%)), and married (56%). About 42% of the sample died at home, and there was no significant difference in this rate across classes (Table 1). Class 2 reported living alone at the highest rate (46% vs. 34%, 29%, and 38%). With respect to key demographic, socioeconomic, and death-related status, Class 3 and Class 4 shared similar characteristics. However, Class 3 was the oldest (M = 85.95, SD = 7.62) and was more likely to be women (63%), nonwhite (39%), less educated (43%), and not married (72%). In addition, those in Class 1 and Class 2 were more likely to die at hospital (44% and 43%, respectively), than those in Class 3 (28%) and Class 4 (25%). Death in nursing homes was more prevalent in Class 3 (22%) and Class 4 (19%) than in Class 2 (12%) and Class 1 (4%).
EOL quality of life and care
First, Class 1 reported the highest EOL QOL summary score (M = 3.00, SD = 1.21), followed by Class 3, Class 2, and Class 4 (Table 1). In terms of two dimensions of EOL QOL, Class 1 showed the highest rate of EOL functional status (96% for being alert and 83% for being able to get out of bed), followed by Class 3 (96% and 76%), Class 4 (86% and 61%), and Class 2 (83% and 60%). On the contrary, Class 4 reported having no EOL symptoms at the lowest rate (24% for no pain, 40% for no trouble breathing, and 30% for no anxiety or sadness), meaning that the highest proportion of individuals in Class 4 suffered from EOL symptoms, which outpaced the other three classes.
In terms of the EOL care quality summary score, Class 1 showed the lowest (M = 4.73, SD = 1.42), meaning that QOC experienced by those in Class 1 was poorer than among those in the other three classes. Class 2 showed the greatest prevalence of reporting high quality care (M = 5.31, SD = 1.11). Taking a closer look at the two domains, HE and DC, Class 2 reported the highest quality care in both (HE: M = 3.54, SD = .81 and DC: M = 1.79, SD = .50), whereas Class 1 reported the lowest QOC (HE: M = 3.23, SD = .94 and DC: M = 1.62, SD = .61). Regarding overall QOC, 51% reported that the overall QOC was excellent, with no significant difference in the proportion reporting excellent overall QOC across the four classes (Table 1).
Association with EOL QOL and QOC
Regression Results—End-of-Life Care Quality by Classes.
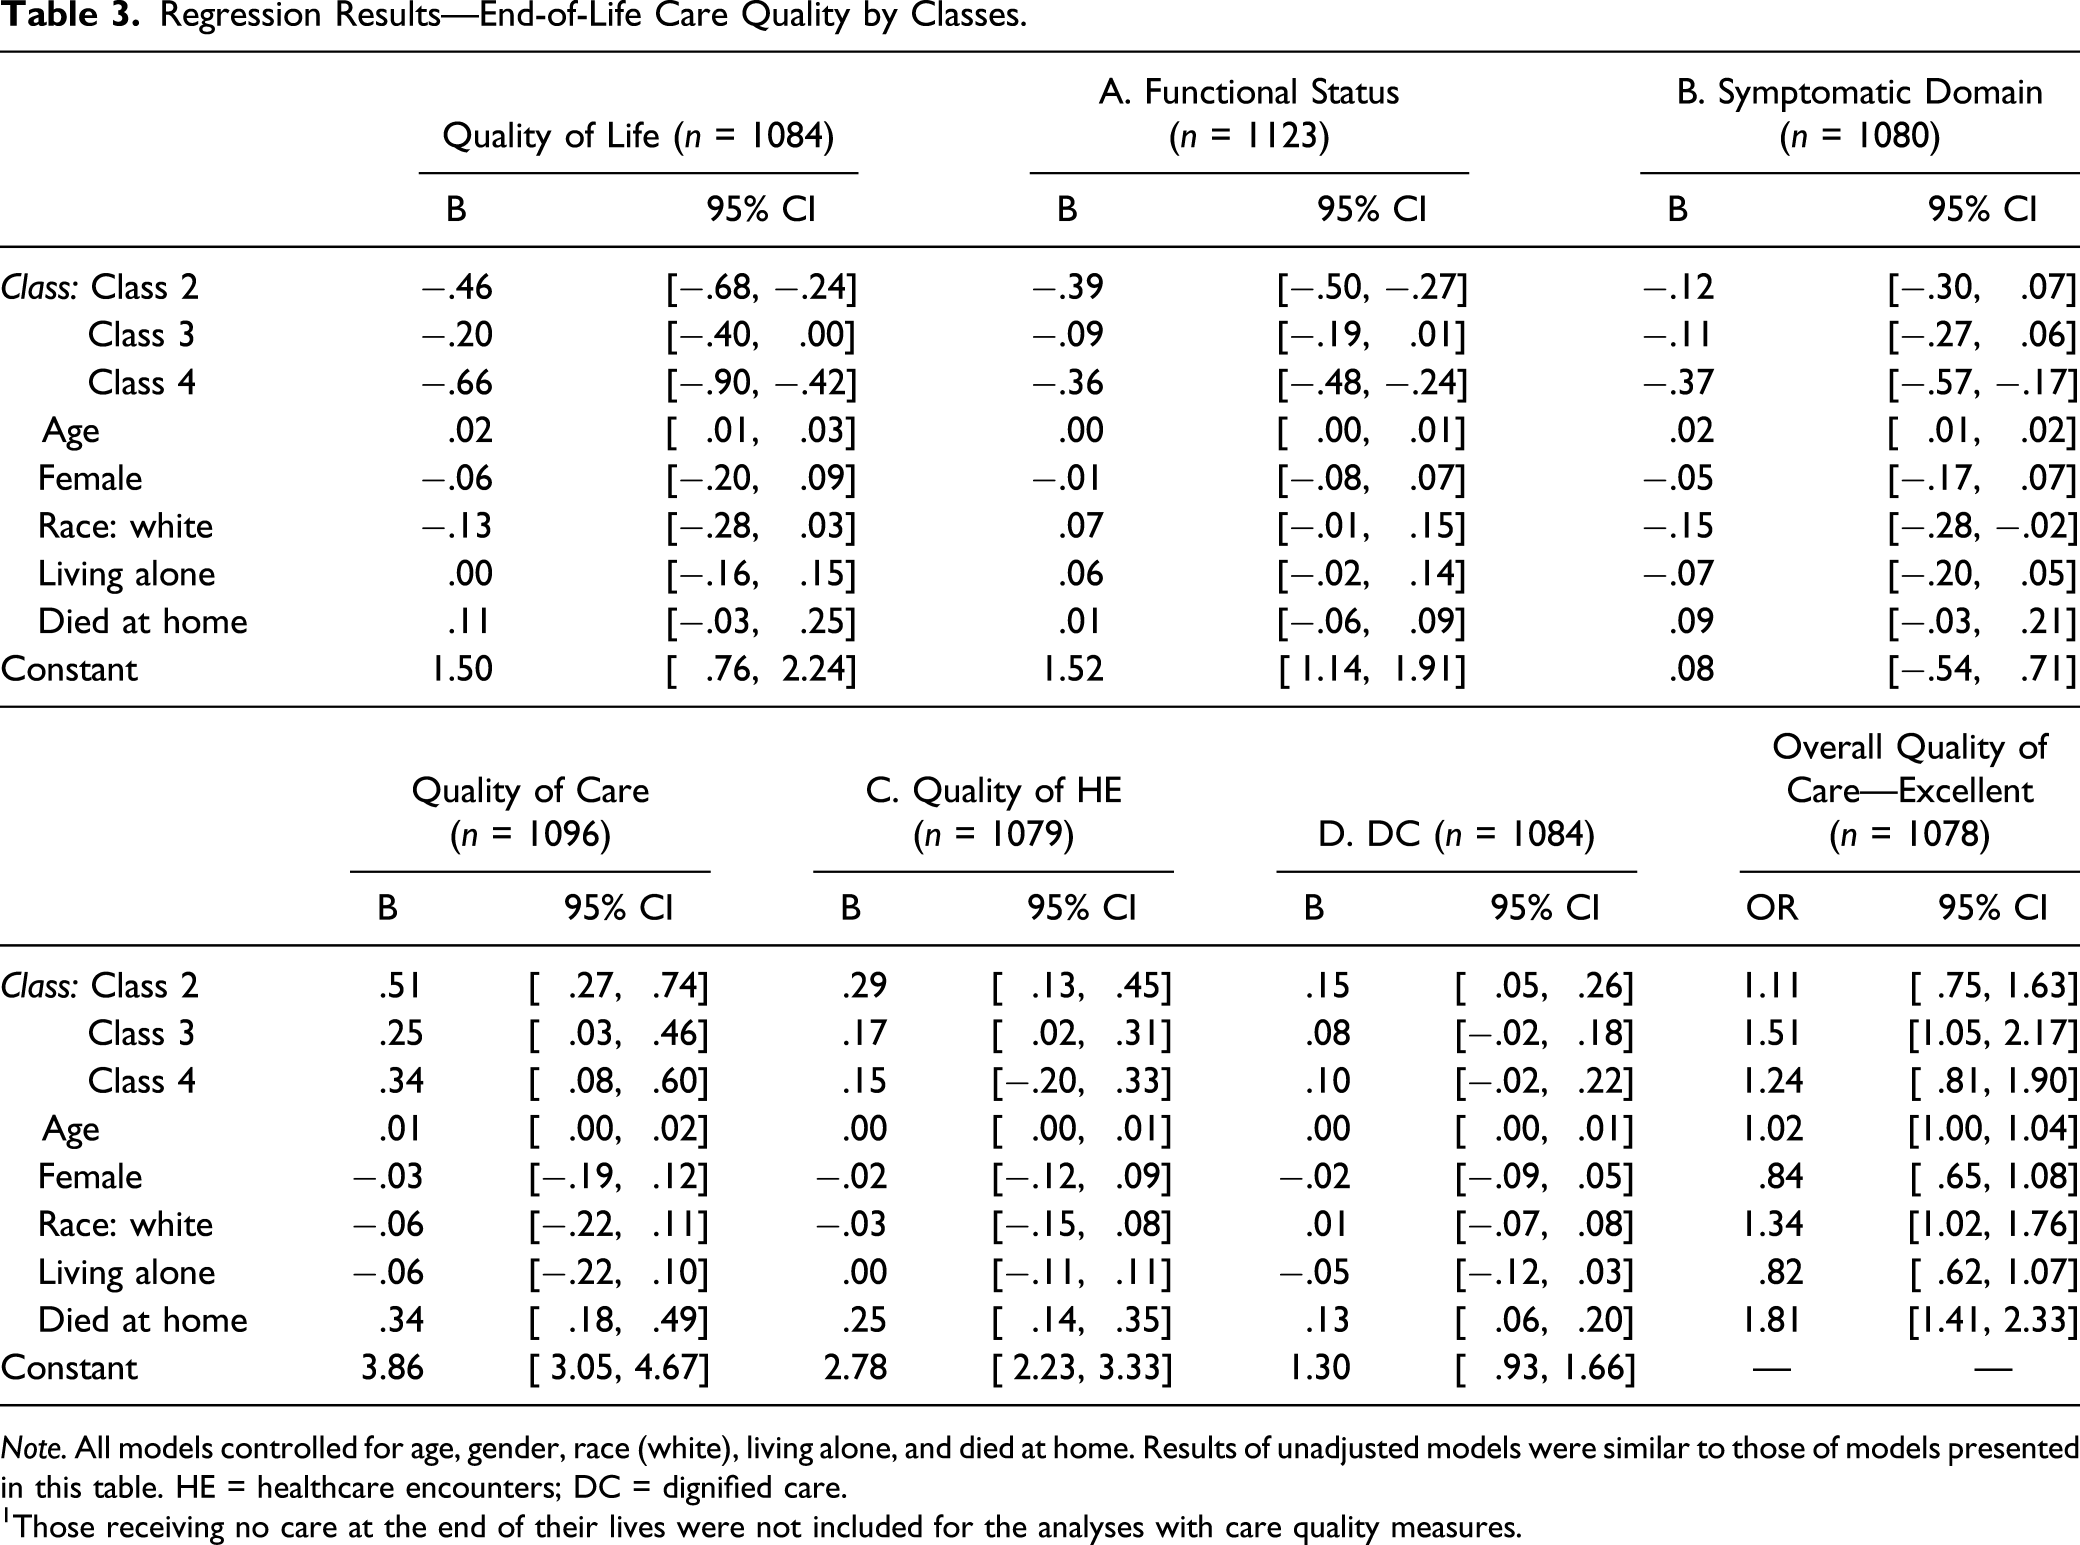
Note. All models controlled for age, gender, race (white), living alone, and died at home. Results of unadjusted models were similar to those of models presented in this table. HE = healthcare encounters; DC = dignified care.
Those receiving no care at the end of their lives were not included for the analyses with care quality measures.
With respect to QOC measures, all other classes were associated with higher QOC summary scores (Class 2: β = .51; 95% CI = .27, .74; Class 3: β = .25; 95% CI = .03, .46; and Class 4: β = .34; 95% CI = .08, .60) than those in older decedents in Class 1. In addition, those in Class 3 were associated with a greater likelihood of rating the overall QOC as excellent (OR = 1.51, 95% CI = 1.05, 2.17), than those in Class 1, whereas those in Class 2 and Class 4 did not show any significant difference.
Discussion
In the current study, we sought to utilize a more holistic approach to the daily experiences of older adults nearing death, driven by theoretical and empirical evidence, in order to provide a better understanding of patterns of death and dying in later life. Given the growing number of older adults dying with degenerative diseases with gradual declines in functioning, characterizing older adults’ experiences in the last year of their lives could help determine better care priorities for them. Findings from this study also help us acknowledge that more than half of older Americans seem to have psychologically healthy and emotionally content lives, although some of them experience a certain level of physical frailty. A relatively small portion of older adults seems to need extensive attention regarding their functioning and well-being in the final year of their lives. In general, older Americans experience fairly high quality of life and care nearing death, although the findings suggest room for improvement in EOL care, for instance, in terms of developing better strategies for symptom management, care coordination, and patient-centered informing processes at the EOL.
Consistent with the proposed hypothesis, we identified four classes showing distinctive health and well-being characteristics. More than a half of our sample who ultimately died within the next year (20% in Class 1 and 37% in Class 2) enjoyed their independence and their relatively good psychological health, even though some of them experienced some degree of declines in their physical capacities. It seems discernable that the last year of many older Americans’ lives is not as dismal or depressing as commonly believed. Based on our findings from the modified version of the comprehensive model, which provides a holistic perspective on well-being rather than focusing on the presence of diseases, more than a half of older Americans seem to have a good life in their final year.
The second largest group was Class 3 (27%), older adults with physical and cognitive impairment, who reported feeling both psychologically and mentally distressed to some extent. The smallest portion of the sample (16%) was assigned to Class 4, the most vulnerable, who experienced severe impairment in physical functioning and capacity, showed poorer psychological well-being and mental health and reported a lower level of social participation. Those in Class 4 are at the highest risk for poor outcomes at the EOL and may require intensive attention and support given at their lower levels of physical, psychological, mental, and social well-being. A comprehensive approach to address their daily life issues and difficulties is warranted.
In line with previous research, demographic and socioeconomic factors may be relevant to the distinction in classes as well as the dying experience for each class (Carr & Moorman, 2009). For instance, those in Class 1 were younger, men, white, educated, and married, and their likelihood of aging in a healthy manner was relatively higher, whereas those in Class 3 were older, women, nonwhite, less educated, and not married, reflecting a lower chance of healthy aging that has been previously acknowledged (McLaughlin et al., 2012). Those in Class 1 and Class 2 were more likely to die in a hospital, which typically reflects more aggressive EOL care and poorer QOC (Luth & Prigerson, 2018). These features can help us to identify the risk groups at the EOL and to provide individualized care plans and services depending on their conditions.
EOL Quality of Life and Care Quality by Classes
The differences in the proxy respondents’ perceptions of various domains of EOL quality of life and care quality help identify unique EOL needs of older adults in each class. We found that older adults in Class 1 (healthy and happy) reported the highest QOL nearing death, which seems to be driven by a better functional status (i.e., being alert and mobile) in the last month of their lives as well as a lower rate of experiencing undesirable EOL symptoms such as pain, trouble breathing, and anxiety/sadness. This suggests that their ability to have their care needs met and to make care decisions may be far superior to those in other classes. In that sense, the benefits of maintaining a healthy life and well-being seem to carry forward to one’s EOL.
On the contrary, those in Class 4 (highly impaired and distressed), the most vulnerable, reported the poorest life quality nearing death, including a greater likelihood of experiencing functional difficulties and adverse EOL symptoms. Thus, older adults who are highly impaired and distressed may benefit from an extensive support and care to detect and manage the symptoms or functional limitations (Kricke et al., 2019). Specifically, given the high prevalence of EOL symptoms among this group, it may be worth considering early access to palliative care or hospice for those highly impaired and distressed older adults and their caregivers (Amjad et al., 2019).
With respect to QOC nearing death, those in the other three classes exhibited better EOL care quality than those in Class 1 (healthy and happy). When EOL QOC was examined in detail, the proxy respondents of those in Class 1, compared to those in the other three classes, reported less satisfying care in terms of the following three items: whether they were “always” informed about condition, whether there was “clear” care coordination, and whether the decedent was “always” treated with respect. The relatively poorer care quality ratings for those in Class 1 may indicate unique unmet needs at the EOL for this group, including both older adults and their proxy respondents. For instance, this healthy group—comprised individuals who often develop acute conditions nearing death or who die suddenly—may evaluate care quality more poorly due to their limited experience with seeking care, limited exposure to health problems, or limited experience in healthcare settings (Maloney et al., 1996). The same study also suggests that those with relatively unfavorable conditions (Classes 2, 3, and 4) may have a better understanding of how to seek formal help and communicate with healthcare professionals to meet their needs when receiving care, owing to their previous experience in various care settings. In addition, they may have experienced a prolonged (or somewhat expected) process of dying that enables them to figure out their EOL care needs and to achieve higher quality care at the end. Thus, health literacy, influenced by socioeconomic status and medical history as well as expectations and experiences with healthcare professionals and institutions, can play a pivotal role in EOL care experiences.
It is worth noting that only half of the sample (51%) rated their overall EOL QOC as excellent, echoing previous research that found significant unmet needs in EOL care despite all the efforts to expand accessibility to EOL care, including hospice and palliative care over the past few decades (Teno et al., 2015). A possible explanation for this gap in care quality may stem from the proxy respondents’ evaluations of their own caregiving experiences. A recent study suggested that the EOL care quality assessment was associated with family caregivers’ perception of the caregiving burden and benefits; in particular, a greater level of perceived benefit from providing care for loved ones had a positive impact on their EOL care quality assessment (Luth & Pristavec, 2020). This could be a sign of resiliency and coping skills that caregivers often exercise or develop over time (Haley et al., 2015). EOL care quality might thus be enhanced through interventions that reduce caregivers’ burdens and maximize their benefits.
In sum, these findings need to be interpreted with caution because the health, well-being, EOL quality of life, and care indicators are strongly linked to EOL care decision-making processes and healthcare service use prior to death. Older adults who show greater vulnerability (i.e., Class 4, those who were highly impaired and highly distressed) may be in greater need of advance care plans, both to improve care quality throughout dying process and to manage the more extensive EOL symptoms that they typically face. However, for those in Class 1 who are healthy and happy in their last year, advance care planning discussions may be most usefully developed around their wishes regarding unexpected situations, including the loss of ability to make their own care decisions at EOL. In particular, family members and friends of those in Class 1 may benefit most from open conversations about EOL plans or preferences, as this group often reports poorer care quality but rarely plans or prepares for the death and dying of their loved ones. Public campaigns such as “Death Over Dinner” could promote a culture of engagement in EOL conversations for community-dwelling older adults and their family members of all ages (Lambert South et al., in press).
Limitations and Directions for Future Research
This study has several limitations. First, the information on EOL care usage and quality of life and care was based on proxy responses after death. There might be some disagreement between proxy responses and those of the decedents, although they typically share perspectives on many aspects of good death and dying well (Meier et al., 2016). Second, there may be a measurement issue, in particular, regarding measures of QOL and care quality, as responses were highly skewed toward high QOL and high care quality for all items. One possibility is that the actual care received by the decedents is satisfying, but another is that these items may not sufficiently assess actual quality of life and care. Previous studies have noted that unmet needs in EOL care are still prevalent and that high-quality EOL care is needed (Teno et al., 2015). Future research may consider developing measures (e.g., that assess a degree, amount, or length of care at the EOL) that better depict the QOL and care quality. In fact, standardized measures exist for evaluating healthcare quality as experienced by the users, including the Consumer Assessment of Healthcare Providers and Systems Hospice Survey (Price & Elliott, 2018). That survey, which dates to 2015, assesses the experience of the hospice care users, including the patients and their caregivers, across multiple domains such as communication with family, getting timely help, training family to care for patients, and willingness to recommend hospice care to others (CAHPS Hospice Survey, n.d.). Standardized measures for a good death and dying well, as well as QOL and care quality, could be further recognized, compared, and employed in future studies.
Conclusion
A comprehensive measure of EOL health and well-being provides a unique perspective on the final year of life and on quality of life and care near the EOL. Physical disability and limitations may not be easily overcome at this stage, but it may nevertheless be possible to reduce pain or discomfort, to adequately detect and treat mental health problems, and to improve psychological and social well-being, well aligned with the aims of expanded hospice and palliative care. Doing so would promote high QOL and encourage better communication and care coordination, which could help to improve care quality nearing death and thereby promote good death and dying well for older adults and their loved ones. In addition, for those providing EOL care services, as Emanuel and Emanuel (1998) suggested two decades ago, there is an urgent need to commit to proper training in order to enhance the QOC for dying patients, their family members, and the care providers themselves.
Supplemental Material
Supplement – Supplemental Material for Health and Well-Being in the Year before Death: The Association with Quality of Life and Care at the End-of-Life
Supplemental Material, Supplement for Health and Well-Being in the Year before Death: The Association with Quality of Life and Care at the End-of-Life by Hyo Jung Lee, Brent J. Small and William E. Haley in Journal of Aging and Health
Footnotes
Declaration of Conflicting Interests
The author(s) declared no potential conflicts of interest with respect to the research, authorship, and/or publication of this article.
Funding
The author(s) disclosed receipt of the following financial support for the research, authorship, and/or publication of this article: Nanyang Technological University (Start-Up Grant/No. M4082337).
Supplemental Material
Supplemental material for this article is available online.
References
Supplementary Material
Please find the following supplemental material available below.
For Open Access articles published under a Creative Commons License, all supplemental material carries the same license as the article it is associated with.
For non-Open Access articles published, all supplemental material carries a non-exclusive license, and permission requests for re-use of supplemental material or any part of supplemental material shall be sent directly to the copyright owner as specified in the copyright notice associated with the article.