
Abstract
This study aimed to examine the impact of employment transitions (ETs) on anthropometric changes among middle-aged and older workers (ages 45y+). Using two waves of data from the Canadian Longitudinal Study on Aging, we analyzed the impact of ETs (stayed working, entered retirement, and stopped working) on change in body weight and waist circumference (WC) on continuous scales as well as categories (≥5% cut-off). Analyses were sex/gender-stratified. Women did not show significant weight or WC change that differed across ETs, but estimated directions suggested those who stopped working were more likely to have ≥5% change in weight. Estimated directions of continuous outcomes for women who stopped working relative to continued workers showed less weight gain and more WC gain. Men who retired gained less weight and had smaller WC gain compared to reference. The findings imply that the short-run impact of exiting the labor force may not exacerbate weight gain.
• We examined the impact of employment status change (employment transitions) on body weight compared to continuing to work among middle-aged and older adults in Canada. • We examined the impact of work stoppage, which is an understudied change in employment status relative to retirement. • We considered change in both objectively measured body weight and waist circumference.
• With an aging workforce, there will be increases to the number of employment transitions in Canada. Understanding the impact on health can inform workplace and community programming. • This research examines an important life event for working adults and provides insight into the impact that the event of entering retirement or stopping work has on body weight outcomes. • The estimate differences across women and men represent a call for future researchers of employment status change to include sex/gender-based analyses.What this paper adds
Applications of study findings
Introduction
The prevalence of adult obesity in Canada has steadily increased over multiple decades and is projected to continue to grow (Janssen, 2013; O’Neill et al., 2019; Twells et al., 2014). Beyond ethnic, geographic, and socioeconomic disparities in obesity (Janssen, 2013), there is a substantial divide in age groups where higher prevalence is observed in middle-aged and older adults. In 2020, the prevalence of obesity among adults aged 18 to 34 years was 21%, while the prevalences among 35 to 49 year olds, 50 to 64 year olds, and 65+ year olds were 31.7, 32.6, and 28.3%, respectively (Statistics Canada, 2021). In turn, obesity is associated with increased risk of multiple diseases such as cardiovascular diseases and type 2 diabetes in middle-aged and older adults (Guh et al., 2009), which imposes large costs to the Canadian healthcare system (Anis et al., 2010). Part of the associated increases in risk is attributable to body weight change, irrespective of body mass index (BMI) status (Chrostowska et al., 2013; Wannamethee et al., 2005).
Employment is recognized as an important determinant of health (Hergenrather et al., 2015; Perez et al., 2022). For middle-aged and older adults, retirement and job-loss are significant life events that can have consequences on health outcomes (Perez et al., 2022). Change in employment status, or employment transition, is closely intertwined with other determinants such as financial sufficiency, housing, and access to health services (Marmot et al., 2012; Perez et al., 2022). In spite of being a promising “upstream” determinant that policy interventions can target to reduce health disparities in certain vulnerable populations (Thornton et al., 2016), there is limited robust evidence to support these policies in older adults (Perez et al., 2022).
Studies that have examined employment transitions and body weight have generally focused on retirement (Tam et al., 2022). Findings are inconsistent, but suggest that women tend to gain weight (Forman-Hoffman et al., 2008; Pedron et al., 2020), while the effect of retiring is ambiguous among men (Feng et al., 2020; Forman-Hoffman et al., 2008; Godard, 2016; Pedron et al., 2020). A possible explanation for the inconsistency is the definition of outcome variable (continuous versus categorical outcomes) and the choice of thresholds for categories (Tam et al., 2022; Paige et al., 2014). There is also a lack of attention to job-loss or non–retirement-related work stoppage. The limited studies suggest that women who lose their jobs gain more weight than women who continue to work (Monsivais et al., 2015), and men who become unemployed are more likely to gain >10% in weight compared to men who are continuously employed (Morris et al., 1992). We aimed to address this evidence gap by considering work stoppage in addition to the retirement transition, and by considering multiple body weight outcomes measures.
The objective of this study was to examine the impact of employment transitions on body weight change among working middle-aged and older women and men. Because changes to body composition such as increases in central adiposity (i.e., abdominal fat mass) coupled with decreases in lean muscle mass may occur in the absence of weight change (Kuk et al., 2009; Zamboni et al., 2003), a secondary objective was to examine the impact of employment transitions on waist circumference (WC) change.
We hypothesized that changes in employment will be associated with changes in adiposity; specifically, job-loss (“work stoppage”) will result in greater weight gain. Further, the effects of employment transitions on changes in adiposity will differ between women and men.
Methods
Canadian Longitudinal Study on Aging Cohort
The data source used in this study was the first two available waves of the Canadian Longitudinal Study on Aging (CLSA). The CLSA is a national prospective cohort study consisting of 51,338 women and men aged 45 years and older who will be followed for 20 years with waves of data collection occurring approximately every 3 years (Raina et al., 2019). Participants in the CLSA are split between two cohorts—a “Tracking” cohort and a “Comprehensive” cohort.
The Tracking cohort is followed using telephone interviews and is a representative sample of the Canadian population since participants were recruited through random sampling in 2011 through 2015 from the Canadian Community Health Survey—Healthy Aging, provincial healthcare registration databases, and random telephone digit dialing (Raina et al., 2008). Participants in the Comprehensive cohort were interviewed in person in 2012 to 2015 through home visits, and provided biological samples and participated in physical examinations at data collection sites located in 11 academic centers across Canada (Raina et al., 2008). Follow-up 1 was conducted between July 2015 and July 2018 (Raina et al., 2019). The sampling frame for the Comprehensive cohort included provincial healthcare registration databases and random telephone digit dialing (Raina et al., 2008). Additional exclusions for both cohorts included individuals who resided in the Northwest Territories, the Yukon, and Nunavut or remote regions, on federal First Nations reserves or other settlements, those living in long-term care institutions, individuals who were full-time members of the Canadian Armed Forces, those unable to respond in English or French, or living with cognitive impairment (Raina et al., 2008).
Study Population
The study population was comprised of all participants in the Comprehensive cohort who were working at a job or business at baseline. The Comprehensive cohort instead of the Tracking cohort was used because of the objective measurement of anthropometric variables of interest and the administration of additional modules relating to health behaviors unique to the Comprehensive cohort. To affirm the choice of using the Comprehensive cohort over the Tracking cohort, analyses were conducted during data exploration to compare whether selection of cohort (using objectively measured versus self-reported anthropometrics) affected the association between employment transitions and anthropometric changes (see Analytic approach).
Restricting the sample in the Comprehensive cohort (n = 30,097) to those who reported they were working at a job or business at baseline, and they did not consider themselves retired resulted in a sample of 11,898. Since the interest was in change in employment status, the sample was further restricted to those who provided labor force participation information at follow-up (n = 11,198). Excluding those who lacked information on covariates resulted in a final analytic sample of 10,117. Women who reported they were pregnant at baseline or follow-up were also excluded; however, no pregnancies were reported among the remaining participants after the previous restrictions were applied (Figure 1). This secondary analysis of CLSA data was approved by an Institutional Review Board. Study restriction flow diagram in the Canadian Longitudinal Study on Aging—Comprehensive cohort for analyses in this study.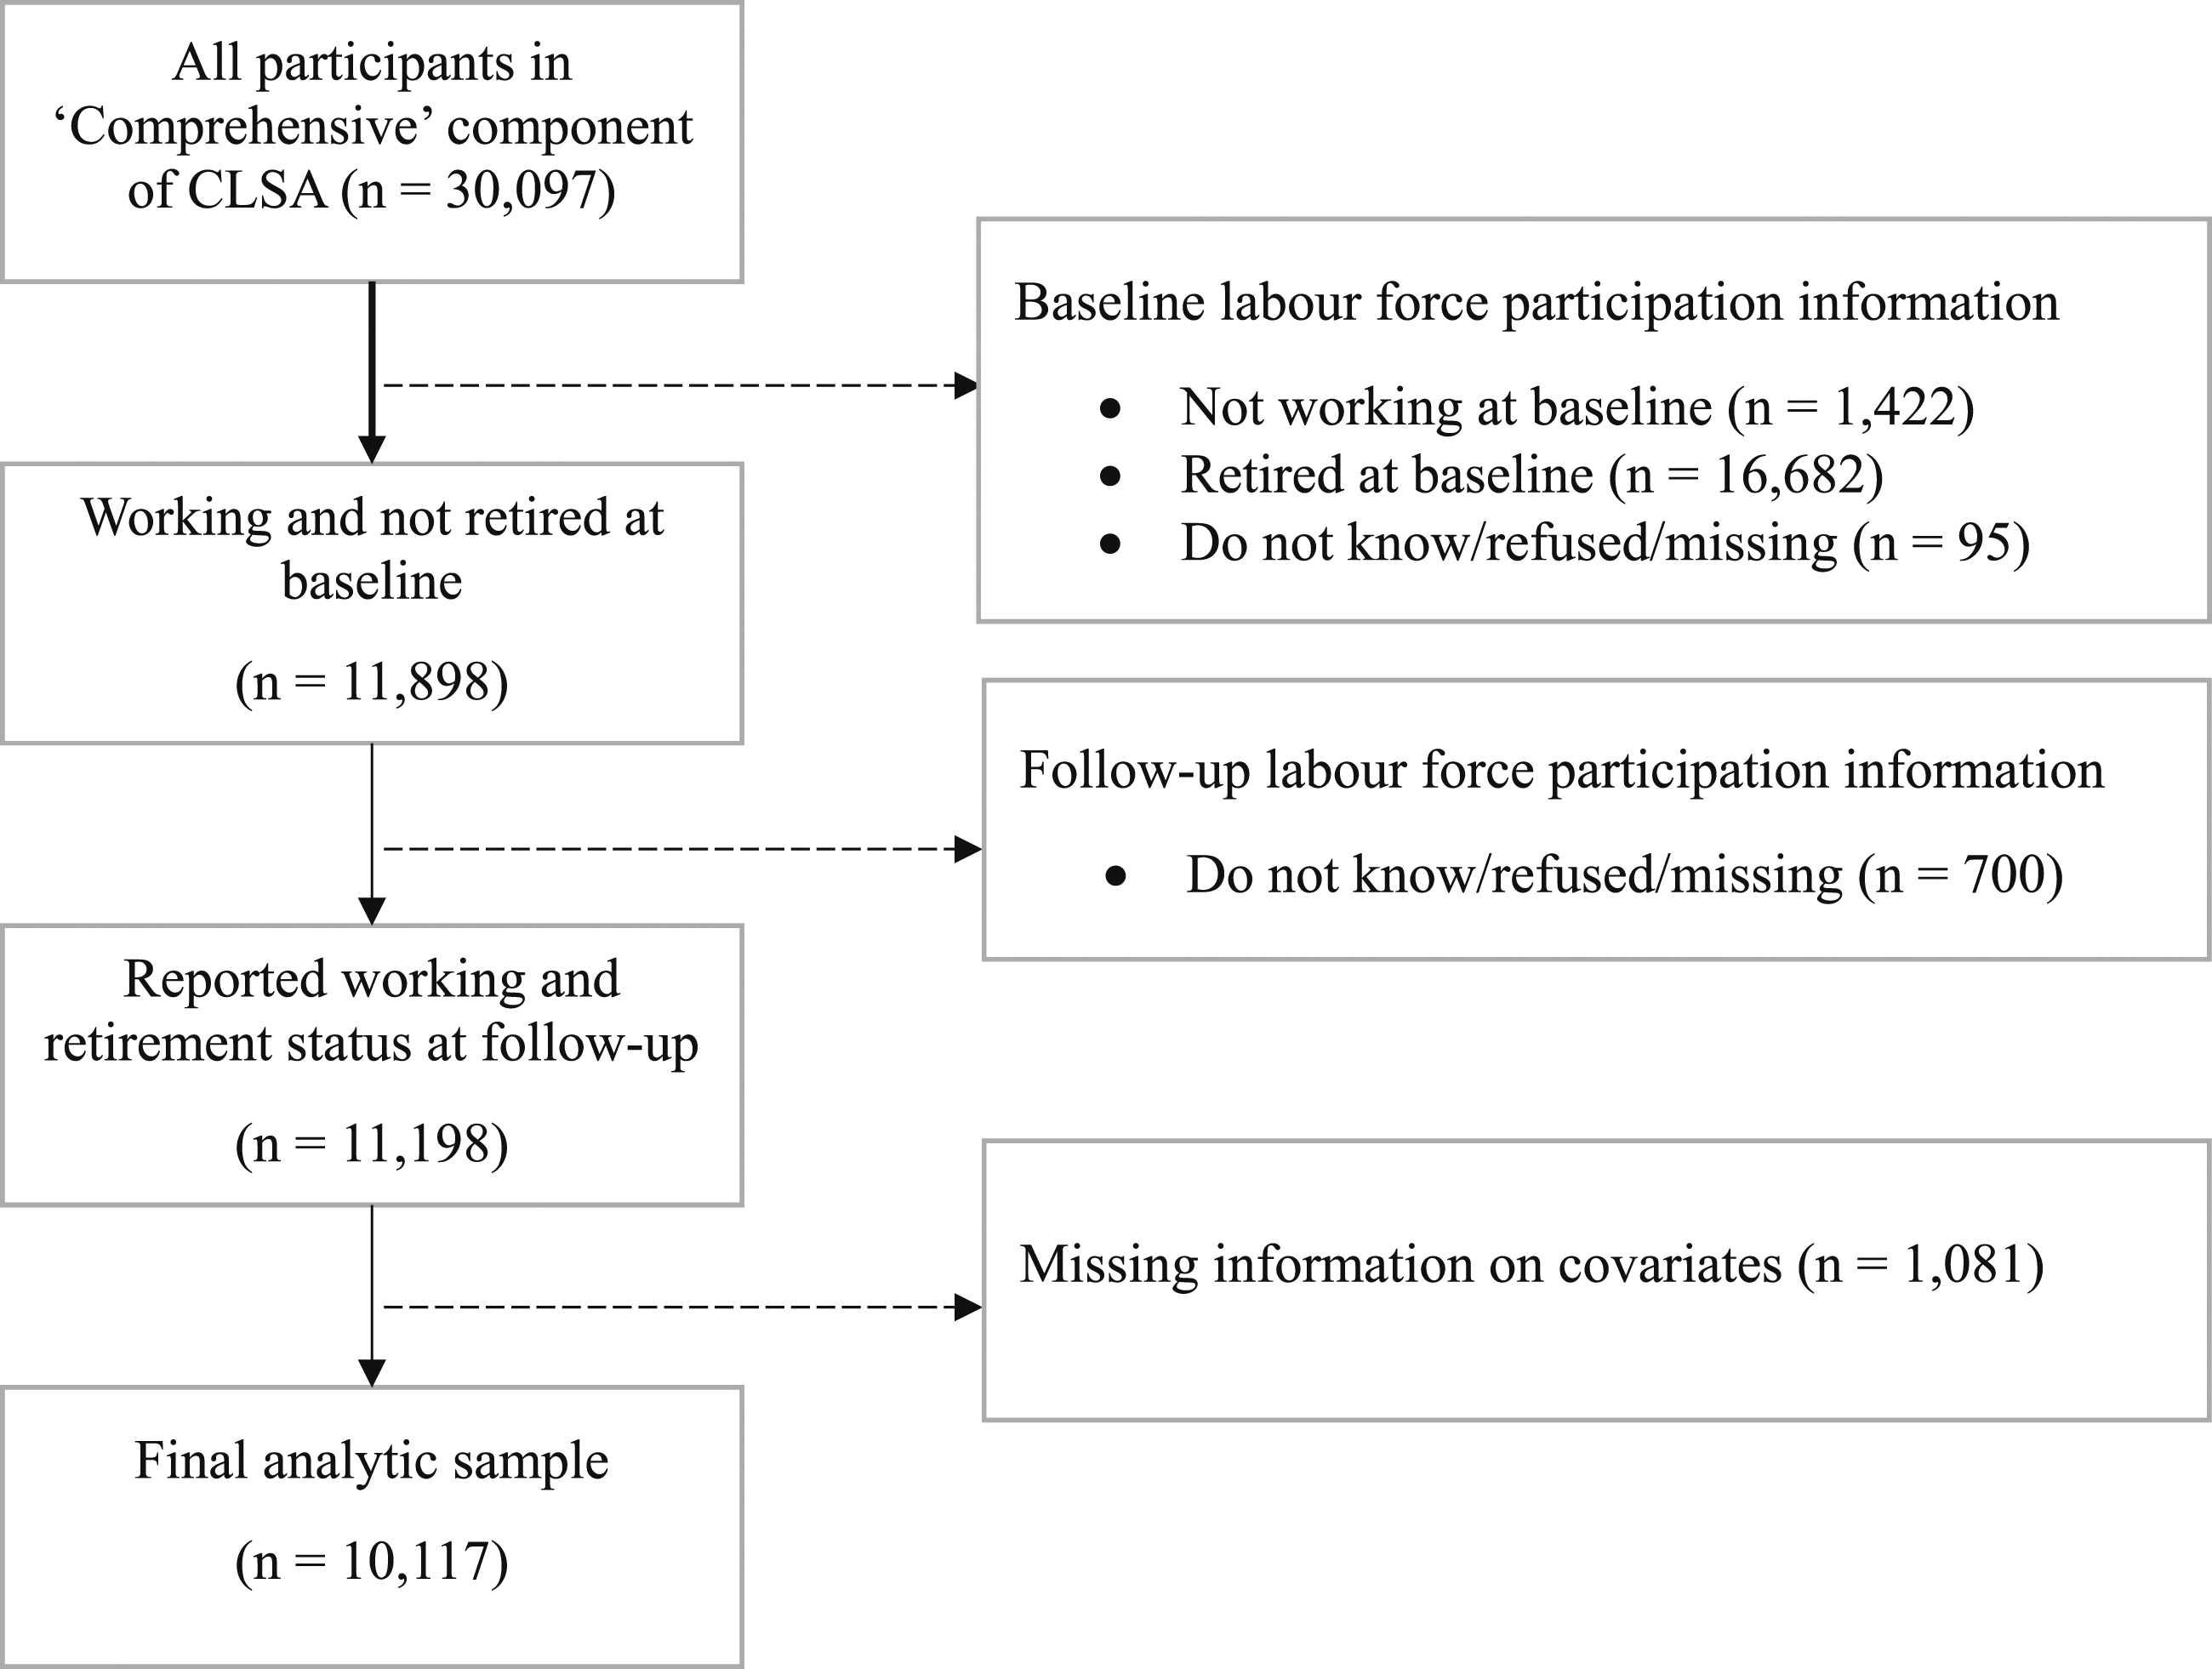
Independent Variable—Employment Transition
Three employment transitions were defined based on responses to the questions “At this time, do you consider yourself to be completely retired, partly retired or not retired?” and “Are you currently working at a job or business” at follow-up (Canadian Longitudinal Study on Aging, 2018b). Responding to the retirement question with “completely retired” would result in the latter question being skipped; while, responding with “not retired” or “partly retired” would not (Canadian Longitudinal Study on Aging, 2018b). The first employment transition status defined was “stayed working” and this included those who were working and not retired, as well as those who were working and partly retired. The “stopped working” category included those who were not working and not completely retired, and those who were not working and partly retired. Participants who were completely retired at follow-up were captured in the “entered retirement” category. Those who stayed working are referred to as continued workers; those who entered retirement as retirees; and “work stoppage” for those who stopped working, which broadly captures all those who stopped working for non-retirement reasons.
Dependent Variables—Body Weight and Waist Circumference Changes
Change in body weight was the primary outcome. Objectively measured anthropometrics were collected for the CLSA Comprehensive cohort. Body weight was measured on a digital scale and an average value using two measurements was generated for each participant (Raina et al., 2008). Body weight was recorded in kilograms (1 kg ≈ 2.205 pounds). Change in body weight was calculated by subtracting the follow-up from baseline values.
Change in WC was assessed as a secondary outcome. WC was measured around the half-way point between the last floating rib and the iliac crest through either direct contact with the skin or over one layer of clothing (Raina et al., 2008). WC was recorded in centimeters (1 cm ≈ 0.394 inches). Measurements were taken to the nearest tenth of a centimeter (0.1 cm) (Raina et al., 2008).
In addition to change on a continuous scale, weight and WC changes were also defined as a categorical variable with three levels: ≥5% increase, ≥5% decrease, and a “no change” category (between −5 and +5%). These cut-points were chosen based on literature supporting their clinical significance (Fruh, 2017; Klein et al., 2004; Verweij et al., 2013).
Confounders
Theoretical and commonly used confounders were identified from similar studies (Feng et al., 2020; Forman-Hoffman et al., 2008; Godard, 2016; Monsivais et al., 2015). The confounders used across all models included baseline demographic and socioeconomic status (SES) variables: age, marital status (married/common-law, single/never married/never lived in common-law, widowed, and divorced/separated), educational attainment (post-secondary graduation, some post-secondary, secondary school graduation or below, and missing/refused), and total household income level (<$20,000; ≥$20,000 but <$50,000; ≥$50,000 but <$100,000; ≥$100,000 but <$150,000; ≥$150,000; and missing/refused). Missing and refused responses were retained as a separate category for education and income variables because of the high rate of missingness or refusal to answer compared to other demographic variables. For example, missing or refused responses for marital status represent less than 0.1% of responses compared to household income where it was 6%. In addition to income, a variable for financial security was also included based on the question “what do you think the chances are that at some point in the future you will not have sufficient financial resources to meet your needs?” with the following levels: little or no possibility, some possibility, high possibility, and missing/refused.
All models were also adjusted for baseline health behaviors: sleep duration (7 to 9, >9, and <7 hours), sleep quality (very satisfied, satisfied, neutral, dissatisfied, and very dissatisfied), alcohol intake (non-drinker, occasional drinker, and regular drinker), smoking status (never, former, and current smoker), and quintiles of a physical activity score (hours per day multiplied by activity weights) calculated based on the Physical Activity Scale for the Elderly (Washburn et al., 1993). Quintile 1 (Q1) scores were the lowest levels of physical activity; Q2 scores were low-moderate levels of physical activity; Q3 scores were moderate levels of physical activity; Q4 scores were moderate-high levels of physical activity; and, Q5 scores were the highest levels of physical activity in the sample. Detailed definitions of all confounders are included in Supplementary Table 1.
Analytic Approach
Multivariable linear regression models were used to analyze employment transitions associated with change in body weight. Models were adjusted for baseline body weight, time to follow-up, age, baseline SES, and health behavior variables Analyses were repeated for change in WC and adjusted for baseline WC instead of baseline weight.
Categorical outcomes variables were modelled using multinomial logistic regression models with “no change” as referent. Models were adjusted for the same set of variables as the linear models. Coefficient estimates are presented as exponentiated Betas (Odds Ratios [ORs]) with 95% confidence intervals (95% CIs).
Because of the known sex/gender differences in employment, anthropometric outcomes, and other covariates (Tam et al., 2022), women and men were analyzed separately in stratified models as recommended in the Canadian Institutes of Health Research Sex- and Gender-Based Analysis guidelines (Canadian Institutes of Health Research, 2018a; 2018b).
As sensitivity analyses, the degree that activities of daily living are impaired (six levels, ranging from no impairment to total impairment plus an inconclusive category) was also included in models for women and men to account for confounding due to differences in level of physical function that may have led to early exits from the labor force (Alley & Chang, 2007; Schinkel-Ivy et al., 2017). This was a derived variable provided by CLSA (Canadian Longitudinal Study on Aging, 2018a), based on the Older Americans Resources and Services Multidimensional Functional Assessment Questionnaire (Fillenbaum, 1988). For women, models were further adjusted for menopause status, hormone replacement therapy usage, and the number of live births as biological sex influences weight change in later life. An additional sensitivity analysis was conducted on the sample after further restriction to employment transitions that were non-health related.
Analyses were weighted using survey weights provided by CLSA: inflation weights were used for descriptive statistics (means, standard deviations, and percentages), and analytic weights were used for regression models as per guidance from CLSA (Canadian Longitudinal Study on Aging, 2020). Weights were used for descriptive statistics to generate estimates that reflect the total population of Canadians between the ages of 45 and 85 who live in the areas surrounding the data collection sites as described above (Canadian Longitudinal Study on Aging, 2020). Weights were used in analyses to account for informativeness of non-responses and sampling design (Canadian Longitudinal Study on Aging, 2020). Statistical significance was accepted for p < .05 in all models. Analyses were performed in R version 4.0.2 (R Foundation for Statistical Computing, Vienna, Austria) and Stata version 15.1 for Windows (StataCorp, College Station, USA).
Results
Study Sample and Characteristics
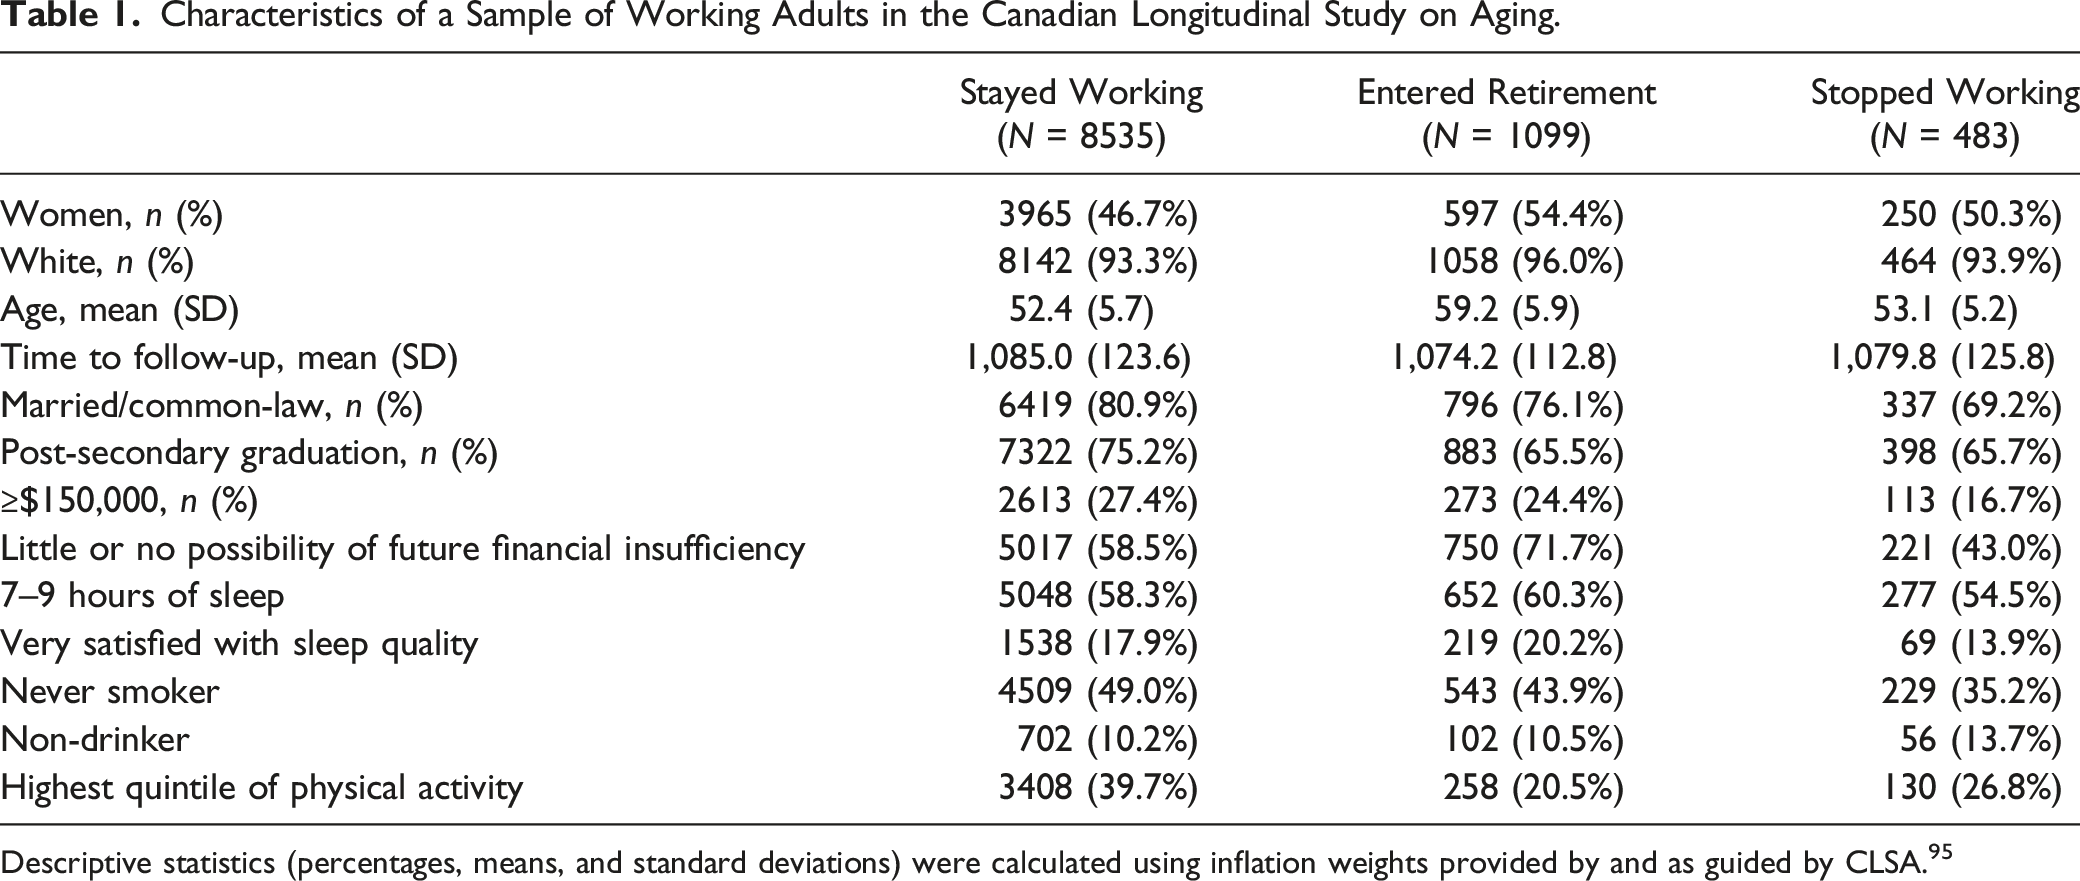
Characteristics of a Sample of Working Adults in the Canadian Longitudinal Study on Aging.
Descriptive statistics (percentages, means, and standard deviations) were calculated using inflation weights provided by and as guided by CLSA.95
Among those who stayed working, there were fewer women than men (46.7 vs 53.3%), while there were more women among retirees and those who stopped working (54.4 and 50.3%, respectively). Fewer participants who stopped working or entered retirement reported completing post-secondary education (65.7 and 65.5%, respectively), compared to continued workers (75.2%). A lower proportion of those who stopped working perceived little to no possibility of future financial insufficiency compared to retirees and continued workers.
There were several differences between women and men across demographic, socioeconomic, and health behavior variables (Supplementary Table 2). More women than men were divorced across all employment transition groups, with the greatest difference among continued workers (10.4 and 3.7%). A lower proportion of men who stopped working reported post-secondary graduation compared to women (60.0 and 71.3%). With respect to health behaviors, more men who stopped working reported being a current smoker compared to men who stayed working (21.7 and 11.0%) while the proportions were comparable among women (10.9 and 10.4%). Among retirees, more women were occasional drinkers compared to men (17.6 and 6.9%), but more men than women were regular drinkers (85.4 and 69.5%). Proportionally more men who stopped working reported they were very dissatisfied with their sleep quality compared to women (13.1 and 6.8%). The average weight change between follow-up 1 and baseline was 0.74 kg in women and 0.42 kg in men (Supplemental Figure 2). The average waist size increased by 0.29 cm and 0.30 cm among women and men, respectively. When stratified by the time between baseline and follow-up 1, the average change in weight varied by the duration (Supplemental Figure 3).
Change in Anthropometrics as Continuous Outcomes by Employment Transition in Women and Men
Gender-stratified Body Weight and Waist Circumference Characteristics of a Sample of Working Adults in the Canadian Longitudinal Studying on Aging.

Descriptive statistics (percentages, means, and standard deviations) were calculated using inflation weights provided by and as guided by CLSA.95
Beta-coefficients and 95% Confidence Intervals From Multivariable Linear Regressions Analyzing the Association Between Employment Transitions and Changes in Body Weight and Waist Circumference in Women and Men.

Note. Unstandardized beta-coefficients and 95% confidence intervals (95% CIs) for body weight change (kilograms, kg) and waist circumference (WC) change (centimeters, cm) obtained by sex/gender-stratified multivariable linear regressions. Based on sample size, n = 4812 women and n = 5305 men.
*p < .1, **p < .05, ***p < .01, ****p < .001.
aUnadjusted models included employment transitions (stayed working/entered retirement/stopped working), baseline anthropometry (kg or cm), and time to follow-up (days).
bAdjusted models included employment transitions (stayed working/entered retirement/stopped working), baseline anthropometry (kg or cm), time to follow-up (days), age (years), marital status (married or common-law/single, never married, or never lived in common-law/widowed/divorced or separated), education attainment (post-secondary graduation/some post-secondary/secondary school graduation or below/Missing or refused), household income level (less than $20,000/ $20,000 or more, but less than $50,000/ $50,000 or more, but less than $100,000/ $100,000 or more, but less than $150,000/ $150,000 or more/missing or refused), possibility of financial insecurity (little or no possibility/some possibility/high possibility/missing or refused), sleep duration (7 to 9 hours/>9 hours/<7 hours), sleep quality (very satisfied/satisfied/neutral/dissatisfied/very dissatisfied), smoking status (never smoker/former smoker/current smoker), alcohol consumption (non-drinker/occasional drinker/regular drinker), and physical activity score quintiles (Q1 represents the lowest levels of physical activity, Q3 represents moderate levels of physical activity; and Q5 represents the highest levels of physical activity).
Relative to the weight and WC gains associated with continuing to work among men, base models showed entering retirement was associated with less increases in their body weight and WC (−0.95 kg, 95% CI [−1.44, −0.46] and −0.68 cm, [−1.28, −0.08], respectively) (Table 3). In the final models, men who retired gained 0.59 kg, [−1.11, −0.08] less weight and increased their WC by 0.83 cm less, [−1.46, −0.20] compared to adiposity changes in the reference group. While not statistically significant, work stoppage was associated with weight change that was about half as much in terms of weight and WC (−0.34 kg, [−1.12, 0.44] and −0.59 cm, [−1.42, 0.23], respectively), than men who stayed working.
In sensitivity analyses, the estimates of the employment transition coefficients did not change appreciably with the addition of impairment to activities of daily living and women’s reproductive variables (Supplemental Table 3). Restricting the sample to employment transitions that were not due to health reasons (e.g., own disability or illness) resulted in larger effect sizes in both women and men; however, coefficients remained non-statistically significant in women and statistically significant in men (Supplemental Table 3).
Predicted Change in Anthropometrics by Employment Transition in Women and Men
Predictions of adjusted mean changes based on final multivariable linear regression models are presented in Figure 2. Women who stayed working had a mean predicted increase in weight of 0.85 kg (95% CI: 0.68, 1.02) by follow-up. Women who entered retirement and stopped working had similar predicted increases of 0.80 kg, [0.35, 1.24] and 0.81 kg, [−0.05, 1.66] respectively. Women also had predicted increases in WC in both the stopped working group (0.92 cm, [0.07, 1.77]) and stayed working group (0.28 cm, [0.06, 0.50]). Women who retired had no significant pre-post change in WC (0.12 cm, [−0.50, 0.74]). Men who stayed working had a mean predicted weight gain of 0.58 kg [0.43, 0.72], while men who retired and stopped working had no significant weight change (−0.02 kg, [−0.51, 0.47] and 0.23 kg, [−0.53, 0.99], respectively). Similarly, men who stayed working had predicted increases in WC (0.44 cm, [0.26, 0.63]), while men who retired and stopped working had no WC change (−0.39 cm, [−0.99, 0.22] and −0.15 cm, [−0.96, 0.65], respectively). Average predicted changes and 95% confidence intervals from final multivariable linear regressions predicting the change in body weight (top) and waist circumference (bottom) associated with employment transitions in women and men.
Change in Anthropometrics as Categorical Outcomes by Employment Transition in Women and Men
In women and men, most showed no change in weight change across groups of employment transitions (Table 2). More women who stopped working gained ≥5% in weight compared to women who continued working (30.0 vs 21.9%) while proportions were comparable in men. Weight loss of ≥5% was more common in women and men who entered retirement compared to continued workers and those who stopped working. Trends were similar for categories of WC change. In multivariable-adjusted multinomial logistic regression models, the ORs of gaining or losing ≥5% in weight or WC (relative to “no change”) for employment transitions (relative to the stayed working group) were not statistically significant at a significance level of .05 (Figure 3, supplemental Tables 4 and 5). Odds ratios from stratified multivariable-adjusted multinomial logistic regression models for categories of body weight change (top) and waist circumference change (bottom) of ≥5% gain, ≥5% loss, or no change in women (left column) and men (right column).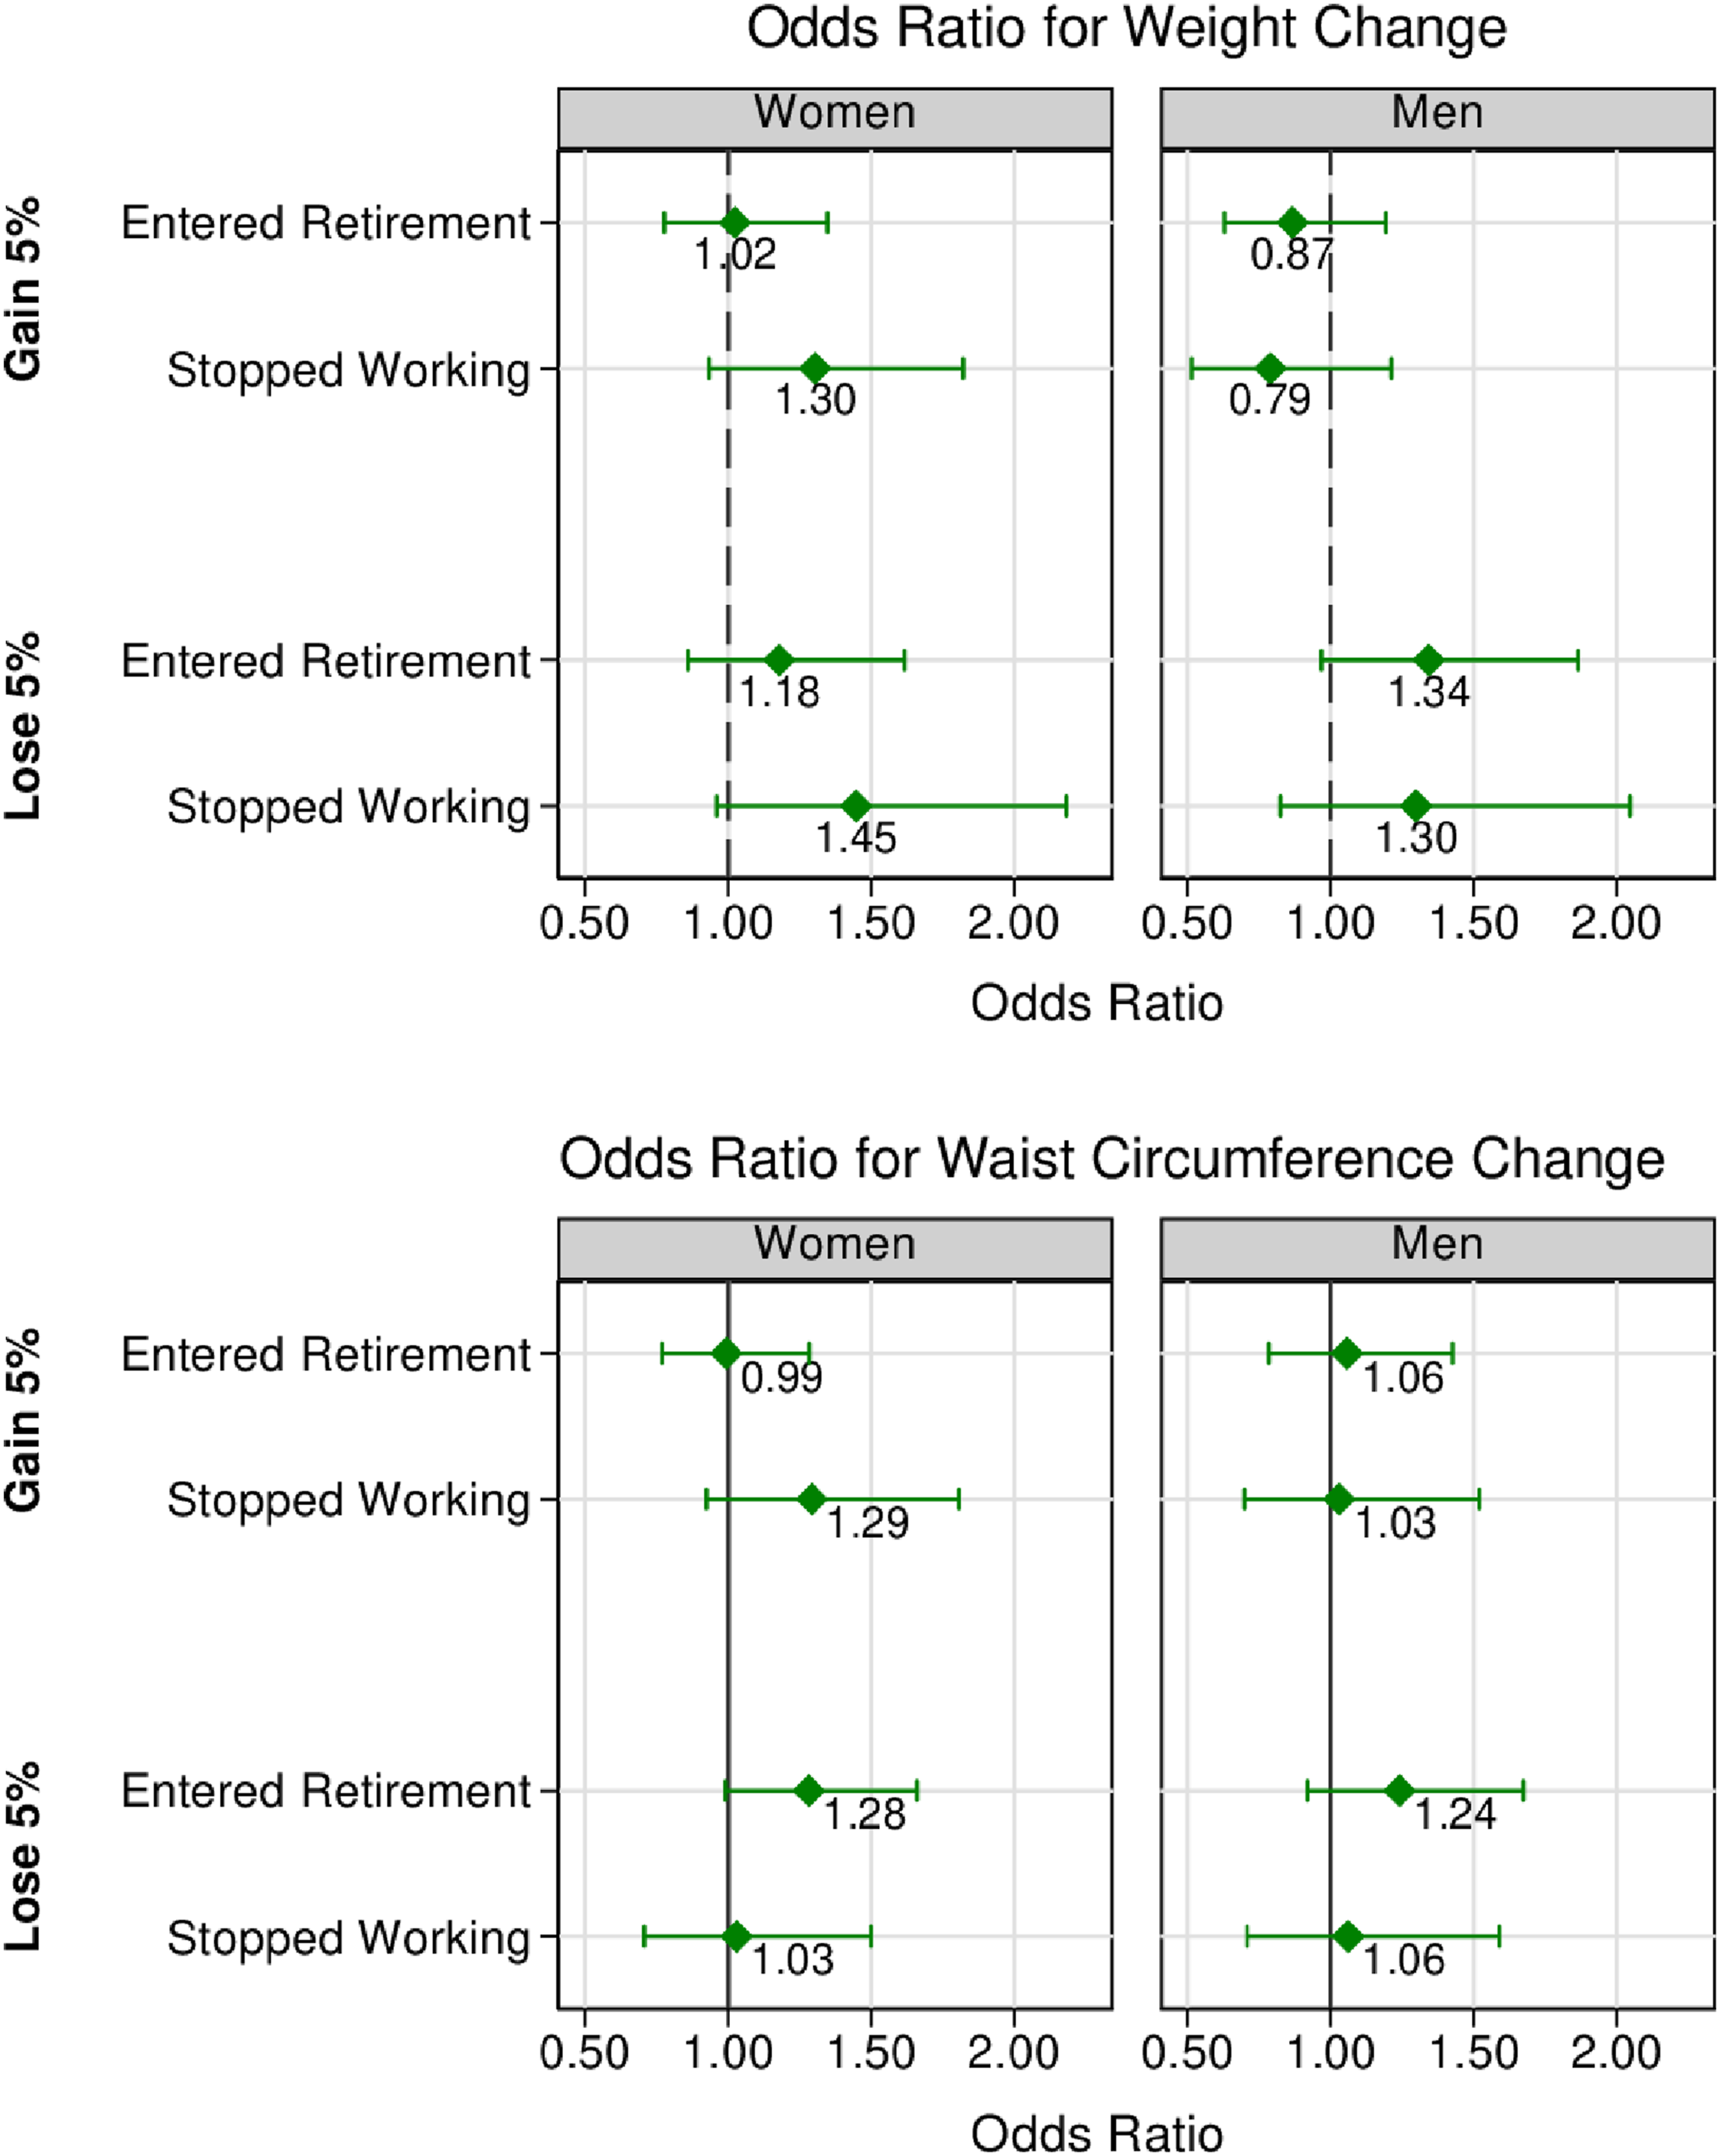
The direction and effect size from adjusted models of change as categories were consistent with the adjusted models of change on continuous scales among men, but not among women. Women who stopped working at follow-up were more likely to both lose (OR = 1.45, 95% CI [0.96–2.18]) and gain (OR = 1.30, [0.93–1.82]) at least 5% in weight, compared to their working counterparts. With WC, women who retired were more likely to experience ≥5% decreases (OR = 1.28, [0.99–1.66]), compared to women who stayed working men who retired were more likely to lose ≥5% in weight and WC (OR = 1.34, [0.97 – 1.87] and OR = 1.24, [0.92 – 1.67], respectively), compared to men who stayed working.
Discussion
To the best of our knowledge, this is the first study in Canada to have analyzed how transitions in employment impact subsequent body weight change in a large sample of middle- and older-age working adult women and men. Men who retired tended to experience less weight and WC gains, and while findings for men who stopped working were not statistically significant, point estimates suggested potentially reduced gains as well. Women who retired or stopped working did not experience anthropometric changes that were different from women who stayed working; although, women who stopped working had the greatest predicted pre-post increase in WC. Results for categorical anthropometric outcomes suggested that findings for women may be because those who stopped working were more likely to both gain and lose weight; however, there is uncertainty around those model estimates.
Our findings indicated that retirement may not put women or men at increased risk of weight gain, and it may even help men avoid weight gain that was observed in men who continued working. This finding differs from previous reports. Forman-Hoffman et al. (2008) found that women who reported being retired in the Health and Retirement Study (HRS) from the US were 1.24 times more likely to gain weight compared to non-retirees using a ≥5% change in BMI as a cut-off. Using data from eight countries within the Survey of Health, Ageing and Retirement in Europe (SHARE), Godard (2016) found that men were 12% more likely to become obese over a two- to four-year period following retirement; however, there was no statistically significant effect on men’s BMI, nor were results significant among women regardless of how the outcome was measured. An analysis of three waves of the China Health and Retirement Longitudinal Study (CHARLS), Feng et al. (2020) also found that male retirees increased their weight and BMI but reported non-significant findings in women.
This study also expanded on the limited number of studies that explore job-loss and its impact on anthropometry. There was no association between work stoppage and weight change relative to continued workers in women or men. This contrasted with Monsivais et al. (2015) who found that British women who lost their jobs gained more weight than women who remained employed over a 3.5-year period. Present results also differed from Morris et al. (1992) who found that proportionally more British men who were not continuously employed experienced both weight gain and weight loss, compared to men who were continuously employed over a 5-year period. Another novel contribution came from the waist circumference results: men who stopped working did not experience changes in WC that differed from their working counterparts while women had less WC reduction. This latter result was also noteworthy as the direction of the relative WC change was positive, while the direction of the relative body weight change was negative, though coefficients were not statistically significant.
Follow-up time may help account for differences in findings. The time to follow-up between waves in the CLSA is comparable to those in the HRS, CHARLS, and the British Household Panel Survey (3 years ± 1) (Feng et al., 2020; Forman-Hoffman et al., 2008; Monsivais et al., 2015). However, the time since the employment transition occurred was relatively short in the present study and not reported in other studies. With many retirement and work stoppage transitions occurring in the 12 months that preceded the follow-up interview, it may be that some anthropometric changes may not have occurred by the time of measurement. For example, using the population-based Kooperative Gesundheitsforschung in der Region Augsburg (KORA) study in Germany, Pedron et al. (2020) found that retiring women gained weight during a six- to ten-year follow-up period. Further, changes in body weight may also fluctuate over time. While slowed weight gain was seen among recently retired men in the present study, they may gain more over a longer time horizon as Godard (2016) found over a two- to four-year follow-up period.
While several baseline health behaviors were adjusted for in the analyses, the minimal weight and WC consequences following work stoppage and retirement may potentially be attributed to changes in health behaviors that offset changes to weight. For example, in an analysis of German micro-census data, Schunck and Rogge (2010) found that the likelihood of becoming a current smoker increased with increasing lengths of unemployment from 6–11 months to 4 years. Weight loss associated with increases in smoking following job-loss may offset weight gain that would follow otherwise. Increased physical activity following retirement may also help offset weight gain (Fogelholm et al., 2000). Forman-Hoffman et al. (2008) found that men increased physical activity following retirement, and suggested that this may have led to their finding of no significant difference in weight change between retirees and continued workers. Overall, changes to health behaviors that accompany transitions to different life stages may be a salient part of the employment and anthropometry relationship. Future work should explore this association with a broader set of health behaviors.
This study had several limitations. The first is related to the timing of the changes to employment status. While it was assumed that the employment transition preceded the change to anthropometry between the two time-points, the opposite may also be true. For example, changes in weight may be related to illness or disease that induces an exit from the labor force. A sensitivity analysis restricting the sample to non-health-related employment transitions produced similar results to the main analysis. Second, the effect of employment transitions could vary by the type of occupation held before retirement or work stoppage (Tam et al., 2022). To mitigate this concern, models were adjusted for baseline physical activity level: one of the twelve activities that contributed to the total score was work or volunteer-related physical activity. The addition of baseline physical activity levels did not change the effect of employment transitions on anthropometric changes appreciably. Finally, it was not possible to distinguish whether weight change was intentional or unintentional in this study. Unintentional weight loss may have been the result of age-related declines in muscle mass (i.e., sarcopenia), which we did not assess (Tournadre et al., 2019).
This study also had several notable strengths. Anthropometry was measured objectively, rather than self-reported. This mitigated common reporting biases associated with self-reported anthropometry, such as women underreporting their weight more often and to a greater degree than men (Gorber et al., 2007). Further, the availability of objectively measured WC also provided an indicator of central adiposity to examine. This was especially important as changes in the distribution of adiposity, absent weight change, are expected in older adults (Kuk et al., 2009). It is also important to consider body weight and WC changes as both continuous and categorical outcomes using clinically meaningful cut-offs. Additional strengths of this work include the large sample size of middle- and older-age adults (45 to 85 years old) across Canada, along with a sex-/gender-sensitive analysis providing disaggregated data on this understudied topic.
In conclusion, we found that retiring or work-exiting men had smaller weight or waist gains than men who continued working, and women showed no difference. In both genders, large weight gains can be ruled out. Future studies should explore factors that protect from increases in anthropometry, factors that may promote weight loss, as well as the longer-term impact of employment transitions.
Supplemental Material
Supplemental Material - Does Retirement and Work Stoppage Impact Body Weight and Waist Circumference Changes in Middle- and Older-Aged Women and Men? Results From the Canadian Longitudinal Study on Aging
Supplemental Material for Does Retirement and Work Stoppage Impact Body Weight and Waist Circumference Changes in Middle- and Older-Aged Women and Men? Results From the Canadian Longitudinal Study on Aging by Alexander C. T. Tam, Rachel A. Murphy, Annalijn I. Conklin, and Wei Zhang in Journal of Applied Gerontology
Footnotes
Acknowledgments
This research was made possible using the data/biospecimens collected by the Canadian Longitudinal Study on Aging (CLSA). Funding for the Canadian Longitudinal Study on Aging (CLSA) is provided by the Government of Canada through the Canadian Institutes of Health Research (CIHR) under grant reference: LSA 94473 and the Canada Foundation for Innovation, as well as the following provinces, Newfoundland, Nova Scotia, Quebec, Ontario, Manitoba, Alberta, and British Columbia. This research has been conducted using the CLSA dataset Baseline Comprehensive Dataset - Version 6.0, Baseline Tracking Dataset - Version 3.7, Follow-up 1 Comprehensive Dataset - Version 3.0, and Follow-up 1 Tracking Dataset - Version 2.2 under Application Number 2104012. The CLSA is led by Drs. Parminder Raina, Christina Wolfson and Susan Kirkland.
Declaration of Conflicting Interests
The author(s) declared no potential conflicts of interest with respect to the research, authorship, and/or publication of this article.
Funding
The author(s) disclosed receipt of the following financial support for the research, authorship, and/or publication of this article: Alexander C. T. Tam would like to acknowledge the support provided by the Canadian Institutes of Health Research (CIHR) through the Canada Graduate Scholarship–Master’s (No. LSA 94473), which supported Alexander’s academic training. Rachel Murphy, Wei Zhang and Annalijn I. Conklin would like to acknowledge the Michael Smith Foundation for Health Research (MSFHR) for the support provided for their respective research programs through the MSFHR Scholar Award.
Ethical Statements
Disclaimer
The opinions expressed in this manuscript are the author’s own and do not reflect the views of the Canadian Longitudinal Study on Aging.
Data Availability Statement
Supplemental Material
Supplemental material for this article is available online.
References
Supplementary Material
Please find the following supplemental material available below.
For Open Access articles published under a Creative Commons License, all supplemental material carries the same license as the article it is associated with.
For non-Open Access articles published, all supplemental material carries a non-exclusive license, and permission requests for re-use of supplemental material or any part of supplemental material shall be sent directly to the copyright owner as specified in the copyright notice associated with the article.