



Abstract
This article focuses on a relatively new innovation for use by law enforcement, license plate recognition (LPR) systems, in fighting auto theft. While it is a promising technology, there has not been much research on the effectiveness of LPR systems. The authors conducted a randomized experiment to study the effects of LPR devices on auto theft. The authors found that the LPR is achieving its most basic purpose of increasing the number of plates scanned by officers (8 times greater) compared to manual plate checking. Further, when compared to manual checking, the LPR was associated with more “hits” (i.e., positive scans) for auto theft and stolen plates, more arrests for stolen vehicles, and more stolen vehicle recoveries. Unexpectedly, the authors found that manual plate checking by a special auto theft unit (but not LPR scanning by the same unit) was associated with less auto theft 2 weeks after the intervention (based on both police crime reports and calls for police service) than the control group (regular nonspecialized patrol without LPR). Finally, the authors found no evidence of crime displacement occurring from their targeted routes to adjacent areas for any of their models. This study provides evidence that LPR use can achieve demonstrable benefits in combating auto theft (i.e., more plates scanned, “hits,” arrests and recoveries with LPR). These results are impressive for the field of auto theft where so little research tested interventions exist. Future work will involve developing strategies that maintains the documented benefits of LPR use by a specialized unit, but also achieve the benefits associated with manual checking by a specialized unit.
The field of vehicle theft research has been growing and receiving increasing attention by the research community in recent years (Clarke & Harris, 1992; Herzog, 2002; Kriven & Ziersch, 2007; Levy, 2008; Maxfield, 2004; Rice & Smith, 2002; Walsh, 2009; Walsh & Taylor, 2007a, 2007b). This is good news as this is an all too common offense (despite the recent downward trend) with around a million vehicle thefts occurring per year (ranging from 1.64 million in 1990 to just fewer than 800,000 in 2009; Federal Bureau of Investigation [FBI], 2010). Also, research suggests that 90% of vehicle thefts are reported to the police, a rate much higher than for other types of thefts (Krimmel & Mele, 1998). The high frequency and high reporting rate of vehicle thefts leads to this being a sizeable portion of police work in many jurisdictions. According to the FBI’s Uniform Crime Reports (UCR), property loss as a result of motor vehicle theft totaled $7.6 billion for 2005 (down to about $6.4 billion for 2008; FBI, 2009a, 2009b), accounting for 11% of Part I offenses recorded by the FBI (Lamm Weisel, Smith, Garson, Pavlichev, & Warttell, 2006). The volume of vehicle theft rose from the mid-1980s to the early 1990s and then began to decline (Newman, 2004). While the data indicate a downward trend in vehicle theft since the 1990s, this may be due to the results of a number of enhancements to vehicle security at the manufacturer level (Newman, 2004). However, motor vehicle theft remains a significant problem for the police across the United States. Although about 57% of the value of vehicles stolen is recovered, most thefts do not result in an arrest (FBI, 2009a, 2009b). The arrest rate for vehicle theft nationwide was only about 10% in 2009 (FBI, 2010).
One recent innovation that could serve as a useful tool for law enforcement in addressing auto theft is license plate recognition (LPR) technology. Like many new technologies, there is evidence that an increasing number of law enforcement agencies (LEAs) are turning to LPR equipment as a tool to address vehicle theft. However, this equipment is expensive and to date there is little rigorous evidence of its effectiveness. While there may be some obvious efficiency gains from automating the process of checking license plates, it is unclear if this equipment is effective at driving down the number of vehicle thefts or increasing the arrest rate for vehicle theft. These are the key questions examined in this article based on data collected during a randomized experiment with LPR equipment in Mesa, Arizona.
Literature Review
LPR is a relatively new technology in the United States but has been used since the 1980s in Europe to prevent crimes from vehicle theft to terrorism (Gordon, 2006). LPR is based on optical character-recognition technology. LPRs serve as a mass surveillance system for reading license plates on vehicles using a system of algorithms, optical character recognition, cameras, and databases. Through high-speed camera systems mounted to police cars, LPR systems scan license plates in real time, and compare them against databases of stolen vehicles, as well as vehicles connected to fugitives or other persons of interest, and alert police personnel to any matches. Under “Description of Intervention,” we provide a detailed description of LPR technology. The use of LPR technology is part of a broader movement in law enforcement to adopt new technologies such as surveillance systems (see Koper, Taylor, & Kubu, 2009). An extensive literature has emerged on the use of surveillance systems, particularly closed-circuit television (CCTV; see Welsh & Farrington, 2008). Based largely on studies in the United Kingdom, this technology appears to be effective in reducing vehicle crimes on public streets and in parking facilities. However, there has been little research to date on LPR surveillance technology.
The United Kingdom has the greatest amount of law enforcement related experience with LPR technology, which it used to aid in responding to attacks by the IRA in the 1990s (Manson, 2006). In fact, the Home Office made £32.5 million available to British police for the years 2005–2007 for the use of LPR (see http://police.homeoffice.gov.uk). One of the first U.K. agencies to use LPR was Northamptonshire. In the first year of using LPR, officers stopped 3,591 vehicles, which yielded 601 arrests and produced £500,000 in revenue from untaxed vehicles (Innovation Groups, 2005). Also, a 17% reduction in vehicle-related crime was recorded in the first 6 months. In another U.K. pilot, officers used LPR to recover £2.75 million in stolen vehicles/goods, seized £100,000 worth of drugs, and achieved an arrest rate more than 10 times the national U.K. average (PA Consulting Group, 2004).
Currently in the United States, LPR systems are being utilized at toll booths, in parking areas/structures, in traffic studies, and for building security. In a recent national survey of LEAs completed by the Police Executive Research Forum (see Koper et al., 2009) about 38% of the sample of LEAs reported using LPR technology, with only 5% reporting that there LPRs were obsolete and 63% reporting them to be effective at scanning license plates. Of the 62% of the sample not using LPRs, about one quarter planned to acquire LPR technology and about one third felt that the LPR would be a valuable technology for their agency and help them address an important operational need. In another national survey, Lum, Merolla, Willis, and Cave (2010) found that 37% of large agencies and 4% of small agencies were using LPR as of 2009. However, the vast majority of agencies using LPRs—86%—had no more than four of the devices.
In 2004, the Ohio Highway Patrol became one of the early adopters of LPR technology and attached LPR devices to toll plazas (Patch, 2005). After 4 months, they recovered 24 stolen vehicles and made 23 arrests. When compared to the same time period in 2003, this represented a 50% increase in stolen vehicle recoveries with a combined total of $221,000 in recovered property. In a pilot test of LPR software conducted by the Washington Area Vehicle Enforcement Unit, that agency recovered 8 cars, found 12 stolen plates, and made 3 arrests in a single shift (McFadden, 2005). Anecdotally, we have learned that a small number of other agencies have implemented LPR technology in single police vehicles, with the Sacramento Police Department having nearly 3 years of experience with LPRs, and the Los Angeles Police having equipped 36 vehicles with LPRs.
Although LPR systems have documented benefits, there are also limitations. First, inaccuracies may arise due to plates that are bent, are covered with certain reflective material, are positioned high (as on certain trucks), are very old, or are obscured by common obstructions such as trailer hitches, mud and snow, and vanity plate covers (see McFadden, 2005). Next, one reason why the LPR system was successful in the United Kingdom is the uniformity of the U.K. license plate design. Plate designs in the United States vary by state and even within states. This results in false hits when plate numbers from one state match those of cars stolen in other states. The devices also sometimes misread plates, though this problem should decline as the technology improves. Also, there may be some concerns about invasion of privacy issues, potential abuse, and erroneous traffic stops. However, an important advantage to this technology is that it does not raise concerns about racial or ethnic discrimination. As opposed to some profiling approaches, plates are examined for all passing vehicles, and the system only alerts the officer if the vehicle is stolen.
Another limitation to the use of LPR technology for apprehending vehicle thieves is that thieves may often abandon stolen vehicles before the cars are reported stolen and entered into police data systems. In Mesa, Arizona (our study location), we estimate that only one third of car thefts are reported within 3 hr of occurrence, based on analysis of data from 2006 and 2007. These delays reflect lags in the discovery of vehicle thefts (e.g., a car stolen at night might not be discovered as missing until the following morning) as well as delays in reporting by victims after their discovery of a theft. 1 Further, some vehicle thieves switch the license plates of stolen vehicles with those stolen from other cars; victims who have had their plates swapped for those of a stolen car may be unaware of this for a long period, thus providing thieves with additional time to operate their stolen vehicles.
Despite these limitations, LPRs are a promising law enforcement technology with the potential to help police increase recoveries of stolen cars (and the speed with which stolen cars are recovered), increase apprehension of vehicle thieves, reduce vehicle theft (through incapacitation and deterrence), and apprehend other wanted persons (which may help reduce crimes besides vehicle theft). In some instances, the devices may also help police solve criminal investigations by providing records of cars that were in or near a crime location around the time of a criminal act. The LPR also has the potential to help counteract the arrest avoidance strategies of vehicle thieves. Cherbonneau and Copes (2006) outline a number of strategies that vehicle thieves use to avoid being arrested and demonstrate that thieves are aware of how they drive and act to present an appearance of being a normal driver so that police and others pay them no attention. Using LPR equipment, police are not reliant solely on their ability to spot suspicious activity because every driver is scanned and this technology may nullify the skills some vehicle thieves have developed.
Nevertheless, these benefits have not been documented through careful research. To date, there have been only a small number of pilot evaluations of LPR programs, and only one other study using rigorous experimental methods. In the latter study, Lum and colleagues (2010) randomly allocated LPR deployment in half of 30 crime hot spots across two jurisdictions to test whether LPR use by a marked patrol unit yields a specific deterrent effect on auto-related crimes (e.g., auto thefts and thefts from autos) and a more general deterrent effect on other crimes. They found that use of LPRs in the hot spots did not result in a reduction of crime generally or auto theft specifically during the period of time measured. However, this may have been due in some measure to the relatively low intensity of the LPR intervention during the experiment (about 30 min per day for 10 nonconsecutive days of intervention per LPR hot spot), which was limited by resources and shift constraints, or to the timeliness and comprehensiveness of the base of data that the LPR units accessed.
Finally, the potential benefits of LPR use must also be weighed against their costs. These include financial costs (the devices range from $20,000 to $25,000 in price) as well as some loss of privacy for citizens whose plates are scanned (thus resulting in a record of where they were at a given time).
Guiding Framework for Study
Our study was designed to advance the field of policing research through a large-scale randomized experiment in Mesa, AZ, with LPR devices. We grounded our study in a hot spot policing framework and the “journey-after-crime” literature to study an understudied area of the effects of LPR devices on vehicle theft. Specifically, we sought to test the utility of LPR use at locations with heavy concentrations of vehicle theft transit activity identified through journey-after-crime analyses. In our study, we extend the concept of “hot spots” of crime to “hot routes” of crime. That is, transit routes that are used as thoroughfares to move stolen vehicles. Given that vehicle theft involves the rapid movement of the stolen property (i.e., the motor vehicle); we do not limit our analysis to the location of the vehicle theft but instead consider the route the auto thief took after stealing the vehicle. Focusing on these “hot routes,” we examine how LPR use affects recoveries of stolen cars, apprehension of vehicle thieves, and levels of vehicle theft.
Our study builds on the hot spots of crime framework to guide our placement of the LPR equipment in our experiment. The hot spots of crime literature has highlighted data, which shows that crime is not evenly distributed across a city and that instead is concentrated in small areas (see Brantingham & Brantingham, 1981; Pierce, Spaar, & Briggs, 1988; Sherman, Gartin, & Buerger, 1989; Sherman & Weisburd,1995). Evidence for crime concentration at places has been found in places like Boston (Pierce et al., 1988) and Minneapolis (Sherman et al., 1989) and for crimes such as burglary (Farrell, 1995; Forrester, Chatterton, & Pease, 1988; Forrester, Frenz, O’Connell, & Pease, 1990), property crime (Spelman, 1995), gun crimes (Sherman & Rogan, 1995b), and drug dealing (Eck, 1994; Weisburd & Green, 1995). The theoretical underpinning for hot spots is based generally on routine activity theory/situational crime prevention (Cohen & Felson, 1979; Felson 1994) and offender search theory (Brantingham & Brantingham, 1981).
The existing body of research on other policing strategies based on hot spots has been impressive. Braga (2001, 2005) presents evidence from five randomized controlled experiments and four quasi-experimental designs that hot spots policing programs generate crime control gains without significantly displacing crime to other locations. While none of the studies reviewed by Braga were focused on reducing vehicle theft, we hypothesized that the same logic that led to successful outcomes for these hot spot interventions should apply to our experimental evaluation of vehicle theft and LPRs. As an intervention targeted at vehicle theft, LPR is a type of situational crime prevention (Clarke, 1995) and can serve as a type of approach that alters the environmental risks for vehicle thieves. Unfortunately, the hot spots literature does not provide much guidance on the types of focused policing tactics that should occur at a hot spot. As described below, our study involved the use of two different strategies to reduce auto theft at hot spots: deployment of a specialized unit using LPRs and deployment of the same unit doing manual checks of licenses plates. Therefore, our study is one of the few which provides a rigorous comparison of different tactics that can be used in a hot spot and will have implications for place-based theories of crime (Sherman et al., 1989; Sherman & Weisburd, 1995; Weisburd, 2002, 2008; Weisburd, Bernasco, & Bruinsma, 2009).
In considering the placement of LPRs in our study, we also built on the existing literature on the geographic concentration of vehicle thefts (see Barclay, Buckley, Brantingham, Brantingham, & Whinn-Yates, 1995; Copes, 1999; Fleming, Brantingham, & Brantingham, 1994; Henry & Bryan, 2000; Plouffe & Sampson, 2004; Potchak, McCloin, & Zgoba, 2002; Rengert, 1996; Rice & Smith, 2002).
Spatial analyses of crime have generally examined two different but related aspects: (a) the spatial patterns of the offense locations (e.g., Craglia, Haining, & Wiles, 2000; Levine & Associates, 2000) and (b) the spatial patterns of the paths related to crime activities (also known as the “journey-to-crime”; e.g., Costanzo, Halperin, & Gale, 1986; Phillips, 1980; Smith, 1976; Wiles & Costello, 2000). Of direct relevance to our proposed project is a newer area of research in the criminal travel patterns literature, explored by Yongmei Lu, which examines the spatial patterns of stolen-vehicle recoveries and the “journey-after crime.” The journey-after-crime is an offender’s trip with the stolen vehicle in order to realize its expected utility, such as a trip to sell or strip the vehicle, a trip to another offense (e.g., a robbery), or a joyride (Lu, 2003). Lu demonstrated how geographic information system (GIS) and exploratory spatial data analysis can be extended from journey-to-crime to journey-after-crime analyses in a study of 3,271 vehicle theft offenses in 1998 in Buffalo (see Lu, 2003). In Lu’s analyses (2003) she found that vehicle thieves’ trips from vehicle-theft locations to vehicle-recovery locations were mostly local in nature, with travel distances significantly shorter than randomly simulated trips, and she recommended that police responding to vehicle theft should check nearby locations first. Lu found that the difference in travel direction between observed and simulated trips was a combined result of both the criminals’ spatial perception and the city’s geography (e.g., street networks).
Method
Research Site
We conducted this study in the city of Mesa, Arizona, with the Mesa Police Department (MPD) from 2008 to 2009. MPD has about 800 sworn officers. Mesa is one of the United States’ fastest-growing cities, and currently ranks as the 38th largest. Since 2000, it has had a population growth of about 13%. In 2005, the mid-decade U.S. Census survey estimated the city’s population to be 442,780. The selection of a large urban area is important, for vehicle theft is predominately an urban problem (see Clarke & Harris, 1992). Households in urban areas have rates of vehicle theft that are more than 3 times the rate of rural areas ( Bureau of Justice Statistics, 2004).
Like many large cities, Mesa has a considerable vehicle theft problem. First, the state of Arizona as a whole had the third highest rate of auto theft in the country, behind only Washington, DC, and Nevada, during 2007 and 2008 (see statistics from the Arizona Automobile Theft Authority at http://www.aata.state.az.us/News_and_Media/stats_and_trends.asp). Moreover, the Phoenix–Mesa–Scottsdale metropolitan area ranked fourth in auto theft among metropolitan statistical areas in the United States in 2006 and eighth in 2007.
There are a number of factors that contribute to the vehicle theft problem in Mesa and the state of Arizona as a whole (Arizona Automobile Theft Authority, 2006). First, Mesa and other cities in Arizona have experienced a dramatic population increase over the past 20–25 years (Arizona Automobile Theft Authority, 2006), with transiency arising from the many multifamily housing units found in Mesa. In these types of residential areas, vehicles may be at greater risk to be stolen. Due to the dry, moderate climate in Arizona, vehicles also tend to maintain higher value than in other areas of the United States due to less weather/road-related wear on vehicles. Also, the close proximity with Mexico allows thieves to get easy access to a foreign shipping point. There are seven official ports-of-entry along the 354-mile Arizona–Mexico border, and major California seaports are less than 8 hr away. Further, the public transit system is very limited in Mesa, and MPD officers believe that this also contributes to the city’s vehicle theft problem (see Copes, 2003 for the motivation of auto thieves). Finally, like many police departments, MPD is able to arrest only a small percentage of vehicle thieves—fewer than 7% in 2006 and 2009. 2
Auto theft rates in Mesa, AZ, gradually increased in the early 1990s until reaching a highpoint of 1,381 auto thefts per 100,000 persons in 1995 (see the Federal Bureau of Investigation’s annual Uniform Crime Reports at http://www.fbi.gov/stats-services/crimestats). In 1999, following a 4-year decline in the rate of auto theft, auto theft rates in Mesa began to increase again (UCR Data Online, Table-building tool). By 2003, there were 4,563 auto thefts reported to police in Mesa, AZ, resulting in a rate of 1,045.2 thefts per 100,000 residents. However, vehicle thefts in Mesa have been dropping in recent years (as have vehicle thefts in Arizona and the nation as a whole). Between 2003 and 2009, the rate of auto theft in Mesa, AZ, declined by 74% from 1,045 thefts per 100,000 residents to 277 thefts per 100,000 residents. Nevertheless, during our study period of 2008 and 2009, there were 3,350 vehicle thefts in Mesa, or about 32 per week. This provided a reasonably large pool of cases on which the LPR could have a potential impact, making Mesa an attractive site from a research perspective. In the discussion section, however, we consider the implications of having conducted our study during a time when auto theft was comparatively low in Mesa.
Description of Intervention
There are a number of LPR devices on the market. MPD used the Remington Elsag Mobile License Plate System (REMLPS; Model: MPH-900S) and deployed all four of its LPR devices for the study. 3 The REMLPS operates independently in the background and works at patrol and highway speeds. 4 Two infrared cameras mounted on a cruiser take photos of passing license plates. The cameras are triggered by the reflective material in the plate. A laptop computer uses character-recognition software to determine the letters and numbers of the license plate. That plate is then checked against a daily “hot list” of stolen vehicles, stolen license plates, and other vehicles of interest (e.g., vehicles linked to robberies) for the state of Arizona. 5 An alarm sounds for each possible match. The officer then verifies the accuracy by looking at the tag before taking any action. The REMLPS is able to read up to four lanes of traffic with a single vehicle and can read 8,000–10,000 plates in just one shift with just a single vehicle mount. The REMLPS also has a Global Positioning System (GPS)/time stamping function which records the GPS coordinates and time for every plate it reads.
The LPR system in our study accessed the state of Arizona “hot list” of cars and plates via a download to the system on a thumb drive transfer of data to the police LPR laptop done at Mesa Police substations twice every shift. The data also contained information on warrants for a few nearby localities (Tucson and Gilbert). Officers could also add information into the system based on recent alerts while they were in the field.
Based on prior experience with the LPRs and consideration of practices used by other agencies, MPD chose to deploy their LPRs with a specialized vehicle theft unit. The vehicle theft unit consisted of four police officers and one supervisory officer (not involved in the actual street work) working together in four cars (two were unmarked smaller cars that did not look like police cars and two were regular patrol cars without police badging/police light bars used for chasing uncooperative suspects). The unit was provided with four LPR systems (one for each car for each of the four nonsupervisory officers, allowing for the simultaneous use of all four LPR systems). Each of the LPR systems used in our study contained two mobile cameras that were mounted on the rear of the vehicles. The unmarked cars provided more investigative options (e.g., surveillance) for the vehicle theft unit. The use of a specialized vehicle theft unit also had some advantages in that all of the officers of the unit had specialized knowledge and training in vehicle theft and had developed increased proficiency in vehicle theft surveillance and investigation. Over time, the vehicle theft unit also developed more refined skills in the nuanced use of four LPR devices at once, and the unit was given the time to just focus on vehicle theft and did not have to respond to other calls for service.
Working closely with the MPD, the research team developed a standardized approach to implementing the LPR program uniformly across all of the assigned routes, which, as described below, consisted of roadway segments averaging 1 mile in length. First, for each LPR assigned route, the vehicle theft unit used the LPR equipment for a minimum of 1 hr per day for a 2-week period. The general strategy used was to have the officers “sweep” each route (check parking lots and side streets within the targeted routes) at the beginning of the shift and then conduct fixed surveillance on the route (with officers positioned along different sides and parts of the route). As discussed below, the vehicle theft unit also conducted manual license plate checks (without the LPR devices) in a second group of routes. When working these routes, each of the four officers used the same initial sweeping strategy and then focused their efforts on particular parts of the assigned routes by roaming around these areas to maintain speeds with the local traffic or by parking at traffic lights to check plates. The officers doing manual checks were not able to remain stationary, for that limited their ability to see and check license plates of cars passing by rapidly. The officers worked both sets of routes Wednesday through Saturday between the hours of 3:00 p.m. and 1:00 a.m.
Experimental Design
We used an experimental design to study the effectiveness of the LPR equipment in recovering stolen automobiles, apprehending auto thieves, and reducing auto theft. Our study represents the first experimental test of LPR effectiveness in recovering stolen automobiles and apprehending auto thieves, and one of only two experiments assessing the impact of LPRs on auto theft (see Lum, Merolla, Willis, & Cave, 2010 for the other such study, which was designed in part to replicate the experiment reported here). 6
Among the flaws found in many policing intervention studies are designs with noncomparable comparison groups (see Mazerolle, Soole, & Rombouts, 2006). While there are exceptions, many policing intervention studies make little attempt to draw comparison groups in ways that maximize the likelihood that they will be similar to the intervention/treatment group. The problem with these types of studies is that although measured differences can be statistically controlled, the many unmeasured variables related to the outcome variable (e.g., susceptibility to change) cannot be controlled. Randomized controlled trials (RCTs) are typically thought of as the best method for eliminating threats to internal validity in evaluating social policies and programs (Berk, Boruch, Chambers, Rossi, & Witte, 1985; Boruch, McSweeny, & Soderstrom, 1978; Campbell, 1969; Campbell & Stanley, 1963; Dennis & Boruch, 1989; Riecken et al., 1974). RCTs provide the best counterfactual describing what would have happened to the treatment group if it had not been exposed to the treatment (Holland, 1986; Rubin, 1974).
Based on discussion with MPD, the lag time it takes before a vehicle is reported to the police as stolen and entered into the MPD database precluded our team from using the LPR device in the specific hot spot zones where vehicles are actually typically stolen. Instead, we used “journey-after-crime” spatial analyses and input from MPD personnel to identify all the main transit routes in Mesa (n = 117) where vehicle thieves are most likely to drive stolen vehicles (including dumping/destination points). The hot routes on average were about 1 mile in length, were a mixture of residential and business areas, and included different types of roads (interstate roads, highways, and residential streets). 7
Two thirds of the 117 routes were selected based on geographic analysis of theft and recovery locations. 8 Using data on 1,668 automobiles that were both stolen and recovered in Mesa during 2007 and using the shortest travel time between each corresponding theft and recovery location as a likely estimate of thieves’ journey after crime, we selected 78 roadways that had the highest number of estimated trips by vehicle thieves. However, the other one third of the 117 routes was selected based on interviews with detectives and officers. We included the detective/officer nominated routes to assure that our routes were based on the latest intelligence collected by MPD, much of which is not reflected in official MPD crime statistics and is often of a more qualitative nature. To assure no bias entered into our study, we used the variable of who designated the route (i.e., was the route selected based on geographical analysis or by designation by a detective/officer) as a stratification variable in our random assignment, assuring that all three study conditions had equal number of routes designated through these different methods. We also analyzed the variable of who designated the route in our later statistical models and found this variable to be nonsignificant in all models. Thus, in defining our sample, we sought to strike a balance between having a sample large enough to provide reasonable statistical power, selecting routes that were sufficiently active (i.e., “hot”), accounting for officer intelligence, and garnering officer support for the project.
Next, these 117 identified routes were randomly assigned to one of three conditions using computer generated random numbers (see Shadish, Cook, & Campbell, 2002). All of the assignments were followed carefully by the MPD. First, 45 of these 117 transit routes/destination points were randomly assigned to receive LPR enhanced patrol by the vehicle theft unit, another 45 routes were assigned to the same specialized vehicle theft unit for patrol and surveillance without the LPRs (in these routes, the officers did manual plate checks through their car mounted computer terminals), and 27 routes were assigned to normal patrol (the control condition). 9 Our objective was to assess the effectiveness of LPR technology—not special units versus nonspecial units. Therefore, we included two types of control groups that would not use the LPR equipment: one group would be a specialized vehicle theft unit doing manual license plate checking and another group would be regular patrol units doing manual license plate checking.
Procedures were also established to monitor the integrity of the assignment process (and monitor for expectancy, novelty, disruption, and local history) and to measure and statistically control for any contamination (especially for hot spots contiguous with each other). We were able to use the LPR equipment, which provides a GPS coordinate for every license plate scan, to check that the officers were using the LPR equipment to assess the integrity of the treatment assignment process and assess if officers strayed out of their assigned areas (which none did, except for a few emergency cases where the vehicle theft unit was needed to provide backup in a few high-level calls-for-service [CFS] related to violent crime). The officers also maintained logs to document their time at the hot routes, deviations from the study protocol, and the nature and results of any “hits” from the LPR and manual checks (see the “measures” section below). Our team also conducted detailed interviews and “ride-alongs” with the vehicle theft unit officers and other patrol officers to assess their use or nonuse of the LPR equipment and conduct treatment integrity checks (e.g., query them on their adherence to the study protocols). No problems were revealed through these treatment integrity checks.
Randomization
We used a stratified random allocation procedure (see Boruch, 1997), and randomized hot spot transit routes within statistical “blocks” to allow for the likely substantial variation across places (Weisburd & Green, 1995). This type of randomized block design, of allocating cases randomly within groups, minimizes the effects of variability on a study by ensuring that like cases will be compared with one another (see Fleis, 1986; Lipsey, 1990; Weisburd, 1993). Prestratification ensures that groups start out with some identical characteristics and will ensure that we have adequate numbers of places in each of the cells of the study. We used four stratification variables: length of hot route, speed limit of route, ease of surveillance for running plate checks (as graded by MPD officers/detectives), and whether the route was determined based on geographical analysis or by designation by a detective/officer. We divided the 30-week intervention period, which spanned from August 2008 through March 2009, into 15 biweekly periods. Routes selected for intervention by the vehicle theft unit (both the LPR routes and manual check routes) were randomly assigned to receive treatment during one of these biweekly periods (the officers worked 10-hr shifts 4 days a week, resulting in 8 days of treatment for each route). During each biweekly period, the unit worked three LPR routes and three manual check routes, each of which was patrolled daily for approximately an hour (each route received a minimum of 8 hr of intervention by four officers or 32 officer hours). The time of day during which the unit patrolled each route was also varied according to a preset schedule so that the unit would not work the same routes at the same time each day. 10 Hence, both the biweekly treatment period and time of day patrolled were determined randomly for each route. This type of design ensured that the places and times worked with LPR and without LPR were comparable.
Measures
We collected a variety of traditional police outcome measures of enforcement activity for the hot spot transit routes and surrounding blocks (to assess for displacement/diffusion effects) such as the number of arrests for auto theft (including stolen plates and theft of property from vehicles) and number of recoveries of stolen vehicles. Next, we collected a series of variables to describe the hot routes in our study based on public works/engineering data from the city of Mesa. Our length of route variable we categorized into three groups: short (.02 miles to .43 miles), medium (.44 miles to .89 miles), and long hot routes (0.9 miles to 2.01 miles). We calculated the average speed limit of route and created three categories(1 = 25 or 30 mph, 2 = 35 or 45 mph, 3 = 55 mph). We developed a 4-point rating scale to measure whether the hot route provided good opportunities for conducting surveillance (e.g., a large sign for the officers to hide their car behind). Two detectives used a 4-point scale to assess each route in our study (1 = very hard, 2 = somewhat hard, 3 = somewhat easy, and 4 = very easy to do surveillance) and achieved high interrater reliability (over .9). We also recorded whether the hot routes were determined by geographical analysis (coded as 1) or by recommendation from an auto theft detective (coded as 0) that this was an area that was traveled by auto thieves frequently.
We collected two main measures of auto theft based on CFS to the police (911 calls) for vehicle theft, and incidents of auto theft based on UCR. 11 We also worked with the MPD to develop a vehicle theft/LPR database to track police contacts and other activity associated with the LPR use and manual license plate checks. For both the LPR and manual check treatments, the vehicle theft unit collected data on the number of plates scanned or typed, the number of “hits” (i.e., number of recovered vehicles and license plates detected or recovered), date and time data on these “hits,” whether the vehicle was occupied or empty at the time of the “hit,” number of persons arrested, and the number of hours spent scanning or checking license plates during each treatment of a route. 12 For all of these above measures, we created a 500-foot buffer around each hot route. That is, a “hit” or a vehicle theft would “count” for a route for the purposes of our research if it occurred either on the specific street of each hot route or within 500 feet of the hot route (e.g., this allows us to include parking lots along the route and other similar areas in the immediate proximity of the hot route). We believe it makes sense to include these areas within 500 feet of the hot route, for they were covered by the officers patrolling these routes.
Our crime outcome measures were collected for the two-week period of the intervention for each route and for the 2-week period immediately after the intervention. We also had a pre-intervention measure for the 2-week period the year before the intervention was implemented. We used the year before the intervention as a control variable (as opposed to the 2-week period immediately preceding the interventions), for we were concerned with possible contamination. That is, we wanted to avoid our pre-intervention measure from being distorted from the effects of our interventions in nearby routes during the 2-week period prior to the intervention via possible displacement or diffusion of benefits. Our postintervention measure of only 2 weeks was selected to not only correspond to the 2-week intervention period but also because we believed (and still do) that the effects of the intervention are not likely to last beyond a short time frame. That is, it is hard to imagine implementing a 2-week intervention that could create effects beyond a short period of time. If effects are demonstrated for the 2-week period post intervention, we believe that will provide a justification for expanding the intervention beyond 2 weeks and the corresponding follow-up tracking period.
Hypotheses
In an operational environment, even with all the potential problems that can occur in using the LPR equipment, we hypothesize that that LPR system will be able to check more license plates than a manual approach. Our second hypothesis is that LPR system will lead to more “hits” for vehicle theft crimes than the manual checked routes, more “hits” for stolen plates, more arrests for stolen cars, and more recoveries for stolen vehicles. Our third hypothesis, based on place-based theories of crime (Felson 1994; Sherman et al., 1989; Sherman & Weisburd, 1995; Weisburd, 2002, 2008; Weisburd et al., 2009), was that by using a special auto theft unit equipped with LPR systems on small areas of high crime activity that we would be able to reduce auto theft (as measured by calls for service and UCR), compared to the manual checking approach and a control group of standard patrol.
Results
The first sets of analyses (see Tables 1–3) describe the key analytic variables and summarize the nature of the distribution of our data. Table 1 includes means and standard deviations for continuous/interval-level variables that describe the characteristics of the study hot routes for the three study groups (LPR, manual, and control). Table 2 presents means and standard deviations for continuous/interval-level variables for the three study groups (analysis of variance [ANOVA] results are presented in the text) for the period before, during, and after use of the LPR for outputs related to the use of the LPR equipment. Table 3 presents counts, percentages, and chi-square results for auto theft crime data based on CFS and UCR data.
Means (Standard Deviations) for Three Study Conditions and Entire Sample

* = p <.05, ** = p < .01
Comparison of Counts/Percentages for Key Analytic Output Variables Related to LPR use

* = p <.05, ** = p < .01
Means (Standard Deviations) for Three Study Conditions and Entire Sample for Auto Theft

aThere were 117 routes in the study. However, for our 15 highway routes we do not have crime measures (generally highway routes are not noted as location points within MPD’s databases), leaving us with complete data for these measures on fewer cases (n = 102).
Analysis for Pretreatment Differences Across Three Study Conditions
As seen in Table 1, no pretreatment differences emerged in our three study conditions based on the length of the routes, speed limit of the routes, potential for effective surveillance, whether the routes were determined by GIS analysis or officer/detective nomination, pretreatment UCR crime levels, or pretreatment calls-for-service levels. The evidence from Table 1 suggests that our random assignment process worked as planned and created comparable intervention/control conditions.
Bivariate Models
Effects of the LPR, compared to manual checking, on plates scanned, “hits,” recoveries, and arrests
First, we found support for Hypothesis 1. Not shown in the tables, the vehicle theft unit when using the LPR (457,369 total plates checked or 10,164 on average across the LPR covered routes) conducted statistically more (F = 128.8[1,88] p < .001) license plate checks (7.74 times more) than when the same unit did manual plate checking (59,073 total plates checked or 1,313 on average across manual routes). The routes with the LPR had statistically (2.7 times) more total hits for stolen cars crimes (see Table 2 below) than the manual routes (16 vs. 6; χ2 = 3.7, p < .05). The routes with the LPR had eight hits for stolen plates (see Table 2) compared to statistically fewer (zero) hits for stolen plates for the manual routes (χ2 = 10.3[1], p < .01). The routes with the LPR had four recoveries for occupied stolen vehicles (see Table 3) compared to (marginally) statistically fewer (zero) recoveries for occupied stolen vehicles for the manual routes (Fisher’s exact test, p < .05). The routes with the LPR had six recoveries for unoccupied stolen vehicles compared to a statistically similar number of recoveries (five) for unoccupied stolen vehicles for the manual routes (χ2 = 1.5, n.s.). The routes with the LPR had three arrests for stolen cars (see Table 2) compared to statistically fewer (zero) arrests for stolen cars for the manual routes (χ2 = 4.3[1], p < .05). The routes with the LPR had one arrest for stolen plates (see Table 2) compared to zero arrests for stolen plates for the manual routes (a nonstatistically significant result of χ2 = 1.4, p = .24). Thus, our Hypothesis 2 was supported, for by nearly every measure, the productivity of the vehicle theft unit was several times higher when using the LPR devices.
Effects of the LPR on levels of vehicle theft: Vehicle theft during the intervention/treatment weeks
To begin our assessment of Hypothesis 3, Table 3 shows the average number of vehicle thefts, as defined by 911 calls and UCR, for the LPR and manual check groups during three successive periods: the 2 weeks prior to the intervention, the 2 intervention weeks, and the 2 weeks following the intervention. To provide a comparator for the treated hot routes, control routes were also randomly assigned a “treatment” biweekly period (from among the 15 biweekly periods during which the interventions were implemented). Thus, we compare changes in vehicle theft in the treated routes during their intervention and postintervention weeks (which were selected randomly) to changes in the control routes during randomly selected weeks.
No statistically significant differences were observed (see Table 3) across the LPR, manual, and control groups based on calls for service (LPR = .65, manual = .38, and control = .57; F = .956, df = 2,99; p = .39, n = 102) or UCR (LPR = .30, manual = .26 and control = .26; F = .081, df = 2,99; p = .92, n = 102) for vehicle theft during the intervention/treatment weeks.
Effects of the LPR on levels of vehicle theft: Vehicle theft during the 2 weeks postintervention period
To begin our assessment of Hypothesis 3, we observed no statistical difference in the number of vehicle thefts based on CFS (see Table 3) during the 2 weeks postintervention period (F = 2.62, df = 2,99; p = .08, n = 102) for routes assigned to the LPR group (.70), manual checks (.08) on license plates, or to the control group (.35). However, we observed a statistically significant difference (see Table 3) across the LPR, manual, and control groups based on UCR (LPR = .25, manual = .05 and control = .04; F = 4.73, df = 2.99; p = .01, n = 102) for vehicle theft during the 2 weeks postintervention period. The LPR group had a slightly higher number of vehicle thefts (based on UCR) in the 2-week period post intervention compared to the manual plate checking group or control group. 13 Table 3 also shows that the direction of changes in vehicle theft from the 2-week pre-intervention period to the intervention weeks and from the intervention weeks to the postintervention weeks were not indicative of treatment effects from LPR use. Vehicle theft dropped in all three groups from the pre-intervention to the intervention weeks. In the postintervention weeks, the LPR routes had a slight increase in vehicle theft, while the manual and control routes experienced further declines.
Multivariate Models
Although not strictly necessary because we are working with experimental data, we will also introduce a set of covariates to our vehicle theft crime models. 14 Introducing covariates is increasingly common in analyzing data from randomized experiments (Patel, 1996). The introduction of covariates allows us to assess the role of substantively interesting variables on vehicle theft and simultaneously improve the precision of the treatment comparisons and correct for any major imbalances in the distribution of these covariates across the treatment and control groups that may have occurred due to chance (Armitage, 1996). Adding covariates also can help adjust for the natural variation between cases within the comparison groups (Gelber & Zelen, 1986).
To follow is an examination of the effectiveness of the LPR equipment in reducing vehicle theft (UCR) incidents and CFS for vehicle theft using negative binomial regressions. We chose the negative binomial (over the Poisson) 15 distribution based on the evidence in Table 3 that for our outcome variables the variance of outcomes is larger than the mean. 16 In addition, we rely on the results of several post hoc procedures that compare the fit of these different models (i.e., how well the distribution of counts in the raw data is approximated by the distribution of counts predicted by the model). 17
In order to enhance the statistical power and precision of these models, we created a panel database pooling data from all routes over the 15 biweekly intervention periods, the 2 weeks before the experiment, and the 2 weeks after the experiment. We included data points for the weeks before and after the experiment in order to examine pre–post changes and lagged effects for routes that were treated during the first and last periods of the experiment. This yielded a total of 102 × 17 = 1,734 data points after the removal of the freeway routes (discussed earlier). 18
Impact of LPR on vehicle theft (UCR) incidents based on count modeling
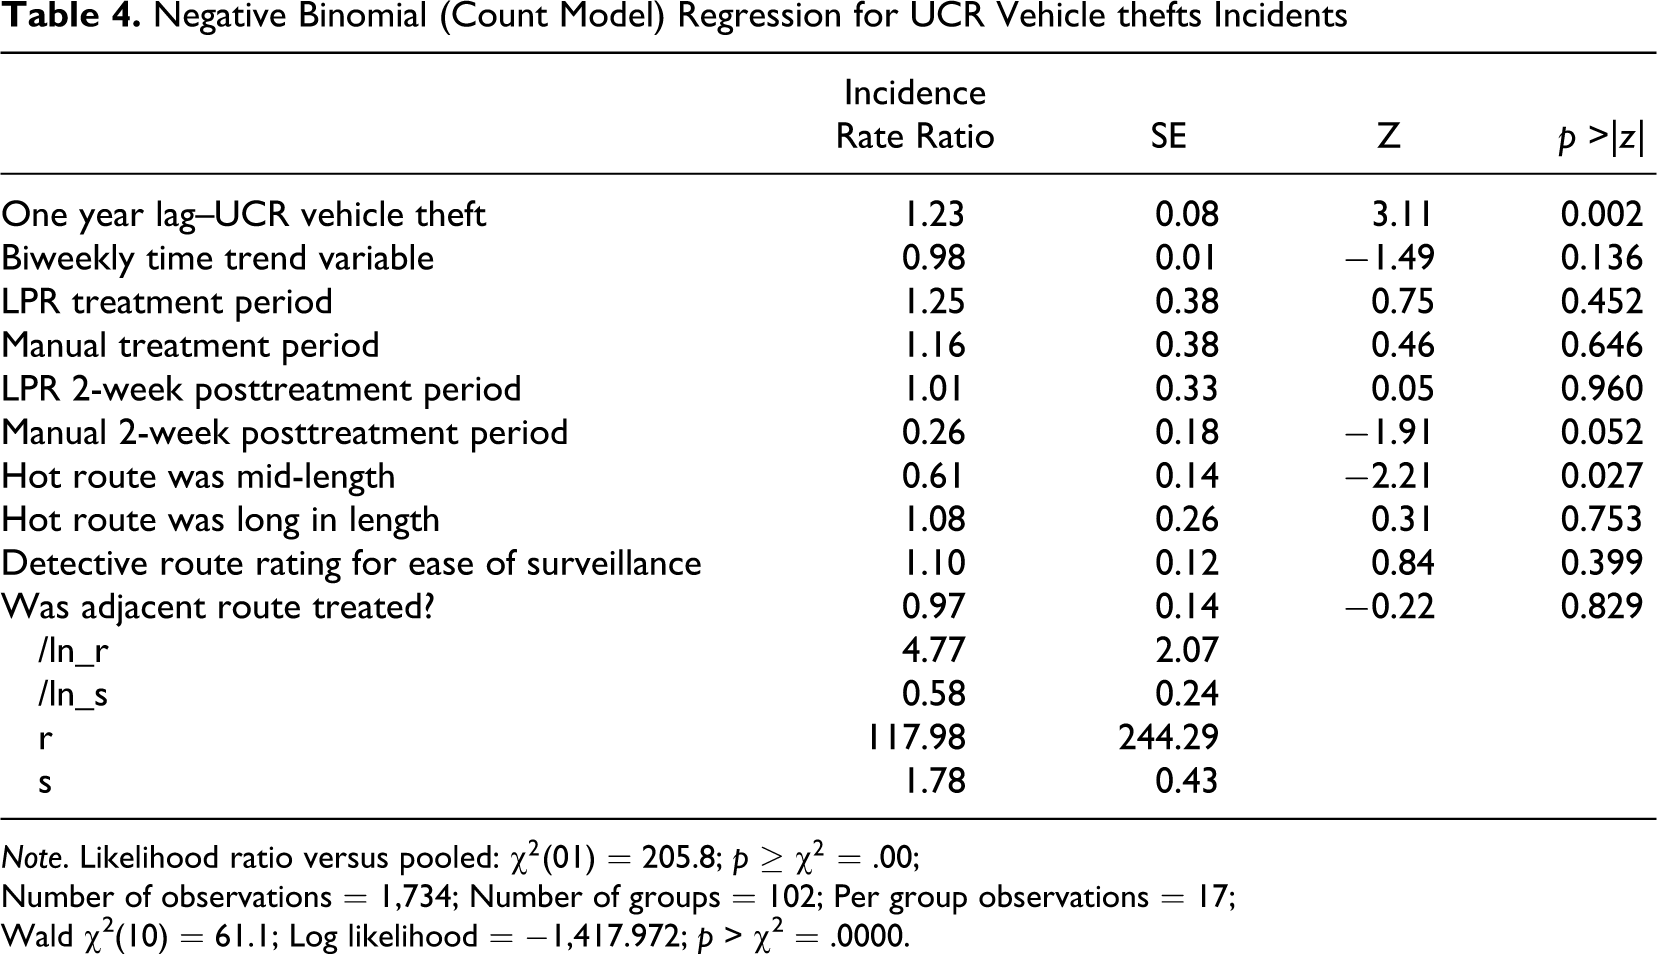
In Table 4, we present part of our test of Hypothesis 3 and show the results of the impact of the randomly assigned treatment on UCR vehicle thefts within a Negative Binomial Regression count model, controlling for time period, adjacent hot routes, and a number of hot route characteristics, including length, visibility, and prior levels of vehicle theft. Note that our measure of lagged vehicle theft for each route and biweekly period corresponds to that route’s level of vehicle theft during the same biweekly period of the prior year. We used this seasonally lagged measure rather than the immediately prior 2 weeks because of the possibility that the latter measure would be contaminated by displacement or diffusion effects stemming from interventions in nearby routes. As one measure of possible displacement or diffusion effects, the adjacent route indicator represents, for each route and time period, the number of adjacent routes that were being treated simultaneously (i.e., receiving LPR or manual patrol by the vehicle theft unit). The biweekly indicator controls for common time trends (vehicle theft was declining in Mesa throughout the study period).
Negative Binomial (Count Model) Regression for UCR Vehicle thefts Incidents
Note. Likelihood ratio versus pooled: χ2 (01) = 205.8; p ≥ χ2 = .00;
Number of observations = 1,734; Number of groups = 102; Per group observations = 17;
Wald χ2(10) = 61.1; Log likelihood = −1,417.972; p > χ2 = .0000.
Statistically significant predictors of vehicle thefts were the prior seasonal vehicle theft count and the length of the hot route. 19 Hot routes that had higher rates of vehicle theft 1 year prior had more vehicle thefts, while mid-length routes (.45 to .9 miles) experienced fewer vehicle thefts, relative to short-length hot routes (under .45 miles). This model also includes two treatment effects: the impact of assigned treatment during the treatment weeks and the impact of assigned treatment in the 2 weeks after treatment. After controlling for other factors, we see a statistically significant 74% reduction in the odds of a UCR vehicle theft in the 2 weeks after treatment in manually treated hot routes (p = .05) compared to the control group. Additional modeling (not shown) indicated that this effect faded after the initial 2 weeks following the manual check patrols. 20
Impact of LPR on vehicle theft CFS based on count model
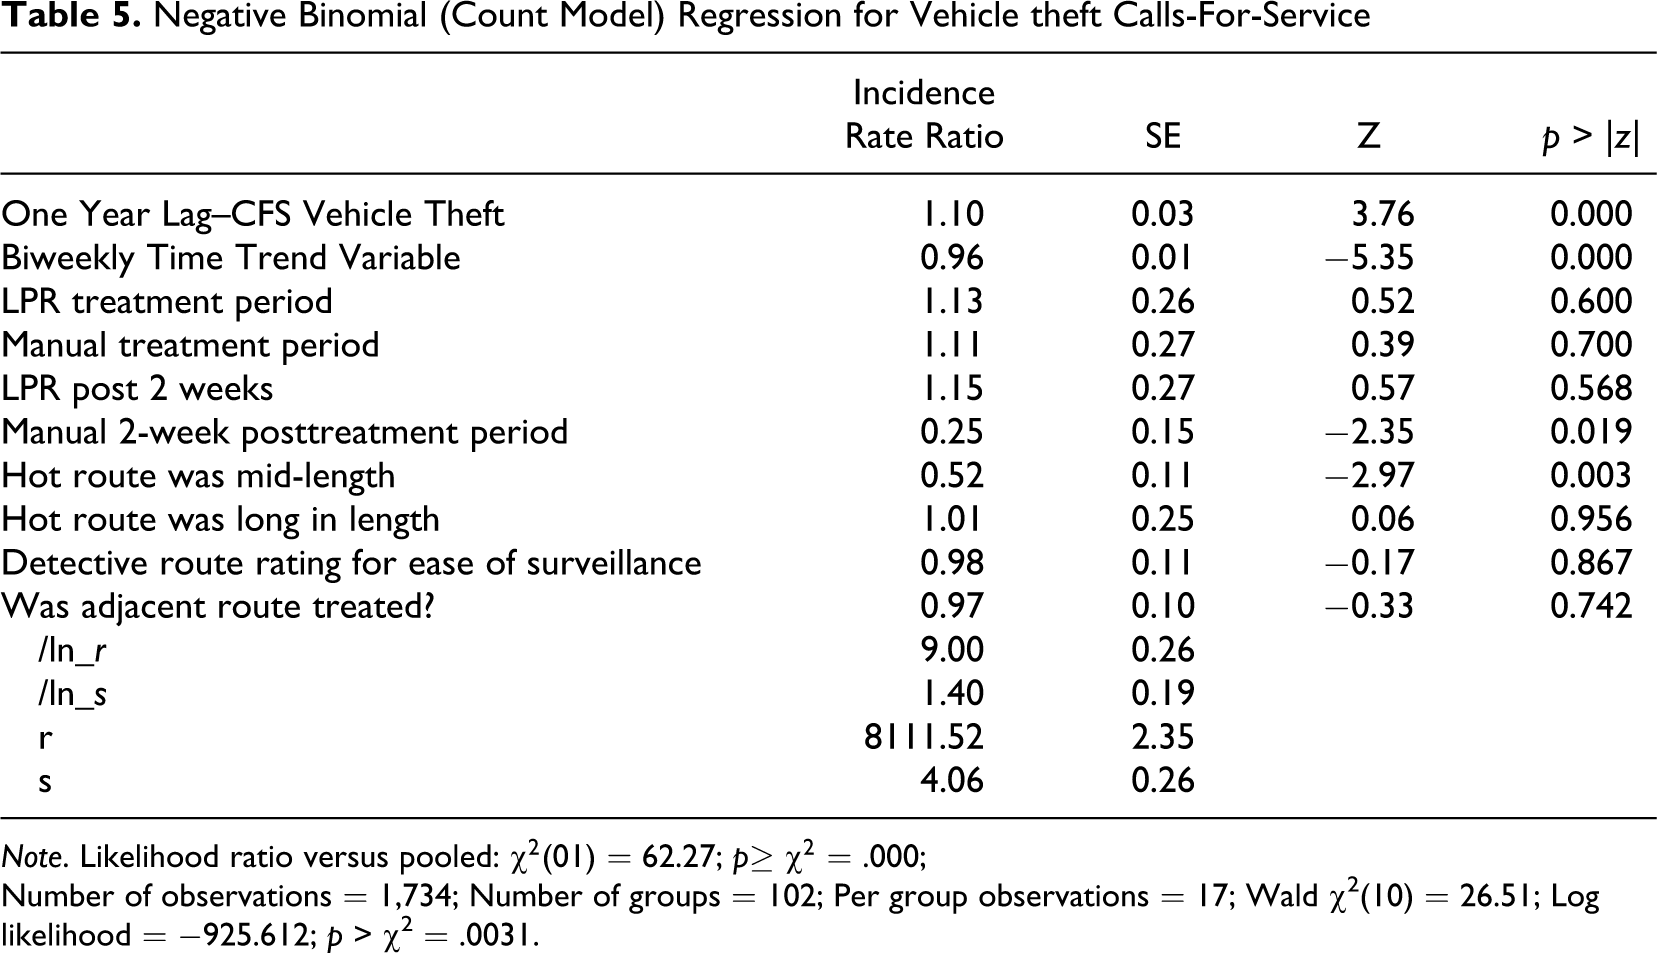
To test the other part of Hypothesis 3, the impact of assigned treatment on vehicle theft CFS is presented in Table 5. As in Table 4, treatment impact is assessed through two variables, one for the period of treatment delivery and the other corresponding to the 2-week period posttreatment. Similar to the results for UCR reported vehicle theft, the seasonal 1 year prior vehicle theft CFS rate is significantly related to the number of calls. Hot routes with higher vehicle theft rates in the prior year continue to have more CFSs for vehicle theft. In addition, mid-length hot routes tend to have fewer vehicle theft CFSs, relative to shorter hot routes. Also, our time trend variable is statistically significant, indicating that as the experiment progressed the incidence rate of CFSs for vehicle theft generally declined across all routes. The assigned treatment (either manual or LPR) did not have a statistically significant impact on vehicle theft CFSs relative to controls during the treatment period. However, although LPR hot routes do not see a significant change during the post 2-week period, the manual group witnessed a statistically significant decline. Manual hot routes in the post 2-week period after treatment had decreased odds of having a CFS for vehicle theft by 75% (1 minus the incidence rate ratio of .25) compared to the control group. As with the UCR data, subsequent modeling (not shown) revealed that this effect was temporary.
Negative Binomial (Count Model) Regression for Vehicle theft Calls-For-Service
Note. Likelihood ratio versus pooled: χ2(01) = 62.27; p≥ χ2 = .000; Number of observations = 1,734; Number of groups = 102; Per group observations = 17; Wald χ2(10) = 26.51; Log likelihood = −925.612; p > χ2 = .0031.
Visual Assessment of Potential Displacement
To conclude this section, we assess if vehicle theft crime displacement or diffusion of benefits occurred from our targeted routes to areas adjacent or near these routes. Given the general lack of effects in the models above, particularly for the LPR treatment, displacement, and diffusion seem unlikely. The statistical nonsignificance of the indicator for treatment in adjacent routes also provides some indication that neither displacement nor diffusion occurred. We examine displacement in the areas adjacent to our study hot routes that are beyond the 500-foot buffer of the hot route but also within 2,500 feet of the respective hot route. If displacement were occurring, we would expect there to be statistical changes in these areas immediately adjacent to the hot routes from the 2-week period before the intervention to the intervention period and possibly to the 2 weeks postintervention. Table 6 presents the mean results for outcomes in the area immediately adjacent to the route. We observed no statistically significant differences for any of the three conditions in these areas from the pre-period to the intervention period or 2-week post period. For example, our data on CFS for the LPR route revealed little change from the period prior to LPR treatment (3.05 CFS) to the period of LPR treatment (2.44 CFS) to the period 2-weeks post treatment (2.46 CFS). Also, the reduction in postintervention incidents and calls in the manual check routes does not seem to have produced clear displacement or diffusion patterns; UCR incidents in areas adjacent to the manual routes went up during these weeks, while CFS went down.
Visual Assessment of Mean Scores for UCR and Call-for-Service Outcomes: Potential Crime Displacement and Diffusion of Benefits

Discussion
Our article focuses on a relatively new innovation for use by law enforcement in addressing vehicle theft. In general, the police have struggled addressing vehicle theft with only about 10% of vehicle thefts resulting in an arrest nationwide (FBI, 2010). LPR technology has been advanced as an innovation which could serve as a useful tool for law enforcement in addressing this serious problem. While it is a promising technology, that seems to be growing in use (Koper et al., 2009; Lum et al. 2010), there has not been much research on the effectiveness of LPR systems in addressing vehicle theft. Beyond basic descriptive/pilot research with LPR systems in the United Kingdom and United States, there has been extremely limited research on LPRs or other strategies to reduce auto theft that has applied randomized experimental designs or at least rigorous quasi-experimental methods. Our study was designed to advance the field of policing research through a large-scale randomized experiment in Mesa, AZ. We also used the framework of a well-established crime at place theory, known as crime hotspots and the “journeys-after-crime” literature, to place the LPR equipment in locations best suited for catching auto thieves. More broadly, our study also adds to the rather limited evaluation literature on technology and policing (see Koper et al., 2009).
The hypothesized benefits of the LPR system are expected to be realized by law enforcement because of the large number of plates that the system is supposed to be able scan. Therefore, the first hypothesis we tested was to see if this first premise was true. We compared LPR scanning to manual plate checking, controlling for the use of a special vehicle theft unit. We found that the LPR achieves its most basic purpose of increasing the number of plates scanned compared to manual plate checking, about 8 times more plates scanned with the LPR. The tests that followed examined if the police could achieve a variety of benefits associated with this extra plate scanning (our Hypotheses 2 and 3).
Our results supported our Hypothesis 2 that the routes with the LPR had more total “hits” for vehicle theft crimes than the manual checked routes, more “hits” for stolen plates, more arrests for stolen cars, and more recoveries involving occupied stolen vehicles. Next, based on place-based theories of crime (Felson 1994; Sherman et al., 1989; Sherman & Weisburd, 1995; Weisburd, 2002, 2008; Weisburd et al., 2009), our third hypothesis was that by using a special auto theft unit equipped with LPR systems on small areas of high crime activity that we would be able to reduce auto theft, as measured by calls for service and UCR. As discussed in this section, while we do not find that the LPR was able to reduce auto theft we did find that another hot spots policing approach (the same auto theft unit doing focused police work but doing manual checking of license plates) was able to reduce auto theft.
When examining the weeks of the interventions and a 2-week period immediately after the interventions, we first observed only one bivariate statistically significant difference across the control, LPR, and manual groups based on calls for service or UCR. That is, we observed that the LPR group had a slightly higher (but statistically significant) number of vehicle thefts (based on UCR data) in the 2-week period postintervention compared to the manual plate checking group or control group. To improve the precision of the treatment comparisons for our vehicle theft outcome measures, we examined these results through multivariate modeling. In our later multivariate models, where we control for pre-intervention levels of vehicle theft and other route characteristics, we no longer observe a difference between the LPR route and the control group on this measure. However, the manual group does emerge as having lower 2-week post intervention vehicle theft levels (based on UCR data) than the control group.
Also, the multivariate test of the randomly assigned treatment revealed a significant decline in CFS for vehicle theft in the 2 weeks after treatment in manually treated hot routes compared to the control group. Also, we found no vehicle theft crime displacement or diffusion of benefits from our targeted routes to areas adjacent or near these routes related to any of our models. Our results suggest that a specialized vehicle theft unit can have an effect on reducing vehicle theft compared to the control group, but only when this group does manual checking of plates as opposed to using the LPR equipment. This would appear to be an illustration of “residual deterrence” associated with short-term “crackdowns” at hot spots (Sherman, 1990). Why this occurred in the manual check routes but not in the LPR routes is not entirely clear. Based on our discussions with the officers in this specialized unit, we believe the vehicle theft unit possibly had a more visible presence when they were doing manual checking as opposed to when they were operating the LPR equipment. The vehicle theft unit spent more time roaming the streets and parking lots (both residential and commercial) of their respective routes—often at slow speeds and with frequent pauses—when they were doing manual checks. When using the LPR, in contrast, they were more likely to make quick passes through side streets and parking lots and then remain at fixed positions. The additional roaming with manual checks may have created more of a preventative effect on vehicle theft by being more noticeable and unpredictable and by making it more obvious to onlookers that the officers were checking cars. The greater use of fixed surveillance points with the LPR equipment may have been less threatening to vehicle thieves because it was easier to avoid.
Limitations
Like other randomized control trials, our study has a number of strengths related to the strong counterfactual we created. We have good evidence that our random assignment process worked as planned (we detected no pretreatment differences and experienced no misassignments connected with the random assignment process) and created comparable intervention/control conditions. We have a high degree of confidence in our ability to describe what would have happened to the treatment group if it had not been exposed to the treatment. One downside of our experimental assignment process was the creation of somewhat artificial conditions under which we asked the MPD to operate. While the officers in our study carefully followed the assignment pattern dictated by the experiment, the resulting “hit” rate appears to have been constrained. Despite their expressed strong dedication to the project, the officers did not seem to like being confined to our designated hot routes. While our approach is not very different from other hot spot policing strategies used by the MPD and other agencies, the officers would have preferred to move more naturally through the city’s high crime areas (e.g., work many more hot areas in a given shift and move away from hot areas that happen to be very slow on a given night).
After the study was completed, the Mesa Police wanted to assess how many “hits” they might expect on any given shift with the same vehicle theft unit, without the constraints of confining the officers to specific routes on the shift. During an 8-day period, the same vehicle theft unit was able to get 12 “hits” or 1.5 hits per shift (based on using the LPR in any hot route throughout the whole city) compared to the study period hit rate for the LPR of 24 “hits” over 120 days (or 0.2 “hits” per shift). This does not invalidate our findings, for all of the hot routes (LPR, manual, and control) were similarly constrained. However, it does provide some evidence that more “hits” could potentially be achieved by LEAs not constrained by following research protocols (i.e., under normal operating conditions).
Another potential limitation of our study is the number of routes included in our research. Even in a city such as Mesa, AZ, that has a fairly high vehicle theft rate (within the top 10 in the United States), we struggled to identify 117 hot routes for vehicle theft. While a sample size of 117 is not a small study, especially in this context, it does provide some limitations in statistical power. For example, while this study had a sample size comparable to or larger than that of many prior “hot spot” experiments (Braga & Bond, 2008; Braga et al., 1999; Mazerolle, Price, & Roehl, 2000; Sherman & Weisburd, 1995; Weisburd & Green, 1995), it is not very large compared to other experiments in criminal justice, which can have hundreds of cases (e.g., see Davis & Taylor, 1999, for a review of batterer treatment experiments). With only 117 cases and relatively low base rates, our statistical power was limited to finding medium (not small) effect sizes. In future research of this type, researchers may need to consider using multiple cities.
The intensity of our intervention was also fairly modest. Each LPR and manual hot route received 8 days of “treatment” for each route for 1 hr per day for a total of 8 hr of intervention. With the level of resources available for this project, a greater amount of intensity was not an option. However, it is possible that if the “treatment” dosage were higher that greater effects might have been uncovered.
Another point worth considering is that we conducted our study during a 10-year low in vehicle theft in Mesa. In 1999, there were 2,851 vehicle thefts in Mesa, which increased for 3 successive years until reaching a high of 5,089 in 2002 and these numbers ended up dropping to 2,047 in year 2008 and 1,303 in 2009 (the time frame of our study). While both the experimental and the control routes were subject to the same general conditions that led to this drop in vehicle thefts and this does not impact the comparability of our groups (i.e., internal validity of our study), this may affect the generalizability of our findings. To date, there have not been many conclusive explanations for this drop (e.g., demographic shift in population, waning of drug problem, introduction of new policing programs, and improved security measures; Farrell, Tseloni, Mailley, & Tilley, 2011). However, Mesa has a general reduction in crime over recent years across most of their crime categories. At this point, it is an open question what results we would have seen during times of greater criminal activity.
Another issue is the relatively recent introduction of LPR equipment to policing. Over time, as law enforcement grows in its experience with the LPR, new strategies may emerge that will improve the “hit” rate of the LPR equipment. Also, this might also help with officer morale. Given the relatively infrequent level of “hits” associated with vehicle theft surveillance work, the officers can get bored or lose their focus.
Finally, there are still technological advances that are needed to make sure that the most current data on vehicle thefts are being sent to the LPR equipment. In addition to the traditional delays associated with vehicle theft reporting (e.g., victims may be unaware for many hours that their vehicle is missing and/or delay reporting their car stolen because they think someone may have legitimately borrowed the vehicle), there may be further delays in the entry of reports into the LPR system if it does not have wireless connectivity to receive reports in real time (this was a limitation to the LPR system used in this study). The value of LPR will also be affected by the types and volume of data fed into the system (e.g., incorporation of warrants, inclusion of data from other jurisdictions, etc.). There are also other technological issues that still need to be resolved. For example, false positives can still be a problem (e.g., out of state plates that are similar to a plate stolen in another city) and misreads of dirty license plates or misreads from scanning plates across multiple lanes of traffic can present difficulties. There are also technical failures associated with the LPR equipment (e.g., due to extreme heat).
Policy Implications for Policing
Despite some of the issues outlined in our limitations section, we believe our results demonstrate that LPR technology holds some promising benefits for law enforcement. Some of these important benefits include increasing the number of plates that the police can scan, increasing the number of “hits” for vehicle theft and “hits” for stolen plates, increasing the number of arrests for stolen cars, and increasing the number of recoveries involving occupied stolen vehicles. However, we did not find evidence that the LPR reduced actual vehicle theft rates for our targeted areas. Instead, we found that the same special vehicle theft unit conducting manual plate checks was able to reduce vehicle theft rates. The fact that we did not lower vehicle theft rates with the use of the LPR equipment is in some ways not too surprising. The specialized vehicle theft unit operating the LPR equipment consisted of only four officers and a supervisor and each LPR route received only a modest “dosage” (8 hr, in the evening, of intense surveillance by four officers over a 2-week period). Given that level of intensity, and the newness of the LPR system (both in terms of officer familiarity with the technology and some technological limitations with the technology itself), we believe that the positive findings that did emerge (i.e., more plates scanned, “hits,” arrests, and recoveries) are notable, especially in a field where so little research tested interventions exist. We now have evidence that at least one strategy, LPR use, can achieve some demonstrable benefits in addressing vehicle theft.
However, given the cost of each device (about $20,000) and our use of four LPR that is an investment of nearly $80,000. Regardless of potential impact, cost alone is likely prohibitive in the current economic climate, where many police departments (especially in Arizona) are under such budgetary pressure that layoffs of personnel are being considered. And the other side of the cost question is return on investment. If a police chief asks, “what do I get in return for my $80,000 investment?” the response from this study is a hit rate of 24 hits divided by 457,368 plates scanned or a hit rate of .00005 (or in terms of hours: 45 LPR routes × 8 hr each = 360 hours and this produced 24 hits; or 1 hit every 15 hr of use of the device). This is even less compelling given the outcomes produced by the special unit manual condition (8 hits), and the evidence of a deterrent effect with this condition. It could be reasonable for a police chief to conclude that his or her agency might be able to achieve the LPR hit rate simply by reassigning a small number of officers to the auto unit and increasing the rate of manual checking (thereby saving $80,000).
We also learned that another strategy, a specialized vehicle theft unit (even under modest dosage levels) working on small hot routes of criminal activity can achieve actual reductions in vehicle theft. Broad-based license plate checking, as opposed to the approach used by standard patrol of situational checking (e.g., a rear window of a car is down indicating a possible break-in), is associated with a number of benefits if done through LPR scanning (i.e., more plates scanned, “hits,” arrests, and recoveries) or manual checking (lower vehicle theft rates). That is, the specialized vehicle theft unit conducting manual plate checking (on as many plates as possible in a shift) is associated with lower vehicle theft compared to standard patrol that typically only conducts a limited amount of plate checking (and usually only when there is some evidence that warrants a check). Our work, at a minimum, demonstrates that focusing law enforcement resources on vehicle theft reduction at hot routes can achieve quantifiable positive results. This finding has implications for place-based theories of crime (Felson 1994; Sherman et al., 1989; Sherman & Weisburd, 1995; Weisburd, 2002, 2008; Weisburd et al., 2009). Braga’s (2005) review of hot spots policing programs suggested that our auto theft unit officers doing concentrated policing in small areas (either using the LPR or manual plate checking methods) would reduce crime (in our case auto theft). Our work provides partial support for this thesis regarding hot spots policing for the manual checking group but not the LPR group. As we discuss next, there may be elements of LPR surveillance work that depart from the principles of hot spots policing (in terms of intensity and presence in the community) that might suppress the crime prevention effects of hot spots policing.
The implications for future law enforcement applications is to figure out a strategy that maintains the documented benefits of LPR use by a specialized unit (i.e., more plates scanned, “hits,” arrests, and recoveries), but also achieves the benefits associated with manual checking by a specialized unit (i.e., lower vehicle theft rates). More research will be needed to determine the best strategies to be used by officers operating the LPR equipment, including which elements present in the manual checking approach can and should be adopted by officers using the LPR. For example, by necessity, officers doing manual checking need to use more roaming strategies (as opposed to fixed point scanning) to be able to view the license plates of fast moving cars. This stands in contrast to the LPR approach used by the MPD in our study, and by other LEAs, which involves more fixed point scanning. The fixed point scanning approach was adopted to maximize the number of plates scanned with the LPR equipment. However, by sacrificing some of the number of plates scanned with the LPR, in favor of more roaming surveillance and other strategies to increase the officers’ presence (a typical by-product of hot spots policing), perhaps more vehicle theft reduction may occur. One strategy to consider is to having less expensive non-sworn officers operate the LPR equipment and have sworn officers do the more intensive and more visible manual plate checking to enhance the crime prevention effects of hot spots policing. Under this scenario, when non-sworn officers get a “hit” for stolen vehicles they could then call it in to nearby patrol officers.
Implications for Future Research
There are some important next steps for researchers and funding agencies. First, our research demonstrates the ability of researchers to implement randomized experiments with law enforcement technology. Aside from being the first randomized experiment with LPR equipment, this is one of the few randomized experiments with any law enforcement technology. Our use of a randomized experiment led to relatively unambiguous results and was implemented with little disruption to police operations. Especially in the case of a scarce resource (we only had four LPRs for the whole city of Mesa and could not use the technology across the entire city at once), the random assignment element of the experiment can be justified to law enforcement and city officials. That is, large portions of the city are not going to receive the benefits of the technology with or without the experiment. In this case, the experiment simply allocates the resource in a way that all portions of the city in need of the technology have an equal chance of receiving it.
Second, additional replication research is needed. Our study was only of one city. While Mesa, AZ, is a relatively large city, among the top 50 in the nation, evaluations should also be undertaken in the very largest urban centers of the United States and also in some of the smaller jurisdictions to confirm our findings in different contexts. The MPD is widely considered a very progressive and innovative agency. It is not clear how well other agencies not possessing those characteristics would do with the LPR equipment.
Third, additional testing and research should also be undertaken on other methods of deploying LPRs. For example, the LPR equipment could be mounted to a standard patrol car or fixed to a toll booth or city lighting pole. While these strategies may not lead to reductions in vehicle theft, they may yield other benefits associated with the LPR equipment. Future work should also extend to assessing the benefits of LPR use beyond recoveries of stolen cars, apprehension of vehicle thieves, and the reduction of vehicle theft. While technology limitations restricted our study to assessing only vehicle theft-related crime, other jurisdictions have the capability to use the LPR equipment to aid in apprehending fugitives, probation and parole violators, and those not paying court fines. These can be potentially important additional benefits associated with the LPR equipment that also need to be tested. In addition, future research should be careful to examine possible negative side effects of various LPR deployments. While we did not observe any changes in the number of police pursuits based upon LPR use in our study, a reviewer of this article noted that LPR systems could lead to more police pursuits as more vehicle theft is uncovered. That is, suspected stolen vehicles are typically the most common reason pursuits are initiated (Hoffmann & Mazerolle, 2005; Lum & Fachner, 2008) and a common reason criminals report fleeing from the police (Dunham, Alpert, Kenny, & Cromwell, 1998).
Fourth, as suggested by a reviewer of this article, future research should collect data on the hit-to-check ratio. For our study, we did not record how many places within each hot route that were checked. The data that we do present provide the reader some sense of the magnitude of the differences between manual and LPR checking but only at the hot route level not at the level of individual places (e.g., an apartment complex on the hot route). These new data would provide an additional measure of “success” as well as efficiency in terms of workload and potentially the amount of hours that can be recovered by switching from a manual system to an automated system.
Fifth, more research is needed to understand why the “hit” rates in our study were so low. Was it solely because of the low dosage (8 days of intervention for 1 hr each day by four officers)? Or perhaps there are limitations to the use of LPR with vehicle theft due to the natural delays in reporting vehicle theft to the police. Combining these factors with detection avoidance efforts by thieves (e.g., switching license plates) may suggest that there is a very small window of effectiveness for LPR. Future researchers should consider whether the future deployment of LPRs should be publicized more through a media campaign. If potential vehicle thieves were made aware of the technology and its deployment, perhaps a deterrent effect could be generated.
Finally, over time we might also expect the cost of this technology to lower substantially from the current pricing scheme (in the $20,000–$25,000 range) and lead to greater adoption of this technology by law enforcement. However, with the greater adoption is also likely to include greater legal scrutiny of the privacy rights of citizens associated with this equipment or charges of the invasion of “big brother.” As with any law enforcement equipment or strategy, the law enforcement community should look for careful empirical research to help provide guidance and insights into the effective and ethical use of this and other technology.
Footnotes
Acknowledgments
The authors thank the Mesa Police Department (MPD) for its strong commitment to the research project throughout the organization including the vehicle theft unit officers (Officers James Baxter, Joel Calkins, Stan Wilbur, and Brandon Hathcock), supervisory officer Cory Cover, Deputy Chief John Meza, and other MPD commanders. Also, the authors are very appreciative of Dr. Yongmei Lu for her work conducting geographic analyses.
Authors’ Note
Points of view in this document are those of the authors and do not necessarily represent the official position or policies of the U.S. Department of Justice or any other organization.
The authors declared no potential conflicts of interest with respect to the research, authorship, and/or publication of this article.
The authors disclosed receipt of the following financial support for the research, authorship and/or publication of this article: This project was supported by Grant No. 2007–IJ–CX–0023 awarded by the National Institute of Justice, Office of Justice Programs, U.S. Department of Justice.