



Abstract
This study examined the direct and moderating effects of alcohol outlet density, social disorganization, and land use on violence in a large college town whose economy is driven by the presence of a flagship state university. Empirical literature points to a consistent association between alcohol outlet density and assault density, and recent research has found social disorganization and land use to moderate the association in urban areas. However, little research has been done to determine whether similar associations hold outside large urban cities. Using geocoded data on assaults and alcohol outlets in Bloomington, Indiana, we estimated ordinary least squares and spatially lagged regression models to determine whether social disorganization and land use moderate the association between alcohol outlet density and assault. We found a consistent association between outlet density and assault density. In contrast to the findings from urban areas, however, the direct effects of social disorganization and of seven land use types on simple assault density were nonsignificant, nor was social disorganization associated with aggravated assault. Further, the relationship between alcohol outlet density and assault density was moderated by neither social disorganization nor land use. Ecological characteristics like social disorganization and land use may matter less in smaller cities and towns than they do in large urban cities, both in terms of direct effects and when accounting for the relationship between alcohol outlet density and violence.
Keywords
Introduction
This study examined the direct and moderating effects of alcohol outlet density, social disorganization, and land use on assault density in a large college town. Our study contributes to the empirical literature in two key ways. First, we extend the study of the association between alcohol outlet density and community violence rates beyond large cities, where nearly all of the research has occurred to date. Second, we test to see whether this association is moderated by important local community and area characteristics like social disorganization and land use. Consideration of these potential contextual effects has only recently appeared in the literature and, again, only in large urban settings.
The relationship between this intoxicating, yet legal substance and violence is a complex one. As Parker and Rebhun (1995) describe, American society has had longstanding ties to both alcohol and violence. Moreover, the public view of alcohol consumption is constantly in flux, depending largely on the level of harm that society attributes to alcohol consumption at the time. For example, in 17th-and 18th-century America, alcohol was highly regarded and universally consumed and the Puritans called it the Good Creature of God (Levine, 1984, p. 110). Economic, social, and political conditions in early 19th- and 20th-century America, however, changed public opinion of alcohol consumption. Physicians and clergy, the usual leaders in advocating reduction in alcohol availability in order to reduce alcohol-related harm (Snowden & Pridemore, 2008), noted the detrimental effect that heavy and hazardous alcohol consumption had on societal roles and order (Levine, 1984; Parker & Rebhun, 1995). Today, greater research attention to the detrimental effects of alcohol, and better communication of research findings to the public, has again focused public attention on its negative social consequences, including disrupted family ties, reduced economic productivity and efficiency, and violence (Klingemann & Gmel, 2001).
One of the earliest contemporary criminological works to address the role of alcohol in violence was Wolfgang’s (1956) study of criminal homicide. In this early study, Wolfgang found that a substantial proportion of homicide victims and offenders had consumed alcohol (53% of victims and 44% of both victims and offenders in all cases of homicide under investigation). Since the early 1980s, a substantial body of criminological, sociological, and epidemiological literature emerged on this topic. The association between alcohol outlet density and violence is a consistent finding in recent empirical studies from multiple disciplines (Britt, Carlin, Toomey, & Wagenaar, 2005; Gruenewald & Remer, 2006; Laranjeira & Hinkly, 2002; Lipton & Gruenewald, 2002; Livingston, 2008a, 2008b; Norström, 2000; Pridemore & Grubesic, 2012a; Roman, Reid, Bhati, & Tereshchenko, 2008; Zhu, Gorman, & Horel, 2004). To date, however, there are a couple important limitations to consider. First, most of the research on alcohol availability and violence has been carried out in large urban cities such as Chicago and Cincinnati (e.g., Block & Block, 1995; Pridemore & Grubesic, 2012a). There are theoretical reasons to believe, however, that associations that exist in urban areas may not hold in smaller cities and towns and in rural areas. For example, small towns and rural areas typically lack public transportation means, which means that the majority of people would be traveling to and from commercial areas (including bars, liquor stores, etc.) by either riding with someone or driving while under the influence of substances. This alone could provide a different type of opportunity for the alcohol and violence association to emerge. Second, most scholars have failed to consider potentially important contextual effects. We believe it is unlikely that the effect of alcohol outlet density on violence is uniform across neighborhoods with different structural characteristics. To date, only a few studies examined the moderating effects that neighborhood characteristics, like social disorganization or neighborhood deprivation, might have on the relationship between alcohol outlet density and violence (e.g., Costanza, Bankston, & Shihadeh, 2001; Pollack, Cubbin, Ahn, & Winkleby, 2005; Pridemore & Grubesic, 2012b). While recent research (Pridemore & Grubesic, 2012b, 2012c) reveals that both social disorganization and land use moderate the effect of alcohol outlet density on crime in a large urban city, there are no studies that test for these effects in smaller cities and towns in general, and college cities and towns in particular.
Literature Review
Association Between Alcohol Outlets and Violence
Out of necessity due to data availability, the relationship between alcohol outlets and violence is often studied using data from units of analysis whose boundaries are artificially imposed (e.g., zip codes, census tracts, census block groups, and census blocks). Typically, areas that are close to each other share similar levels of crime (Roncek & Montgomery, 1995), which is an example of Tobler’s more general first law of geography: “everything is related to everything else, but near things are more related than distant things” (Tobler, 1970, p. 236). Anselin (1988) proposed spatially informed statistical methods that could be used across different disciplines to control for the potential influence that spatial processes in neighboring areas can have on a variable of interest. Millar and Gruenewald (1997) specifically proposed statistical techniques that can adjust for the effect of spatial dependence on community-level alcohol studies. Gorman, Speer, Labouvie, and Subaiya, (1998) noted the need to use alternative statistical approaches to better examine the relationship between alcohol and violence, hinting that statistical methods used in previous studies did not account for Tobler’s first law of geography. Criminological scholars are increasingly more sensitive to the influence of space and place in violent encounters, and they are using increasingly sophisticated spatial techniques to better understand the relationship between alcohol outlets and violence. For example, Murray and Roncek (2008) explored the impact of using two different analytical methods (i.e., radial buffers and adjacency techniques) to measure geographical diffusion of assaults around bars, concluding that the results are dependent on the method used. Additionally, Grubesic and Pridemore (2011) moved beyond simply controlling for spatial autocorrelation and examined one aspect of the spatial nature of the relationship in their application of spatial proximity analysis.
Early empirical studies found a nonsignificant association between alcohol outlet density and violence (Block & Block, 1995; Gorman, Speer, Labouvie, & Subaiya, 1998), though more recent studies have indicated consistent evidence of this relationship (Britt et al., 2005; Gruenewald & Remer, 2006; Laranjeira & Hinkly, 2002; Lipton & Gruenewald, 2002; Livingston, 2008a, 2008b; Norström, 2000; Pridemore & Grubesic, 2012a; Roman et al., 2008; Zhu et al., 2004). The association between alcohol outlets and violence is usually strongest in smaller units of analysis (e.g., census block groups, census tracts), because using larger units of analysis (e.g., zip codes, cities, states) may obscure the fundamental nature of the localized effects of alcohol outlet density (Parker & Wolz, 1979).
Several empirical studies found a significant association between outlet density and assault rate (Alaniz, Cartmill, & Parker, 1998; Gorman, Speer, Gruenewald, & Labouvie, 2001; Reid, Hughey, & Peterson, 2003; Scribner, Cohen, Kaplan, & Allen, 1999), and changes in outlet density and changes in assault rate (Gruenewald, Freisthler, Remer, LaScala, & Treno, 2006; Livingston, 2008b). Additionally, a related genre of studies found that that the strength of the association varies by outlet type such as liquor stores and bars (Gorman et al., 1998; Gruenewald & Remer, 2006; Lipton & Gruenewald, 2002; Roman et al., 2008; Scribner, MacKinnon, & Dwyer, 1995). Off-premise alcohol outlets are also known as package-only stores and include liquor, convenience, and grocery stores. On-premise alcohol outlets, on the other hand, are those where consumption takes place at the outlet itself (e.g., restaurants, taverns, bars, social clubs, etc.). Scribner et al. (1995), for example, controlled for indicators commonly used to measure social disorganization and found that the rate of assaultive violence was significantly associated with the density of both off-premise and on-premise alcohol outlets, although the effect size was higher for the density of off-premise alcohol outlets (β = .56) relative to the density of on-premise alcohol outlets (β = .36). More recent studies confirmed that off-premise alcohol outlets have a stronger relationship with violence compared to the effect of bars and restaurants. For example, Branas, Elliott, Richmond, Culhane, and Wiebe (2009) found that being in an area of high off-premise alcohol availability significantly increases the risk of being assaulted with a gun, while being in an area of high on-premise alcohol outlet availability does not change the risk. Costanza et al. (2001) controlled for elements commonly used to measure social disorganization and spatial autocorrelation and confirmed that the density of package-only (i.e., off-premise) outlets increases the risk of violent crime but that the density of taverns (i.e., on-premise) had no effect. Additionally, Gruenewald et al. (2006) found that assault rates were significantly related to local densities of off-premise alcohol outlets but not to the density of on-premise alcohol outlets. Similarly, Pridemore and Grubesic (2012a) found that the association between alcohol outlet density and violence rates was stronger for off-premise alcohol outlets relative to on-premise alcohol outlets.
Social Disorganization, Alcohol Outlets, and Violence
Social disorganization is a characteristic of neighborhoods that has consistently been found to have direct effects on neighborhood crime rates (Sampson & Groves, 1989; Sampson, Raudenbush, & Earls, 1997; Shaw & McKay, 1942). Additionally, social disorganization has been found to moderate the association between alcohol outlet density and assault density in a large city (Pridemore & Grubesic, 2012b). Specifically, the strength of the association between alcohol availability and violence is greater in disorganized communities (Roncek & Pravatiner, 1989) and weaker or nonexistent in organized communities (Pridemore & Grubesic, 2012b).
We might expect social disorganization to moderate the effects of alcohol outlet density on violence for several reasons. First, disorganized communities lack informal social control mechanisms to monitor and control effectively the behavior of community members, including outlet patrons. Communities with an insufficient amount of collective efficacy are unable to put a stop to deviant or criminal behavior (Sampson & Raudenbush, 1999), which can send a message that norms within such communities are ambiguous and that no one is watching over the behavior of community members and of outlet patrons.
Second, disorganized communities are less able to control the actions and decisions of outlet owners, managers, or staff and to demand responsible retailing and serving practices on behalf of the outlets. This is especially important because a recent study by Lugo (2008) found that these practices, such as serving intoxicated patrons and happy-hour promotions, are more important predictors of neighborhood crime than bar density. Additionally, when outlet managers or owners create safer drinking environments (e.g., use drinking glasses that break into smaller pieces that are safer than the typical glasses that break into shards, modify the location of bar counters or restrooms to create less physical interaction and bumping of clients into one another), this can result in fewer instances of aggression or alcohol-related harm in general (Green & Plant, 2007).
Finally, disorganized communities are less able to influence officials like local police departments and city officials to control problematic alcohol outlets. In organized communities, if problems associated with alcohol consumption exist (e.g., public intoxication, disorder, etc.), community members tend to organize their efforts and demand assistance from local police department to reduce such problems (e.g., via increased deployment of officers around alcohol outlets). Additionally, citizens in organized communities are probably more likely to attend local alcohol board meetings and exert influence over whether an additional alcohol outlet can open in a particular neighborhood. Although not studying community members’ opposition to alcohol outlets, Piat (2000) showed how effective community organization can be. In her study, residents opposed implementation of a group home for adult former psychiatric patients, and upon learning about the group home they immediately organized their efforts to circulate petitions and held public information meetings. Disorganized communities may be less able to mount opposition and to be able to influence city officials, and they may not only be less likely to work together with local police departments but may in fact have antagonistic relationships with police.
Land Use, Alcohol Outlets, and Violence
The contribution of the built environment on crime and the quality of life of community members was first noted by Shaw and McKay (1942), and subsequently by Jacobs (1961) in her discussion of the landscape of American cities. She suggested, for example, that residential land use that also contains areas with high commercial density provides an increased social interaction as people begin to recognize and to know each other. Thus, at high densities Jacobs (1961) suggests that mixed land use can reduce violence by providing natural surveillance. On the other hand, strictly commercial land use provides opportunity for interaction in time and space of people who do not know each other, and thus such land use may be associated with higher rates of violence. This early work on the impact of the built environment (including land use patterns) suggested that the structure of cities can diminish or improve the quality of life of its citizens.
The association between land use and violence has been examined in a number of empirical studies (Browning et al., 2010; Cahill, 2005; Hirschfield & Bowers, 1997; Sampson & Raudenbush, 1999; Stucky & Ottensmann, 2009). While the results of these studies are mixed in terms of the effect of land use on violence, they are helpful in identifying the types of land uses that are likely to contribute to greater rates of violence. Sampson and Raudenbush (1999) found that mixed land use had no direct effect on crime, but more recent studies (Browning et al., 2010; Cahill, 2005) found a negative effect. Browning et al. (2010), for example, found that, beyond a threshold, commercial and residential density is negatively and significantly associated with homicide rate. Others have found that nonresidential areas are more likely to have higher crime rates relative to residential areas (Hirschfield & Bowers, 1997; Lockwood, 2007). Nonresidential areas may also have more physical deterioration than residential areas (Taylor, Koons, Kurtz, Greene, & Perkins, 1995), which sends a message of lower guardianship and that antisocial behavior may go unnoticed or at best unreported.
A recent study of land use takes into account not only the direct effect of different land uses on crime but also the conditioning effect of social disorganization on the association between land use and crime (Stucky & Ottensmann, 2009). The findings from this study suggest that both residential (and specifically high-density residential land use) and commercial land uses are associated with higher violent crime rates. Additionally, they found that high-density residential land use moderates the relationship between social disadvantage and violent crime. The moderating effect of land use on the association between a structural-level variable (e.g., social disadvantage) and violent crime suggests that land use may also moderate the relationship between other types of structural-level variables (e.g., alcohol outlet density) and violence. In fact, a recent study by Pridemore and Grubesic (2012c) using Cincinnati, Ohio, block groups found that several land use types consistently conditioned the effects of different types of alcohol outlets (i.e., off-premise, bars, restaurants) on both simple and aggravated assaults.
Hypotheses
Given the social theory and empirical findings discussed thus far, we tested four hypotheses in our study. First, there is a positive association between alcohol outlet density and assault density. Second, there is a positive association between social disorganization and assault density. The third hypothesis is exploratory in nature and tests for an association between several different land use types and assault density. Finally, and most importantly, the fourth hypothesis is that social disorganization and land use will condition the effects of alcohol outlet density on assault density. A key innovation of our study is that all the prior analyses of this type used large urban cities as their study area. There are reasons to believe that social characteristics manifest themselves in different ways in smaller cities, towns, and rural areas, however, and so we want to determine whether these associations hold in a large college town where the economy and culture are driven by the presence of a major university. For example, in smaller cities and college towns like Bloomington, while social disorganization may vary across the city, it may not reach the levels of social disorganization that exists in urban areas, and it also may be qualitatively different from social disorganization in urban areas.
Data and Method
Data
Unit of analysis
Bloomington, Indiana, was the study area for this analysis. In 2006, the population was estimated to be 69,274 (U.S. Census Bureau, 2000). Bloomington is home to Indiana University, with a student body of over 40,000 undergraduate and graduate students who play an important role in the life of the town. Indiana University students are typical of many American college-aged students. They are active in Greek life on campus, do most of their drinking on weekends and school breaks (especially during spring breaks), and experience typical social and physiological consequences due to their hazardous pattern of drinking (e.g., hangovers, physical and verbal courtship violence, loss of friendships, etc.). Because it houses a large state university and its students, Bloomington has the typical alcohol-related problems (e.g., binge drinking, underage drinking, severed personal relationships, etc.) associated with such places (Shook, Gerrity, Jurich, & Segrist, 2000; Smeaton, Josiam, & Dietrich, 1998; Wechsler, Kuo, Lee, & Dowdall, 2000; Wechsler & Nelson, 2001). The implications of Bloomington being a major college town are worth considering as college drinking culture is an important element in harm prevention (Wechsler & Nelson, 2008), and both alcohol outlet densities and student alcohol consumption are associated with campus violence (Scribner et al.,2010).
The units of analysis in our study were all census block groups that lie within the boundaries of Bloomington (n = 65). The block group is the smallest geographic entity for which the Census Bureau collects and publishes sample data. Census block groups are clusters of census blocks created by the Census Bureau as a geographic level between blocks and census tracts to permit the release of tabulated data that cannot be presented at the block level due to confidentiality purposes (Iceland & Steinmetz, 2003). Nationally, block groups generally contain between 600 and 3,000 people and never cross the boundaries of states or counties (Iceland & Steinmetz, 2003). The populations of our Bloomington block groups range from 393 to 4,588, with a mean of 1,268 (U.S. Census Bureau, 2000). We chose to use census block groups as the units of analysis mostly because using larger units of analysis (e.g., census tracts, zip codes, etc.) may obscure the social processes that occur especially in the presence of alcohol outlets. Doing so resulted in 65 units of analysis and we note that this relatively small sample size means that the statistical tests could be conservative estimates of an association between alcohol outlet density and assault density in a large college town, and the direct and moderating effect that social disorganization and land use may have on this association. Nonetheless, this is among first attempts to extend the alcohol and crime literature beyond the findings from large urban cities, and as such is an important contribution.
Dependent variables
The dependent variable in this analysis was assault density per square mile. This variable was further disaggregated, based on the level of harm, into aggravated and simple assault density per square mile. Data on assaults were obtained from the Bloomington Police Department. The measures for aggravated and simple assaults were calculated based on the number of incidents investigated by the police during a 2-year period, from January 1, 2008 to December 31, 2009, for each census block group. The police data on aggravated and simple assaults were standardized by the total land area of each census block group (i.e., per square mile), rather than by the population of a census block group (e.g., per 100 residents). If we standardized the data on assaults with a traditional population-based rate, the resulting metric would take into account only the population that lives in each block group, implying that all victims and offenders reside in the same block group (Gibbs & Erickson, 1976). Doing so fails to account for the fact that both victims and offenders go to other block groups as they go about their daily activities, including purchasing alcoholic beverages, drinking, and becoming assault victims and offenders.
These assault data were geocoded using ArcView software and aggregated to the block group. Only events that were assigned to a street-level match were utilized for analysis, and we were able to assign such a match in 99.5% of all reported assaults. Aggravated assault density ranged from 0 to 243 per square mile, with a mean of 17, and simple assault density ranged from 0 to 861 per square mile, with a mean of 62.
Independent Variables
Alcohol outlet density was measured as the number of all outlets per square mile in each block group. We created a measure for all alcohol outlets and also disaggregated by the license type into broad categories of off-premise (i.e., liquor, convenience, and grocery stores), restaurants, and bars. Data on alcohol outlets were obtained from the Indiana Alcohol and Tobacco Commission (IATC) and were based on permit information for all establishments registered with the IATC for 2010. Data included information on business name, permit type and number, street address, and the permit expiration date. As of 2010, there were more than 200 licenses issued to local businesses to sell alcoholic beverages to the public in Bloomington. Addresses of the outlets were geocoded using ArcMap and aggregated to the block group level. The skew statistics for the measures of alcohol outlet density (including outlet types) were greater than twice their standard errors, so we used the natural logarithm of each in order to create more normalized distributions.
Conditioning variables: Social disorganization and land use
We tested for direct and moderating effects of social disorganization and land use on the association between alcohol outlet density and assault density. Social disorganization was operationalized as an index consisting of four traditionally used measures of social disorganization at the block group level: ethnic heterogeneity, poverty, residential instability, and female-headed households.
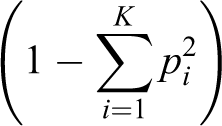
First, following prior research on alcohol outlets and violence (Roman et al., 2008), we operationalized ethnic heterogeneity via the Lieberson Diversity Index (LDI; Lieberson, 1969), which in our case was measured as one minus the sum of squared proportions of each of four races: White, Black, Asian, and Hispanic. The LDI is a common measure of ethnic heterogeneity in social science research, with the more general formula as follows:
where
K = the number of ethnic categories (i.e., White, Black, Asian, Hispanic),
i = the number of observations, and
p = the proportion of ethnic group.
The LDI indicates the probability that randomly paired members of the community will be of different ethnicity. The LDI ranges between 0 and 1, with higher values indicating greater ethnic diversity.
The second in the social disorganization index, poverty, was measured as the proportion of the population in each block group with income below poverty levels. Data for this variable were obtained from the 2000 U.S. Census Summary File 3, Table P87, which is called Poverty status in 1999 by age. The third measure of the index, residential instability, was measured as the proportion of housing that is renter occupied. Data for this variable were obtained from the 2000 U.S. Census Summary File 3, Table H7, which is named Tenure. The final measure of the index, female-headed households, was measured as the proportion of all households that were headed by a female and contained at least one child younger. This variable was also obtained from the 2000 U.S. Census Summary File 3, Table P15, which is named “Family type by presence of own children under 18years.” Once we calculated the raw scores for each of these four individual variables, we created the social disorganization index by standardizing the raw scores and then summing these standardized scores.
We obtained land use data from the Bloomington Planning Department for each parcel in town. The data were available as a shapefile, with information about the specific type of land use parcel, from which we could calculate the parcel size. Since each parcel could be measured in square feet, the total area for each land use could be calculated for each block group. Rather than simply utilizing a measure of land use by calculating the percentage of particular land uses for each block group, we opted for a stronger geographic measure based on dominance of land use for each block group relative to Bloomington as a whole. Specifically, we calculated location quotients (Hildebrand & Mace, 1950) for the land uses of interest, including commercial arterial, commercial general, industrial general, mobile housing, residential high density, residential multifamily, and residential single family. The location quotients compare the proportion of each land use type in a block group to the proportion of that land use type in Bloomington as a whole (Hildebrand & Mace, 1950). The location quotient for each land use type is calculated as follows:

If the LQ is less than 1.0 it means that the block group has a smaller proportion of that type of land use relative to the town as a whole. If the LQ is close to or equal to 1.0, then we can conclude that the block group is very similar to the land use characteristics for the entire town. If the LQ is greater than 1.0, we can conclude that the block group contains more of that land use type relative to the entire town. Compared to simply calculating the percentage of a particular land use in a block group, the location quotient provides a clearer picture of land uses because it allows us to examine block group specializations of land uses of some (or many) land use types in Bloomington.
Control variables
We included several additional structural characteristics of communities to control for potential confounding effects. This is important because neighborhood characteristics have been shown to be associated with both alcohol outlet density (Nielsen, Hill, French, & Hernandez, 2010) and violence. Our controls included the proportion of the population that is African American and population density. The skew statistics for these variables were greater than twice their standard errors, so we used the natural logarithm of each in order to normalize the distributions. We also controlled for prior levels of violence using a measure for simple and aggravated assault density between January 1, 2004 and December 31, 2005. Prior research on this topic suggested the importance of using the temporal lag of crime in order to account for unobserved block group-specific heterogeneity (Roman et al., 2008). Data on each of these control variables were obtained from the 2000 U.S. Census Bureau, with the exception of simple and aggravated assault density from 2004 and 2005, data for which were obtained from the Bloomington Police Department.
Method
Two different modeling approaches, ordinary least squares (OLS) and spatially lagged regression, were used to test the hypotheses outlined above. Following Tobler’s (1970) first law of geography and Anselin’s work on spatial dependence in linear regression models (Anselin & Bera, 1998), we assumed that assaults from one unit of analysis could be predicted from neighboring units of analysis since we used spatially distributed data and units of analysis that have artificially imposed boundaries and therefore tested for spatial autocorrelation in the data. Additionally, prior studies on alcohol outlet density and assault density have noted the importance of controlling for a spatial lag (e.g., Alaniz et al., 1998; Costanza et al., 2001; Pridemore & Grubesic, 2012a; Roncek & Meier, 1991; Stevenson, Lind, & Weatherburn, 1999).
We tested for spatial autocorrelation using the Moran’s I statistic. The global Moran’s I ranges from −1 to +1 and indicates whether a variable of interest in one block group is correlated with itself in the other block groups. If spatial autocorrelation is present, we can control for it by adding a term for it (ρ) to our models. In all spatial regression models, we used an order one queen’s contiguity matrix to capture the influence of potential spatial autocorrelation. In our simple assault models, we found evidence of spatial autocorrelation and thus we employed spatially informed regression models for simple assault. In the models where the density of aggravated assaults was the dependent variable, the Moran’s Istatistic indicated that spatial autocorrelation did not exist in the ordinary linear regression residuals, and thus we specified aggravated assault models as OLS models.
We first estimated the direct effects of outlet density and social disorganization on simple and aggravated assault density. Subsequently, we estimated the effects of the interaction terms of outlet density and social disorganization. We then estimated the direct effects of outlet density and land use on simple and aggravated assault density. We concluded our analyses by estimating the effects of the interaction terms of outlet density and land use.
Results
We present results in two sections. The first describes the results of our analyses for the direct and moderating effects of social disorganization on the association between alcohol outlet density and assault density. The second describes the results of our analyses for the direct and moderating effects of land use on the association between alcohol outlet density and assault density.
Alcohol Outlet Density, Social Disorganization, and Assault
Table 1 displays the descriptive statistics for the dependent, independent, and control variables. Aggravated assault density ranged from 0 to 243 per square mile with a mean of 17, and simple assault density ranged from 0 to 861 per square mile with a mean of 62. Looking at the main independent variables, total outlet density ranged from 0 to 247 with a mean of 13 per square mile, off-premise outlet density ranged from 0 to 21 with a mean of 3 per square mile, bar density ranged from 0 to 69 with a mean of 2 per square mile, and restaurant density ranged from 0 to 137 with a mean of 7 per square mile. The social disorganization index is a sum of standardized scores of the four variables seen in Table 1: poverty, ethnic heterogeneity, residential instability, and female-headed households. The values in the table for these four variables are for their actual original values and not the values for their standardized scores. Our land use variables were location quotients for commercial arterial, commercial general, industrial general, mobile housing, residential high density, residential multifamily, and residential single-family land uses.
Descriptive Statistics for Untransformed Variables for Bloomington Block Groups (n = 65).
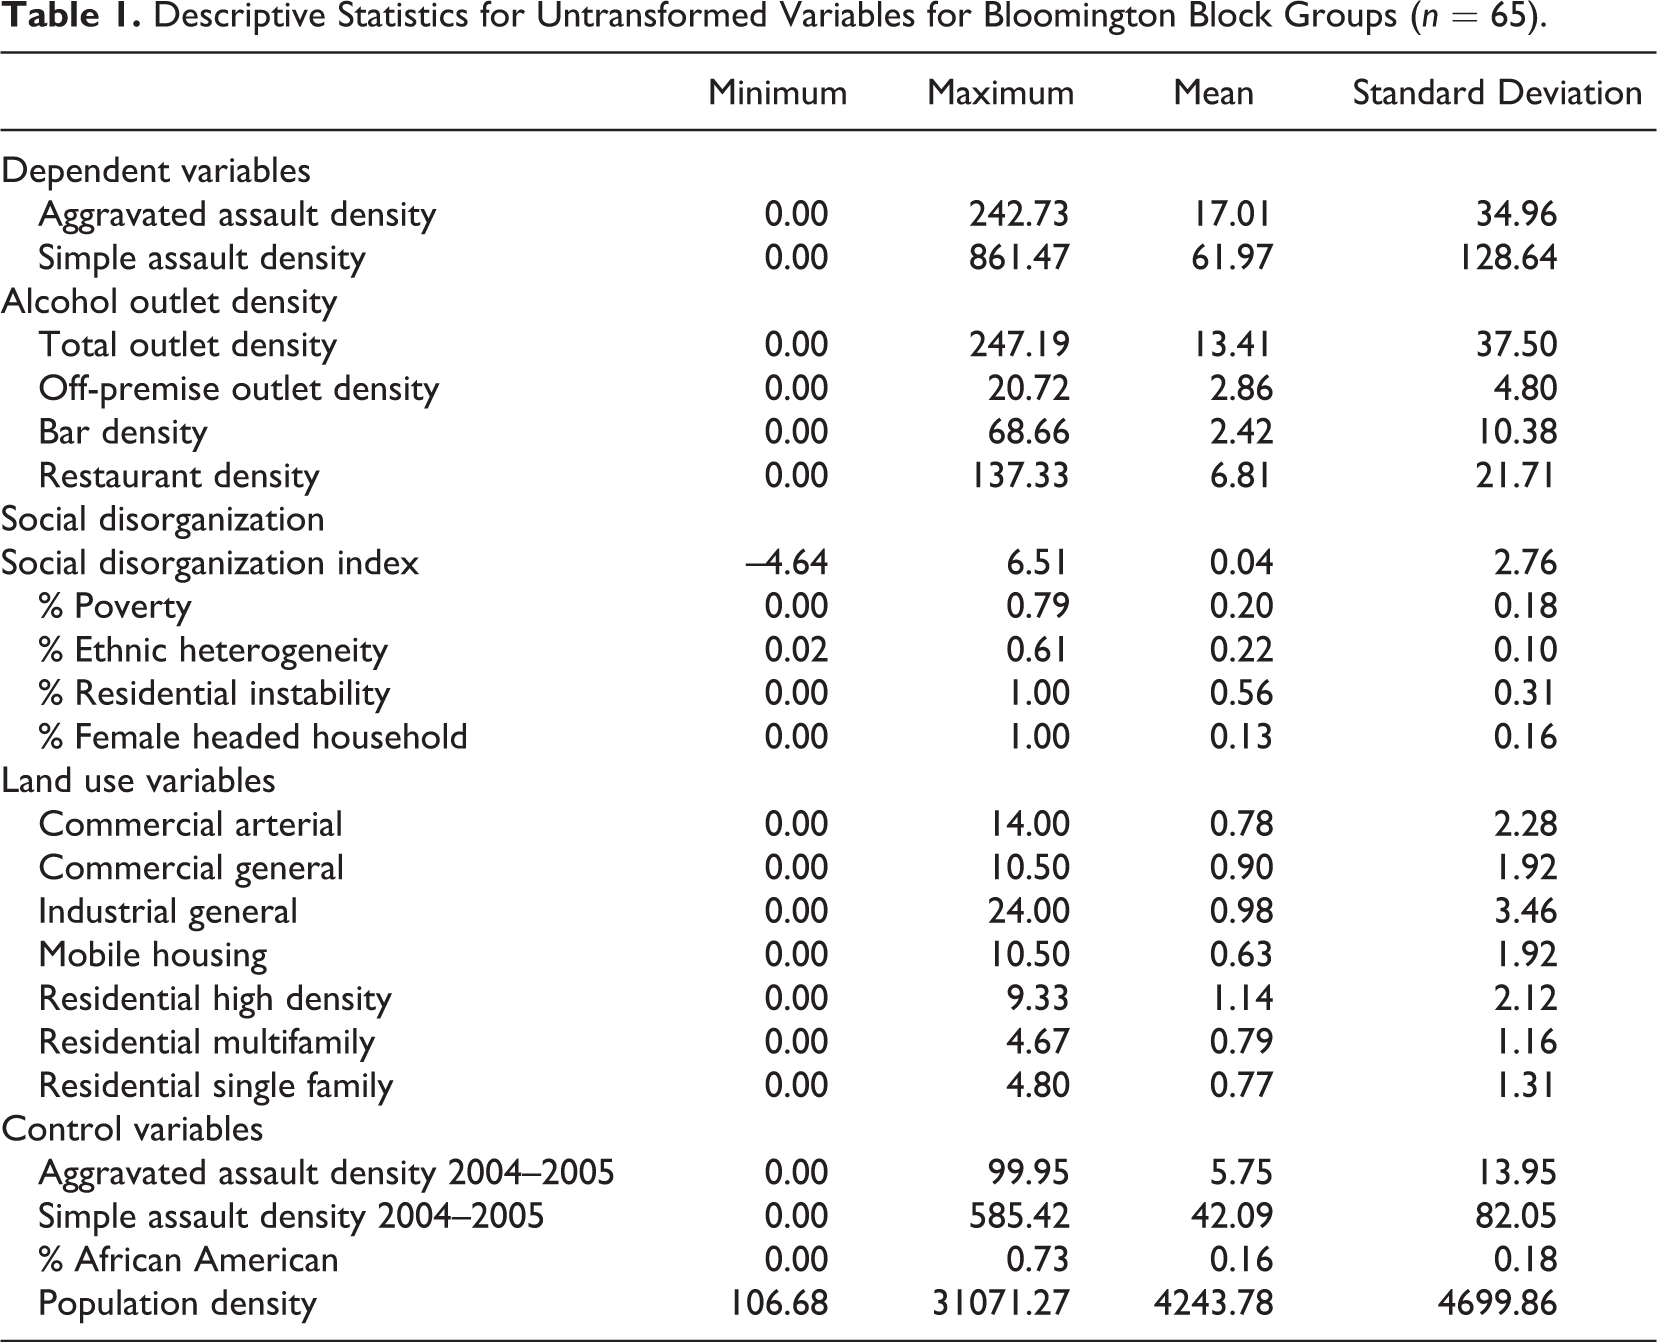
Table 2 shows the correlation matrix. As expected, the density of aggravated assaults was positively and significantly correlated with total outlets (r = .47), off-premise outlets (r= .51), bars (r = .48), and restaurants (r = .35). The same was true for the density of simple assaults and total outlets (r = .58), off-premise outlets (r = .56), bars (r = .46), and restaurants (r = .49). Social disorganization is positively and significantly correlated with simple assaults (r = .45) and aggravated assaults (r = .45). Social disorganization is positively and significantly correlated with off-premise outlets (r = .41), bars (r = .32), and restaurants (r = .41).
Correlation Matrix.
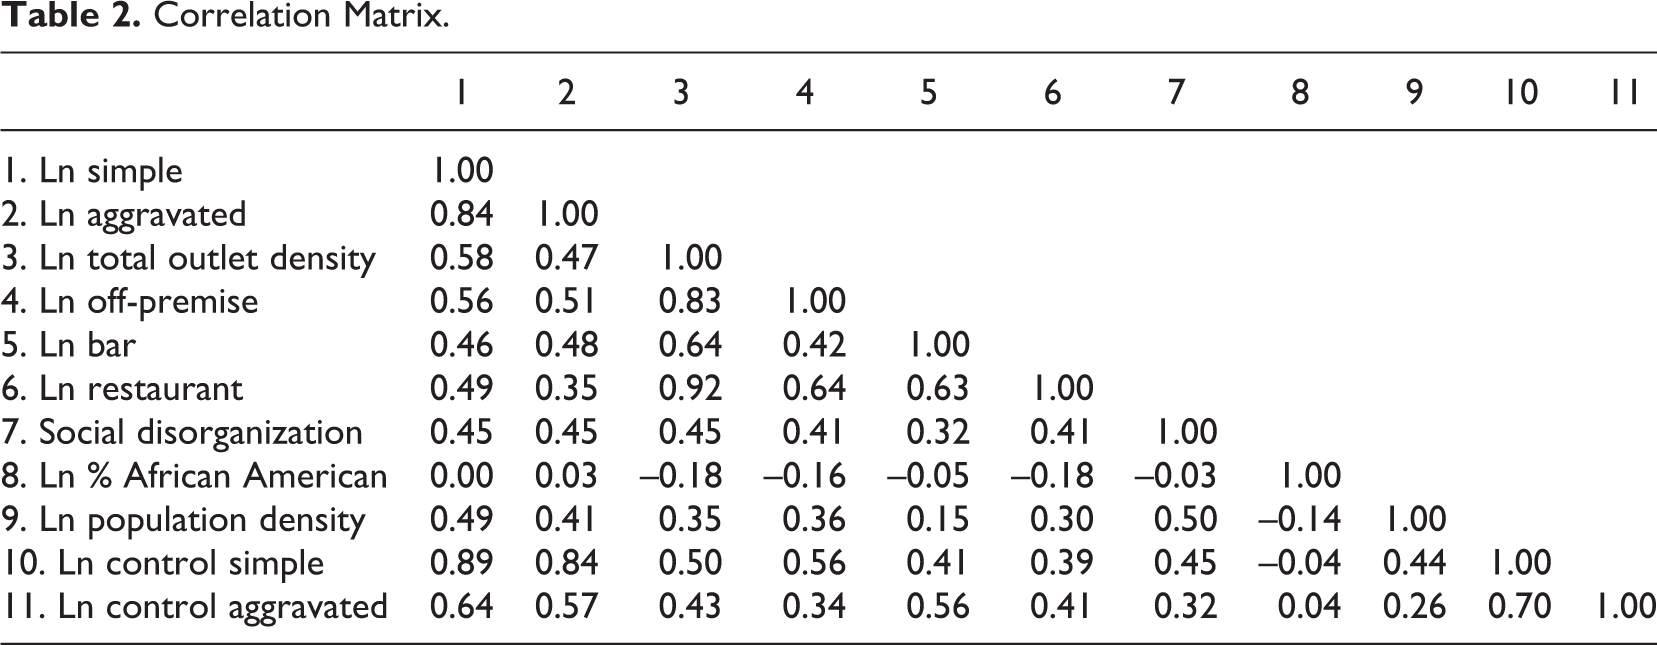
Table 3 displays the results of model estimation for simple assaults. Model 1 shows the results without any interaction terms. The density of restaurants is positively and significantly associated with the simple assault density (p = .045), controlling for social disorganization and the other structural covariates of block groups. However, the density of off-premise outlets and the density of bars are not statistically associated with the simple assault density (p = .957 and p = .997), when controlling for social disorganization levels of block groups. Additionally, the direct effect of social disorganization on simple assaults is nonsignificant (p = .468). Models 2–4 show the results with the interaction terms. The association between restaurant density and simple assault density remains significant when the interaction terms are included in the models, though none of the interaction terms of social disorganization with each outlet type are statistically significant. The adjusted R 2 values show that Models 1–4 explain approximately 83% of the variance in simple assault density by alcohol outlets and the control variables for Bloomington block groups. The spatial lag (ρ) associated with simple assault density in the models is positive and significant contributor to the models. Finally, Breusch–Pagan test reported in the models described above suggests that heteroscedasticity is not a serious problem for the specified models.
Spatial Lag Regression Results for Simple Assault Density Regressed on Outlet Type, Social Organization, Control Variables, and Interaction Terms for Bloomington Block Groups (N = 65).
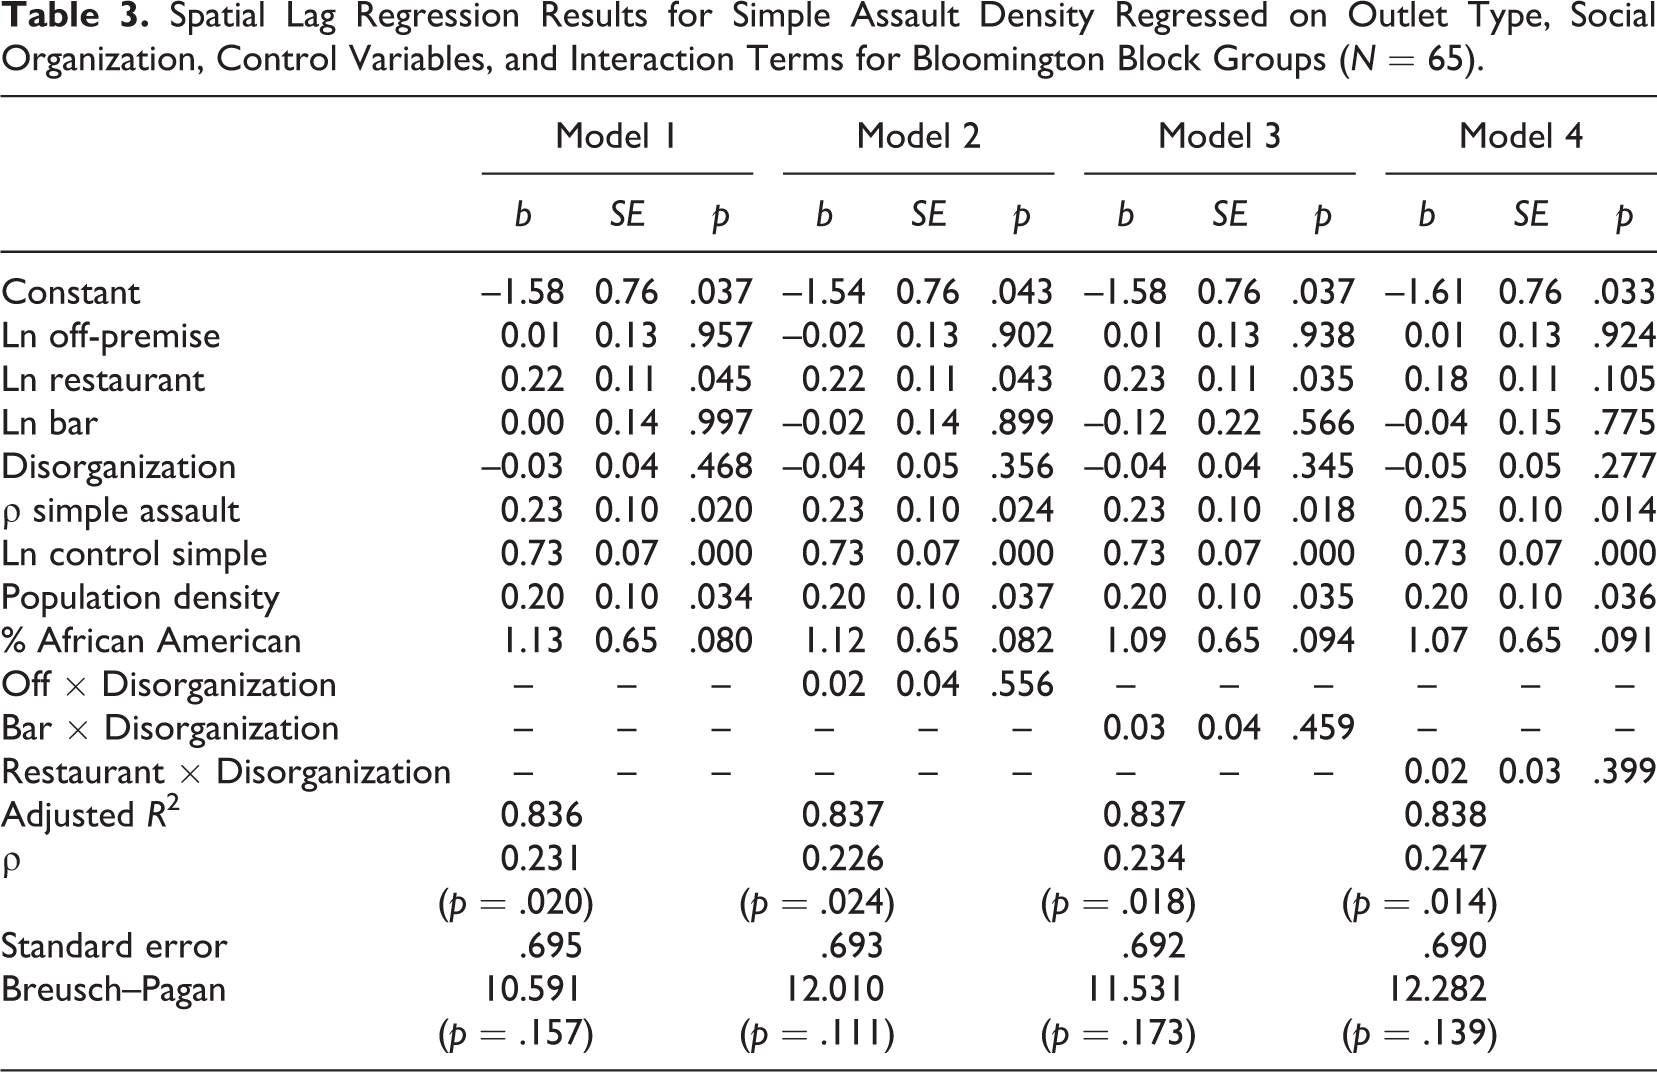
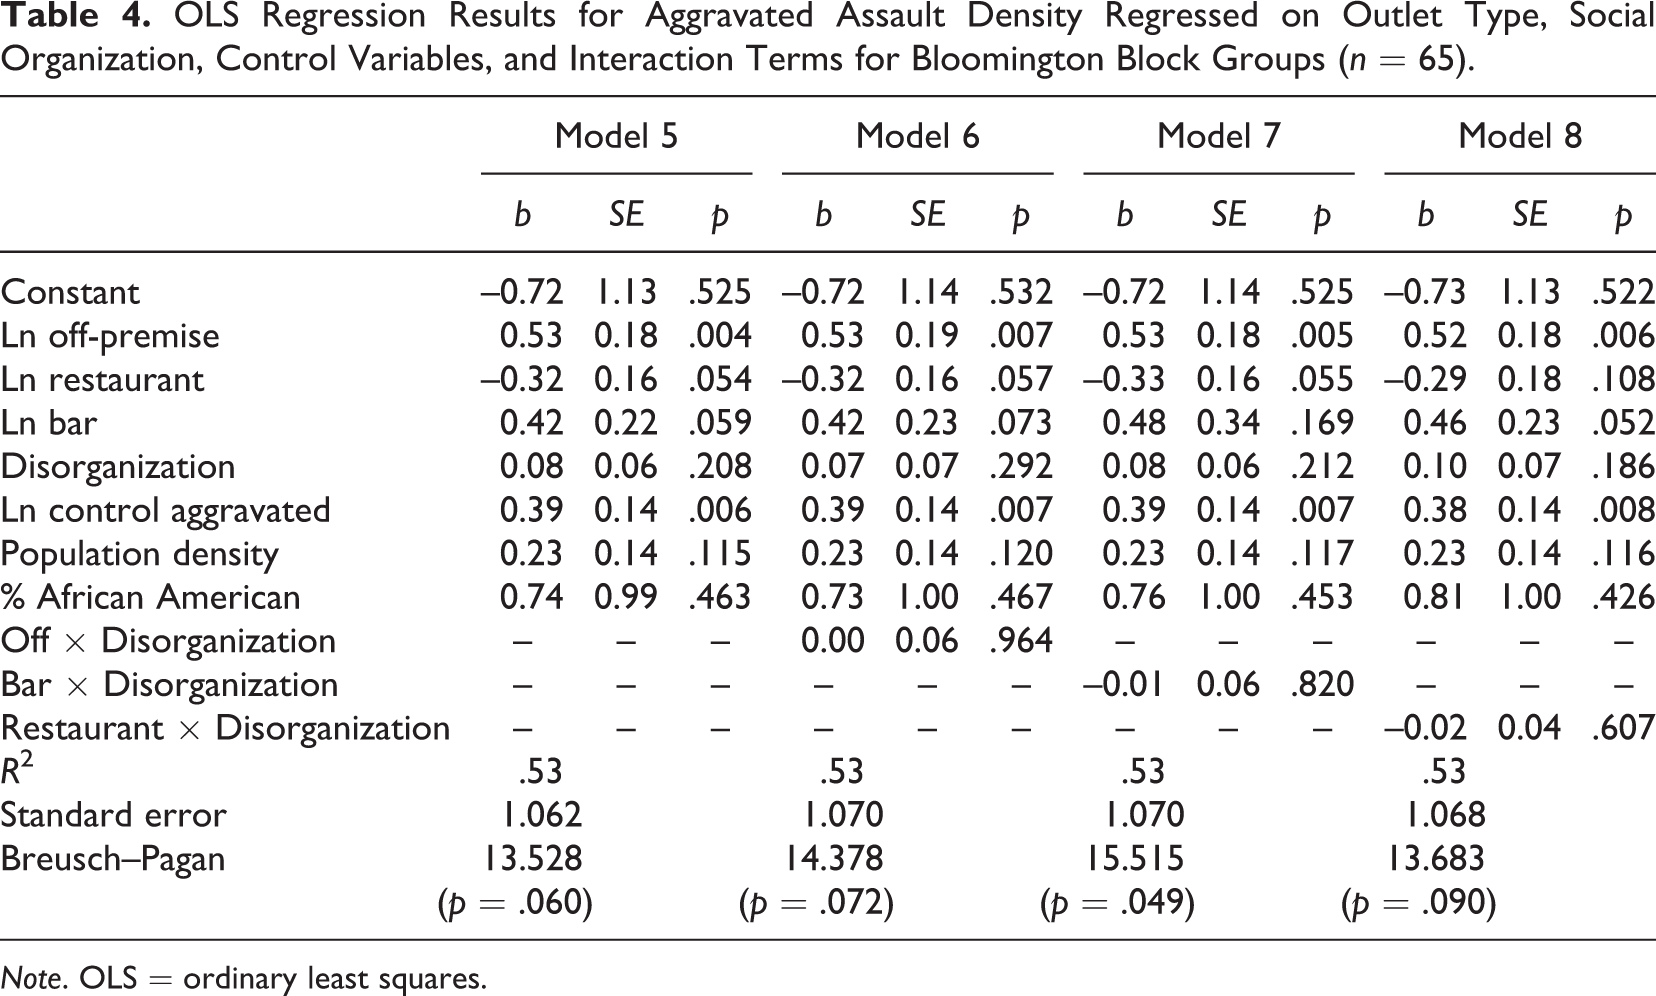
Table 4 shows the results of model estimation for aggravated assaults. Model 5 shows that the direct effect of off-premise alcohol outlet density on aggravated assault density is positive and significant (p = .004). Additionally, the direct effect of social disorganization on aggravated assaults is nonsignificant (p = .208).
OLS Regression Results for Aggravated Assault Density Regressed on Outlet Type, Social Organization, Control Variables, and Interaction Terms for Bloomington Block Groups (n = 65).
Note. OLS = ordinary least squares.
The effects of the density of alcohol-serving restaurants on aggravated assaults are negative and statistically significant (p = .054), and the effects of bars on aggravated assaults are positive and statistically significant (p = .059). Models 6–8 show that none of the interaction terms of social disorganization with each outlet type are statistically significant. The direct effect of off-premise outlet density on aggravated assault density remains significant (p = .007, p = .005, and p = .006), when we control for the interaction effect of social organization and different types of alcohol outlets on aggravated assault density. Additionally, the direct effect of restaurants on aggravated assault density remains negative and borderline significant (p = .057 and p = .055), when we control for the interaction effect of off-premise outlets and social disorganization, and the interaction effect of bars and social disorganization. The effect of restaurants on aggravated assault density becomes nonsignificant (p = .108) when we control for the interaction effect of restaurants and social disorganization on the aggravated assault density. The results are similar for the effect of bars on aggravated assault density. Specifically, the effect of bars on aggravated assault density is nonsignificant (p = .169) when we control for the interaction effect of bars and social disorganization on aggravated assault density but remains borderline significant when we control for the other two interaction terms (off-premise and social disorganization and restaurants and social disorganization), with p values of .073 and .052, respectively. The R 2 values show that Models 5–8 explain approximately 53% of the variance in aggravated assault density by alcohol outlets and the control variables for Bloomington block groups. Additionally, we tested for heteroscedasticity in error terms, and Breusch–Pagan test reported in the models described above suggests that heteroscedasticity is not a serious problem for the specified models, except for Model 7. We removed the variable for the aggravated assault density for prior levels (2004/2005), and observed that the results of the models remained stable (i.e., off-premise outlets remained significant), while heteroscedasticity was no longer an issue. We concluded that since the dependent variable is highly correlated with the control variable for prior levels of aggravated assault density (2004/2005), the heteroscedasticity in the final models is not a threat to the stability of these models, and thus we specified the Model 7 as it is reported in the Table 4 below.
Taken together, these findings provide evidence in partial support of the first hypothesis. Model 1 indicates that the density of restaurants is positively and significantly associated with the simple assault density, and that the density of off-premise outlets and the density of bars are not statistically associated with the simple assault density. In addition, Model 5 suggests that the direct effect of off-premise alcohol outlet density on aggravated assault density is positive and significant, and that the effects of the density of alcohol-serving restaurants on aggravated assaults are negative and statistically significant and the effects of bars on aggravated assaults are positive and statistically significant.
In terms of the second hypothesis that there exists a positive association between social disorganization and assault density, Models 1 and 5 suggest no evidence of such associations. In fact, both models show that social disorganization has no statistically significant association with either simple or aggravated assault density. Finally, Models 2–4 and 6–8 show no support of the last hypothesis and suggest that social disorganization does not condition the effects of alcohol outlet density on either simple or aggravated assault density.
Alcohol Outlet Density, Land Use, and Assault
While our results from the previous section found no moderating effect of social disorganization on the relationship between alcohol outlets and assaults, recent research has also shown that in large cities land use can moderate the association between alcohol outlet density and violence. In this section, we explore the possibility of this association in a large college town, and we do so by presenting results for total outlet density only, instead of each type of alcohol outlet, as looking at the latter would provide 42 interaction term models (3 outlet types, 7 land use types, 2 assault types).
Table 5 displays the results of model estimation of the direct effects of alcohol outlet density and land use on simple and aggravated assault density. Model 1 shows that there is a positive and significant direct effect of alcohol outlet density on simple assault density (p = .015). None of the seven land use variables have a significant direct effect on simple assault density. In terms of aggravated assault density, Model 2 suggests that there is a positive and significant direct effect of alcohol outlet density on aggravated assault density (p = .013). Additionally, Model 2 also suggests that there is a positive and significant association between mobile housing land use and aggravated assault density (p = .080), and between residential high-density land use and aggravated assault density (p = .025). A borderline significant association between commercial general land use and aggravated assault density also exists (p = .111). The remaining four land use variables (i.e., commercial arterial, residential multifamily, and residential single family) were statistically nonsignificant for the aggravated assault density model.
Simple and Aggravated Assault Density Regressed on Alcohol Outlet Density, Land Use, and Control Variables for Bloomington Block Groups (n = 65).
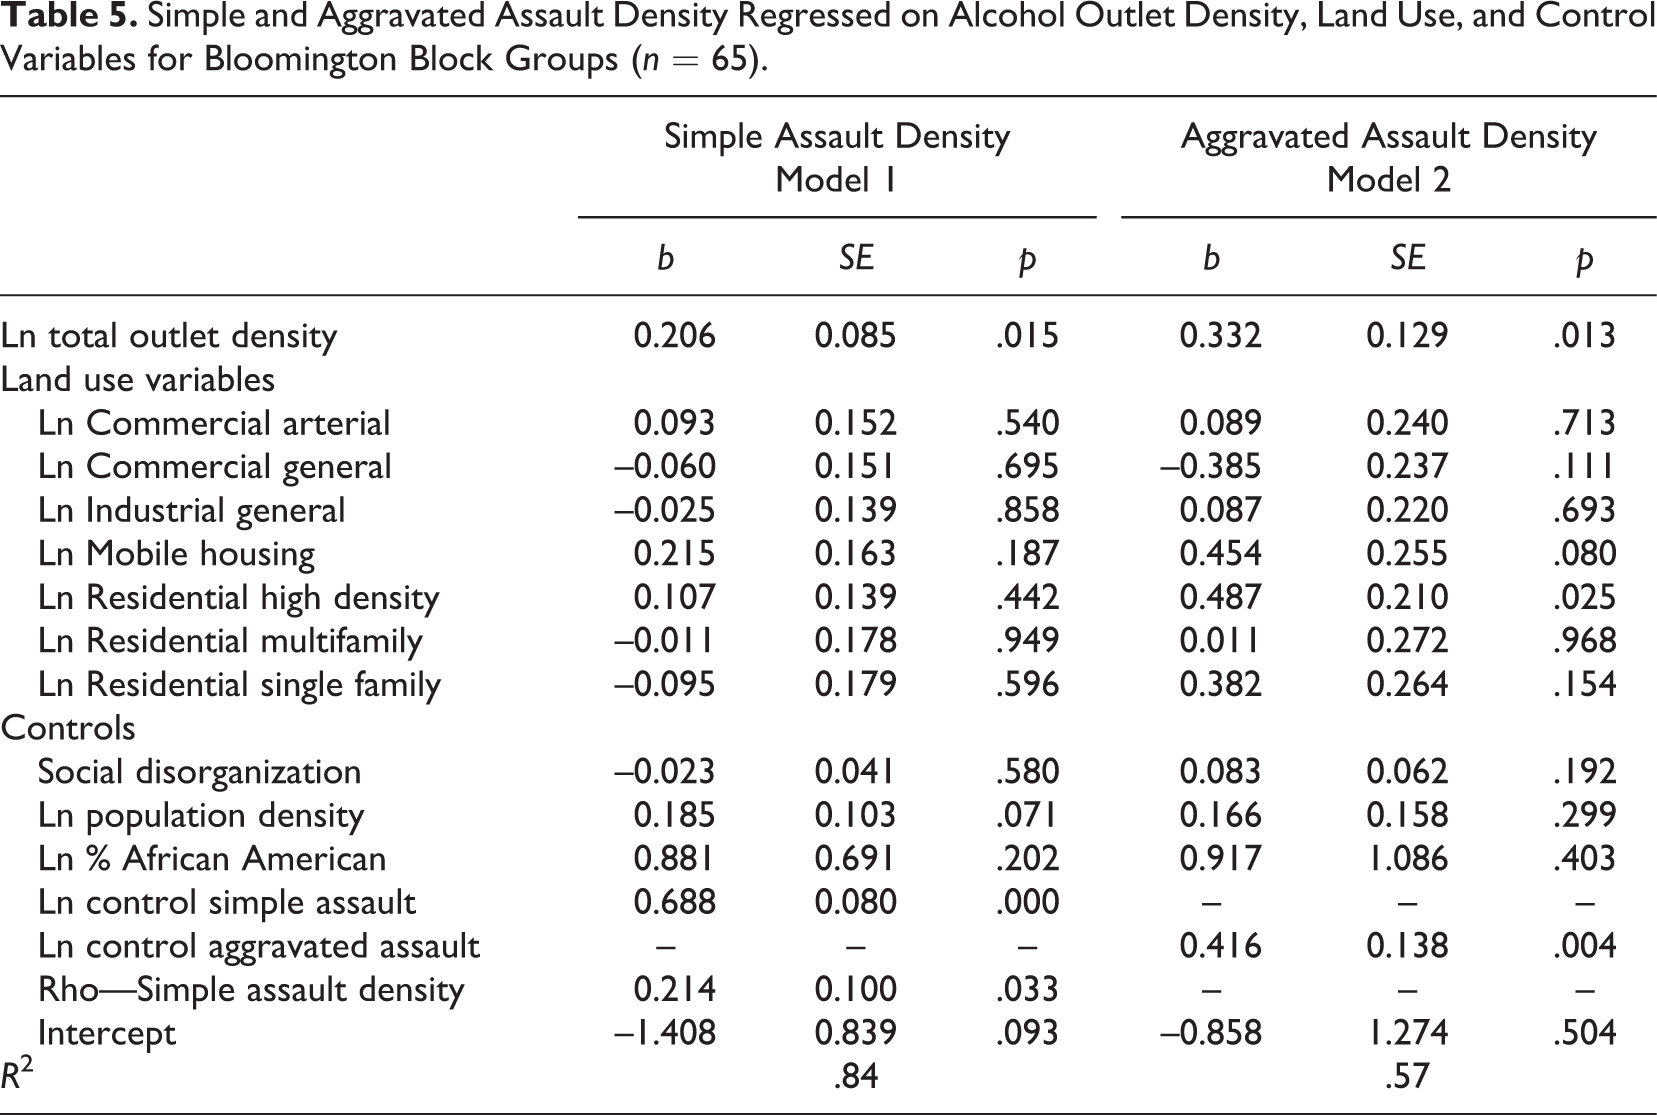
Table 6 summarizes the interaction effects because it was necessary to estimate several models to test the various interaction terms. All moderating effects shown in Table 6 were adjusted for social disorganization, all other land use types, population density, percentage African American, and spatial autocorrelation (when necessary). The results show that the strength of the association between alcohol outlet density and assault was not conditioned by land use, as none of the 14 interaction terms were significant.
Summary of Interaction Effects.a
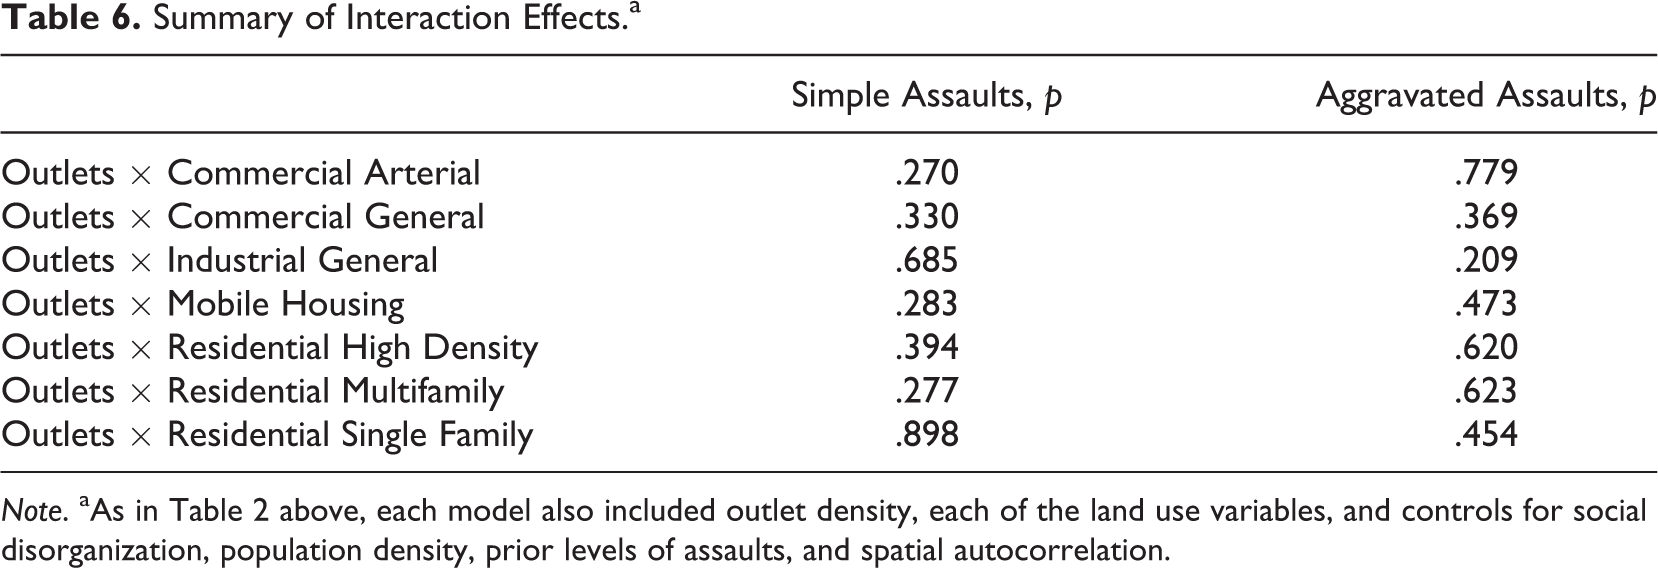
Note. aAs in Table 2 above, each model also included outlet density, each of the land use variables, and controls for social disorganization, population density, prior levels of assaults, and spatial autocorrelation.
As with social disorganization, the results of the models described in Tables 5 and 6 show support for the first hypothesis. Models 1 and 2 suggest that there is a positive association between alcohol outlet density and both simple and aggravated assault density, when controlling for several land use variables. However, as can be seen in Table 6, there is no evidence that there is support for the fourth hypothesis; land use does not condition the effects of alcohol outlet density on assault density. The third hypothesis was exploratory in nature and we found that none of the land use types have a direct effect on simple assault density, and that there is a positive and significant association between mobile housing land use and aggravated assault density (p = .080), and between residential high-density land use and aggravated assault density.
Discussion
The results of the spatial regression and OLS models described above suggest that in a large college town, the relationship between different outlet types and assault density is not moderated by community organization. Surprisingly, in fact, social organization also showed no direct effect on simple assault density and aggravated assault density. In terms of the effects of outlet density on assault, however, our results were consistent with several prior studies, as the direct effects of outlets on assault density held even when controlling for the social disorganization index and other structural covariates. Recent research has shown that social organization moderates the relationship between alcohol outlets and assaults in a large urban city (Pridemore & Grubesic, 2012b), and here we discuss two possible explanations for the difference in the findings between a large urban city and a smaller town whose economy is driven by the presence of a major state university.
One possible explanation is associated with the quantity of social disorganization. That is, the level of social disorganization in a college town like Bloomington, relative to the urban areas that have been the subject of most empirical studies thus far, may not reach the levels of social disorganization in urban cities. In urban cities, the disorganization in neighborhoods characterized by deep and entrenched poverty, frequent movement of residents, high proportions of single-parent households, and high levels of ethnic heterogeneity may be much greater on average than in disorganized neighborhoods in smaller cities and towns. If so, this greater level of disorganization might not allow neighborhood residents to be able to implement limitations on alcohol availability. For example, recent work by Nielsen et al. (2010) found that lower levels of community organization were associated with a higher density of alcohol outlets in San Diego County. In socially disorganized urban areas, a greater density of outlets might serve as an attractor of community members at higher risk of criminal activity and of community outsiders. Additionally, higher levels of social disorganization may allow for the use of alcohol outlets as locations for many types of deviance like prostitution and drug sales (Alaniz et al., 1998), which can further damage collective efficacy (Sampson & Raudenbush, 1999) and the ability of neighborhoods to exert social control. In smaller cities and college towns like Bloomington, while social disorganization may vary across the city, it is likely not as strong as in some urban areas, thus it may not exert influence over the strength of the outlet–assault association. The results otherwise hint at this explanation, as social disorganization itself does not exhibit a direct effect on simple and aggravated assault density in Bloomington. This is consistent with recent research that shows no association between social disorganization and violence in rural areas (Kaylen & Pridemore, 2011). In terms of our earlier discussion of how social disorganization may influence the outlet–violence association, the quantity of neighborhood social disorganization in college towns may not be so strong as to severely disrupt influence over outlet patrons, outlet management, and city officials that police or otherwise regulate outlets.
Another possible explanation for the failure of social disorganization to moderate the impact of alcohol outlet density on violence in our sample is related to the quality of social disorganization in a college town, even a large one like Bloomington, relative to urban areas. That is, in a college town like Bloomington, due to the traditional variables comprising social disorganization a certain proportion of socially disorganized block groups will be those where college students live. The presence of college students—many of whom could be considered poor (as they are employed on a part-time basis or not employed at all), who move in and out of their residences on a yearly basis, and who come from different ethnic backgrounds in the context of a university setting where diversity is generally more valued relative to most other social spaces—creates a qualitatively different type of social disorganization that may be less damaging than traditional social disorganization, even when gauged by the metrics of the latter. In a college town setting, the experience of poverty, not knowing one’s neighbors, and having people of different ethnicity around could be much different than the experience of poverty, residential instability, female-headed-households, and ethnic heterogeneity in a neighborhood in a large city. Subsequently, social disorganization in a college town may be qualitatively different from social disorganization in a large city (or in a noncollege town or city, for that matter) and thus not exert the same debilitating direct effects on violence and, in the case of this study, indirect effects via influence on the outlet–assault association.
Similar to our findings for social disorganization, the results of spatial regression and the OLS models show that in a large college town like Bloomington the relationship between alcohol outlet density and assault density is not moderated by land use. Also similar to our findings for social disorganization, land use exhibited few direct effects on assault density. Again, though, the density of alcohol outlets remained positively and significantly associated with simple and aggravated assault density even when controlling for land use and other structural covariates within block groups. The findings from the models including the interaction terms left no doubt: none of the 14 interaction terms for outlets and land uses were significant.
Again, these findings from a large college town are different from the conclusions drawn from a recent study by Pridemore and Grubesic (2012b) who found that in the large urban city of Cincinnati, Ohio, several land use types were directly associated with violence rates and, just as importantly, moderated the association between alcohol outlets and assaults. There are a few reasons why land use may have a moderating effect on the relationship between alcohol outlets and assaults in a large urban city but not in a college town.
First, in a commercial area of an urban city, there may be an increased volume of people who congregate there at day time for shopping, working, or entertainment, and thus we would expect to have an increased availability of “vulnerable targets” and a greater presence of “motivated offenders” (Cohen & Felson, 1979). However, in Bloomington, commercial areas are limited to relatively small pockets that are surrounded by residential areas, so that the frequent movement of individuals across different land use areas may explain why land use does not moderate the effect of alcohol outlets on assaults.
Second, when residents leave their households and expose themselves to “motivated offenders” they may be equally likely to be assaulted in residential areas as they are in nonresidential areas because in a small town the presence of guardians may be similar in residential relative to nonresidential areas. In residential areas of small towns, people know each other and are familiar with the everyday activities of their fellow community members. Thus, even though some people leave their residential areas in the pursuit of their daily activities, some people may be still present in the residential areas and could be on the lookout for any unusual activity when their neighbor is away from their residence. Additionally, in nonresidential areas of small cities there may exist a movement of individuals across the nonresidential areas on their way to the grocery store, movies, bars, or work. This may especially be the case in college towns as nonresidential areas tend to border residential areas, as such individuals can compensate for the movement of employees out of nonresidential areas at night time.
Limitations of the Current Study
There are a few key limitations of the analyses in this study. First, we used data based on police records of those assaults that are actually reported to the police. A large proportion of simple assaults go unreported, and even many serious aggravated assaults are not reported to police. If police recording procedures are similar across units of analysis, which is likely the case as the data are recorded and provided by one recording office that is a part of Bloomington Police Department, this may present less of a problem. This still leaves the problem of differential reporting to police, however. Research by Baumer (2002) shows that socioeconomic disadvantage does not influence reporting aggravated assaults to the police. He did find that there was differential reporting of simple assaults to police by socioeconomic disadvantage, however, and this could have an influence on results based on police data.
A second limitation is associated with the major independent variables used for the analysis. While total outlet density, as well as the density of off-premise outlets, restaurants, and bars, is a commonly used proxy for measuring the influence of alcohol on violence, it does not provide the volume of alcohol sold or consumed within block groups. Such data are unavailable, however, as they are proprietary in nature. Additionally, this proxy also fails to take into account other characteristics of outlets that may be associated with differential risk of assault (e.g., the location of the outlet, the shelf space devoted to alcoholic beverages, whether the outlet sells single serve beverages, lighting and upkeep within and outside the outlet, the ratio of male to female employees, the ratio of employees to patrons, etc.). While there has been considerable research on the characteristics of bars that are associated with greater levels of violence (Graham, Bernards, Osgood, Homel, & Purcell, 2005; Graham et al., 2006; Lugo, 2008), there has been little of this type of research on off-premise outlets.
Another limitation is related to measures specific to social disorganization and land use in college towns and smaller cities. First, we used the LDI to measure the degree of social disorganization of Bloomington block groups. While this index is commonly used in structural studies of violence, thus far it has been used only in analyses using larger study areas (e.g., usually large cities). Thus, little is known about whether this index can appropriately capture the degree of social disorganization in smaller cities. Additionally, measuring the level of social disorganization as the percentage of ethnic heterogeneity within a block group may be problematic, as its opposite, severe racial segregation, has been shown to be associated with violence in large cities. That is, severe racial segregation in urban cities is associated with social disorganization and is related to local rates of crime and violence. In small cities like Bloomington, a certain proportion of segregation may not be along racial lines but may occur with segregation of students. This qualitatively different type of segregation is unlikely to have the same type of effect on assaults in college towns and smaller cities, relative to large urban cities.
A final main limitation has to do with the measures of land use. Given that few studies have examined the interaction between alcohol outlet density and land use (for exceptions, see Pridemore & Grubesic, 2012c; Stucky & Ottensmann, 2009), and none using a college town or small city, this part of the study was purposely exploratory in nature and it is thus difficult to compare the results of this part of the study to the results of prior studies. In this study, we focused less on how specific land use types influenced the association between alcohol outlet density and violence and more on whether such moderating effects existed. Doing so gives a limited picture of the effect of different types of land use on the relationship between alcohol outlets and assaults as it does not allow for comparison of results across studies. Future research should not only explore more carefully the moderating effects of individual land use types but also how particular types of land use (e.g., residential multifamily, residential high density, mobile housing) may condition the effect of alcohol outlet density on alcohol-related problems in local communities.
Conclusion
Using Bloomington, Indiana, block groups as the unit of analysis we found consistent associations between assault density and total, off-premise, bar, and alcohol-serving restaurant outlet density. We found no association between social disorganization and simple assault, between social disorganization and aggravated assault, and only limited evidence of direct effects of land use on violence. Unlike recent studies of larger urban areas, we found that the relationship between alcohol outlet density and assault density is moderated by neither social disorganization nor land use patterns. At least as it relates to our study area and sample, then, the conclusion to be drawn is that structural characteristics like social disorganization and land use may have less influence on violence, and on the association with violence of other structural characteristics, in a college town and smaller cities than they do in large urban areas.
As for social disorganization, we suggested that one reason for this might be that the level, or quantity, of social disorganization outside large urban areas may not reach the level of social disorganization in a large city. A second reason for this difference might be that the quality of social disorganization in college towns may be different from that of a large urban city. For example, the presence of college students—many of whom could be considered poor, who move in and out of their residences on a yearly basis, and who come from different ethnic backgrounds—creates a qualitatively different type of social disorganization that may be less damaging than the traditional social disorganization we normally envision when examining large urban areas. The ecology of socially disorganized block groups may appear grimmer and many more times magnified in an urban city relative to the ecology of socially disorganized block groups in a college town, even a larger one like Bloomington. Walking through a socially disorganized neighborhood in a college town or smaller city may be a very different experience than doing so in a socially disorganized neighborhood in a large urban city.
In sum, the lack of a moderating effect of social disorganization and of land use on the relationship between alcohol outlets and assaults in a large college town suggests that there may be something in the structure of smaller cities and towns, and the routine activities of individuals who live in a college town, that are different than that which would be found in a large urban city. Future research should examine other nonurban settings for the moderating effect of social disorganization and land use on the relationship between alcohol outlets and assaults to tell us whether the lack of moderating effect found in this study is unique to our study area in a large college town or whether it is characteristic of smaller cities and towns more generally.
Footnotes
Acknowledgments
The authors thank Tony H. Grubesic, Richard Spano, William Oliver, and Robert Nash Parker for their critiques of earlier drafts of this manuscript. They also thank the City of Bloomington, the Bloomington Police Department, and the Indiana Alcohol and Tobacco Commission for providing them with the data for this research.
Declaration of Conflicting Interests
The authors declared no potential conflicts of interest with respect to the research, authorship, and/or publication of this article.
Funding
The authors disclosed receipt of the following financial support for the research, authorship, and/or publication of this article: This research was supported by a grant awarded to the second author by Indiana University’s Faculty Research Support Program and administered by the Office of the Vice Provost for Research.