
Abstract
Previous studies have shown that method effects associated with item wording produce artifactual factors and threaten scale validity. This study examines item wording effects on a scale of attitudes toward learning mathematics for Taiwanese and U.S. samples. Analyses from a series of CFA (confirmatory factor analysis) models support the presence of method effects for both samples. In addition, findings show that U.S. students tended to report higher means on not only the substantive factors but also the method factor, compared to Taiwanese students. The effect sizes on the mean differences are medium to large.
Keywords
Self-report scales are frequently used in applied research to collect data from individual participants to assess various constructs such as personality and attitudes. Researchers have suggested that scales contain a roughly equal number of positively and negatively worded items (e.g., Nunnally, 1978). The idea of including negatively worded items is to maintain respondents’ cognitive consciousness on the item contents and to avoid them establishing an automatic responding pattern due to uniformly positively worded items such that scale score is a more accurate reflection of participants’ true score on the constructs (e.g., Podsakoff, MacKenzie, Lee, & Podsakoff, 2003). In a review of scale development practices in the study of organizations, Hinkin (1995) reported that 41% of the studies used questionnaires with negatively worded items. However, studies have repeatedly shown that including both positively and negatively worded items into a scale likely produced artifactual or method factors (e.g., Harvey, Billings, & Nilan, 1985). Method factors differ from substantive factors in that they are attributable to specific measurement methods (e.g., similar item wordings) rather than to the construct of interest (Bagozzi & Yi, 1991) and, therefore, threaten scale validity.
Method effects due to item wording have been found in the measure of self-esteem (e.g., Tomás & Oliver, 1999), physique anxiety (Motl & Conroy, 2000), job diagnostic survey (Harvey et al., 1985), and across different groups (e.g., DiStefano & Motl, 2009). The majority of these studies were conducted on adults and rarely on children. Children may have difficulties in understanding negatively worded items due to their verbal abilities and cognitive development. We expected that they would respond differently to positively and negatively worded items, and item wording effects were substantial. In a study investigating the impact of item phrasing on the validity of an attitudinal scale for fourth to sixth graders in the United States, Benson and Hocevar (1985) compared children’ self-rating on two sets of 15 items with same contents but with different phrasing. Items were worded positively in one set but negatively in the other set by adding “not” or “do not” to the positively worded items. Each item was rated on a scale of 1 (strong agree) to 5 (strong disagree). They found that children tended to report less favorable attitude on negatively worded items (regressed toward the scale point of 3) than positively worded items with same content. In addition, factor loadings obtained from the confirmatory factor analysis (CFA) based on the negatively worded items were generally lower than those based on the positively worded items. They argued that young children may not be able to express agreement by indicating disagreement with a negative statement or to express disagreement by indicating agreement with a negative statement.
This study examined method effects due to item wording on an attitudinal scale toward learning mathematics (hereafter attitudes) for fourth graders from a cross-cultural perspective, specifically, by comparing the Taiwanese and the U.S. samples using data from the Trends in International Mathematics and Science Study (TIMSS) collected in 2007. We focused on cross-cultural comparison because there have not been such endeavors. Commonly speaking, students with positive attitudes (e.g., liking mathematics) tend to achieve higher in mathematics (Mullis, Martin, & Foy, 2008). One may expect that students in East Asia (e.g., Taiwan) possessed more positive attitudes than their counterparts in the West (e.g., United States) because they outperformed in mathematics achievement (Mullis et al., 2008). Strikingly, students in Taiwan, like those in many other Asian countries, showed relatively negative attitudes, compared to students in the United States. Leung (2002) provides potential reasons to explain these findings: (a) Cultural value of modesty: Affected by the Confucian culture, students in Taiwan are taught not to boast about themselves. The Chinese saying of “Pride hurts, modesty benefits” may well articulate this cultural value. (b) The high standards along with the competitive examination systems within Asian countries: Although producing higher achievement scores than their counterparts in the West, most students in Asian countries are classified as failures under the competitive examination systems. They may, therefore, lack confidence in their ability and grow to dislike mathematics. In addition, Taiwanese teachers seldom encourage students because of fear that praise may result in students putting forth less effort and in turn becoming complacent.
Purpose of this Study
This study has two purposes. We first examined the presence of method effects due to item wording on the scale for both samples. If present, we examined which group of students tended to report higher scores on the substantive factors as well as the method factor. To answer the first research question, a series of Correlated-Trait Correlated-Method models from CFA framework (CFA-CTCM; for example, Widaman, 1985) was conducted on each sample. To make cross-cultural comparison on the factor scores, multiple-group CFA-CTCM models were conducted on the combined sample. We next described in detail CFA-CTCM models.
CFA-CTCM Models
In the past five decades, researchers have developed multiple analytic procedures to examine scale score validity (specifically, convergent and discriminant validity) and to detect method effects (e.g., Campbell & Fiske, 1959). A popular technique is referred to as CFA-CTCM. In a CFA-CTCM model, in addition to the substantive factors (i.e., trait factors) underlying the items measuring the construct of interest, a factor is specified among the items using same measurement methods. For example, if a scale contains both positively and negatively worded items, two method factors are specified: One underlies all negatively worded items and the other underlies all positively worded items. Typically, substantive factors and method factors are uncorrelated. CFA-CTCM models can then be compared to the models without method factors to evaluate the presence of method effects, for example, by chi-square difference test. However, CFA-CTCM models usually encounter identification problems, inadmissible solutions, and fail to provide a clear distinction between the meaning of substantive factors and method factors (Eid, 2000; Marsh, 1989). To overcome these limitations, Kenny and Kashy (1992) and Eid revised the CFA-CTCM model such that the number of method factors is M-1 where M is the number of measurement methods and it is referred to as the CFA-CTC(M-1) model. For the example mentioned above, the number of method factor is 1 either for positively or negatively worded items but not both.
In a CFA-CTC(M-1) model, one of the methods should be chosen as a comparison standard. The observed score variance on the items measured by the comparison standard, for example, positively worded items, is decomposed into trait component and residual component. The observed score variance for negatively worded items includes one additional component: method-specific component. If the trait component is dominant and method-specific component is small, it suggests that two methods (positive wording and negative wording) measure the same trait consistently, which is an evidence of convergent validity. On the other hand, if method-specific component is dominant relative to trait component, then the two methods provide inconsistent measures of the construct of interest (see Eid, 2000). In this study, we adopted the CFA-CTC(M-1) models and the method factor was specified for negatively worded items based on the special nature of participating children and the findings from Benson and Hocevar (1985).
Method
Data Source
Data on the fourth graders’ attitudes toward learning mathematics were retrieved from the TIMSS study in 2007. The TIMSS study was chosen because it is the largest international achievement study and has been widely used to investigate cultural differences in students’ learning mathematics. A stratified systematic sampling technique was used in the TIMSS-2007 sample design, with sampling probabilities proportional to school’s size of enrollment. A sample of schools was drawn and then a sample of classrooms within schools was selected. There were 515 classes nested within 257 schools for the American sample and 174 classes within 150 schools for the Taiwanese sample. The Taiwanese sample had 4,111 fourth graders with 2,127 (51.7 %) boys and 1,984 (48.3%) girls. The American sample had 7,831 fourth graders with 3,828 (48.9%) boys and 4,003 (51.1%) girls.
Instrument
The attitudinal scale consisted of 7 items (see Table 1) intended to measure two aspects of students’ attitudes: Items 1 to 3 measured students’ positive affect toward mathematics (ATM) and Items 4 to 7 measured students’ self-confidence in learning mathematics (SCM; Martin & Preuschoff, 2008). Item 2, 5, and 6 were negatively worded and others were positively worded. Students were asked to respond to these items using a 4-point scale (1 = agree a lot to 4 = disagree a lot). Scores on positively worded items were reversely coded so that higher scores on all items indicated more positive attitudes. The questionnaires used in the TIMSS study were originally developed in English and then translated into various languages (e.g., traditional Chinese used in Taiwan). A strict translation-review-verification procedure was used “to create excellent quality translations that were appropriately adapted for the national context and at the same time are internationally comparable” (Mullis et al., 2008, p. 63).
Mean, Standard Deviations, and Correlation Matrix Among Seven Items
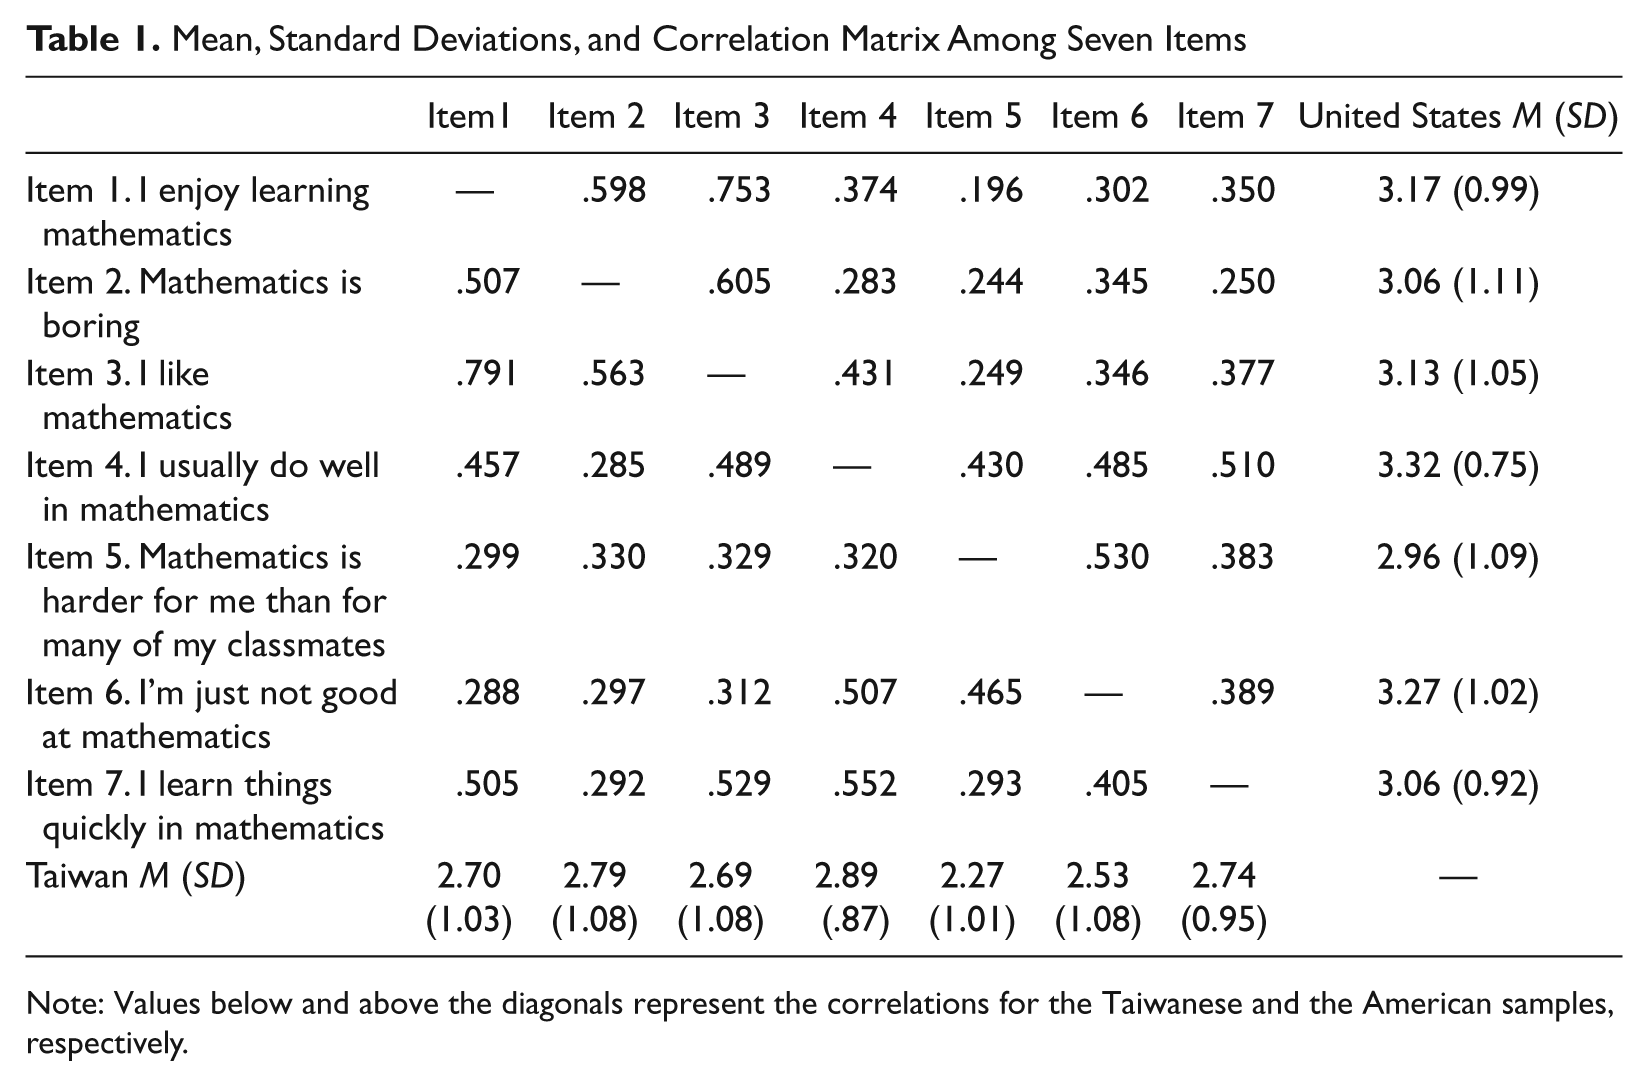
Note: Values below and above the diagonals represent the correlations for the Taiwanese and the American samples, respectively.
Model Specifications and Evaluations
Three CFA-model (Figure 1) analyses were conducted to examine method effects associated with item wording for each sample. Model 1a was a one-factor model consisting of a general attitude factor. We did not expect this model to fit adequately to the data, but the loadings should be relatively large to ensure the scale was essentially unidimensional. Model 1b contained two correlated factors with Items 1 to 3 on ATM factor and Items 4 to 7 on SCM factor. Models 1c was a CTC(M-1) model containing two correlated factors as specified in Model 1b plus a method factor underlying three negatively worded items. A superior of Model 1c over Model 1a and 1b would suggest the presence of method effects.
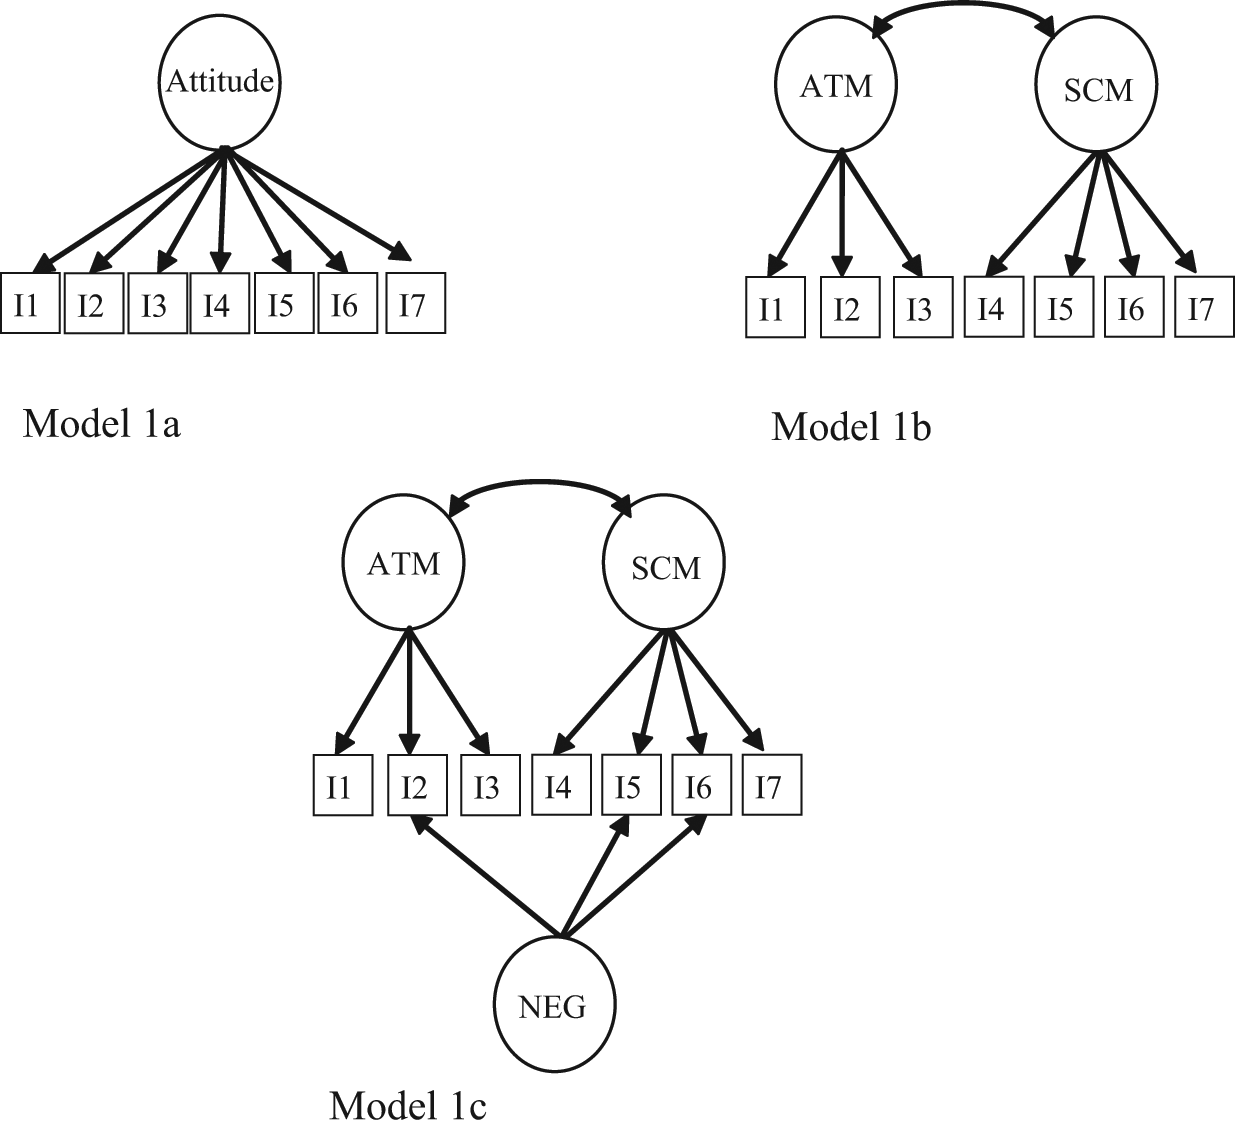
Models for the factor structures of the scale of attitudes toward learning mathematics
If Model 1c was chosen for both samples, a series of two-group CFA-CTC(M-1) models with increasing restricted levels of invariance (Millsap & Kwok, 2004) were evaluated to examine group mean difference on the latent factors (method and substantive factors) following the step procedure laid out in Thompson and Green (2006). The first step was to examine configural invariance to check whether two groups demonstrated the same factor structure (Model 2a). Model 2a was the same as Model 1c except the analysis was conducted on the combined sample with country as a grouping variable. If this model yielded adequate fit, configural invariance was supported. We then imposed equality constraints across groups on the factor loadings (metric invariance; Model 2b) and then on the item intercepts (scalar invariance; Model 2c). In this procedure, models with more constraints were nested within models with fewer constraints. If at least some of the loadings and intercepts were invariant (i.e., partial measurement invariance), we proceeded to compare group mean difference on the latent factors (latent factor mean invariance; Model 2d).
All CFA models were conducted using Mplus 5.21 (Muthén & Muthén, 1998-2009) with robust maximum likelihood (MLR) estimation. To evaluate model-data fit, the following commonly reported criteria were applied: nonsignificant model chi-square, comparative fit index (CFI) greater than 0.95, root mean square error of approximation (RMSEA) less than 0.06, and standardized root mean residual (SRMR) less than 0.08 (Hu & Bentler, 1999). Because the sample in this study was large, even trivial differences in model specification may result in significance of chi-square test. We thus de-emphasized the importance of chi-square test and chi-square difference test on the model-fit evaluation procedure. Instead, we used the differences in CFI, TLI (Tucker–Lewis Index), and RMSEA indices to evaluate the relative fit for nested models in measurement invariance analyses. Using simulation studies, Chen (2007) suggested that if the decrease in CFI for the more constrained model is less than 0.01 and TLI and RMSEA show as good or a better fit than those for the less constrained model, the more constrained model is preferred, meaning that measurement invariance is supported.
Results
Descriptive Statistics
Table 1 provides mean and standard deviation for each item and correlation matrix among items. Students in Taiwan tended to reported lower scores on each item (i.e., less favorable attitudes) than students in the United States. The correlations among these items ranged from .20 to .80, the majority of which fell in the range of .30 to .50. Overall, the correlations were comparable between the Taiwanese and the U.S. samples. In addition, the correlations among the items measuring the same hypothesized substantive factors (i.e., ATM and SCM) were higher than the correlations among items measuring different hypothesized substantive factors.
Method Effects for Each Sample
The three CFA-CTC(M-1) models were first analyzed for each sample. The proportion of missing data on items ranged from 0.3% to 0.5%. There was no evidence that missing values on an item were associated with other items or the country. We treated the missingness on this small proportion of data completely as random and applied the full information maximum likelihood estimation method. Table 2 presents model chi-square and fit indices for each model. As expected, Model 1a did not fit well for both samples but yielded reasonably large standardized loadings within a range of 0.40 to 0.90. For both samples, Model 1b demonstrated reasonable fit except for RMSEA, while Model 1c fit the data very well and substantially better than Model 1b. In addition, we analyzed a model with one general factor (across all items) and one method factor (across negatively worded items). It fit poorly. These results supported the two substantive factor structure with method factor associated with negatively worded items. Although not reported, Model 1c also fit the data very well and substantially better than Model 1b in the combined sample.
Fit Indexes of CFA-CTC(M-1) Models
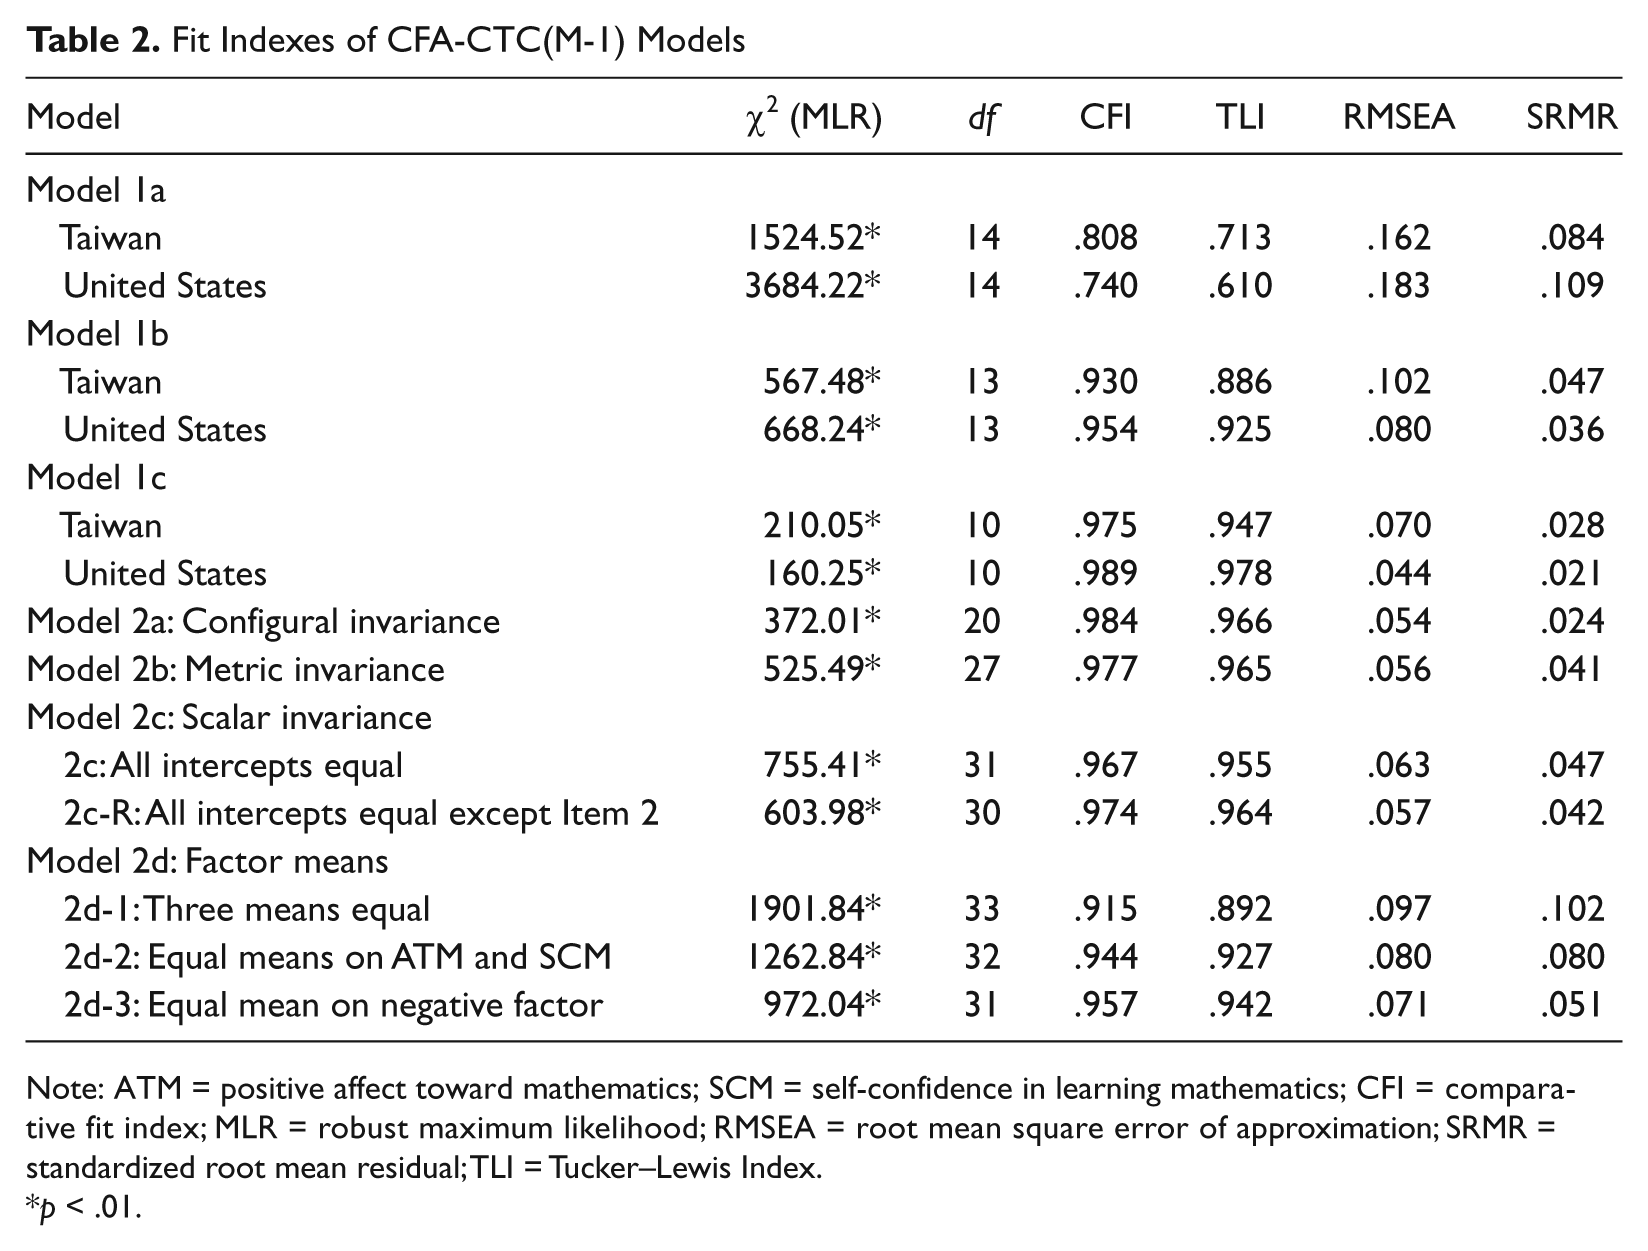
Note: ATM = positive affect toward mathematics; SCM = self-confidence in learning mathematics; CFI = comparative fit index; MLR = robust maximum likelihood; RMSEA = root mean square error of approximation; SRMR = standardized root mean residual; TLI = Tucker–Lewis Index.
p < .01.
Latent Factor Mean Comparison Across the Taiwanese and the American Samples
We next examined mean differences on the latent factors between the two groups by analyzing and comparing Model 2a to 2d on the combined sample. The results were shown in Table 2. Model 2a fit the data reasonably well, supporting configural invariance. In Model 2b, all freely estimated loadings were constrained to be equal. Variance of the three-factors was fixed as one in the U.S. sample while freely estimated in the Taiwanese sample. Model 2b resulted in better fit than Model 2a with a decrease in CFI value, at about 0.007 (smaller than 0.01), and similar TLI and RMSEA values, indicating that metric invariance was supported. Next, scalar invariance (Model 2c)was examined by imposing equality constraints on the intercepts. For this model, the three-factor means for the U.S. sample were arbitrarily fixed as zero but were freely estimated for the Taiwanese sample. Model 2c showed much worse fit than Model 2b. The equality constraint on the intercept of Items 2 (“Mathematics is boring”) was removed based on the values of modification indices (Model 2c-R). Compared to Model 2b, this model yielded a decrease of 0.003 in CFI value and almost identical TLI and RMSEA values. We therefore made no further modification and concluded that the two samples demonstrated partial scalar invariance (all but Item 2).
With partial invariance established, we then examined the mean differences on the latent factors. In this step, we analyzed three models: all factor means to be equal across groups (Model 2d-1), means of two substantive factors but not the method factor to be equal (Model 2d-2), and only the mean of the method factor to be equal (Model 2d-3). All three models demonstrated substantially worse fit compared to Model 2c-R, suggesting that the means on the three factors were not equal across groups. Table 3 reports standardized loading(s) for each item as well as mean and variance of factors based on Model 2c-R. On average, students in Taiwan had lower means on all three factors (i.e., less favorable attitudes). The standardized mean difference d was 0.465, 0.645, and 0.622 for the ATM, SCM, and method factor, respectively, indicating medium to large effect sizes. The R2 (percentage of variance explained by the factors), which was an index of item reliability, ranged from .43 to .84. The method-specific variance was computed as the ratio of squared standardized loading associated with method factor divided by R2. This index represented the percentage of true score variance accounted for by the method factor. The values ranged from .10 to .45.
Standardized Loadings, Factor Means and Variance, and Variance Components Based on Model 2c-R
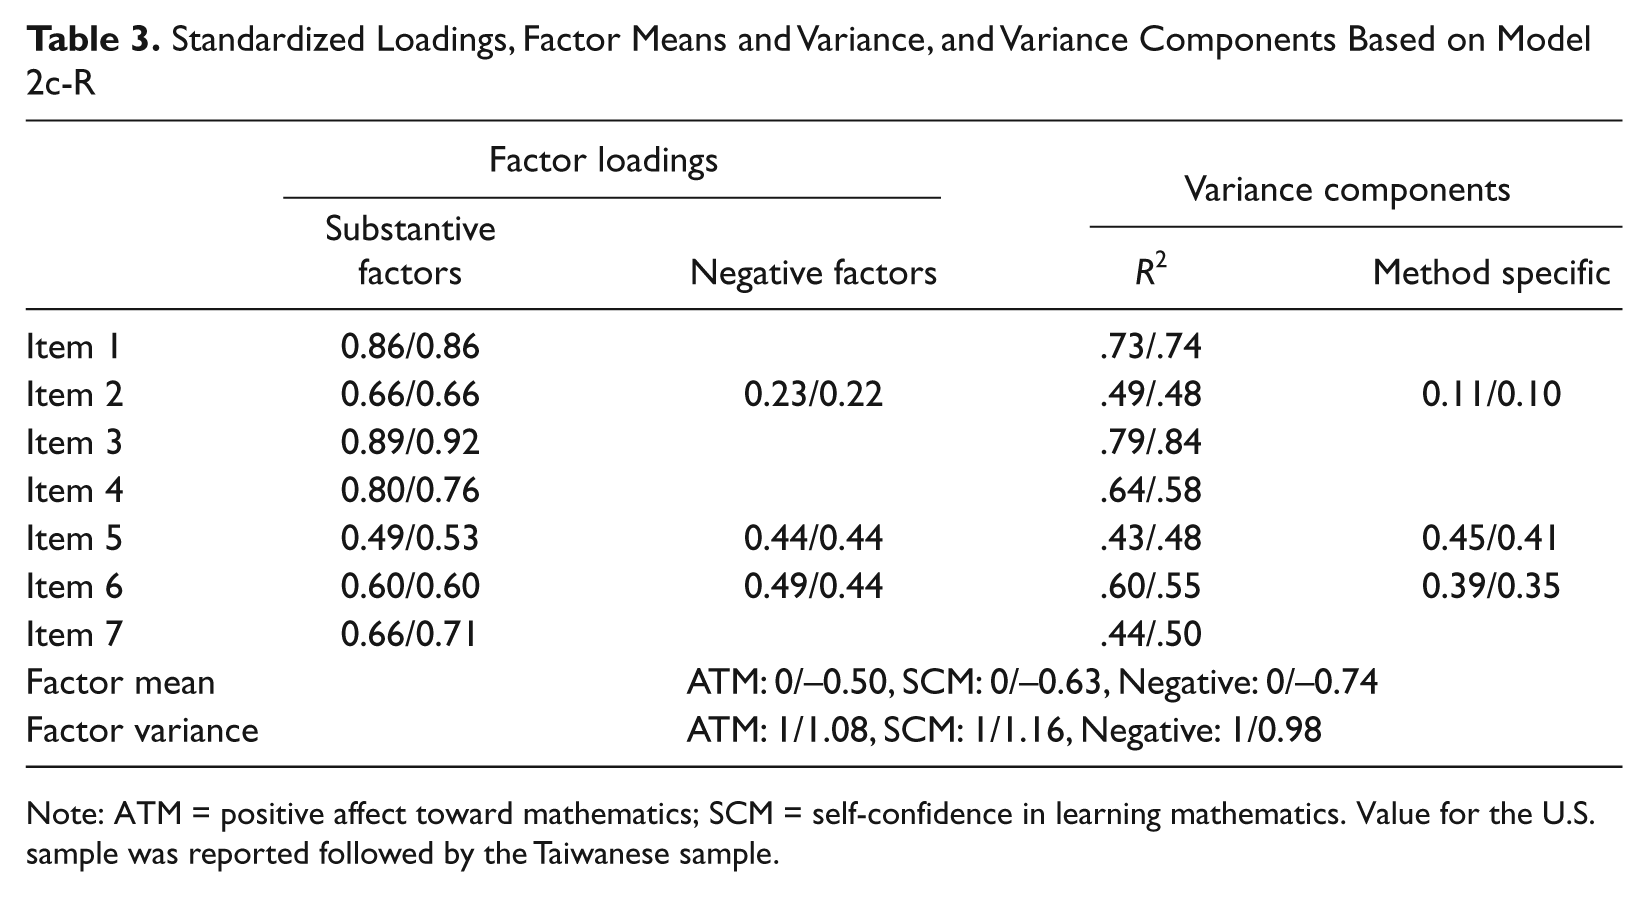
Note: ATM = positive affect toward mathematics; SCM = self-confidence in learning mathematics. Value for the U.S. sample was reported followed by the Taiwanese sample.
Discussion
As advocated in the Standard for Educational and Psychological Testing (American Educational Research Association, American Psychological Association, & the National Council on Measurement in Education, 1999), researchers and practitioners need to be aware of sources of measurement errors that threaten reliability and validity when interpreting scale scores. Researchers have identified multiple sources of measurement errors, among which method effects associated with item wording have been considered as one of the main sources producing measurement errors (e.g., Podsakoff et al., 2003). In this study, we applied CFA-CTC(M-1) models to a scale measuring fourth graders’ attitudes toward learning mathematics used in the TIMSS-2007 study. Our results supported the presence of method effects associated with item wording, and the method effects were generalizable across the U.S. and Taiwan samples.
One perspective is that the positively worded items are more prone to acquiescence and exaggeration and thus yield overestimates of children’ attitudes, and inclusion of negatively worded items counteracts some problems with positively worded items and helps produce more accurate scores. However, our analyses suggested that negatively worded items tended to yield less reliable scores. Reliabilities (R2; see Table 3) were relatively low for Items 2, 5, 6, and 7, three of which were worded negatively. A similar finding was obtained in Benson and Hocevar (1985). For Items 5 and 6, the standardized loadings on the substantive factor were 0.49 to 0.60, which seem to be considered as satisfactory convergent validity. However, their corresponding loadings on the method factor were also high, ranging from 0.44 to 0.49; the method factor accounted for 35% to 45% of the true score variance. In other words, they led to an inconsistent measure of trait factors with positively worded items and thus threatened convergent validity (Eid, 2000).
Based on the parameter estimates from Model 2c-R, the percentage of variance among negatively worded items (i.e., subscale score) accounted for by the method factor could be computed; the value was 25% and 22% for the U.S. and the Taiwanese samples, respectively. In other words, about one fourth of their score variance was invalid because it was attributable to the measurement method instead of trait factors (SCM and ATM). The finding of a large method effect was consistent with what was summarized by Cote and Buckley (1987) across 70 empirical studies, although different analyses were applied. In addition, internal consistency reliability for total scale scores could also be computed. Interpretation of total scale score was meaningful because these items demonstrated essential unidimensionality. Reliability concerns about the consistency of scores if a measurement is readministered under same conditions (Lord & Novick, 1968). Both trait and method factors lead to consistent scores and thus contribute to scale score reliability. The scale score reliability coefficient was .876 and .883 for the U.S. and the Taiwanese samples, respectively. It should be noted that reliability coefficient computed in this way is coefficient omega (McDonald, 1999). It yields more accurate estimate of reliability than Cronbach’s alpha when the items do not meet restrictive assumptions such as tau-equivalency assumption (see Yang & Green, 2011, for discussion and demonstration of various reliability estimation methods). As a comparison to coefficient omega, Cronbach’s alpha was .821 for the U.S. sample and .837 for the Taiwanese sample.
It is important to note that our analyses did not lead to a conclusion that method effects were due to negative wording, and the survey developer should avoid considering this type of item in scales. For the purpose of evaluating reliability and validity of scores using CFA-CTC(M-1) models, either positively or negatively worded items could be chosen as comparison standard. The choice of comparison standard may affect model fit and yield different sets of parameter estimates but not the conclusion regarding item wording effects. To demonstrate, we analyzed all CFA-CTC(M-1) models with the method factor underlying positively worded items. Each of these models yielded slightly better fit partly due to estimating one or more parameters. The analyses led to the same conclusions on measurement invariance (e.g., partial invariance was supported) and comparable reliability estimates for both individual items and the total scale. Method factor also accounted for a large portion of variance (about 20%-35%) among the positively worded items. On the basis of our analyses, we felt comfortable to conclude that although these items were intended to measure the same latent construct (attitudes), use of different item wording led to inconsistency in scores.
We wish to understand why fourth-grade students perceived positively and negatively worded items regarding attitudes in different ways. As shown in Table 3, the method-specific component was smallest for Item 2 (“Mathematics is boring”) but largest for Item 5 (“Mathematics is harder for me than for many of my classmates”). Item 2 has only three words, and “boring” is commonly used among younger children. It is likely that for Item 2 negative wording did create a “bump” in information-processing procedure, but it was cognitively manageable for younger children. However understanding Item 5 required wider attention span and higher level of language abilities. In fact, Item 5 also had lowest mean score in both samples (see Table 1). We argue that, for younger children or some special populations, lower reliability on negatively worded items and the resulting inconsistent scores between positively and negatively worded items may be consequences of limited attention span or lack of language proficiency. For instance, a previous study found that younger students and students with poorer reading skills were not able to respond appropriately to negative items on rating scales (Marsh, 1986). However, this might not hold true for older children or adults. To fully understand this issue, further studies should be conducted, for example, to correlate the method factor to the children’s reading abilities and attention span.
Another focus of this study was to compare mean differences on the latent factors between two samples. Commonly, group comparisons are conducted at the observed score level using statistical analyses such as t test and ANOVA (analysis of variance). These statistical procedures assume the observed scores are equally reliable and items in the scale function equally well across groups. However, this might not be true in practice and should be examined before group comparison are being made. By analyzing a series of two-group CFA-CTC(M-1) models, we established measurement invariance between the U.S. and the Taiwanese samples for this attitudinal scale. The findings from our results suggested that the 7 items functioned equally well as evidenced by the tenability of metric invariance and scalar invariance (all but one item). With this establishment, we drew a conclusion that students in the United States tended to report more positive attitudes compared to Taiwanese students, with medium to large effect sizes. This finding echoed Leung’s (2002) explanations about the cultural differences between the East (e.g., Taiwan) and the West (e.g., United States).
In summary, this study examined method effects associated with item wording on the TIMSS 7-item attitudinal scale and found them to be generalizable across the U.S. and the Taiwanese samples. Our findings suggested that researchers and practitioners need to be aware of the item wording effects and take them into consideration in item writing, particularly for younger children. For example, test developers might consider expressing negatively worded items as simple as possible with words that children are familiar with. After data are collected, statistical analyses can be conducted to examine psychometric properties of the scale scores, to detect method effects, to investigate the relationship between method effects and other variables, to further understand what factors lead to score mean differences across cultures on not only substantive factors but also method factor, and so on.
Footnotes
Declaration of Conflicting Interests
The author(s) declared no potential conflicts of interest with respect to the research, authorship, and/or publication of this article.
Funding
The author(s) received no financial support for the research, authorship, and/or publication of this article.