
Abstract
For decades, research has indicated that preadolescents’ self-concept is comprised of subject-specific academic factors, a general academic factor, and several nonacademic factors. More recently, there have been some indications that academic self-concept might further be differentiated into competence and affect factors, at least for some preadolescent ethnic groups. This study examines the extent to which a 6-factor model of academic self-concept, in which competence and affect are distinct, is tenable for White, Hispanic, and Native American preadolescents. A total of 313 White, 331 Hispanic, and 224 Native American preadolescents from the southwestern United States were administered a modified version of the SDQI. A confirmatory factor analysis (CFA) indicated that the 6-factor model of academic self-concept was tenable. A multiple-groups CFA suggested that the 6-factor model was largely group invariant between White and Hispanic and White and Native American preadolescents. However, important differences in the structures were identified.
Self-concept describes a person’s self-regard, and is an important outcome variable in numerous fields of psychology (Seaton, Marsh, & Craven, 2009; Shavelson, Hubner, & Stanton, 1976). Academic self-concept shares a reciprocal relationship with academic achievement, so that academic self-concept informs academic achievement, and in turn academic achievement contributes to academic self-concept (Guay, Marsh, & Boivin, 2003; Marsh & Craven, 2006). Shavelson et al. (1976) proposed a theoretical model of self-concept where self-concept is organized in a hierarchy, with general self-concept at the apex, and further differentiated into multiple dimensions. In the model, self-concept is divided into academic and nonacademic dimensions, and these are further differentiated into lower-level constructs, such as math and reading.
To specifically reflect the theoretical model proposed by Shavelson et al. (1976), Marsh developed the Self-Description Questionnaires (SDQs) to test self-concept among preadolescents (SDQI), early adolescents (SDQII), and late adolescents and young adults (SDQIII; Marsh, 1988; Marsh & Craven, 2006). The SDQI measures eight factors (physical abilities, physical appearance, peer relations, parent relations, reading, math, general school, and general self), or four nonacademic, three academic, and one general factor of self-concept, respectively (Marsh, 1988). The SDQI has been subject to validation across a range of ages, settings, and cultural groups, where the multidimensional nature of self-concept has been supported (Byrne, 1996; Marsh & Craven, 2006); and reliability generalization analysis has demonstrated generally strong internal consistency for SDQ scores (Leach, Henson, Odom, & Cagle, 2006). Historically, research on the SDQI using confirmatory factor analysis (CFA) examined item pairs each containing a competence item and an affect item rather than examining the loadings of items individually, so it was not possible to see whether competence and affect would emerge as separate factors (Marsh, Craven, & Debus, 1999). However, more recent research provides some initial evidence that when items are allowed to load individually, separate competence and affect factors may emerge (Marsh & Ayotte, 2003; Marsh et al., 1999). A goal of the current study was to test the factor structure of academic self-concept where subject-specific domains of academic self-concept are differentiated by affect and competence, with a sample of preadolescents from the United States. If support were found for this differentiation of affect and competence, a second goal would be to determine the extent to which this factor structure would hold for diverse populations of preadolescents in the United States.
The Separation of Competence and Affect Components
Implicit in the design of Marsh’s SDQs is the assumption that one’s domain-specific academic self-concept is comprised of competence and affective components, and that these components combine to form a unitary factor for each different academic subject area (Marsh & Ayotte, 2003; Marsh et al., 1999). The competence component of self-concept focuses on competency judgments, including questions concerning the ease, speed, and success of learning in different school subjects, while the affective component focuses on interest and enjoyment in different school subjects. According to Marsh et al. (1999), theoretical rationale for the separation of competence and affective factors of academic self-concept exist to better clarify the relationship between academic self-concept and a number of other cognitive and motivational constructs, including intrinsic motivation (Ryan & Deci, 2000), task value (Eccles & Wigfield, 2002), and self-efficacy (Bong & Clark, 1999). For example, Pietsch, Walker, and Chapman. (2003) found empirical support for separating the competence and affect components of mathematics self-concept, and found that self-efficacy items and self-concept competency items from the SDQII load on a single factor.
Chapman and Tunmer (1995) found weak support for separating perceptions of competence, perceptions of difficulty, and attitudes toward reading in a study examining reading self-concept among 5- through 7-year-old New Zealand school children, at three grade levels, suggesting there may be a difference between competence and affective components of self-concept. Similarly, results from two studies conducted by Marsh et al. (1999) indicated that competence and affective components of academic self-concept might tentatively be considered as separate factors. Correlations between competence and affect components within each of the academic domains were consistently in the 0.70s, indicating that these components are highly related, but also somewhat distinct.
A Canadian study using a French version of the SDQI, examining both academic and nonacademic self-concept factors, demonstrated that CFA models positing the separation of competence and affect components for academic domains fit the data better than those positing single domain-specific self-concept factors (Marsh & Ayotte, 2003). Here again, correlations between competence and affect components were high, ranging from 0.69 for general school to 0.80 for math, leading the authors to conclude that the results do not invalidate using the model where competence and affect factors are not separated. More research providing evidence of the relationship between competence and affective factors and external criterion, including background variables, may provide greater empirical justification for making a distinction between competence and affect factors of self-concept.
Multiple-Groups Research
Though the normative samples for the SDQ instruments were limited to school-age children from Sydney, Australia (Marsh, 1989), numerous additional studies have been conducted to test the cross-cultural validity of the structure of self-concept as measured by the SDQ instruments (Byrne, 1996). Across studies results indicate equivalence for many diverse groups, including Zimbabwean (Watkins & Mpofu, 1994), French (Guérin, Marsh, & Famose, 2003), Lebanese (El-Hassan, 2004), and Chinese students (Yeung & Lee, 1999). However, the factor structure of self-concept as measured by the SDQ instruments has been less clear among Central and South American, non-Chinese Asian, and diverse African populations (Marsh & Hau, 2004; Mucherah & Finch, 2010). For example, Marsh and Hau (2004) found smaller than usual correlations between academic self-concept and academic achievement for both math and verbal self-concepts among both the Mexican and Brazilian samples. In addition, for the Mexican sample, the correlation between math and verbal self-concept was unusually high, and the reliability for verbal self-concept was lower than normal. These results suggest that more research is needed to determine the factor structure of academic self-concept for students from Central and South American cultures.
In comparison to multinational studies, few studies have compared the structure of self-concept among ethnic groups within a country (Yin & Fan, 2003). In one study, using data from the U.S. National Educational Longitudinal Study of 1988 (NELS:88), Yin and Fan tested the factor structure of academic self-concept as measured by the SDQII with multiple-groups CFA. The researchers found reasonable support for factor invariance of academic self-concept among Asian, Hispanic, African American, and White adolescents in the United States. However, Native American students’ data were excluded from the analyses because out of the approximately 24,500 student records, only 85 usable records from Native American students were identified.
In addition, studies confirming the factor structure of self-concept where competence and affect are separated have limited cross-cultural representation, as these studies typically dealt only with Western populations of students, including New Zealander, French Canadian, and Australian students (Chapman & Tunmer, 1995; Marsh & Ayotte, 2003; Marsh et al., 1999; Pietsch et al., 2003). These White western subgroups may be more similar to the original populations who were studied than other cultural groups such as subgroups of U.S. students, including Hispanic and Native American students.
The current study examines the self-concept of three cultural groups within the United States, specifically White, Hispanic, and Native American preadolescents. Because a great deal of research has been conducted on groups with cultural similarities to White Americans, we investigated possible group invariance between this group and the lesser-researched Hispanic and Native American groups. Some researchers have suggested that the relative salience of individual self-concept might vary among students from collectivist cultures, such as Hispanic and Native American cultures (del Prado et al., 2007; Whitesell, Mitchell, Kaufman, Spicer, & the Voices of Indian Teens Project Team, 2006). In addition, relatively few studies have examined Native American self-concept, though the typical context of reservation life, tribal traditions, and rural living creates a social context for self-concept development (Whitesell et al., 2006).
Research Questions
In the current study, we statistically examined the affect and competence components of the academic self-concept dimensions measured in Marsh’s SDQI, such as reading, mathematics, and general school, resulting in a six-factor model of academic self-concept. The proposed six-factor model is presented in Figure 1.

Six-Factor Model of Academic Self-Concept.
As can be seen in the figure, good at school and like school are hypothesized to correlate with each other as well as the other four factors. Good at math is also hypothesized to correlate with like math, and good at reading is also hypothesized to correlate with like reading. The competing three-factor model does not separate school, math, and reading into the competence, good at, and affect, like, factors.
The study aimed to answer the following research questions: (1) Is the six-factor model of academic self-concept tenable for preadolescent children in the United States? (2) If so, is the six-factor model group invariant between White and Hispanic American preadolescents, and group invariant between White and Native American preadolescent populations?
Method
Subjects
The participants were 3rd- through 5th-grade students (approximately 8 to 11 years old) from 13 rural and urban public elementary schools in the southwestern United States. School records classified the students into one of three ethnic groups. A total of 313 participants were designated as White (162 = boys, 151 = girls), 331 were designated as Hispanic (161 = boys, 170 = girls), and 224 were designated as Native American (114 = boys, 110 = girls).
Instrument
A 24-item version of the SDQI was used to measure academic self-concept. All items were short statements in which participants indicated the extent to which they endorsed an item. An example item is, “I am interested in reading.” Some of the instrument’s items were slightly modified from the original version to be more consistent with the common vernacular of U.S. school children, including the following two changes: in three instances “marks” was changed to “grades” (e.g., “I get good grades in Reading”); and in eight instances mathematics was shortened to math, (e.g., “I like Math”). Measurement of each item was based on a 5-point Likert-type scale with 1 representing strongly disagree; 2, disagree; 3, sometimes agree and sometimes disagree; 4, agree; and 5, strongly agree.
Trained facilitators followed administration protocol for data collection as outlined in the SDQI manual (Marsh, 1988), and the administration took approximately 10 to 15 minutes per group. Only a very few students asked to use a Spanish version of the questionnaire—which was provided, and none of the Native American students requested a different language version of the questionnaire. Given that less than 1% of the 868 students used a translated version of the questionnaire, it was determined that possible effects due to the translation would not substantively impact the results, and thus the complete data set was retained.
Analyses
In all stages of the analyses, an analysis of covariance structures technique, with maximum likelihood (ML) estimation procedures as implemented in the computer software EQS 6.1 (Bentler, 1995-2008), was used. Following Byrne (2006), we report a χ2 statistic, the comparative fit index (CFI), and the root mean square error of approximation (RMSEA). We also include the 90% confidence interval for the RMSEA to provide an unambiguous indication of the potential for error in the estimates. The RMSEA and CFI use two quite philosophically different approaches to assessing model fit. The CFI compares the fit of the data for the proposed model to the fit of the data for the null model (the model in which the proposed model relationships are completely unrelated). A fit of above 0.95 is considered good, and fit values between 0.90 and 0.95 are considered approximate (Hu & Bentler, 1999). The RMSEA is an absolute fit index, which compares the lack of fit in a model to a completely saturated model. Values below 0.06 indicate good fit, and values between 0.07 and 0.10 indicate approximate fit (Ullman & Bentler, 2003).
Prior to the analyses, data screening indicated that the all assumptions were met except multivariate normality. Mardia’s normalized coefficient of multivariate kurtosis was large for each of the groups: White = 80.07, Hispanic = 65.83, and Native American = 50.99. To combat this problem, a corrected normal theory CFA method (Satorra & Bentler, 1994; Kline, 2005; Herzog & Boomsma, 2009) was employed in all analyses in the study.
Assessing the factor structure of self-concept
Data analyses procedures followed those recommended by Byrne (2006). The first step was to conduct separate six-factor confirmatory factor analyses for each of the preadolescent ethnic groups in the study to determine if this factor structure was tenable for each group. As can be seen in Figure 1, items were hypothesized to load on good at school (items 1, 6, 10, and 23), like school (3, 15, 20, and 25), good at math (5, 11, 16, and 21), like math (8, 13, 19, and 24), good at reading (2, 7, 18, and 26), and like reading (4, 9, 14, and 22). The school items were: (1) “I get good grades in school,” (6) “I am good at school,” (10) “Work in school is easy for me,” and (23) “I learn things quickly in school.” The four affect questions for school were: (3) “I enjoy doing work in school,” (15) “I like school,” (20) “I look forward to school,” and (25) “I am interested in school.” Items for reading and math were analogous to the items for general school. Factor correlations are based on previous research and can be seen in the model. In the second step, the fit of the competing three-factor model, in which, competence and affect are not differentiated—school, math, and reading are the three factors—was compared to the fit of the six-factor model.
Multiple-groups analyses
A multiple-groups analysis simultaneously analyzes data from different groups to determine if a hypothesized model reproduces the sample data for each group equivalently. Such analyses are conducted in steps in which an increasing number of parameters are constrained to be equal for the groups. In the third step of the analysis, the fit of the six-factor configural model was assessed, while in the fourth step, unstandardized factor loadings were constrained equal between the White group and other two ethnic groups to determine the extent to which the fit of the multiple-groups model was tenable. In the fifth step, all unstandardized factor loadings were constrained equal between the White and Hispanic groups and between the White and Native American groups to determine which, if any, were uninvariant. Unstandardized rather than standardized estimates were constrained equal because the variances in the samples are likely to be different. This required the estimation procedures to be conducted twice since unstandardized fixed paths cannot be estimated (Kline, 2005). The sixth step was to test for the equivalence of the factor structures between the White group and the other two groups. Factor covariances were constrained equal between Whites and Hispanics and Whites and Native Americans, and factor loadings were also constrained equal, except for the loadings for item 7 between Whites, Hispanics, and Native Americans, and item 8 between Whites and Hispanics, which were not found to operate equivalently across the groups. In the final step, a CFA was conducted in which all factor loadings except the three described in step six, and covariances, except one between good at math and like math for Whites and Hispanics determined to be uninvariant in step six, were constrained equal between the White and other two groups. Parameter estimates reported in Table 1 are from this final analysis.
Maximum Likelihood Standardized Estimates for Six-Factor Model of Self-Concept.
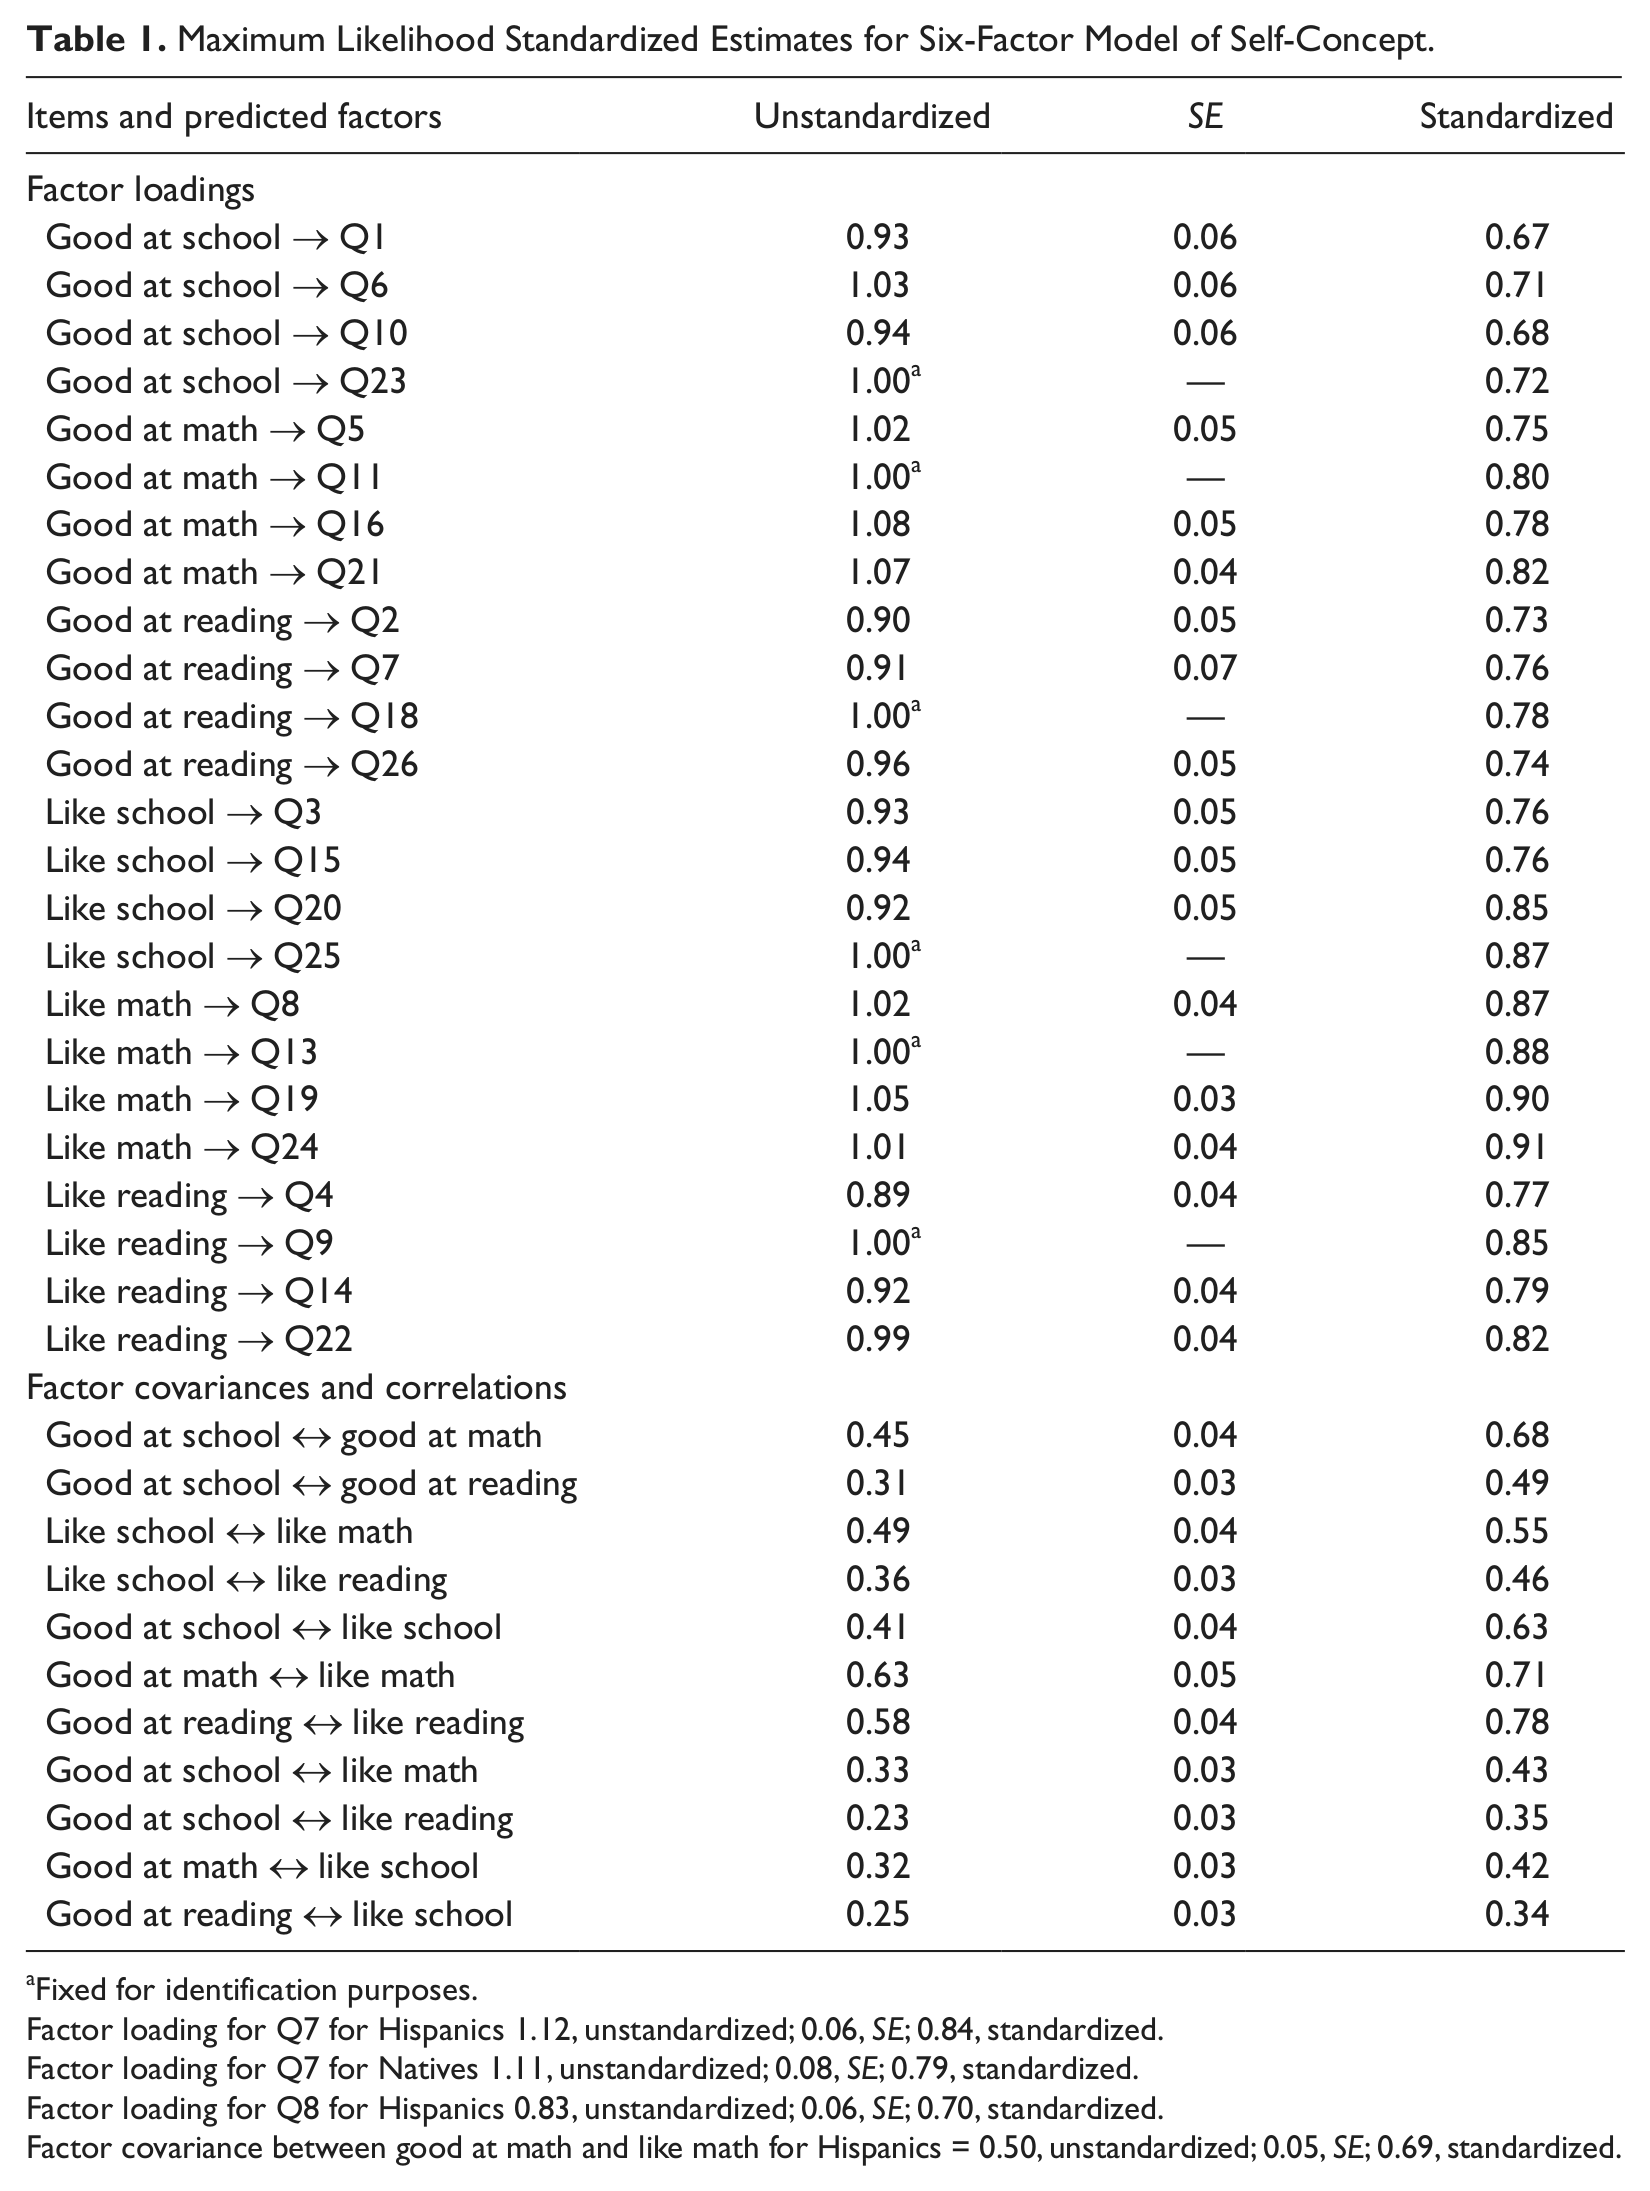
Fixed for identification purposes.
Factor loading for Q7 for Hispanics 1.12, unstandardized; 0.06, SE; 0.84, standardized.
Factor loading for Q7 for Natives 1.11, unstandardized; 0.08, SE; 0.79, standardized.
Factor loading for Q8 for Hispanics 0.83, unstandardized; 0.06, SE; 0.70, standardized.
Factor covariance between good at math and like math for Hispanics = 0.50, unstandardized; 0.05, SE; 0.69, standardized.
Results
Reliability Estimate and Descriptive Statistics
The reliability of the modified version of the SDQI, which was used to measure self-concept in the study, was 0.95 as estimated by the ρ reliability coefficient. ρ is considered a better indicator of reliability than the more commonly encountered Cronbach’s α when a model has more than one factor (Bentler, 2008; Schumacker & Lomax, 2004). On the 5-point Likert-type scale, means were in the upper part of the scale for each of the three groups ranging from 3.36 to 4.22 for the Whites, 3.43 to 4.40 for the Hispanics, and 3.42 to 4.17 for the Native Americans. Standard deviations were between 1.05 and 1.27 for the Whites, 0.93 and 1.16 for the Hispanics, and 1.04 and 1.21 for the Native Americans. All variables within each of the groups were positively correlated and were in the range of 0.09 to 0.82 for Whites, 0.08 to 0.74 for Hispanics, and 0.19 to 0.76 for Native Americans.
Six-Factor Model of Self-Concept
The data supported the six-factor model of self-concept for preadolescents, in which competence and affect are separated (see Figure 1). Model fit indices were as follows: White: S-Bχ2(241, N = 313) = 476, CFI = 0.945, and RMSEA = 0.056 (90% CI [0.048, 0.063]); Hispanic: S-Bχ2(241, N = 331) = 486, CFI = 0.904, and RMSEA = 0.056 (90% CI [0.048, 0.062]); and Native American: S-Bχ2(241, N = 224) = 426, CFI = 0.925, and RMSEA = 0.059 (90% CI [0.049, 0.068]). Conversely, the fit of the alternative three-factor model was poor for each of the groups. White: S-Bχ2(249, N = 313) = 783, CFI = 0.876, and RMSEA = 0.083 (90% CI [0.076, 0.089]); Hispanic: S-Bχ2(249, N = 331) = 971; CFI = 0.717, RMSEA = 0.094 (90% CI, [0.087, 0.100]); Native American: S-Bχ2(249, N = 224) = 609, CFI = 0.855, and RMSEA = 0.080 (90% CI [0.072, 0.088]). χ2 difference tests between the six-factor and three-factor models indicated that the six-factor model explained the data significantly better for all groups. 1 White: χ2difference (8, N = 313) = 433, p < .05; Hispanic: χ2difference (8, N = 331) = 610, p < .05; Native American: χ2difference (8, N = 224) = 421, p < .05.
Factor Structure of Academic Self-Concept Across Multiple Ethnic Groups
Results from the multiple-groups analyses supported a six-factor model that was largely invariant between the White group and the other two ethnic groups. The six-factor configural model, which represents the baseline model for each of the groups, without any equality constraints, approximately fit the data: S-Bχ2(723, N = 868) = 1,387, CFI = 0.928, and RMSEA = 0.056 (90% CI [0.052, 0.060]), and the fit of the multiple-groups model with equality constraints on the factor loadings similarly was shown to approximately fit the data: S-Bχ2(759, N = 868) = 1,429, CFI = 0.928, and RMSEA = 0.055 (90% CI [0.051, 0.059]), and was not significantly worse than the multiple-groups baseline (configural) model: S-Bχ2difference (36, N = 868) = 39.6, ns. This result was further supported by a lack in substantive change in CFI, which was less than 0.01. Cheung and Rensvold (2002) suggest that differences in CFI values of greater than 0.01 indicate practically important differences in model fit. A comparison of the configural model and the model in which the factor covariances were constrained equal were not found to be significantly different. The fit of the constrained factor model was judged to be approximate: S-Bχ2(778, N = 868) = 1,456, CFI = 0.927, and RMSEA = 0.055 (90% CI [0.051, [0.059]). The fit was not significantly worse than the multiple-groups baseline (configural) model: S-Bχ2difference(55, N = 868) = 21.7, ns, and change in CFI was less than 0.01, indicating that the factor structure was not significantly different for the groups.
Parameter comparisons also provided general support for a six-factor model, which was invariant between the White and the other two ethnic groups. χ2 difference tests across factor loadings indicated measurement invariance for the large majority of the items. Only items 7, “I am good at reading,” and 8, “I look forward to math,” showed significant group noninvariance between the White group and one or both of the other ethnic groups. Item 7 was group noninvariant across the White and Hispanic groups χ2difference (1, N = 644) = 5.58, p < .05 and the White and Native American groups, χ2difference (1, N = 537) = 5.48, p < .05, and item 8 was group noninvariant across the White and Hispanic groups: χ2difference (1, N = 537) = 5.11, p < .05.
χ2 difference tests indicated that only one of the eleven covariances operated differently between the White and the other two groups. The relationship between the good at math and like math for the White and Hispanic groups was not the same: χ2(1, N = 644) = 6.35, p < .05. The final model which allowed paths found to be different to vary across groups was judged as approximately fitting the data. S-Bχ2(777, N = 868) = 1,450, CFI = 0.927, and RMSEA = 0.055 (90% CI [0.051, 0.059]). Unstandardized estimates, S-B robust standard errors, and standardized estimates for this model are presented in Table 1.
Presented in the upper half of Table 1, high standardized factor loadings, that is, pattern coefficients, ranging from 0.67 to 0.91 suggest that the six hypothesized constructs follow well from the items. These high loadings provide evidence for the six-factor model. 2 The relationships among the factors, shown in the bottom half of Table 1, provide an indication of the distinctness of the six proposed factors of self-concept indicating that competence and affect are distinct factors. The first two correlations shown in the bottom half of Table 1 indicate that competence in school is highly positively related to competence in math and moderately positively related to reading, and the next two correlations indicate that affect for school is moderately correlated with affect for math and reading. The next three relationships provide an indication of the distinctness of competence and affect for each of the three academic areas. All are highly positively related, 0.63 for school, 0.71 for math, and 0.78 for reading, but all are well below 0.85, the typical criteria for determining distinctness between factors in a CFA (Brown, 2006). The last four correlations in the table that relate each of the academic factors with a different affective factor, though statistically significant, are the lowest, ranging from 0.43 to 0.34. These relatively lower correlations provide evidence that these factors, which have the least in common with each other, are more distinct than the other factors. Pattern coefficients and covariances between factors that were found to be uninvariant are presented beneath Table 1.
Discussion
The Six-Factor Model of Academic Self-Concept for Preadolescents
In general, our findings provide support for a six-factor model of academic self-concept, in which self-concept for each domain is separated into an affect and a competence factor. Separate confirmatory factor analyses on each of the three groups as well as multiple-groups analyses across the groups provide support for the proposed six-factor model. In addition, the fit of the six-factor model for each group was significantly better for each group than the three-factor model. Further support for the six-factor model is indicated by high pattern coefficients between the six constructs and the four items that each is hypothesized to predict. Correlations between the affect and competence factors for each of the academic areas, 0.63 for school, 0.71 for math, and 0.78 for reading, suggest that while these constructs are highly related, they are also somewhat distinct. These findings are similar to those of Marsh and Ayotte (2003) and Marsh et al. (1999) who reported correlations between these two constructs that ranged from .69 to .80. Theoretically, these results suggest that competence and affect are separate constructs that might have a different pattern of development or relationship to other variables or individual characteristics. These results have important implications for the understanding of self-concept and its relationship to achievement, and suggest numerous paths for future research. For example, longitudinal research examining how competence and affective components develop and relate to external variables would be useful in uncovering the causal ordering self-concept development. In addition, research on the relationship between competence and affect components with other performance and motivational outcome variables, such as measures or expectancy value (Eccles & Wigfield, 2002) and self-efficacy (Bong & Clark, 1999), or individual characteristics, such as gender or age, could provide further insight into how competence and affect are functionally different aspects of self-concept.
Practically, these findings are meaningful for practitioners. For example, it should not be assumed that a preadolescent who likes math will necessarily have confidence in their ability to be a successful math learner. Theory suggests such a student would be less likely to persevere at difficult math tasks, and less likely to choose tasks and careers that rely heavily on mathematical ability, since they would likely have low math self-efficacy, which is conceptually related to the competence but not affective aspect of self-concept (Bong & Clark, 1999). Similarly, these results suggest attempts to improve a students’ self-concept in an academic area might differentially influence competence and affective components, so dedicated attention during intervention to each aspect of self-concept would be necessary.
Group Invariance of Six-Factor Model of Self-Concept
The results also suggest that, in general, the six-factor model held for each of the populations in the study, as evidenced by the large majority of items that were invariant across the groups. Two items that were exceptions were, “I am good at reading” which functioned differently for White and Hispanic students as well as White and Native American students, and “I look forward to math” which did not operate equivalently for White and Hispanic students. Given the rather large number of loadings that were compared, the small number of uninvariant loadings could be simply due to chance. Alternately, in terms of the first item, Native American and Hispanic students might have varied understanding of what being good at reading means. As for the second item, it possible that its wording is more linguistically complex than most of the other items, which can impact variance in validity for items (Abedi, 2009). Approximately 19% of students in the study’s region are English language learners (ELLs), and Spanish is the dominant second language (State Education Data Profiles, 2010). Additional research investigating the linguistic characteristics of items that are found to be noninvariant between groups can be elucidating.
The majority of the factor correlations were also invariant across the groups, suggesting that the six-factor model of self-concept held for each group. This finding indicates that competence and affect are highly related but somewhat distinct constructs for each of the three ethnic groups in the study. The only factor covariance that was significantly different among the groups was the one between good at math and like math for the White and Hispanic groups. The relationship between the competence and affect factors for Hispanic children was lower than for Whites, indicating that for Hispanic children being good at math and liking math are not as closely associated as they are for White students. This is an important finding which suggests that when working with Hispanic children, practitioners be even more careful than with White populations not to assume that students who do well in a subject necessarily like that subject or that students who like a subject will necessarily be very successful in it.
Conclusions
The current data provide theoretical support that affect and competence are distinct factors of self-confidence for American preadolescents. The findings also suggest that while this factor structure largely holds for White, Hispanic, and Native American students, the relationship between the competence and affect factors for Hispanic children was found to be notably lower than for Whites. The findings are important in that, in general, they demonstrate that Hispanic and Native American students’ academic self-concept are functionally similar to that of other ethnic groups, despite cultural differences. These results are particularly meaningful, in that they help clarify the generalizability of the six-factor model of academic self-concept across two diverse non-Western collectivist cultural groups heretofore underrepresented in self-concept research.
Footnotes
Acknowledgements
The authors thank Roxana Moreno, who contributed to the initial conceptualization of the current research project.
Declaration of Conflicting Interests
The author(s) declared no potential conflicts of interest with respect to the research, authorship, and/or publication of this article.
Funding
The author(s) disclosed receipt of the following financial support for the research, authorship, and/or publication of this article: This research was supported in part by the National Science Foundation research grant 0231774, and in collaboration with the late Roxana Moreno, principal investigator.