
Abstract
A pilot study was conducted to examine the psychometric properties of the Environmental School Transition Anxiety Scale (E-STAS) with a sample of 220 fourth- to sixth-grade students who were about to or had completed their school transition. The results of an exploratory factor analysis (EFA) of the students’ responses on the E-STAS produced a two-factor (Academic and School Organization) structure. The E-STAS scores demonstrated adequate internal consistency reliability and 1- to 3-week test score stability. Gender differences were also found on the E-STAS, with females outscoring males. In addition, the results of correlational analyses provided support for the convergent and discriminant validity of the E-STAS scores. Implications of the findings for school professionals are discussed.
Keywords
The transition from elementary to middle or junior high school is a normative aspect of adolescent development. Although most students make a smooth transition to the secondary level of schooling (Akos, 2002; Jindal-Snape & Miller, 2008), school transitions are perceived as periods of threat and can be anxiety provoking for some students (Grills-Taquechel, Norton, & Ollendick, 2010; Lucey & Reay, 2000). To identify those students who experience anxiety in school transitions, we developed a new measure, the Environmental School Transition Anxiety Scale (E-STAS) and examined its psychometric properties. The E-STAS taps into students’ anxieties regarding the academic and organizational demands of the new school.
The school transition from elementary to middle or junior high school is considered one of the most challenging transitions that students make in their lives. Concerns about middle or junior high school are not limited to the year of transition, but it may pervade throughout the middle or junior high school years. If school transitions are not navigated successfully, students are at an increased risk for lower school quality of life (Hirsch & Rapkin, 1987), poorer academic performance (Chung, Elias, & Schneider, 1998), greater depressive symptoms (Barber & Olsen, 2004; Rudolph, Lambert, Clark, & Kurlakowsky, 2001), and lower self-esteem (McDougall & Hymel, 1998).
The middle and junior high school environments are starkly different from elementary schools. In comparison to elementary schools, middle and junior high schools are physically larger, are more impersonal due to a larger student–teacher ratio, and have a departmentalized instruction structure where students learn from numerous teachers (McDevitt & Ormrod, 2010). Furthermore, instead of performance-based evaluations in elementary schools, social-comparison-based evaluations, such as public honor rolls and incentives for high academic standing relative to other students, are frequently used in middle and junior high schools (Eccles & Roeser, 2009). Taken together, the discontinuities in the organization of elementary school to middle and junior high school may result in anxiety about the school transition for some students.
Transition concerns of U.S. middle school students have mostly been obtained from student interviews or writing assignments. For example, students who completed a writing assignment mentioned three types of school transition concerns: organizational, academic, and social (Akos, 2002). However, a study conducted by Akos and Galassi (2004) with 173 sixth-grade students who had completed the transition to middle school identified only academic concerns and organizational concerns as their top concerns. Similarly, other studies have also found that organizational and academic concerns were highly rated among students who were making or completing their school transition (Koppang, 2004; Mitman & Packer, 1982). In addition, when asked to provide advice to students who were about to make the transition, middle school students predominantly listed organizational themes (Akos, 2002). Along the same vein, questions pertaining to rules, procedures, and schoolwork featured prominently among students who were about to make the transition to middle school (Akos, 2002). As such, this study focused on academic and organizational concerns during the school transition.
Studies have been conducted to examine gender differences in anxiety during students’ school transition. Results have largely documented higher levels of anxiety in females than in males during students’ school transition (Duchesne, Ratelle, Poitras, & Drouin, 2009; Duchesne, Ratelle, & Roy, 2012; Grills-Taquechel et al., 2010; Hirsch & Rapkin, 1987; Rice, Frederickson, & Seymour, 2011). For example, in Hirsch and Rapkin’s longitudinal study of 159 U.S. students, females were found to exhibit higher levels of anxiety than males during their school transition from elementary to junior high school.
To the best of our knowledge, there is no psychometrically sound transition anxiety measure that assesses the environmental concerns of U.S. students who are making or have made the transition from elementary to middle or junior high school. As such, this study seeks to fill the gap in the literature by examining the psychometric properties of the E-STAS, a new transition anxiety measure for students in the United States. On the basis of the literature we hypothesized that the E-STAS measure would consist of two-factors: Academic and School Organization. In addition, we hypothesized an association would be found between the scores of the E-STAS and general anxiety, as a relationship between school concerns and anxiety during students’ school transition has been reported (Duchesne et al., 2009; Rice et al., 2011), and no or little relationship would be found between the scores of the E-STAS and narcissism based on findings from previous studies that examined the relationship between general anxiety and narcissism (Lau, Marsee, Kunimatsu, & Fassnacht, 2011; Loke & Lowe, 2012) to support the convergent and discriminant validity of the E-STAS scores. Finally, we explored gender differences and hypothesized that females would outscore males on the E-STAS on the basis of findings from previous studies (Duchesne et al., 2009; Duchesne et al., 2012; Grills-Taquechel et al., 2010; Hirsch & Rapkin, 1987).
Method
Participants
The participants for the present study consisted of 220 students (male, n = 108, 49.1%; female, n = 110, 50.0%). The students ranged in age from 9 to 12 years (M = 10.95, SD = 0.82) and were in grades (M = 5.42, SD = 0.70). The ethnic composition of the sample included 1 (0.5%) African American, 1 (0.5%) Asian, 3 (1.4%) Hispanics, 5 (2.3%) Native Americans, 182 (82.7%) Whites, and 26 (11.8%) Others. Two individuals did not provide information on their age, gender, or ethnicity.
The students were recruited from seven schools in the midwestern region of the United States, and these students were in their period of school transition (i.e., moving to a new school, n = 94, or completing their move to a new school, n = 126). School districts in the region have different school transition models, with 27, 45, and 22, fourth-, fifth-, and sixth-grade students transitioning to a new school and 29 and 97, fifth- and sixth-grade students completing their transition to a new school, respectively. School principals were contacted, and those who agreed to have their students participate in the study were sent packets consisting of a parent letter that described the study and two consent forms. Teachers distributed these packets to the students in their classrooms, and the students took the packets home to their parents for review. Only students with signed consent forms returned to the school were allowed to participate in the study. The return rate was 39.57%.
Instruments
The Environmental School Transition Anxiety Scale (E-STAS)
The E-STAS is a 19-item, self-report measure used to assess environmental concerns and anxieties students experience during their school transition. The E-STAS was developed for students transitioning in grades 4 to 6. The E-STAS consists of two transition anxiety (Academic and School Organization) subscales and a Total scale. The E-STAS Academic subscale (seven items) assesses concerns and anxieties about the academic environment of the new school during the school transition and the E-STAS School Organization subscale (12 items) measures concerns and anxieties about the routines, rules, and structure of the new school during the school transition. The E-STAS Total scale (19 items) assesses overall concerns and anxieties about the new school during the school transition. The E-STAS Total score is a weighted score obtained by summing the raw scores of each subscale and adjusting those scores so they contribute equally to the total score. Students respond to the E-STAS items on a 5-point Likert-type scale, ranging from 1 (never) to 5 (always).
The items for the E-STAS were developed based on the school transition anxiety literature (e.g., Akos, 2002; Akos & Galassi, 2004; Arowosafe & Irvin, 1992; Koppang, 2004; Mitman & Packer, 1982; Odegaard & Heath, 1992). Thirty-seven items were developed based on two dimensions (Academic and School Organization) purported to measure dimensions of the school transition anxiety construct. Once the items were developed, two individuals with expertise in measurement and experience in the schools reviewed the items for clarity, readability, and congruity with the school transition anxiety construct and provided the test developers with feedback. In addition, several students in the fourth to sixth grade reviewed the measure and provided feedback on the content and readability of the measure. The test developers used the feedback from the reviewers and students and rewrote some of the items to improve their clarity and readability, deleted some items because of their redundancy, and added some items to increase the breadth of coverage. The 30-item E-STAS was administered to the fourth- to sixth-grade students who participated in the study.
The Narcissism Personality Questionnaire for Children-Revised (NPQC-R)
The NPQC-R (Ang & Raine, 2009) is a brief self-report measure used to assess narcissistic features in children. Children respond to the NPQC-R items using a 5-point Likert-type scale, ranging from 1 (not at all like me) to 5 (completely like me; Ang & Raine, 2009). For the purpose of this study, only the NPQC-R Total scores were used. The internal consistency reliability estimate for the NPQC-R Total scores was .85 (95% confidence interval [95% CI] = .81 to .87) in the present study. Evidence supporting the construct validity of the NPQC-R Total scores has been found (Ang & Raine, 2009; Loke & Lowe, 2012).
The State-Trait Anxiety Inventory for Children (STAI-C)
The STAI-C (Spielberger, Edwards, Montuori, & Lushene, 1970) is a self-report measure that assesses state and trait anxiety in children. A child responds to the STAI-C items using a 3-point Likert-type scale, ranging from 1 (not, such as not scared) to 3 (very, such as very scared) on the State scale with some items reverse scored and 1 (hardly ever) to 3 (often) on the Trait scale (Spielberger, 1973). For the present study, the internal consistency reliability coefficients for the STAI-C State and Trait scores were .87 (95% CI = .84 to .89) and .92 (95% CI = .90 to .93), respectively. Evidence supporting the construct validity of the STAI-C State and Trait scores has been found (Spielberger, 1973).
Procedures
Once consent and assent were obtained from the parents of the students and students, respectively, students were given a packet of measures to complete that included the E-STAS, NPQC-R, and STAI-C. These packets of measures were administered to the students during their transition year in school (i.e., within 4 to 5 months before or after their school transition) in large groups in their schools. The measures were counterbalanced to prevent an order effect. Standardized test administration procedures were followed in the administration of the measures, according to the instructions printed on the top of each measure or in the manuals. Test administrators returned 1 to 3 weeks later to readminister the E-STAS. Due to logistics, the test-retest of the E-STAS was completed by a subsample of fourth to sixth graders (n = 145).
Results
Sources of Validity
Evidence based on internal structure
The final draft of the E-STAS consisted of 30 items. An exploratory factor analysis (EFA) using Mplus Version 6 (Muthén & Muthén, 1998-2010) was performed on the responses of the students to the 30 items on the E-STAS. In performing the EFA, unweighted items were used. Robust maximum likelihood (MLM) with an oblique (promax) rotation procedure was used in conducting the EFA. MLM was chosen as the factor extraction method because the data violated the multivariate normality assumption (skewness = −.02 to 2.20 and kurtosis = −1.19 to 4.49). The Guttman rule (Kaiser, 1960), scree plot (Cattell, 1966), parallel analysis (Horn, 1965), minimum-average partial test (Velicer, 1976), and interpretability of the different factor solutions served as the criteria to determine the number of factors to extract. The Guttman rule (eigenvalues = 7.61, 1.93, 1.08, 1.03, and .91) suggested four factors should be retained, whereas the results of parallel analysis (random data eigenvalues = 1.56, 1.45, and 1.37) and the minimum average partial test and the examination of the scree plot as well as the interpretability of the different factor solutions suggested two factors should be retained. Of the 30 items on the final draft of the E-STAS, 11 items were dropped because of low item-total correlations computed using SPSS Version 20 (IBM, 2011), items with low coefficients on all factors (i.e., all factor coefficients less than .40), items with high coefficients on more than one factor (i.e., factor coefficients greater than .40; Stevens, 2009), and interpretability of the factors. The two-factor promax solution was selected as the best solution for the E-STAS based on the results of parallel analysis and the MAP test and the examination of the scree plot as well as the theory behind the E-STAS measure. The two-factor promax solution is presented in Table 1. The two-factor varimax solution (see Thompson, 2004) is also presented in Table 1. The interfactor correlation between Factors 1 and 2 was .61, supporting the decision to use a nonorthogonal rotation method.
Factor Pattern and Structure Coefficients for the Two-Factor Promax and Varimax Solutions for the Environmental School Transition Anxiety Scale (E-STAS).

Note: Highest coefficients are in italics. Structure coefficients are in parentheses (Factor 1 = School Organization; Factor 2 = Academic).
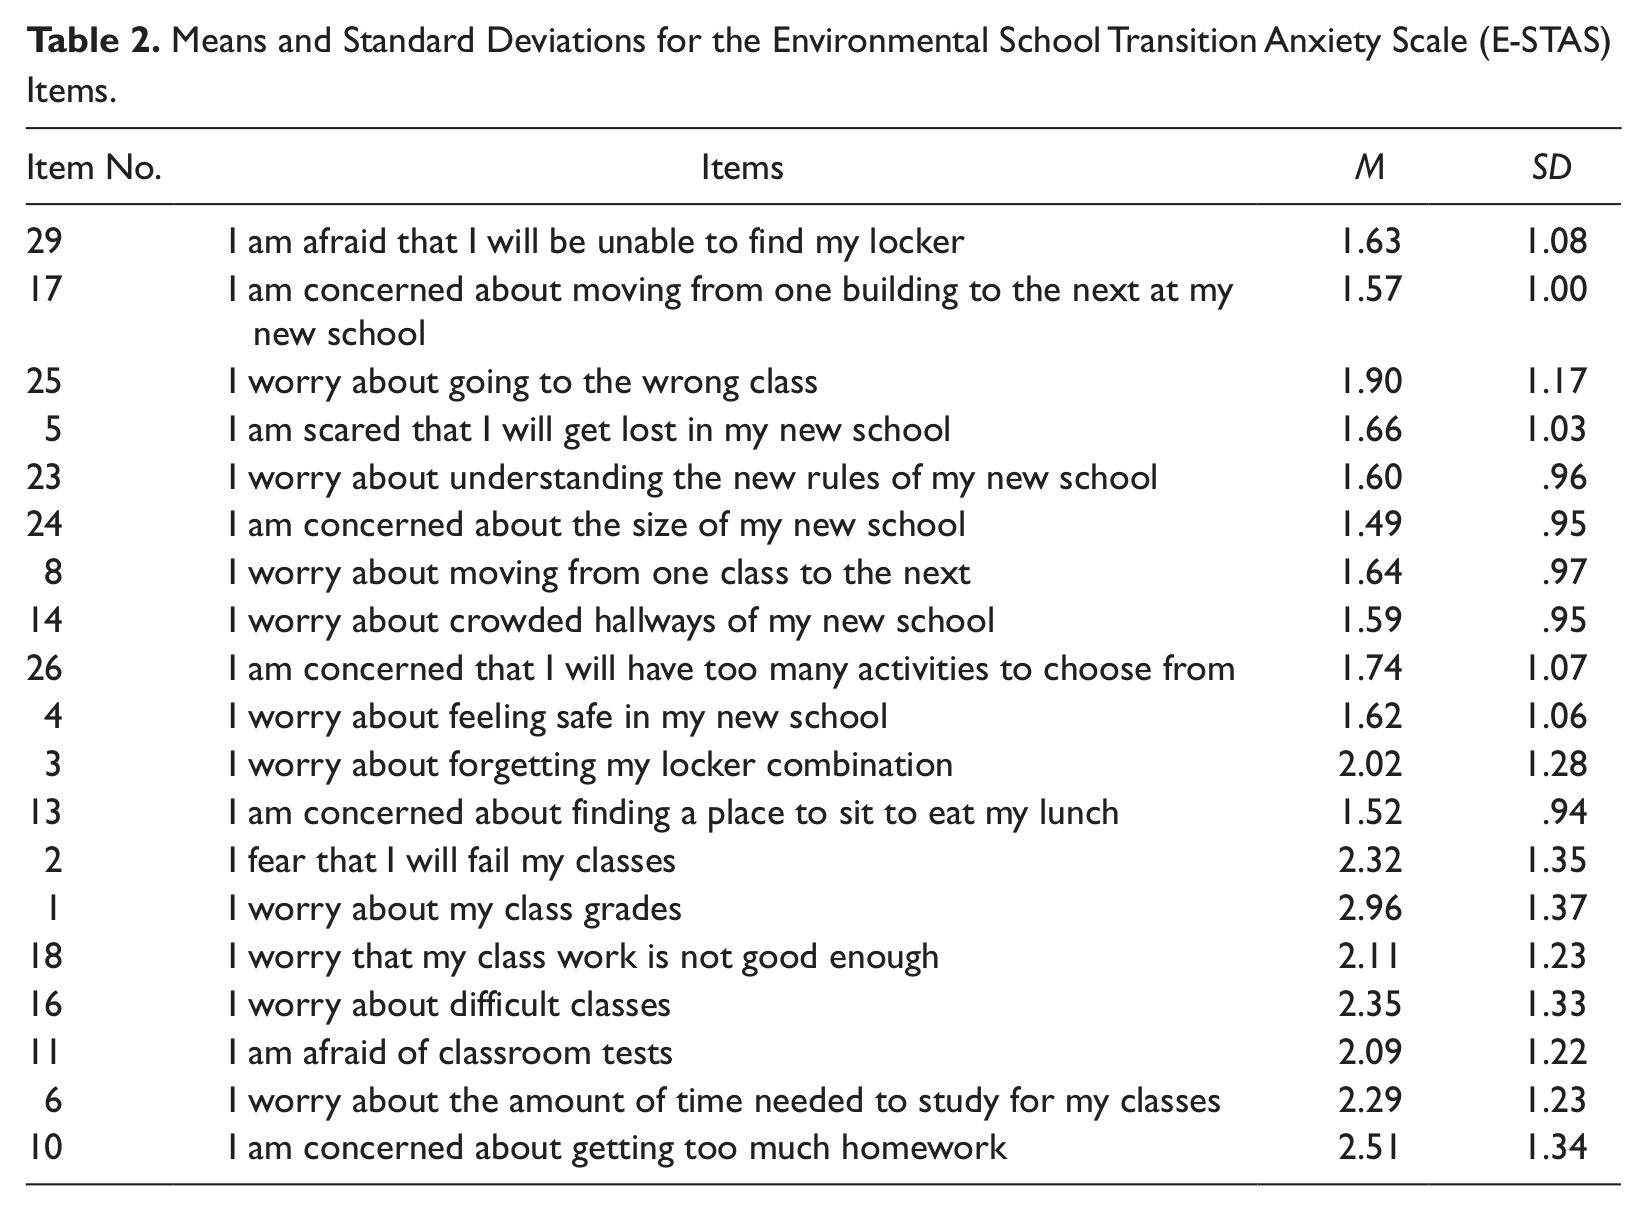
Factor 1 of the E-STAS consisted of 12 items and was named the School Organization factor (M = 22.12, SD = 8.95) and Factor 2 consisted of 7 items and was named the Academic factor (M = 14.53, SD = 5.40). The items on each factor are shown in Table 2. Means and standard deviations for each item of the E-STAS are also shown in Table 2. The most frequently endorsed items on the School Organization and Academic factors were concerns about forgetting locker combinations and worrying about class grades, respectively.
Means and Standard Deviations for the Environmental School Transition Anxiety Scale (E-STAS) Items.
The Schmid–Leiman (Schmid & Leiman, 1957) transformation was then performed to determine whether a higher-order factor was present. The results of the analysis indicated the presence of a higher-order factor, the E-STAS Total factor, which accounted for 66.3% of the extracted variance.
Internal consistency reliability estimates and the 95% CI around each reliability estimate for the E-STAS scores were computed. These reliability estimates were calculated from unweighted data. Coefficient alphas for the E-STAS scores ranged from .88 to .91 (Academic = .88, 95% CI = .85 to .90; School Organization = .88, 95% CI = .86 to .90; and Total scale = .91, 95% CI = .90 to .93). The reliability estimates and the 95% CIs around each reliability estimate are adequate for research purposes (Henson, 2001; Nunnally & Bernstein, 1994).
Test score stability coefficients for the E-STAS scores were examined with a subsample of fourth to sixth graders (n = 145). The test score stability coefficients were also calculated from unweighted data. The test score stability coefficients were Academic (r = .70), School Organization (r = .73), and Total scale (r = .75). These test score stability coefficients for the E-STAS scores are adequate (Nunnally & Bernstein, 1994).
Evidence based on group differences
To examine gender differences, three independent t tests were performed with gender as the independent variable and E-STAS Academic scores, Organization scores, and weighted Total scores as the dependent variables in separate analyses. Due to a violation of the assumption of homogeneity of variance, Bartlett’s test, χ2(1, n = 218) = 15.54, p < .001, Welch’s ť test was performed and was found to be statistically significant, ť (192) = 3.97, p < .001, d = .54, for the Organization variable, indicating that females (M = 22.05, SD = 9.27) outscored males (M = 17.80, SD = 6.32) on the E-STAS Organizational subscale. For the Academic subscale and Total scale, no violation of the assumption of homogeneity of variance, Bartlett’s test, χ2(1, n = 218) = 2.40, p > .05, and χ2(1, n = 218) = 2.65, p > .05, respectively, was found. Two t tests were performed and were found to be statistically significant for the Academic variable, t(216) = 2.49, p = .01, d = .34, indicating that females (M = 17.85, SD = 7.34) scored higher than males (M = 15.55, SD = 6.23) on the Academic subscale, and for the Total variable, t(216) = 3.43, p = .01, d = .47, indicating that females (M = 52.65, SD = 19.67) scored higher than males (M = 44.45, SD = 15.32) on the Total scale. Effect sizes reported in the current study were similar to the effect sizes found in other studies (Duchesne et al., 2012; Grills-Taquechel et al., 2010; Rice et al., 2011) where gender differences in anxiety during students’ school transition have been reported.
Evidence based on external relations
Correlations between the E-STAS scores and scores external to the test (i.e., the STAI-C scales and the NPQC-R Total scale) were computed. Correlation coefficients of .35 (95% CI = .23 to .46) and .38 (95% CI = .26 to .49) between the E-STAS Total scores and the STAI-C State and Trait scores were found, respectively. Validity coefficients of .40 (95% CI = .28 to .51) and .45 (95% CI = .34 to .55) were reported between the E-STAS Academic scores and the scores of the STAI-C State and Trait scales, respectively. A correlation of .28 (95% CI = .15 to .40) was found between the E-STAS School Organization scores and the STAI-C State scores, and a correlation of .30 (95% CI = .17 to .42) was reported between the E-STAS School Organization scores and the STAI-C Trait scores. Similar correlational findings were reported in Duchesne et al.’s (2009) and Rice et al.’s (2011) studies where the relationship between school concerns and anxiety during students’ school transition were examined. In contrast, correlations between the E-STAS scores and the NPQC-R Total scores ranged from .03 to .07 (E-STAS Academic = .07, 95% CI = −.06 to .20; E-STAS School Organization = .03, 95% CI = −.11 to .16; and E-STAS Total = .04, 95% CI = –.10 to .17). These findings are similar to results in Lau et al.’s (2011) and Loke and Lowe’s (2012) studies that examined the relationship between anxiety and narcissism. Furthermore, examination of the validity coefficients and the confidence intervals around each correlation coefficient between the E-STAS scores and STAI-C scores and the E-STAS scores and the NPQC-R Total scores showed little to no overlap. Overall, these findings provide support for the convergent and discriminant validity of the E-STAS scores.
Discussion
This study was a pilot study designed to develop and examine the psychometric properties of the E-STAS, a new measure of transition anxiety that taps into the environmental concerns that U.S. students have prior to and after the transition from elementary to middle or junior high school. The findings from this study demonstrated support for a two-factor (Academic and School Organization) structure for the E-STAS. This made intuitive sense as the items on the E-STAS were written based on these two dimensions, and the items were consistent with the top concerns of students who are about to make or have made their transition to the secondary level of schooling (Akos, 2002; Akos & Galassi, 2004; Arowosafe & Irvin, 1992; Koppang, 2004; Mitman & Packer, 1982; Odegaard & Heath, 1992). Closer inspection of the most frequently endorsed items in the academic domain indicated that students were most anxious about class grades, failing classes, having too much homework, and having more difficult classes in middle or junior high school. In the School Organization domain, the most frequently endorsed items were students’ anxieties about forgetting their locker combinations, going to the wrong class, having too many activities to choose from, and getting lost in the new school. Furthermore, the E-STAS scores in the current study showed adequate internal consistency reliability and 1- to 3-week test score stability. Examination of the convergent and divergent validity was also supported in this study. Finally, results from our study indicated that females exhibited higher levels of transition anxiety than males during their school transition, and these findings are consistent with the results from previous studies in the United States (e.g., Grills-Taquechel et al., 2010; Hirsch & Rapkin, 1987).
There are several limitations associated with the findings of the present study. First, as this was a pilot study of the E-STAS, future studies are needed to validate the factor structure of the measure with other samples of fourth- to sixth-grade students. Second, a convenience sample of students from the midwestern region of the United States was used in the current study. As a result, the generalizability of the findings of the present study may be limited. Kvalsund (2000) cautioned on the need to consider the local contexts and culture of schools as they may influence the transition perceptions of students. As mentioned, the current sample was comprised of students from the Midwest; hence, the experiences of students from other parts of the country may be different and future studies are needed to replicate the findings reported in the current study. Third, as the majority of the sample participants were White, ethnic comparisons on the E-STAS were not possible to make. As such, future studies with more diverse samples should be conducted where the factor structure of the E-STAS is examined across different ethnic groups. Last, it has to be noted that each factor on the E-STAS is comprised of a group of items, and these factors may not correspond to psychological phenomena.
Preliminary results from the present study indicate that the E-STAS is a promising new measure that professionals in elementary, middle, and junior high schools may potentially be able to use to identify those students with transition anxiety. In addition, the E-STAS may be useful to school personnel in transition planning and programming, especially as schools have been eager to assist students with organizational and administrative procedures. Elementary schools should prepare students for the transition to a new middle or junior high school when students start their last year in elementary school. By preparing students in advance for middle or junior high school and having transition programs and supports in place even after they have completed the transition, major discontinuities between the middle or junior high school and elementary school experiences may be minimized (Simmons & Blyth, 1987). Indeed, positive outcomes have resulted from a 1-year transition program for fifth- and sixth-grade students that began in the spring semester of the students’ fifth-grade year and ended in the fall semester of their sixth-grade year (Akos, 2002).
In conclusion, this study provides evidence to support the validity of the two factors (Academic and School Organization) of the E-STAS. With the transition from elementary to middle or junior high school being a major concern to some students during early adolescence, the E-STAS has the potential to identify those students who experience school transition anxiety. With earlier identification of those students with school transition anxiety, intervention efforts to reduce their anxieties can be implemented earlier, resulting in a smoother transition for these students.
Footnotes
Declaration of Conflicting Interests
The authors declared no potential conflicts of interest with respect to the research, authorship, and/or publication of this article.
Funding
The authors received no financial support for the research, authorship, and/or publication of this article.