
Abstract
The psychometric properties of the Revised Children’s Manifest Anxiety Scale–Second Edition (RCMAS-2) were examined in a sample of 1,003 U.S. elementary and secondary students in Grades 2 to 12. Confirmatory factor analyses (CFAs) were performed comparing the five-factor (target) model consisting of three anxiety (Physiological Anxiety, Social Anxiety, and Worry) factors and two defensiveness (Defensiveness 1 and 2) factors with a three-factor model (one anxiety factor and two defensiveness factors). The results of the CFAs conducted indicated that the five-factor model provided a better fit to the data than the three-factor model. Tests of measurement invariance were also performed and the results provided support for configural, metric, and partial scalar invariance of the RCMAS-2 scores across gender. Latent mean analyses were also conducted and the results of these analyses indicated that females scored significantly higher than males on the three anxiety factors. These findings provide support for the construct validity of the RCMAS-2 scores. Implications of the findings for mental health professionals who work with elementary and secondary school students are discussed.
Keywords
Anxiety is one of the most common mental health problems experienced by children and adolescents (Neil & Christensen, 2009). Prevalence rates of anxiety symptoms and anxiety disorders range from 3% to 25% among children and youth (Albano, Chorpita, & Barlow, 2003; Boyd, Kostanski, Gullone, Ollendick, & Shek, 2000; Cole, Peeke, Martin, Truglio, & Seroczynski, 1998). Twenge (2000) found an increased linear trend in anxiety symptoms over a 40-year period, beginning in the 1950s, in the U.S. child and adolescent population and there is no indication that this trend has leveled off or decreased in the last 10 to 15 years. Anxiety can have a substantial negative impact on children and adolescents (Neil & Christensen, 2009), as it has been associated with poor academic performance (Ialongo, Edelsohn, Werthamer-Larrson, Crockett, & Kellam, 1995), attention and concentration difficulties, low self-esteem (Whitcomb & Merrell, 2013), interpersonal relationship difficulties (Tomb & Hunter, 2004), and an increased risk of other mental health problems, including depression and substance abuse (Hudson, Flannery-Schroeder, & Kendall, 2004).
The Revised Children’s Manifest Anxiety Scale (RCMAS)
The RCMAS (C. R. Reynolds & Richmond, 1978) is one of the most widely used instruments in research and clinical practice to assess anxiety in children and youth (C. R. Reynolds & Richmond, 2008b). C. R. Reynolds and Richmond updated the RCMAS in 2008 and named it the Revised Children’s Manifest Anxiety Scale–Second Edition (RCMAS-2; Reynolds & Richmond, 2008a). Some of the major changes found in the RCMAS-2 include the renaming of three scales (the Social Concerns/Concentration, Worry/Oversensitivity, and Lie scales were renamed the Social Anxiety, Worry, and Defensiveness scales, respectively), and the removal of 1 worry item and the addition of 13 new (1 physiological anxiety, 6 social anxiety, and 6 worry) items (C. R. Reynolds & Richmond, 2008b).
C. R. Reynolds and Richmond conducted an exploratory factor analysis (EFA) on the responses of the full reference sample of 3,086 U.S. children and adolescents to the RCMAS-2, and reported a five-factor structure, similar to the RCMAS five-factor structure (Paget & Reynolds, 1984; C. R. Reynolds & Paget, 1981; C. R. Reynolds & Richmond, 1979; Scholwinski & Reynolds, 1985). The five-factor structure consisted of three anxiety (Physiological Anxiety, Social Anxiety, and Worry) factors and two Defensiveness (Defensiveness 1 and 2) factors. The Physiological Anxiety factor assesses physiological responses associated with anxiety and the Social Anxiety factor measures concerns about the self in relation to others. The Worry factor assesses an individual’s nervousness or worrisome thoughts (C. R. Reynolds & Richmond, 2008b). C. R. Reynolds and Richmond combined the two Defensiveness factors to create one Defensiveness scale for the RCMAS-2 for scoring purposes. The Defensiveness scale measures one’s willingness to admit to common imperfections. However, to the authors’ knowledge, validation of the RCMAS-2 scores using confirmatory factor analysis (CFA) has not been conducted to date and will be addressed in the present study. C. R. Reynolds and Richmond conceptualized the RCMAS-2 as a measure of manifest or general anxiety.
Manifest Anxiety
Manifest anxiety is a measure of drive (Taylor, 1951). Drive theorists (e.g., Spence & Spence, 1966) view anxiety as an indicator of a person’s level of excitability. Those individuals who experience a high level of anxiety respond more intensely and more emotionally to stressful or aversive stimuli and their learning and performance are often compromised, especially when they try to perform complex tasks (Zeidner, 1998). According to C. R. Reynolds (1985), the term manifest anxiety evolved out of a trait theory of general anxiety.
Trait Anxiety and Dimensionality of Trait Anxiety
Spielberger (1972) made the distinction between state and trait anxiety in his state-trait model of anxiety. State anxiety is a transitory emotional state consisting of feelings of tension and apprehension. In contrast, trait anxiety is viewed as a stable personality characteristic. According to Spielberger (1975), individuals differ in anxiety proneness and because of their differences in anxiety proneness, individuals perceive different situations as threatening and they react to these different situations with different levels of state anxiety. Spielberger and other researchers view trait anxiety as a unidimensional construct and these researchers did not specify the different types of situations that individuals’ perceived as threatening (Endler, Edwards, & Vitelli, 1991).
In contrast, other researchers, such as Endler (1975), Endler and Edwards (1985), and C. R. Reynolds and colleagues (Paget & Reynolds, 1984; C. R. Reynolds & Paget, 1981; C. R. Reynolds & Richmond, 1979; Scholwinski & Reynolds, 1985), view trait anxiety as a multidimensional construct. In Endler’s interactional model, he specified the different types of situations that individuals’ perceived as threatening. According to Endler, trait anxiety interacts with situational factors to determine the degree to which an individual perceives a situation as threatening, resulting in different levels of state anxiety. Individuals differ in their anxiety proneness to these different types of situations and these different types of situations represent the different dimensions of trait anxiety in Endler’s interactional model (Endler et al., 1991). The four dimensions in Endler’s model include ambiguous threats, interpersonal threats, physical danger threats, and threats in daily routines. Contrary to Endler’s four-dimensional model of trait anxiety, C. R. Reynolds and colleagues’ (Paget & Reynolds, 1984; C. R. Reynolds & Paget, 1981; C. R. Reynolds & Richmond, 1979; Scholwinski & Reynolds, 1985) EFA work with the RCMAS and RCMAS-2 supports a three-dimensional (physiological anxiety, social, and worry) model of manifest, general, or trait anxiety. Therefore, based on research and theory, there is support for a unified construct of trait anxiety and a multidimensional construct of trait anxiety.
Gender Differences and Anxiety
Gender differences have been reported on self-report measures of anxiety, with females scoring higher than males (Gullone, King, & Ollendick, 2001; Kirkcaldy, Furnham, & Siefen, 2009; C. R. Reynolds, 1998; C. R. Reynolds & Kamphaus, 2004; C. R. Reynolds & Richmond, 1985). C. R. Reynolds (1998) stated that these gender differences appear in children as young as age 6 and continued throughout the young and middle-aged adulthood years. C. R. Reynolds conducted a study to determine whether these gender differences were due to the items selected by test developers for assessment instruments used to measure anxiety in children, adolescents, and adults or whether these gender differences were due to females having more anxiety or experiencing or recognizing their anxieties more easily than males. C. R. Reynolds used a common set of item selection rules and applied them to the original item pools for the child and adolescent forms of the Behavior Assessment System for Children–Self-Report of Personality (BASC-SRP; C. R. Reynolds & Kamphaus, 1992), the Checklist of Problems and Resiliency (COPAR; Stanton & Reynolds, 1998), and the RCMAS. He created separate male and female scales for the anxiety items from the original item pools of the BASC-SRP child and adolescent forms, the COPAR, and the RCMAS, and looked at the item overlap between the male and female scales on each measure and the internal consistency reliability estimates for the male and female scores on each measure. C. R. Reynolds found that the percentage of item overlap between the male and female anxiety scales on each measure was 90% or higher, similar to the cutoff used to indicate parallel forms of a measure. In addition, he found the internal consistency reliability estimates for the male and female anxiety scale scores for each measure were similar in magnitude. Based on these findings, C. R. Reynolds concluded that anxiety was measured equally well across gender using essentially the same items, suggesting that a common set of items can be used to assess anxiety in males and females and that the same test score interpretation can be used across gender. Furthermore, C. R. Reynolds indicated that the findings also suggest that females have more anxiety than males or experience or recognize their anxieties more than males and can account for the higher scores reported on self-report measures of anxiety.
Measurement Invariance
To make comparisons across groups, such as males and females, multi-group CFA can be used to test the assumption that a latent attribute, such as trait anxiety, underlying scores operate the same across groups. Multi-group CFA is extremely important because it allows researchers to make test score comparisons across groups on the latent attribute, provides evidence of construct validity for the scores of a measure, and suggests the scores of the measure are unbiased (M. R. Reynolds & Keith, 2013). Measurement invariance across gender has not been investigated using multi-group CFA with a sample of U.S. students on the RCMAS-2.
The purpose of the present study was to examine the psychometric properties of the RCMAS-2. A five-factor (target) model (three anxiety and two defensiveness factors) was compared with a three-factor model (one anxiety factor and two defensiveness factors). The author hypothesized that the five-factor model would provide a better fit to the data than the three-factor model. The internal consistency reliability of the scale scores of the five-factor model was also examined for the entire sample and the male and female subsamples. The author hypothesized that the scale scores would demonstrate adequate internal consistency reliability. Finally, gender differences were investigated on the RCMAS-2. Tests of measurement invariance were conducted. The author hypothesized that support for configural, metric, and scalar invariance would be found on the RCMAS-2 across gender and that the results of latent means analyses would indicate females score higher than males on the three anxiety factors.
Method
Participants
The participants included 1,003 students, 459 (45.8%) males and 544 (54.2%) females, ages 7 to 19 (M = 12.02, SD = 2.67), in Grades 2 to 12 (M = 6.51, SD = 2.61). Ethnic/racial composition of the sample consisted of 0.6% Asians, 2.1% Blacks, 3.2% Hispanics, 6.8% Native Americans, 81.6% Whites, and 10.7% others. The students were recruited from 24 schools in the Midwestern region of the United States. Data were not collected on the socioeconomic status of the participants; however, the students who did participate in the study attended schools where 40.4% of the students were on free and reduced lunch programs.
Instrument
The RCMAS-2 is a 49-item self-report measure and it consists of three anxiety scales—Physiological Anxiety (12 items), Social Anxiety (12 items), and Worry (16 items) scales. The RCMAS-2 also has a Defensiveness scale (9 items; C. R. Reynolds & Richmond, 2008b). C. R. Reynolds and Richmond combined the two Defensiveness factors, Defensiveness 1 factor (6 items) and Defensiveness 2 factor (3 items), to create one Defensiveness scale for the RCMAS-2 for scoring purposes. Examples of items found on the RCMAS-2 are presented in Table 1. Children and adolescents respond to the RCMAS-2 on a dichotomous scale, using a yes/no format. C. R. Reynolds and Richmond reported coefficient alphas of .75 to .86 and test score stability coefficients of .64 to .73 for the RCMAS-2 scores over a 1-week test–retest interval. Evidence supporting the convergent and discriminant validity of the RCMAS-2 scores has been found (Ang, Lowe, & Yusof, 2011; C. R. Reynolds & Richmond, 2008b).
Examples of Items Found on the Revised Children’s Manifest Anxiety Scale–Second Edition (RCMAS-2).
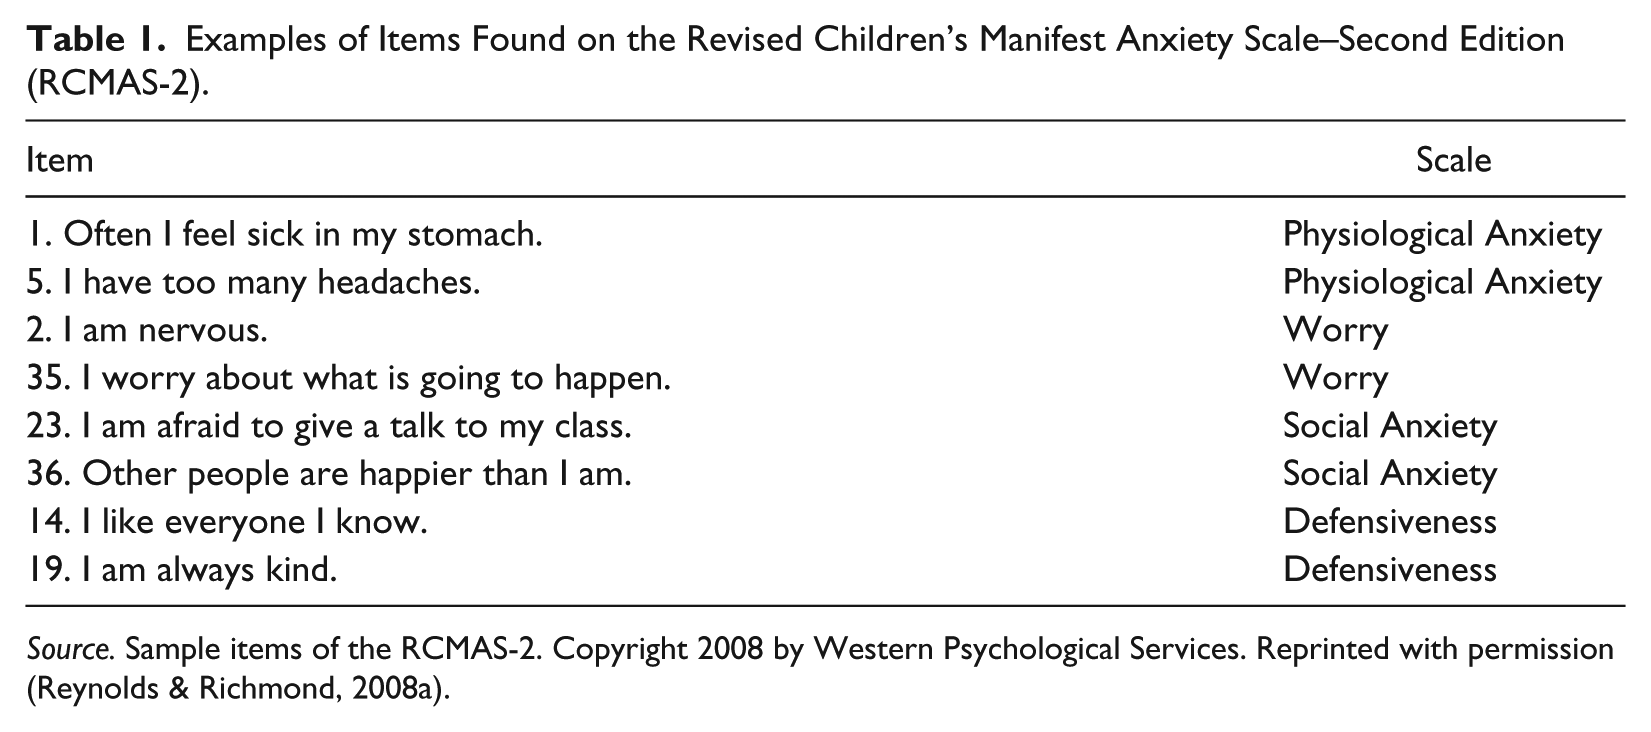
Source. Sample items of the RCMAS-2. Copyright 2008 by Western Psychological Services. Reprinted with permission (Reynolds & Richmond, 2008a).
Procedure
Once institutional review board approval was obtained, principals who were in charge of schools located in the immediate area of the researcher’s university were contacted to determine whether they would be interested in participating in the study. If a principal expressed interest in the study, approval was sought from the appropriate individual (e.g., school district superintendent) or school board for the school district. Once appropriate approval was obtained from the school district, the researcher worked with the principal and his or her staff to schedule a date and time to come to the school and administer the measures. Approximately 7 to 10 days before the testing date, packets consisting of a parent letter and two consent forms were sent to the school and teachers distributed the packets to their students in their classes. The students were instructed to take the packets home and review it with their parents. Those parents who were interested in their child or adolescent participating in the study and the child or adolescent wanted to participate in the study signed one of the consent forms, retained the other consent form for their records, and had their child or adolescent return the signed consent form to the school. Those students who were 18 or older signed their own consent form. Only those students with a signed consent form were allowed to participate in the study. The return rate for signed consent forms for the elementary, middle, and high school students was 39.83%. This study involved the use of secondary data.
On the day of testing, students gave their assent to participate in the study and they were given a packet of measures to complete, including the RCMAS-2, in large groups in their schools. Test administrators instructed the students to read the instructions on the measures and to record their responses. Students followed the instructions and completed the measures.
Data Analyses
Two CFAs were performed on the RCMAS-2 scores using Mplus, Version 7.11 (Muthén & Muthén, 1998-2012) to determine the best-fitting model. The five-factor (target) model was compared with a three-factor model. The robust weighted least squares (WLSMV) estimator was used as the parameter estimator because of the categorical nature of the data (Brown, 2006). Guidelines for assessing model fit were a nonsignificant robust mean- and variance-adjusted chi-square (WLSMV χ2) and a root mean square error of approximation (RMSEA) value of less than .06 for a good model fit and an RMSEA value of .06 to .08 for an acceptable model fit. In addition, the Comparative Fit Index (CFI) and the Tucker–Lewis Index (TLI) were used to assess model fit. CFI and TLI values of close to .95 indicate a good model fit and CFI and TLI values of .90 indicate an acceptable model fit (Hu & Bentler, 1999).
Coefficient alphas (equivalent to Kuder–Richardson 20, KR20, reliability estimates when the items are dichotomous) were computed to assess the internal consistency reliability of the RCMAS-2 scale scores for the entire sample, and the male and female subsamples. In addition, the 95% confidence interval (CI) around each reliability estimate were computed for the RCMAS-2 scores for the entire sample, and the male and female subsamples using Feldt’s (1990) formula.
Before tests of measurement invariance were conducted, two CFAs were performed for the male and female subsamples to validate the RCMAS-2 five-factor structure for males and for females. Hu and Bentler’s (1999) guidelines were used to examine model fit.
Multi-group CFA followed to test for invariance across gender in which different parameter constraints were added in a sequential manner to a set of multi-group models, making the models more restricted (M. R. Reynolds & Keith, 2013). Multi-group CFA allows the researcher to examine whether the components of a measure are operating similarly across groups (Byrne, 2012). The first step in multi-group CFA is to establish configural invariance where the factor structure is expected to be the same across groups. Both the male and female subsamples in the present study were combined to yield a basic measurement model with no equality constraints imposed. The next step was to establish metric invariance where the corresponding factor loadings were expected to be equal across groups. The final step was to establish scalar invariance where the factor loadings and intercepts were expected to be equal across the male and female subsamples. Strict invariance across gender was not examined in the present study because Little (1997) and Widaman and Reise (1997) do not recommend this level of invariance. In addition, Little (1997) stated that strict invariance introduces potential sources of bias in the parameters and it is not needed to examine latent means.
The traditional method used to test for measurement invariance between less and more restricted multi-group models that are nested has been the chi-square difference test (King, Ganotice, & Watkins, 2012). In the present study, a p < .01 for a change in the WLSMV χ2 (ΔWLSMV χ2) was used as the criterion to indicate that the models may not be invariant when additional parameters are constrained across groups. A cutoff of p < .01 for ΔWLSMV χ2 was used due to the number of constraints on the parameters and the model complexity. However, research has shown that the chi-square difference test is sensitive to sample size and non-normality of the data (Cheung & Rensvold, 2002). Therefore, alternative criteria were used in the present study. Cheung and Rensvold recommended that a decrease in CFI of less than .01 and the multi-group model demonstrating adequate fit to the data be used to indicate measurement invariance.
Results
CFA With the Entire Sample
Two CFAs were performed on the RCMAS-2 scores to determine whether the five-factor (target) model provided a better fit to the data than a three-factor model. The results of the two CFAs performed revealed that both the three-factor model and the five-factor model provided acceptable model fit to the data (see Table 2). Closer examination of the fit indices for the two models indicated that the five-factor model provided a slightly better fit to the data than the three-factor model. A chi-square difference test was conducted between the two nested models (i.e., the five-factor model can be conceptualized as nested in the three-factor model when the latent correlations between the Social Anxiety, Physiological Anxiety, and Worry factors of the five-factor model are fixed to one. When the latent correlations of the Social Anxiety, Physiological Anxiety, and Worry factors are fixed to one, one latent variable is created that has a perfect correlation with the anxiety latent variable in the three-factor model, making the two models nested). The chi-square difference test was statistically significant, ΔWLSMV χ2(7) = 158.71, p < .01, indicating that the five-factor (target) model provided a better fit to the data than the three-factor model.
Fit Indices From the Confirmatory Factor Analyses of the Revised Children’s Manifest Anxiety Scale–Second Edition (RCMAS-2) Scores.

Note. WLSMVχ2 = robust mean-and variance-adjusted chi-square; CFI = comparative fit index; TLI = Tucker–Lewis index; RMSEA = root mean square error of approximation.
p < .0001.
The standardized coefficients for the five-factor model are also presented in Table 3. Standardized coefficients between the factors ranged from −.46 to .91 and the interfactor correlations ranged from −.31 to .77. The interfactor correlations are somewhat similar in magnitude to the intercorrelations (range = −.06 to .73) between the RCMAS-2 scores reported by C. R. Reynolds and Richmond (2008b). The relationship between the Social Anxiety and Worry scores is especially strong not only in the present study (r = .77) but also in the C. R. Reynolds and Richmond (2008b) study (r = .73). C. R. Reynolds and Richmond state in practice it is not uncommon to see an elevated score on one of the anxiety scales accompanied by an elevated score on one of the other anxiety scales for a child or an adolescent, and this may help account for the high correlation reported between the Social Anxiety and Worry scores in the present and previous studies with the RCMAS-2.
Standardized Factor Coefficients for the Five-Factor Model for the Revised Children’s Manifest Anxiety Scale–Second Edition (RCMAS-2).
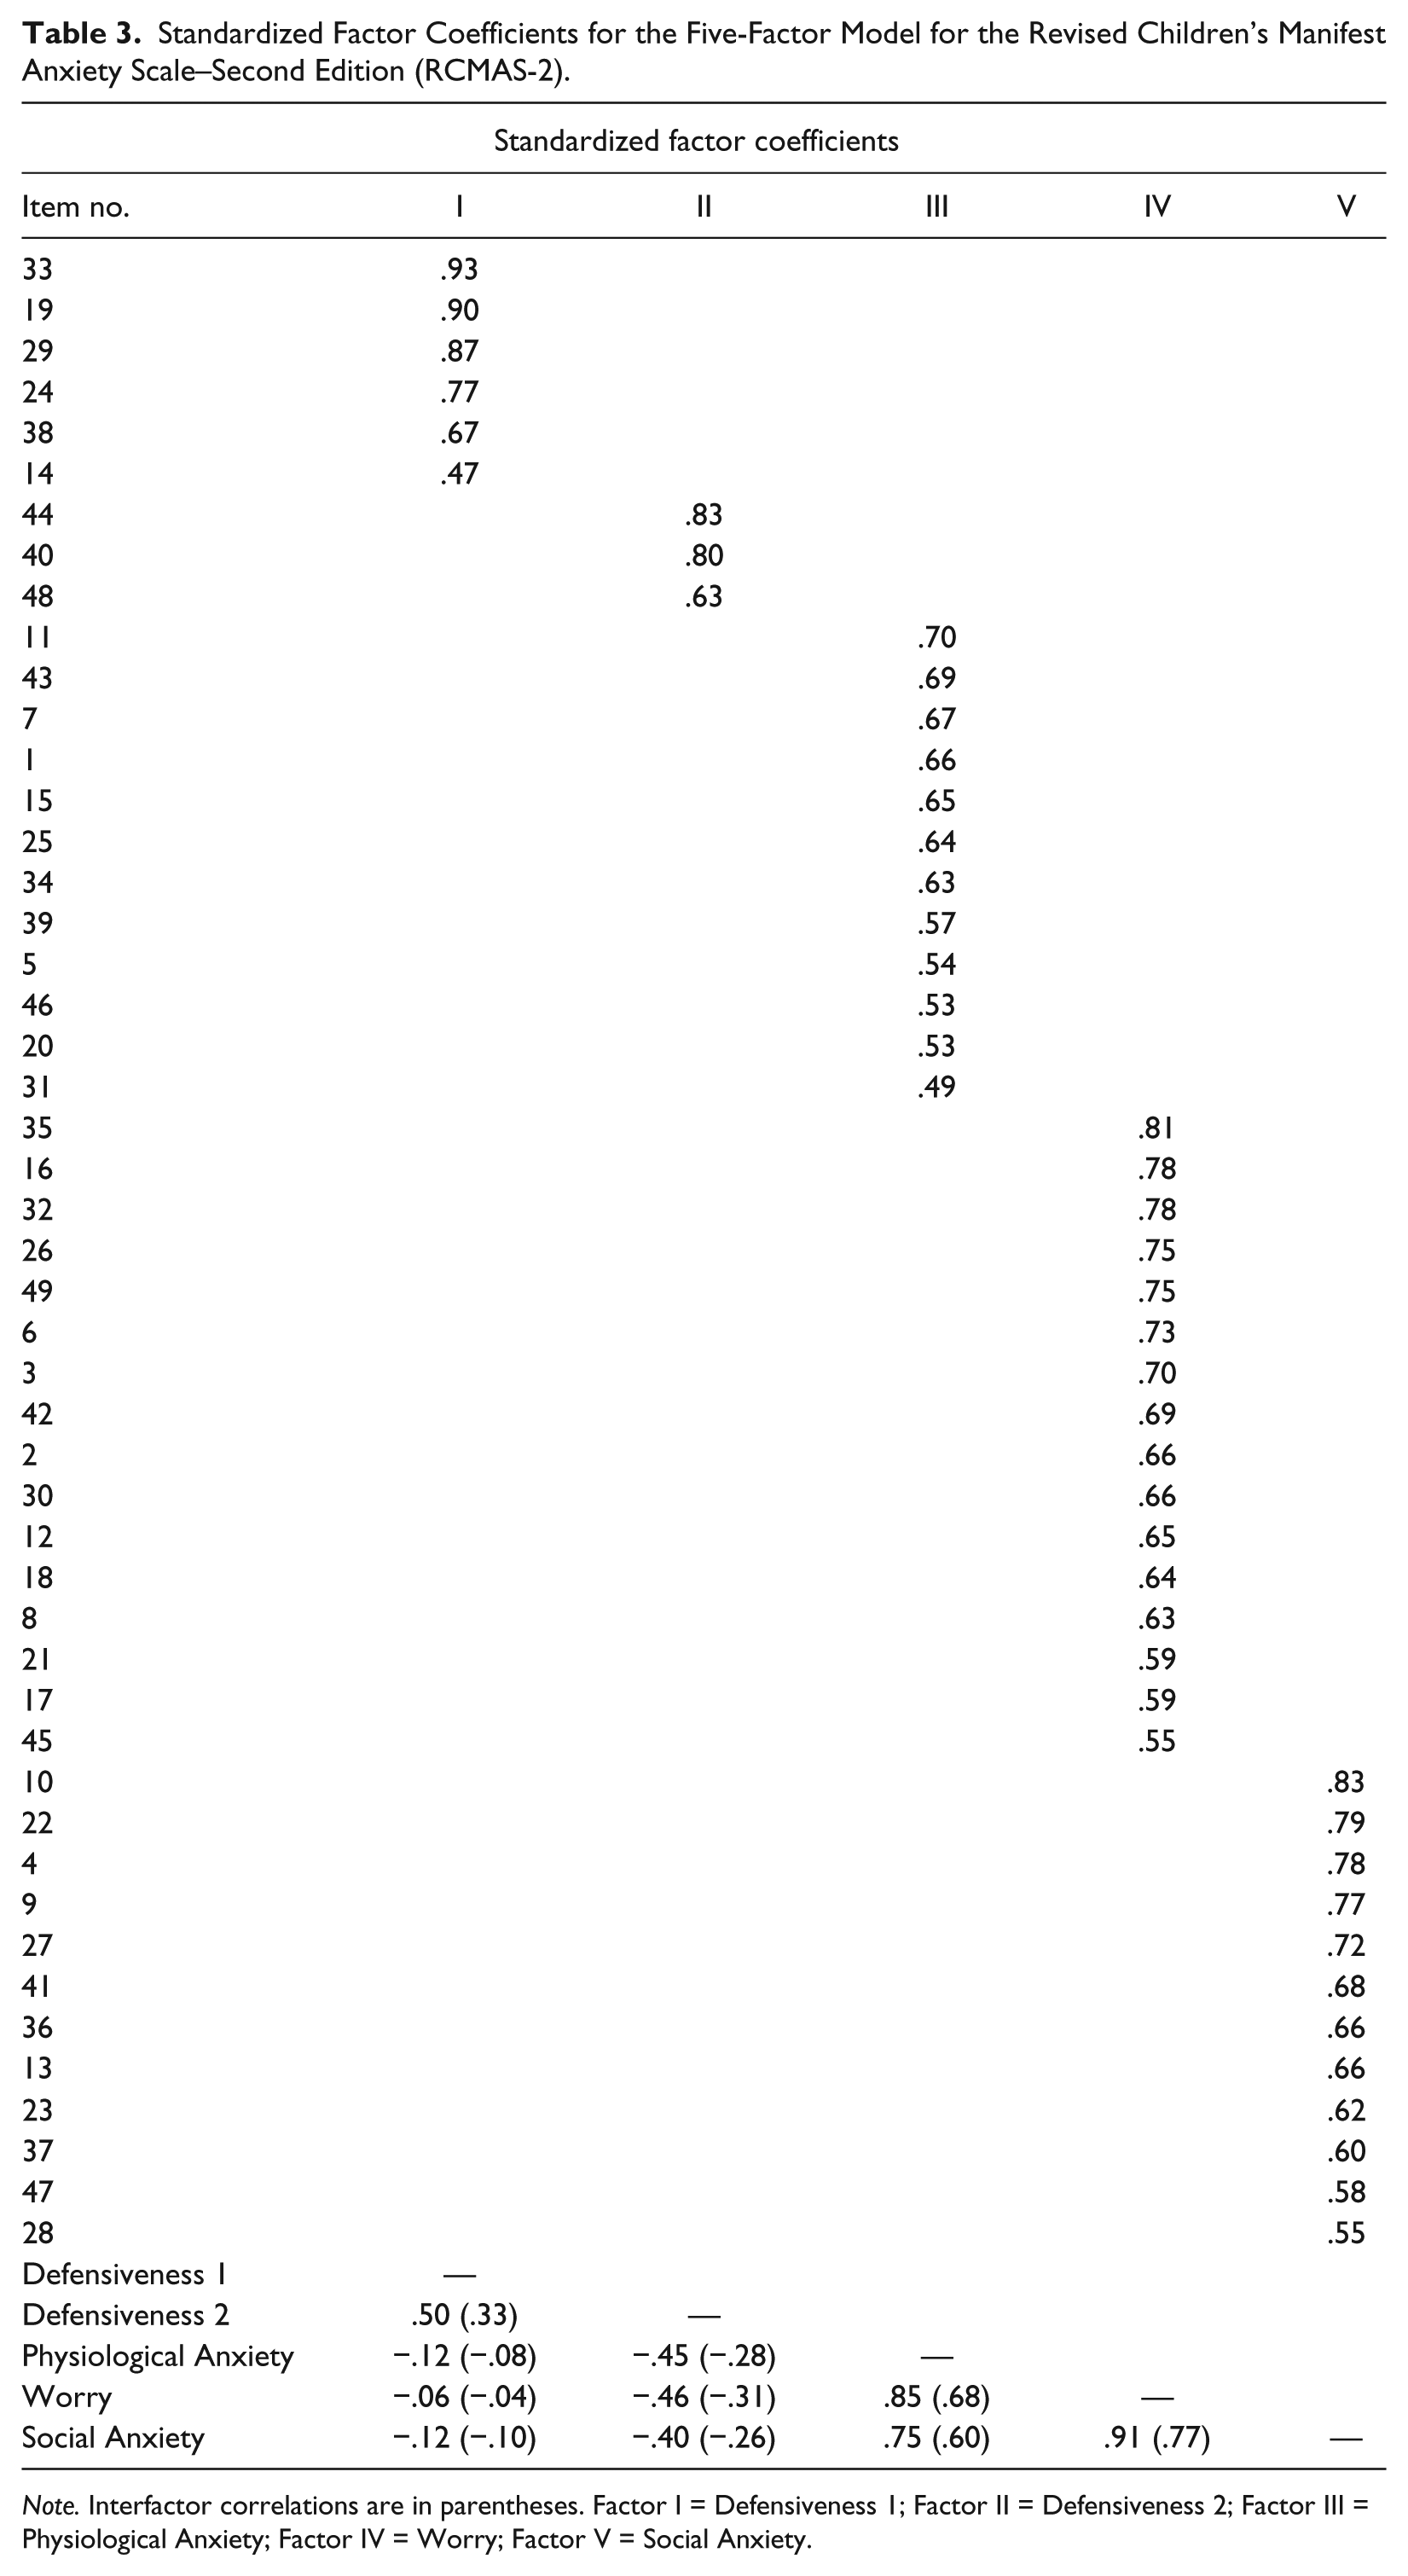
Note. Interfactor correlations are in parentheses. Factor I = Defensiveness 1; Factor II = Defensiveness 2; Factor III = Physiological Anxiety; Factor IV = Worry; Factor V = Social Anxiety.
Internal Consistency Reliability Estimates
Coefficient alphas and the 95% CI around each reliability estimate were computed for the RCMAS-2 scale scores for the entire sample, and the male and female subsamples (see Table 4). The coefficient alphas ranged from .77 to .87, .74 to .86, and .78 to .85 for the entire sample, and the male and female subsamples, respectively. These internal consistency reliability estimates and the 95% CIs around the reliability estimates for the RCMAS-2 scores for the entire sample, and the male and female subsamples are considered adequate for a psychological measure (Nunnally & Bernstein, 1994).
Coefficient Alphas (α) and the 95% Confidence Intervals (CI) for the Revised Children’s Manifest Anxiety Scale–Second Edition (RCMAS-2) Scale Scores for the Entire Sample and Male and Female Subsamples.

Note. CI = confidence interval.
CFA for Males and Females
Single-group CFAs were performed with the male and female subsamples separately to cross-validate the RCMAS-2 scores. The results of the CFAs indicated acceptable model fit for the males, WLSMV χ2(1117, n = 459) = 1,746.92, p < .001, CFI = .93, TLI = .93, RMSEA = .04, and for the females, WLSMV χ2(1117, n = 459) = 2,286.92, p < .001, CFI = .91, TLI = .91, RMSEA = .04.
Testing Measurement Invariance Across Gender
Multi-group CFA followed and the results are presented in Table 5. In the first step, the male and female subsamples were combined and a baseline model was established. In the configural model, all of the parameters estimated are estimated freely within each group. This multi-group model had an acceptable model fit, suggesting that the factor structure appeared to be invariant across gender.
Summary of Testing Invariance of the Revised Children’s Manifest Anxiety Scale–Second Edition (RCMAS-2) Across Gender.

Note. WLSMVχ2 = robust mean-and variance-adjusted chi-square; df = degrees of freedom; ΔWLSMVχ2 = change in the robust mean-and variance-adjusted chi-square; Δdf = change in degrees of freedom; CFI = comparative fit index; ΔCFI = change in the comparative fit index; TLI = Tucker–Lewis index; RMSEA = root mean square error of approximation.
p < .0001.
Metric invariance was then examined where the factor loadings were restricted to be equal across the male and female groups on the RCMAS-2. As shown in Table 5, the fit of the metric model in comparison with the fit of the configural invariance model was acceptable. The restriction on the factor loadings across the male and female groups was accompanied by a nonsignificant ΔWLSMV χ2. In addition, the fit indices, including the CFI, for the metric model improved. These findings suggest that metric invariance across gender seemed tenable.
Scalar invariance was also examined where the intercepts and factor loadings were constrained to be equal across gender. This additional restriction resulted in a significant ΔWLSMV χ2, well above the cutoff for an acceptable model fit. However, the change in the CFI (ΔCFI) was not substantial and there was little deterioration in the fit indices. Visual inspection of the modification indices indicated that the intercepts associated with Item 36 (an item found on the Social Anxiety factor) were different for males and for females. Specifically, the origins of Item 36 were not identical across gender, with the females having a higher origin than males. Item 36 assesses others’ happiness in relation to the self. According to Byrne, Shavelson, and Múthen (1989), the invariance constraint on the intercept associated with an item can be removed and latent mean differences can be explored with partial measurement invariance for the factor. As a result, the author removed the invariance constraint on the intercept and this model was compared with the metric model. The chi-square difference test between these two models was found to be nonsignificant (see Table 5). In addition, the CFI did not change and the fit indices for the partial scalar model were acceptable. These findings suggest partial scalar invariance across gender was tenable.
Latent Mean Analyses
Latent mean differences were investigated on the RCMAS-2 across gender, as partial scalar invariance across the male and female subsamples seemed tenable. The latent means of the males were constrained and the latent means of the females were freely estimated in these analyses. In these analyses, a positive latent mean would indicate that females scored higher than males on a RCMAS-2 factor, whereas a negative latent mean would indicate that males scored higher than females on the RCMAS-2 factor. The results of the latent means analyses are presented in Table 6. Examination of the latent factor means indicated that females scored significantly higher than males on the RCMAS-2 Physiological Anxiety, Social Anxiety, Worry, and Defensiveness 1 factors and males scored significantly higher than females on the RCMAS-2 Defensiveness 2 factor.
Standardized Latent Mean Estimates for the Revised Children’s Manifest Anxiety Scale–Second Edition (RCMAS-2).
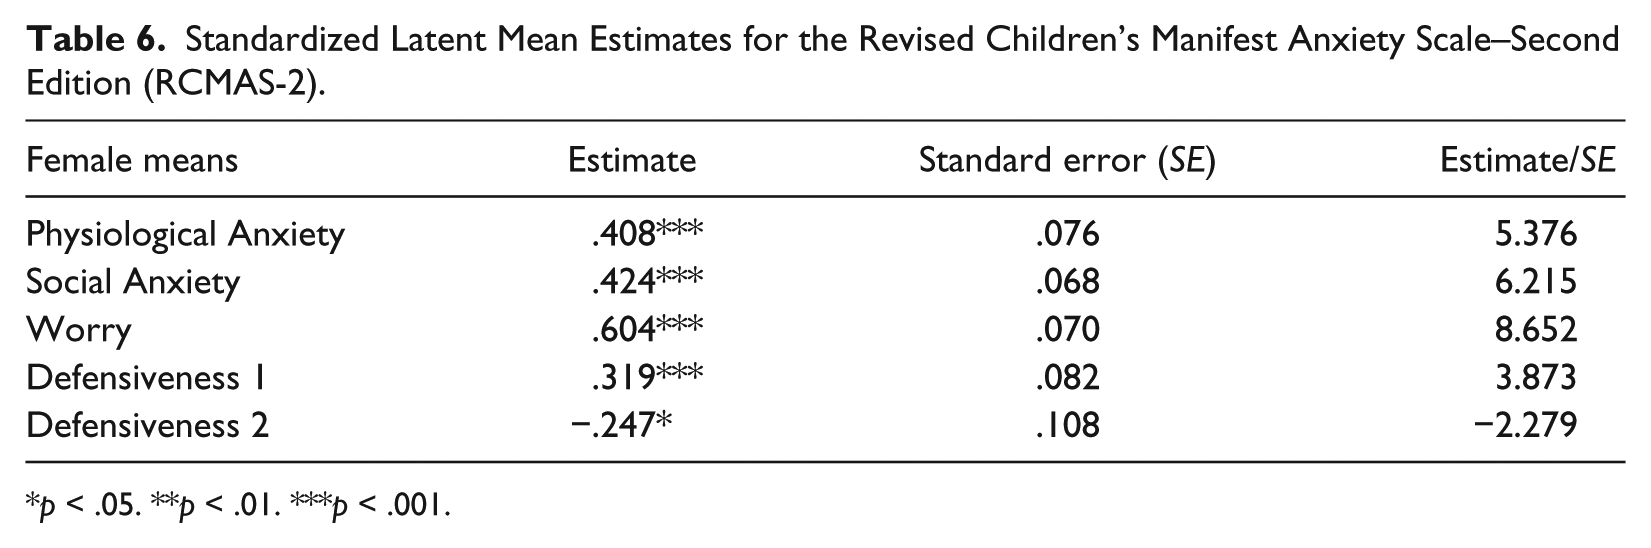
p < .05. **p < .01. ***p < .001.
Discussion
The findings of the present study indicated that the five-factor model provided a better fit to the data than the three-factor model for the RCMAS-2 scores among elementary and secondary students in the United States. Validation of the RCMAS-2 scores among U.S. elementary and secondary students using CFA has not been examined previously and reported in the literature. The results of the present study are in agreement with C. R. Reynolds and Richmond’s (2008b) findings of a five-factor structure for the RCMAS-2 scores using EFA. The results of the present study also examined the internal consistency reliability of the RCMAS-2 scores for the entire sample of elementary and secondary students and the male and female subsamples. The findings indicated that the reliability estimates for the entire sample and male and female subsamples were adequate for a psychological measure. Moreover, the results of single-group CFAs validated the five-factor measurement model for males and for females. In addition, multi-group CFAs across gender on the RCMAS-2 appeared to support configural, metric, and partial scalar invariance. Furthermore, latent means analyses were performed and the results of these analyses indicated that the latent factor means were significantly higher for females than for males on the Physiological Anxiety, Social Anxiety, and Worry factors. These findings are in agreement with the gender differences reported on self-report measures of anxiety, with females scoring higher than males (Gullone et al., 2001; Kirkcaldy et al., 2009; C. R. Reynolds, 1998; C. R. Reynolds & Kamphaus, 2004; C. R. Reynolds & Richmond, 1985). Overall, the findings of the present study provide support for the construct validity of the RCMAS-2 scores.
One nonequivalent item (i.e., Item 36) was found on the RCMAS-2. del Barrio, Moreno-Rosset, López-Martinez, and Olmedo (1997) reported in their study with adolescents that males scored higher than females on self-report measures of happiness and extraversion, while females scored higher than males on measures of depression and neuroticism. Based on these findings, male children and adolescents may perceive themselves as being happier than other people, whereas female children and adolescents may perceive themselves as being less happy than other people. These findings could potentially help explain the nonequivalent item reported across gender in the present study.
Like its predecessor the RCMAS, the RCMAS-2 may prove to be an invaluable instrument for mental health professionals to use in the assessment of those students who experience moderate to high levels of anxiety. Students’ elevated scores on the different dimensions of the RCMAS-2 may guide mental health professionals’ intervention efforts to reduce children’s and adolescents’ anxiety. For example, an elevated score on the Social Anxiety dimension may result in clinicians selecting developmentally appropriate interventions such as social skills training (Beidel, Turner, & Morris, 2000), systematic desensitization, observation of models performing tasks successfully, and rehearsal and repetition of tasks (Huberty, 1997) to address concerns a child or an adolescent may have about social or performance evaluations. In contrast, for an elevated score on the Worry dimension, clinicians may select interventions such as self-monitoring, constructive self-talk, cognitive-behavior therapy, and self-reinforcement to reduce a child’s or adolescent’s worrisome or obsessive thoughts (Huberty, 1997). However, for a student with an elevated score on the Physiological Anxiety dimension, progressive muscle relaxation training, deep breathing exercises, and visual imagery (Zeidner, 2008) may lead to a decrease in a child’s or an adolescent’s physical symptoms associated with anxiety.
Several limitations are associated with the present study. The sample used in the current study was a volunteer sample. The use of volunteer samples increases the likelihood of external validity threats. Replication of the present study with a representative sample of U.S. elementary and secondary students producing similar results would provide support for the findings reported in the current study. A second limitation associated with the present study was the underrepresentation of males, Asians, African Americans, and Hispanics and overrepresentation of females, Native Americans, and Whites, according to the U.S. Census (U.S. Census Bureau, 2011; U.S. Census Bureau, Population Division, 2012). Future studies that examine the psychometric properties of the RCMAS-2 scores should include a larger percentage of U.S. children and adolescents who are male and who are from ethnic minority backgrounds (i.e., Asians, African Americans, and Hispanics). Examination of measurement invariance of the RCMAS-2 across students from different ethnic minority backgrounds who attend elementary and secondary schools in the United States, students from different countries outside the United States, and students with and without anxiety disorders, learning disabilities, and other special needs would be important to address to assess the construct validity of the RCMAS-2 scores. A final limitation of the present study was the sample was recruited from the Midwestern region of the country. Future studies using the RCMAS-2 should include elementary and secondary students from different geographic regions of the United States.
Although additional research is needed, overall the findings of the present study provide support for the construct validity of the RCMAS-2 scores. The findings also suggest that the same test score interpretation can be used for males and for females on the RCMAS-2. Mental health experts who work with children and adolescents may find the RCMAS-2 to be an invaluable instrument to use in the identification and treatment planning of those elementary and secondary students who have moderate to high levels of anxiety. Elementary and secondary students’ elevated scores on the different RCMAS-2 anxiety scales may help guide mental health professionals’ efforts in developing appropriate treatment plans to help reduce the moderate to high levels of anxiety that many students experience in schools as well as correlates that often are associated with and accompany anxiety in children and youth. Like its predecessor the RCMAS, the RCMAS-2 may become one of the gold standards used in the identification and treatment of anxiety in children and adolescents.
Footnotes
Declaration of Conflicting Interests
The author declared no potential conflicts of interest with respect to the research, authorship, and/or publication of this article.
Funding
The author received no financial support for the research, authorship, and/or publication of this article.