
Abstract
The psychometric properties of a new, brief measure, the Revised Children’s Manifest Anxiety Scale–Second Edition (RCMAS-2) Short Form, were examined in a sample of 1,003 U.S. elementary and secondary students. The RCMAS-2 Short Form consists of the first 10 items of the RCMAS-2. The results of confirmatory factor analysis indicated that the modified one-factor model provided an adequate fit for students in Grades 2 to 12. The results of tests of measurement invariance supported configural, weak, and strong invariance of the RCMAS-2 Short Form across gender and configural, weak, and partial strong invariance of the RCMAS-2 Short Form across age. Gender and age differences were also examined on the RCMAS-2 Short Form. The results of latent mean analyses indicated that adolescents (ages 12-19) and females had significantly higher factor means than children (ages 7-11) and males, respectively, on the RCMAS-2 Short Form. Moderate correlations between the RCMAS-2 Short Form scores and scores of measures of test anxiety were found. Implications of the findings for researchers and clinicians who work with children and adolescents are discussed.
Keywords
Anxiety is a common mental health issue experienced by children and adolescents in the United States (Neil & Christensen, 2009). Greenberg et al. (1999) estimated that more than $42 billion is spent each year in the United States to treat individuals with anxiety. Children and adolescents with anxiety experience difficulties with academics, attention, self-regulation, interpersonal relationships, and self-esteem (Semple, Lee, Rosa, & Miller, 2010; Tuebert & Pinquart, 2011), making school success more challenging for these individuals. Moreover, anxiety has been found to be an important determinant of school dropout (Ameringen, Mancini, & Farvolden, 2003). Ameringen and colleagues reported that over 25% of students with high levels of anxiety in their study did not finish high school.
Revised Children’s Manifest Anxiety Scale
The Revised Children’s Manifest Anxiety Scale (RCMAS; C. R. Reynolds & Richmond, 1978) is one of the most popular self-report measures to assess general or manifest anxiety in children and adolescents (C. R. Reynolds & Richmond, 2008b). Manifest anxiety is defined as a measure of drive (J. Taylor, 1951). According to drive theorists, when an individual experiences too much drive, it hinders one’s performance in learning or evaluative situations (Zeidner, 1998). C. R. Reynolds and Richmond revised the RCMAS in 2008 and renamed the scale, the Revised Children’s Manifest Anxiety Scale–Second Edition (RCMAS-2; C. R. Reynolds & Richmond, 2008a). The RCMAS-2 has improved psychometric properties, updated norms, and broader item content coverage. An additional new feature of the RCMAS-2 is the RCMAS-2 Short Form, a scale consisting of the first 10 items on the RCMAS-2. The Short Form provides a brief measure of general or manifest anxiety (C. R. Reynolds & Richmond, 2008b). Limited information is available on the psychometric properties of the RCMAS-2 Short Form. In the present study, the psychometric properties of this new measure were examined in a sample of elementary and secondary students in Grades 2 to 12.
Lowe (2015) conducted an exploratory factor analysis (EFA) of the responses of middle school students on the RCMAS-2 Short Form. Principal-axis factoring and promax rotation procedure were used. Based on factor extraction methods, including the results of parallel analysis (Horn, 1965) and eigenvalues-greater-than-one (Kaiser, 1960), examination of the scree plot (Cattell, 1966), and the psychological meaningfulness of the solutions, the one-factor promax solution was selected as the most appropriate solution for the RCMAS-2 Short Form. A comprehensive search of ERIC, PsychInfo, Psychology and Behavioral Sciences Collection, and PubMed databases and dissertations in the Dissertation Abstracts Online database found no published journal articles or dissertations involving confirmatory factor analysis (CFA) of the RCMAS-2 Short Form with a U.S. sample. Search terms used either alone or in combination included anxiety, general anxiety, manifest anxiety, measures, CFA, factor analysis, RCMAS-2, and RCMAS-2 Short Form. A CFA was performed to examine the factor structure of the RCMAS-2 Short Form in the present study.
Gender and Age Differences on Measures of Anxiety
Researchers (Gullone, King, & Ollendick, 2001; Hishinuma, Miyamoto, Nishimura, & Nahulu, 2000; Planck, Watkins, Worrell, & Hall, 2013; C. R. Reynolds, 1998) have reported gender differences on self-report measures of anxiety, with females scoring higher than males. Different reasons have been suggested as to why gender differences exist on measures of anxiety, including socialization practices and gender role expectations (Schaefer, Watkins, & Burnham, 2003) where society believes it to be more acceptable for females than for males to express their anxieties, females more willing to express their anxieties than males, a psychometric artifact associated with measures of anxiety (C. R. Reynolds, 1998), and/or differences in brain structure and affective processing of males and females (Killgore, 2000).
Unlike the consistent gender differences reported in the literature, research on age differences in anxiety has been equivocal (Weems, Graham, Scott, Banks, & Russell, 2013). Across developmental theories (Warren & Sroufe, 2004; Westenberg, Siebelink, & Treffers, 2001), increases in anxiety symptoms are expected in the adolescent population in comparison with the child population due to the normative developmental period and challenges experienced in adolescence. Some studies support these developmental theories and have reported higher levels of anxiety symptoms in adolescents than children (Kozina, 2014; Weems et al., 2013), whereas other studies have reported lower levels of anxiety symptoms in adolescents than children (Olatunji & Cole, 2009; C. R. Reynolds & Richmond, 2008b).
Measurement Invariance and Anxiety
Before gender and age differences can be examined on an instrument, it is important to ensure that the underlying construct of the measure, in this case anxiety, is comparable across groups of interest. The importance of construct equivalence, measurement equivalence, or measurement invariance is that the construct assessed will be defined in the same manner for each group (Little, 1997). When construct equivalence or measurement invariance exists, the construct of interest can be compared in a meaningful way with precision across groups and bias and error will be minimal (Little, 1997). An advanced method to test for construct equivalence or measurement invariance is multigroup CFA (M. R. Reynolds & Keith, 2013). A comprehensive search of the same databases and key search terms mentioned previously and in combination with key search terms, including multigroup CFAs, multiple-group, mean and covariance structure analysis, measurement invariance, and tests of invariance, indicate that tests of measurement invariance have not been conducted with samples of U.S. students on the RCMAS-2 Short Form across gender or across age.
Relations Between General Anxiety and Test Anxiety
The RCMAS-2 Short Form is a measure of manifest or general anxiety. Manifest anxiety was derived from a trait theory of general anxiety (C. R. Reynolds, 1985). However, Spielberger, Anton, and Bedell (1976) indicated that test anxiety is a situation form of trait anxiety. Therefore, measures of manifest or general anxiety and test anxiety should assess similar constructs and their scores should correlate positively and significantly with each other.
The purpose of the present study was to examine the psychometric properties of the RCMAS-2 Short Form scores. I hypothesized that (a) a one-factor model for the RCMAS-2 Short Form would provide an adequate model fit to the data; (b) the RCMAS-2 Short Form would be invariant across gender; (c) the RCMAS-2 Short Form would be invariant across children (ages 7-11) and adolescents (ages 12-19); (d) a mean difference would be found on the RCMAS-2 Short Form across gender, with females having a significantly higher factor mean than males; (e) a mean difference would be found on the RCMAS-2 Short Form across age, with adolescents having a significantly higher factor mean than children; and (e) positive and significant correlations would be found between the RCMAS-2 Short Form scores and scores of measures of test anxiety.
Method
Participants
The participants consisted of 1,003 students, 459 (45.8%) males and 544 (54.2%) females, ages 7 to 19 (M = 12.02, SD = 2.67), in Grades 2 to 12 (M = 6.83, SD = 2.61). The average age of the male and female subsamples was 11.84 years (SD = 2.64) and 12.17 years (SD = 2.70), respectively, and the mean grade level was 6.29 (SD = 2.59) for males and 6.71 (SD = 2.62) for females. The mean age of the child subsample (n = 441), ages 7 to 11, was 9.66 (SD = 1.27) and their mean grade level was 4.23 (SD = 1.33), and the mean age of the adolescent subsample (n = 562), ages 12 to 19, was 13.87 (SD = 1.92) and their mean grade level was 8.31 (SD = 1.87). Ethnic/racial composition of the total sample was .6% Asian, 2.1% Black, 3.2% Hispanic, 6.8% Native American, 78.8% White, and 8.5% Other. Information was not collected on the socioeconomic status (SES) of the students. However, 40.4% of the students in the schools were on free and reduced lunch programs. The students were recruited from general education classrooms in 24 schools in the Midwest, with 39.83% of the students from these schools participating in the study.
Instruments
The Revised Children’s Manifest Anxiety Scale–Second Edition
The RCMAS-2 Short Form consists of 10 items and is a measure of general or manifest anxiety designed for students ages 6-19. Students respond to the RCMAS-2 Short Form items using a yes/no format (C. R. Reynolds & Richmond, 2008b). Internal consistency reliability estimates for the RCMAS-2 Short Form scores ranged from .76 to .79 (males, α =.77; females, α = .76; children, α =.78; adolescents, α =.79; and the total sample α = .78) in the present study. Lowe (2015) reported a correlation of .87 between the RCMAS-2 Short Form scores and the RCMAS-2 Total Anxiety scale scores in a sample of middle school students, and Ang, Lowe, and Yusof (2011) found a correlation of .85 between the RCMAS-2 Short Form scores and the RCMAS-2 Total Anxiety scale scores in a sample of Singapore secondary students. Rubens et al. (2013) reported a moderate correlation of .43 between the RCMAS-2 Short Form scores and the Children’s Depression Inventory–Short Form (Kovacs, 1992) scores, and C. J. Taylor (2013) found a small correlation between the RCMAS-2 Short Form scores and the Negative Life Events (Swearingen & Cohen, 1985) scores.
The Test Anxiety Scale for Elementary Students (TAS-E)
The TAS-E is a 30-item self-report measure of test anxiety for elementary students in Grades 2 to 6. The TAS-E consists of four test anxiety (Physiological Hyperarousal, Social Concerns, Task Irrelevant Behavior, and Worry) subscales and a Total Test Anxiety scale. Students rate their responses on the TAS-E on a 4-point Likert-type scale, ranging from 1 (never) to 4 (always; Lowe, Grumbein, & Raad, 2011). Internal consistency reliability estimates ranged from .81 to .93 for the TAS-E (Physiological Hyperarousal, α = .88; Social Concerns, α = .81; Task Irrelevant Behavior, α = .83; Worry, α = .88; and Total Test Anxiety, α = .93) scores in the current study. Evidence supporting the construct validity of the TAS-E scores has been found (Lowe et al., 2011).
The Test Anxiety Measure for Adolescents (TAMA)
The TAMA is a 44-item self-report measure designed to assess test anxiety among middle and high school students in Grades 6 to 12. The TAMA includes five test anxiety (Cognitive Interference, Physiological Hyperarousal, Social Concerns, Task Irrelevant Behavior, and Worry) scales. Adolescents respond to the TAMA on a 4-point Likert-type scale, ranging from 1 (never) to 4 (almost always; Lowe, 2014). Internal consistency reliability estimates ranged from .77 to .93 for the TAMA (Cognitive Interference, α = .91; Physiological Hyperarousal, α = .88; Social Concerns, α = .90; Task Irrelevant Behavior, α = .77; and Worry, α = .93) scores in the present study. Evidence supporting the construct validity of the TAMA scores has been found (Lowe, 2014).
Procedures
Before the study began, parent consent, student assent, university research review board approval, and school district approval were obtained. Principals from 30 schools in the immediate vicinity of the university where I am employed as a faculty member were contacted about the study through regular mail and 24 of the 30 principals expressed interest and ultimately decided to participate in the study once school district approval was obtained. I worked with the 24 principals to schedule dates to come to the schools to administer the measures. General education teachers in these schools distributed packets, consisting of a parent letter and two copies of the consent form, to students in their general education classrooms. Students took the packets home for their parents to review and those parents who were interested in their son or daughter participating in the study signed one of the consent forms and had their son or daughter return the signed consent form to the school and more specifically to the researchers. For those students 18 and older, these individuals signed their own consent form. Only those students with a signed consent form were allowed to participate in the study. The participants did not receive incentives for their participation in the study.
Students were assessed in large groups in their schools. Test administrators—who included a school psychology faculty member, with 13.5 years of experience in behavioral, emotional, and social assessment, and two doctoral students, who were trained by the school psychology faculty member to follow the instructions provided in the RCMAS-2 manual—gave each student a packet of measures to complete, including the RCMAS-2 and TAS-E or TAMA. Test administrators instructed the students to read the directions on the top of each measure and record their responses. Before students began their work, the test administrators informed the students that they were available to answer any questions the students may have now or during the time they completed the measures. After the students completed the measures, the administrators checked the forms to make sure they were completed correctly (i.e., no information was missing, no items were left blank, and no items were left double-marked). Students who had missing information or items left blank were asked to complete the information and items and students who had more than one response to an item were asked to clarify their response (i.e., to select one response). Furthermore, the RCMAS-2 audio CD was available for any student who had reading difficulties. However, the CD was not needed in the study. These procedures followed are the same as those outlined in the RCMAS-2 manual. Secondary data were used in the present study.
Results
Single-Group CFAs
Five single CFAs were conducted for the total sample, male and female subsamples, and child (ages 7-11) and adolescent (ages 12-19) subsamples to examine the one-factor structure of the RCMAS-2 Short Form scores. Mplus, Version 7.11 (Muthén & Muthén, 1998-2013), was used to conduct the CFAs and the robust weighted least squares (WLSMV) estimator was used as the parameter estimator due to the categorical nature of the data (see Brown, 2006). Guidelines used to indicate a good model fit were a root mean square error of approximation (RMSEA) of <.06, a comparative fit index (CFI) and a Tucker–Lewis index (TLI) of close to .95, and a nonsignificant mean- and variance-adjusted weighted least squares chi-square (WLSMVχ2; Hu & Bentler, 1999), and a RMSEA of ≤.08 (Browne & Cudeck, 1993), a CFI and a TLI of ≥.90, and a nonsignificant WLSMVχ2 to indicate an adequate model fit (Byrne, 1994). The data set consisted of no missing data.
Examination of the modification indices based on the single CFAs performed indicated a correlated error between Items 4 and 10 on the RCMAS-2 Short Form for the total sample and each subsample. Brown (2006) and Byrne (1994) stated that model respecification is not recommended unless the respecification makes statistical and substance sense. In the present study, the model respecification did make statistical and substance sense because of the large modification index value between the two items, the items being on the same factor, and the item content of the two items being similar (i.e., a student’s concern about being laughed at). As a result, the one-factor model was respecified with this one parameter freely estimated. The modified one-factor model provided an adequate fit to the data for the total sample, χ2(34, n = 1,003) = 201.875, p < .0001, CFI = .960, TLI = .947, RMSEA = .070, 90% confidence interval [CI] = [.061, .080]; female subsample, χ2(34, n = 544) = 147.110, p < .0001, CFI = .940, TLI = .930, RMSEA = .078, 90% CI = [.065, .091]; child (ages 7-11) subsample, χ2(34, n = 441) = 108.055, p < .0001, CFI = .950, TLI = .934, RMSEA = .070, 90% CI = [.056, .085]; and adolescent (ages 12-19) subsample, χ2(34, n = 562) = 116.707, p < .0001, CFI = .971, TLI = .961, RMSEA = .066, 90% CI = [.053, .079], and a good model fit for the male subsample, χ2(34, n = 459) = 83.480, p < .0001, CFI = .972, TLI = .962, RMSEA = .056, 90% CI = [.041, .072]. Standardized factor coefficients are presented in Table 1.
Standardized Factor Coefficients for the Modified One-Factor Model for the Total Sample and the Male, Female, Child (Ages 7-11), and Adolescent (Ages 12-19) Subsamples on the RCMAS-2 Short Form.

Note. RCMAS-2 = Revised Children’s Manifest Anxiety Scale–Second Edition.
Multigroup CFAs Across Gender and Across Age
Tests of measurement invariance across gender and across age followed. Criteria used to indicate invariance between the less and more restrictive multigroup models were a nonsignificant change in the WLSMVχ2, ΔWLSMVχ2 (King, Ganotice, & Watkins, 2012), a decrease in the change in the CFI, ΔCFI, of <.01, and an adequate model fit to the data (Cheung & Rensvold, 2002). A cutoff of p ≥ .01 was used to indicate a nonsignificant ΔWLSMVχ2. The results of tests of invariance are presented in Tables 2 and 3.
Summary of Testing Invariance of the RCMAS-2 Short Form Across Gender.
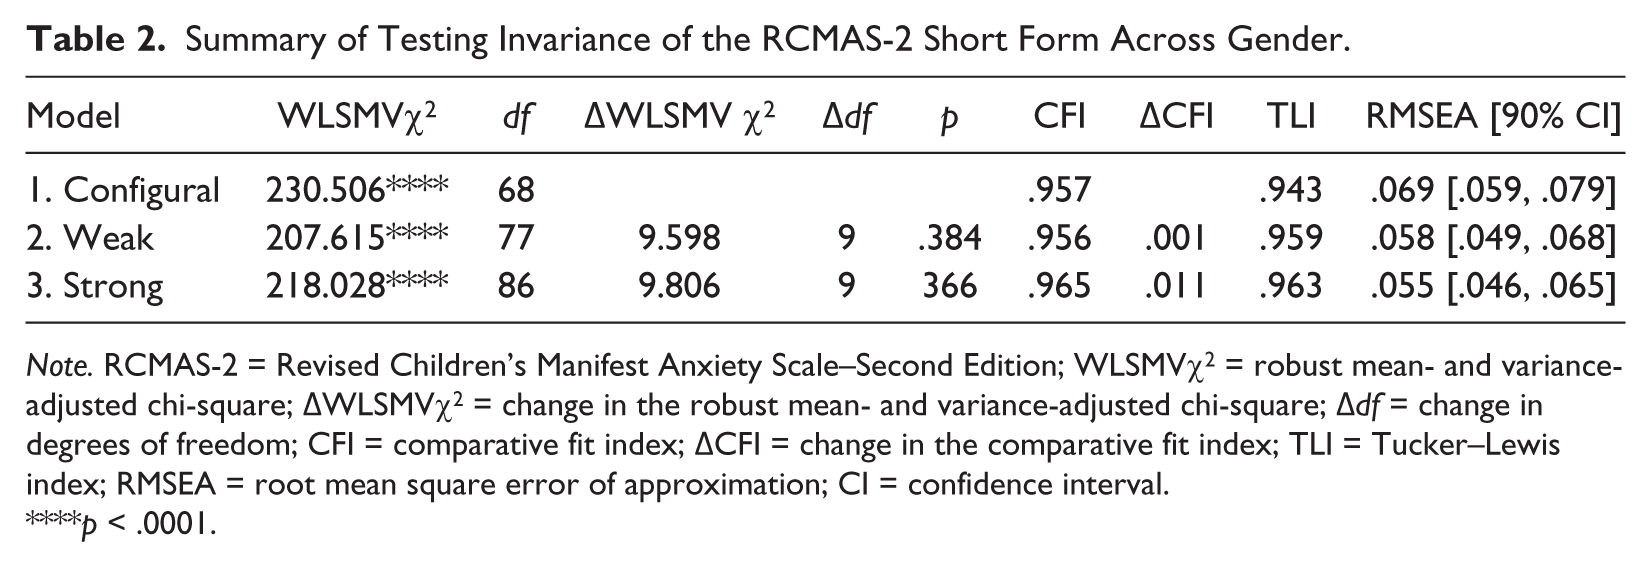
Note. RCMAS-2 = Revised Children’s Manifest Anxiety Scale–Second Edition; WLSMVχ2 = robust mean- and variance-adjusted chi-square; ΔWLSMVχ2 = change in the robust mean- and variance-adjusted chi-square; Δdf = change in degrees of freedom; CFI = comparative fit index; ΔCFI = change in the comparative fit index; TLI = Tucker–Lewis index; RMSEA = root mean square error of approximation; CI = confidence interval.
p < .0001.
Summary of Testing Invariance of the RCMAS-2 Short Form Across Age.

Note. RCMAS-2 = Revised Children’s Manifest Anxiety Scale–Second Edition; WLSMVχ2 = robust mean- and variance-adjusted chi-square; ΔWLSMVχ2 = change in the robust mean- and variance-adjusted chi-square; Δdf = change in degrees of freedom; CFI = comparative fit index; ΔCFI = change in the comparative fit index; TLI = Tucker–Lewis index; RMSEA = root mean square error of approximation; CI = confidence interval.
p < .0001.
Tests of configural invariance where the same pattern of fixed and free parameters are assessed across groups indicated adequate model fit across gender and across age and suggested configural invariance across gender and across age appeared tenable on the RCMAS-2 Short Form (see Tables 2 and 3). Tests of weak invariance followed where the model structure tested in the configural model was included and the corresponding factor loadings were restricted across gender and across age. The results of tests of weak invariance indicated a nonsignificant ΔWLSMVχ2, a ΔCFI of <.01, and an adequate model fit across gender and across age, suggesting weak invariance across gender and across age appeared tenable on the RCMAS-2 Short Form (see Tables 2 and 3). Finally, tests of strong invariance were performed where the corresponding factor loadings and thresholds were constrained across gender and across age. The results of the test of strong invariance indicated a nonsignificant ΔWLSMVχ2, a ΔCFI of .001, and an adequate model fit across gender and suggested that strong invariance seemed tenable across gender on the RCMAS-2 Short Form. In contrast, the results of the test of strong invariance across age indicated a significant ΔWLSMVχ2, a decrease in the ΔCFI of .007, and an adequate model fit.
Visual inspection of the modification indices indicated that the threshold associated with Item 1 (stomach discomfort an individual feels when anxious) was not equivalent for the 7 to 11 and 12 to 19 age groups. When a threshold is not equivalent, a greater level of a latent response is needed before adolescents (ages 12-19) in this case will endorse a “yes” response on Item 1 on the RCMAS-2 Short Form. The constraint was then removed on this threshold and this model was compared with the weak model. A test of partial strong invariance resulted in a significant ΔWLSMVχ2, a decrease in the ΔCFI of .002, and a good model fit for the 7 to 11 and 12 to 19 age groups. Examination of the modification indices indicated the threshold associated with Item 7 (afraid when one awakens) was not equivalent for the two age groups. A greater latent response is needed before students’ ages 12 to 19 will endorse a “yes” response on Item 7 on the RCMAS-2 Short Form. The constraints were removed on the thresholds for Items 1 and 7 and this model was compared with the weak model. The results of the analysis suggested that partial strong invariance appeared tenable across age, as a nonsignificant ΔWLSMVχ2, a decrease in the ΔCFI of .002, and a good model fit were found. Strict factorial invariance was not examined across gender and across age in the present study because it is not needed to compare latent means across groups (Little, 2013) and it may introduce bias in the parameters (Little, 1997).
Validity Evidence Based on Group Differences
Latent mean differences were examined on the RCMAS-2 Short Form across age and across gender (see Table 4), as partial strong invariance across the child (ages 7-11) and adolescent (ages 12-19) subsamples appeared tenable and strong invariance across the male and female subsamples seemed tenable. The latent means of the children and males were constrained and the latent means of the adolescents and females were freely estimated, respectively, in these two separate analyses. In the latent mean analysis across age, a positive latent mean would indicate that adolescents had a higher factor mean than children on the RCMAS-2 Short Form, whereas a negative latent mean would indicate that children had a higher factor mean than adolescents on the RCMAS-2 Short Form. For the latent mean analysis across gender, a positive latent mean would indicate that females had a higher factor mean than males on the RCMAS-2 Short Form. In contrast, a negative latent mean would indicate that males had a higher factor mean than females on the RCMAS-2 Short Form. The results of the latent means analyses are presented in Table 5. Examination of the latent factor means indicated that adolescents and females had significantly higher factor means than children and males, respectively, on the RCMAS-2 Short Form.
Standardized Latent Mean Estimates for the RCMAS-2 Short Form.

Note. RCMAS-2 = Revised Children’s Manifest Anxiety Scale–Second Edition.
p < .01. ***p < .001.
Correlation Coefficients Between the RCMAS-2 Short Form Scores and the TAMA and the TAS-E.

Note. RCMAS-2 = Revised Children’s Manifest Anxiety Scale–Second Edition; TAMA = Test Anxiety Measure for Adolescents; TAS-E = Test Anxiety Scale for Elementary Students.
p < .01.
Validity Evidence Based on External Relations
Correlation coefficients were then computed between the RCMAS-2 Short Form scores and scores of measures (i.e., the TAS-E and TAMA) external to the test. Elementary students in Grades 2 to 6 completed the TAS-E and middle and high school students in Grades 6 to 12 completed the TAMA. Moderate correlations of .53 to .67 and .48 to .68 were found between the RCMAS-2 Short Form scores and the scores of the TAMA and the TAS-E, respectively (see Table 5).
Discussion
Overall, the findings of the present study provide support for the construct validity of the RCMAS-2 Short Form scores. The results of the current study indicated that a modified one-factor model provided an adequate model fit for the total sample of 2nd- through 12th-grade students. These findings are similar to Lowe’s (2015) EFA results of a one-factor structure as the most appropriate solution for the RCMAS-2 Short Form in a sample of U.S. middle school students. In addition, the findings of the present study indicated strong invariance across gender and partial strong invariance across age on the RCMAS-2 Short Form, suggesting that gender and age bias are unlikely to be present on the RCMAS-2 Short Form. Gender differences were found on the RCMAS-2 Short Form, with females reporting a significantly higher factor mean than males. This result is in agreement with the literature, with females scoring higher than males on self-report measures of anxiety (Gullone et al., 2001; Hishinuma et al., 2000; Planck et al., 2013; C. R. Reynolds, 1998), beginning as early as age six (C. R. Reynolds, 1998). Age differences were also found, with adolescents reporting a significantly higher factor mean than children on the RCMAS-2 Short Form. This finding is in agreement with developmental theories (Warren & Sroufe, 2004; Westenberg et al., 2001) and Weems et al.’s (2013) results of higher levels of anxiety reported among adolescents than children. Finally, moderate correlations were found between the RCMAS-2 Short Form scores and scores on the TAMA and TAS-E. These findings were in agreement with Lowe’s (2014), Lowe et al.’s (2011), and Spielberger’s (1980) results of positive and significant correlation coefficients found between the scores of measures of trait or manifest anxiety and test anxiety.
Two thresholds associated with Items 1 and 7, which assess physical symptoms associated with anxiety, were not equivalent for children and adolescents on the RCMAS-2 Short Form. A greater level of the latent response is needed before adolescents will endorse a “yes” response on these two items. Developmental theories (Warren & Sroufe, 2004; Westenberg et al., 2001) predict decreases in physiological hyperarousal symptoms of anxiety across the child and adolescent life span and this could possibly help explain why these two items on the RCMAS-2 Short Form operated differently across the groups of children and adolescents in the present study.
There are several limitations associated with the present study. The sample used in the current study was a sample of convenience. A sample of convenience may limit the generalizability of the findings of a study. Other limitations associated with the present study were the age, geographic, and ethnic/racial diversity of the sample. Fewer students in the lower elementary schools and high schools participated in the present study in comparison with students in the upper elementary and middle schools. In addition, the students in the current study were recruited only from the midwestern region of the United States. Also, a smaller percentage of Asian, Black, and Hispanic students and a larger percentage of Native American students participated in the current study when compared with the 2011 U.S. Census (U.S. Census Bureau, 2011). Furthermore, information on the SES of the students was not collected. However, information on the percentage of students who were on free and reduced lunch programs was noted in the present study. Future studies with the RCMAS-2 Short Form should include information on the SES of the participants and a larger percentage of lower elementary and high school students, samples of children and adolescents from other geographic regions of the United States, and a larger percentage of ethnically/racially diverse students. Replication of the findings of the present study using a random, stratified sample of U.S. children and adolescents would lend support to the results reported in the current study.
Another limitation associated with the present study was the use of self-report only to examine the relations between the RCMAS-2 Short Form scores and scores external to the test. The use of self-report only may introduce method bias. A future study using the multitrait, multimethod approach to assess the relations between the RCMAS-2 Short Form scores and scores of other measures would not only provide invaluable information, but would also address the issue of method bias.
Some research has suggested young children, such as children in second grade, may be less able to provide reliable information about their emotional states on self-reports (Edelbrock, Costello, Dulcan, Kalas, & Conover, 1985). Thus, the inclusion of students in second grade may be another limitation associated with the current study. However, C. R. Reynolds and Richmond (2008b) stated that individuals with a second-grade reading level should be able to understand and complete the items on the RCMAS-2, as the Flesch Reading Ease scores (Flesch, 1979) for the RCMAS-2 items are in the very easy range. In addition, the coefficient alpha for the second-grade students’ scores on the RCMAS-2 Short Form in the current study was .87, which is in the adequate range (Nunnally & Bernstein, 1994). Furthermore, the RCMAS-2 audio CD was available to use for children with reading difficulties. However, none of the children needed to use the audio CD.
Additional research studies that can be conducted with the RCMAS-2 Short Form include the examination of measurement invariance and group differences on the measure across U.S. ethnic majority and ethnic minority students, children and adolescents from different cultures, and students with and without anxiety disorders. The results of these future studies will help determine whether the RCMAS-2 Short Form is an appropriate measure to use with children and adolescents from different ethnic and culture groups as well as whether this instrument is helpful in discriminating those children and adolescents with and without anxiety disorders.
Although additional research is needed with the RCMAS-2 Short Form, the findings of the present study suggest that it is a promising, brief measure of general or manifest anxiety for use with children and adolescents. Brief measures have become more popular with many clinicians and researchers in recent years for a variety of pragmatic reasons, including their ability to save time, money, and effort (Shachar, Aderka, & Gilboa-Schechtman, 2014); maintain the cooperation of respondents who complete the scales (McCrae & Costa, 2007); and screen large number of students (C. R. Reynolds & Richmond, 2008b) in schools using a responsiveness-to-intervention model or a multiple gating approach. Research has demonstrated that brief measures can be useful in the assessment of personality constructs (Herzberg & Brähler, 2006; Rammstedt & John, 2005). Although more research is needed, the RCMAS-2 Short Form has the potential to become a popular brief measure that provides invaluable information to clinicians and researchers about the levels of anxiety experienced by children and adolescents.
Footnotes
Declaration of Conflicting Interests
The author(s) declared no potential conflicts of interest with respect to the research, authorship, and/or publication of this article.
Funding
The author(s) received no financial support for the research, authorship, and/or publication of this article.