
Abstract
The aim of the present study was to develop a more integrated measure of classroom sense of community (SOC) while testing factorial invariance of the measurement structure across face-to-face and online courses. We incorporated two existing SOC measures to capture both context-specific and context-general characteristics of SOC and developed an integrated scale of classroom SOC with a four-factor structure. Tests of measurement invariance indicated that the new measure of classroom SOC has equivalent patterns of factor loadings, strength of factor loadings, and intercepts across the two course delivery modes, thus making this a viable measure to examine potential differences across these contexts. Latent mean analysis indicated that students in an online course perceived a lower level of SOC.
Institutions of higher education have recently given more attention to building students’ sense of community (SOC) due to a growing concern about student retention (Summers & Svinicki, 2007; Tovar & Simon, 2010). Considerable research has supported that perception of classroom SOC has significant implications for students’ emotional, social, and cognitive development (O’Connor, 2013; Summers, Beretvas, Svinicki, & Gorin, 2005; Top, 2012). Students experiencing a strong SOC in college tend to exhibit better adjustment and persistence in school (Mannarini & Fedi, 2009; Top, 2012). Despite the educational and psychological benefits of SOC, there are challenges associated with measuring SOC in the post-secondary classroom (McMillan, 1996, 2011).
Many researchers have agreed that the concept of SOC is complex and multi-dimensional (Abdelkader & Bouslama, 2014; Mannarini & Fedi, 2009; Nowell & Boyd, 2010; Warner, Kerwin, & Walker, 2013); however, there is a lack of consensus regarding the conceptual dimensions of the construct. Conceptual divergence has resulted in the development of multiple measures of SOC with different theoretical foundations, which, in turn, generated confusion and problems in comparisons between previous findings and has limited theory building and testing (Nowell & Boyd, 2010, 2011).
Another measurement issue for SOC is related to the rapid growth of online courses because SOC can be experienced in an online learning environment as well as in a traditional face-to-face classroom. Online classrooms differ from traditional face-to-face classrooms in structure and content delivery; though social dynamics are thought to be essential for increasing SOC (Barnard-Brak & Shiu, 2010; Rovai, 2002; Rovai, Wighting, & Lucking, 2004) in both online and face-to-face classrooms. Without examining the measurement invariance of SOC across course delivery methods (i.e., face-to-face vs. online courses), group comparisons remain problematic. Consequently, investigating measurement invariance, or the extent to which factor structures are equivalent across groups, is recommended in all educational and psychological testing (Borsboom, 2006; Tovar & Simon, 2010) as a prerequisite to making cross-group comparisons. No prior research has attempted to examine whether conceptual dimensions of classroom SOC may differ based on course delivery methods. To ensure that we can utilize the same conceptual framework to understand student experience of SOC in different learning environments, it is important to investigate this question empirically. Therefore, the primary purposes of this study were to develop a comprehensive measure of SOC within the context of classroom learning environment by integrating existing theoretical models of SOC and to determine if the measure is invariant across course delivery formats.
A SOC has generally been described as feelings of relatedness, belonging, or connection as a result of common experiences within a group (McMillan, 1996, 2011). Conceptual components of SOC should reflect the contextual nature (e.g., workplace or academic setting) of the specific community being measured (Admiraal & Lockhorst, 2012; Barnard-Brak & Shiu, 2010; Hill, 1996). Earlier research on SOC primarily focused on location-based community (e.g., neighborhood), but subsequent research extended the focus to a variety of settings including school and classroom settings. For instance, Rovai (2002) conceptualized SOC based on two components (i.e., connectedness and learning) in classroom and school contexts and developed the Classroom and Community Scale. The Classroom and School Community Inventory, later developed by Rovai et al. (2004), includes social and learning components as the two primary aspects of classroom learning environment. In addition to the context-specific aspects of SOC, Glynn (1981) suggested that there are some characteristics of SOC that are commonly observed across contexts. Several researchers argued that shared goals and purposes are essential to the development of SOC. Although the importance of shared goals is well addressed in SOC in non-educational settings, available instruments developed for educational settings have failed to consider shared goals as a dimension of SOC. Thus, the development of a more comprehensive, integrated measure of classroom SOC is warranted.
In an effort to incorporate both context-specific and context-general aspects of SOC, we reviewed existing measures. The Perceived Sense of Community (PSC) Scale, devised by Chertok (1990) for non-educational settings (i.e., residential program for recovering alcoholics), consists of three factors: (a) mission (the perception that group members share a common purpose), (b) reciprocal responsibility (the perception that members are mutually responsible to each other), and (c) disharmony (lack of emotional connections among group members). Although the PSC measures shared goals and emotional connections among group members, its use in higher education is limited because it fails to capture the classroom-specific dynamics of SOC.
The Post-Secondary Classroom Community Scale (PSCCS), developed by Bush, Svinicki, Achacoso, and Kim (2004), measures both learning and connection components essential to SOC within higher education but still does not address the domain-general dimension of shared goals and responsibility. Apparent deficits in the content validity of existing SOC measures indicate a need for an integrated measure of SOC that incorporates the domain-general characteristics of SOC (i.e., shared goals and responsibilities) and is sensitive to classroom dynamics specific to the higher education environment.
The goals of the present study provide a more integrated approach to the assessment of SOC, examine measurement invariance across face-to-face and online courses, and compare latent mean differences in SOC across course delivery methods.
Method
Participants
Participants included 819 undergraduate students enrolled in face-to-face (n = 575) and online courses (n = 244) within the College of Education at a large Midwestern state university. Females were disproportionately represented within the entire sample, which is typical of education major courses. Approximately 64% of the face-to-face students and 63% of the online students indicated that they were female. Across both subsamples, nearly 80% indicated that they were Caucasian. About 38% of face-to-face students self-identified as seniors, 23% juniors, 19% sophomores, and 19% indicated that they were freshmen. In the online sample, about 40% identified as seniors, 19% indicated that they were juniors, 15% sophomores, and a little more than 7% indicated that they were freshmen.
Measures
We collected a range of demographic information about class-size, expected grade point average (GPA), cumulative GPA, employment status (1 = employed, 2 = not employed), marital status (1 = married, 2 = not married), and family status (1 = have children, 2 = no children) to test potential differences between the face-to-face and online groups.
Based on an extensive review of the literature, we used two existing measures of SOC with substantially different conceptualizations of SOC to construct and validate an integrated measure of classroom SOC. The first measure is the PSC developed by Chertok (1990) and updated by Bishop, Chertok, and Jason (1997). The PSC includes three conceptual dimensions: Mission, Reciprocal Responsibility, and Disharmony. Sixteen items relevant and applicable to classroom learning environment were adopted from the original scale. The wordings of these items were modified to be appropriate for the classroom setting (see the appendix for sample items). The second measure, the PSCCS, focuses on interactions within the classroom setting (e.g., interaction with the instructor, peers, and content). The PSCCS (Bush et al., 2004) includes 14 items with three conceptual dimensions: Engagement With Content, Student–Instructor Interaction, and Peer Respect/Connectedness (see the appendix for sample items). The items were measured on a 7-point Likert-type scale ranging from 1 (strongly disagree) to 7 (strongly agree).
Procedures
We received permission from instructors who teach a face-to-face course or an online course to administer surveys to their classes. Students were administered a survey, which included an information sheet, questionnaires, and demographic questions. For students in face-to-face courses, surveys were administered during class time by the research team. Online students were forwarded an online version of the questionnaire by their instructors. All student participation in the study was voluntary.
Analytic Procedure
Students enrolled in face-to-face courses (n = 575) were randomly assigned to a validation (n = 259) and a replication sample (n = 316). An exploratory factor analysis (principal-axis factor analysis using direct oblimin rotation) was conducted on the validation sample using items from the PSC and the PSCCS. Findings from the validation sample were then examined via confirmatory factor analysis (CFA) on the replication sample. Measurement invariance of the final CFA model was then examined across students enrolled in face-to-face courses (n = 316) or online courses (n = 244) using the general procedures outlined by Byrne (2010). First, the CFA models for face-to-face and online students were examined separately. A common measurement model was then tested for invariance by investigating both groups simultaneously. Invariance procedures, as used within this study, examined three nested models. Model 1 is the configural model, which is an initial examination of both the number and pattern of loadings across both groups. Model 2 examined metric invariance, which consists of constraining the factor loadings to be equivalent across both groups. Model 3 investigated scalar invariance, which constrains item intercepts to be equivalent across both groups.
To determine whether imposing equality constraints across models resulted in substantive decrements in model fit, differences in chi-square (∆χ2) and the comparative fit index (∆CFI) were examined. However, prior to comparing nested models using a chi-square difference test, the Satorra–Bentler correction to the chi-square statistic (Satorra & Bentler, 2010) using Mplus (Muthén & Muthén, 2007) was used due to violations of multivariate normality. Chi-square difference values at p < .05 and ∆CFI > .01 indicates a substantial decrease in model fit in comparison with the less constrained models. Overall fit of CFA models was judged based on chi-square goodness-of-fit statistic (χ2 / df < 3), Root Mean Square Error of Approximation (RMSEA< .08), Standardized Root Mean Square Residual (SRMR< .06), Tucker–Lewis Index (TLI > .90), and the CFI (excellent at CFI > .95; acceptable at CFI > .90) (Hu & Bentler, 1999; Kline, 2005).
Results
Preliminary Analyses
To accomplish the purposes of this study, the sample was first split into those students enrolled in face-to-face courses (n = 575) and those enrolled in online courses (n = 244). Preliminary analyses compared both subsamples across a range of demographic, academic, and familial variables. There were statistically significant differences in age across online (M = 24.14, SD = 6.75) and face-to-face students (M = 22.03, SD = 4.97), t(790) = 4.55, p < .001, d = .32. Approximately 20% of online students indicated that they were married, compared with only 5% of face-to-face students
Exploratory Factor Analysis
Thirty-one items from the PSC and the PSCCS were submitted to principal-axis factor analysis using direct oblimin rotation on the face-to-face validation sample (n = 259). We considered three extraction criteria including Horn’s (1965) parallel analysis, eigenvalue-greater-than-1-rule, and Velicer’s (1976) minimum average partial (MAP) correlation. Factor solutions were also evaluated for their theoretical meaningfulness and approximation of simple structure. An examination of these criteria, as well as their proposed solutions, eventually led to a four-factor solution.
The first seven eigenvalues before rotation were 13.11, 2.61, 1.77, 0.82, 0.73, 0.64, and 0.38. When conducting Horn’s parallel analysis, 1,000 matrices consisting of the same number of observations (n) and variables (v) as within the present study were randomly generated. We estimated eigenvalues from each matrix to compare the eigenvalues estimated from the sample of face-to-face students with the distribution of each eigenvalue estimated from random data. The first seven eigenvalues located at the 95th percentile from the random data were 1.04, 0.89, 0.79, 0.71, 0.64, 0.58, and 0.38. This analysis indicated that six factors should be extracted because the first six eigenvalues from the sample data were greater than the eigenvalues at the 95th percentile from the randomly generated data.
A six-factor solution was examined and appeared to lead to the extraction of too many factors. We, therefore, used an eigenvalue-greater-than-1-rule as a minimal standard to decide how many factors to extract which indicated that three factors should be extracted. The average squared partial correlation after successively removing the first five components is as follows: 1 = .036, 2 = .027, 3 = .018, 4 = .017, and 5 = .017. These values imply that the MAP correlation is achieved by extracting four factors. Both the three- and four-factor solution were further examined for theoretical meaningfulness, as well as an approximation of simple structure.
The four-factor solution accounts for approximately 58% of the common variance and includes (a) shared goals and responsibility, (b) relationship with the instructor, (c) student engagement, and (d) peer valuation. The primary difference between the four-factor solution and the three-factor solution is that items referring to student engagement were separated from the shared goals and responsibility factor in the four-factor solution, while they were combined with the shared goals and responsibility factor in the three-factor solution. Although student engagement factor and shared goals and responsibility factor were correlated (i.e., r = .50, p < .001), from a theoretical point of view, we judge these distinctions as important to the SOC. Therefore, the four-factor solution was retained as the final model. However, in the rotated four-factor solution, there were nine items with low communality estimates (i.e., h2 < .40) or pattern coefficients
We conducted a final exploratory factor analysis with these items removed from the analysis. The final four-factor solution accounted for approximately 63% of the common variance. Table 1 presents factor loadings as well as skewness and kurtosis for retained items. Interpretation of the pattern matrix indicated that the first factor is principally defined by seven items referring to Shared Goals and Responsibility (i.e., striving for common purposes). The second factor was defined by five items referring to the Relationship With the Instructor (i.e., support from the instructor), the third factor was defined by eight items referring to Student Engagement (i.e., interest, value of learning), and the fourth factor was defined by two items referring to Peer Valuation (i.e., support and respect from peers).
Exploratory Factor Analysis With Validation Sample (n = 259).
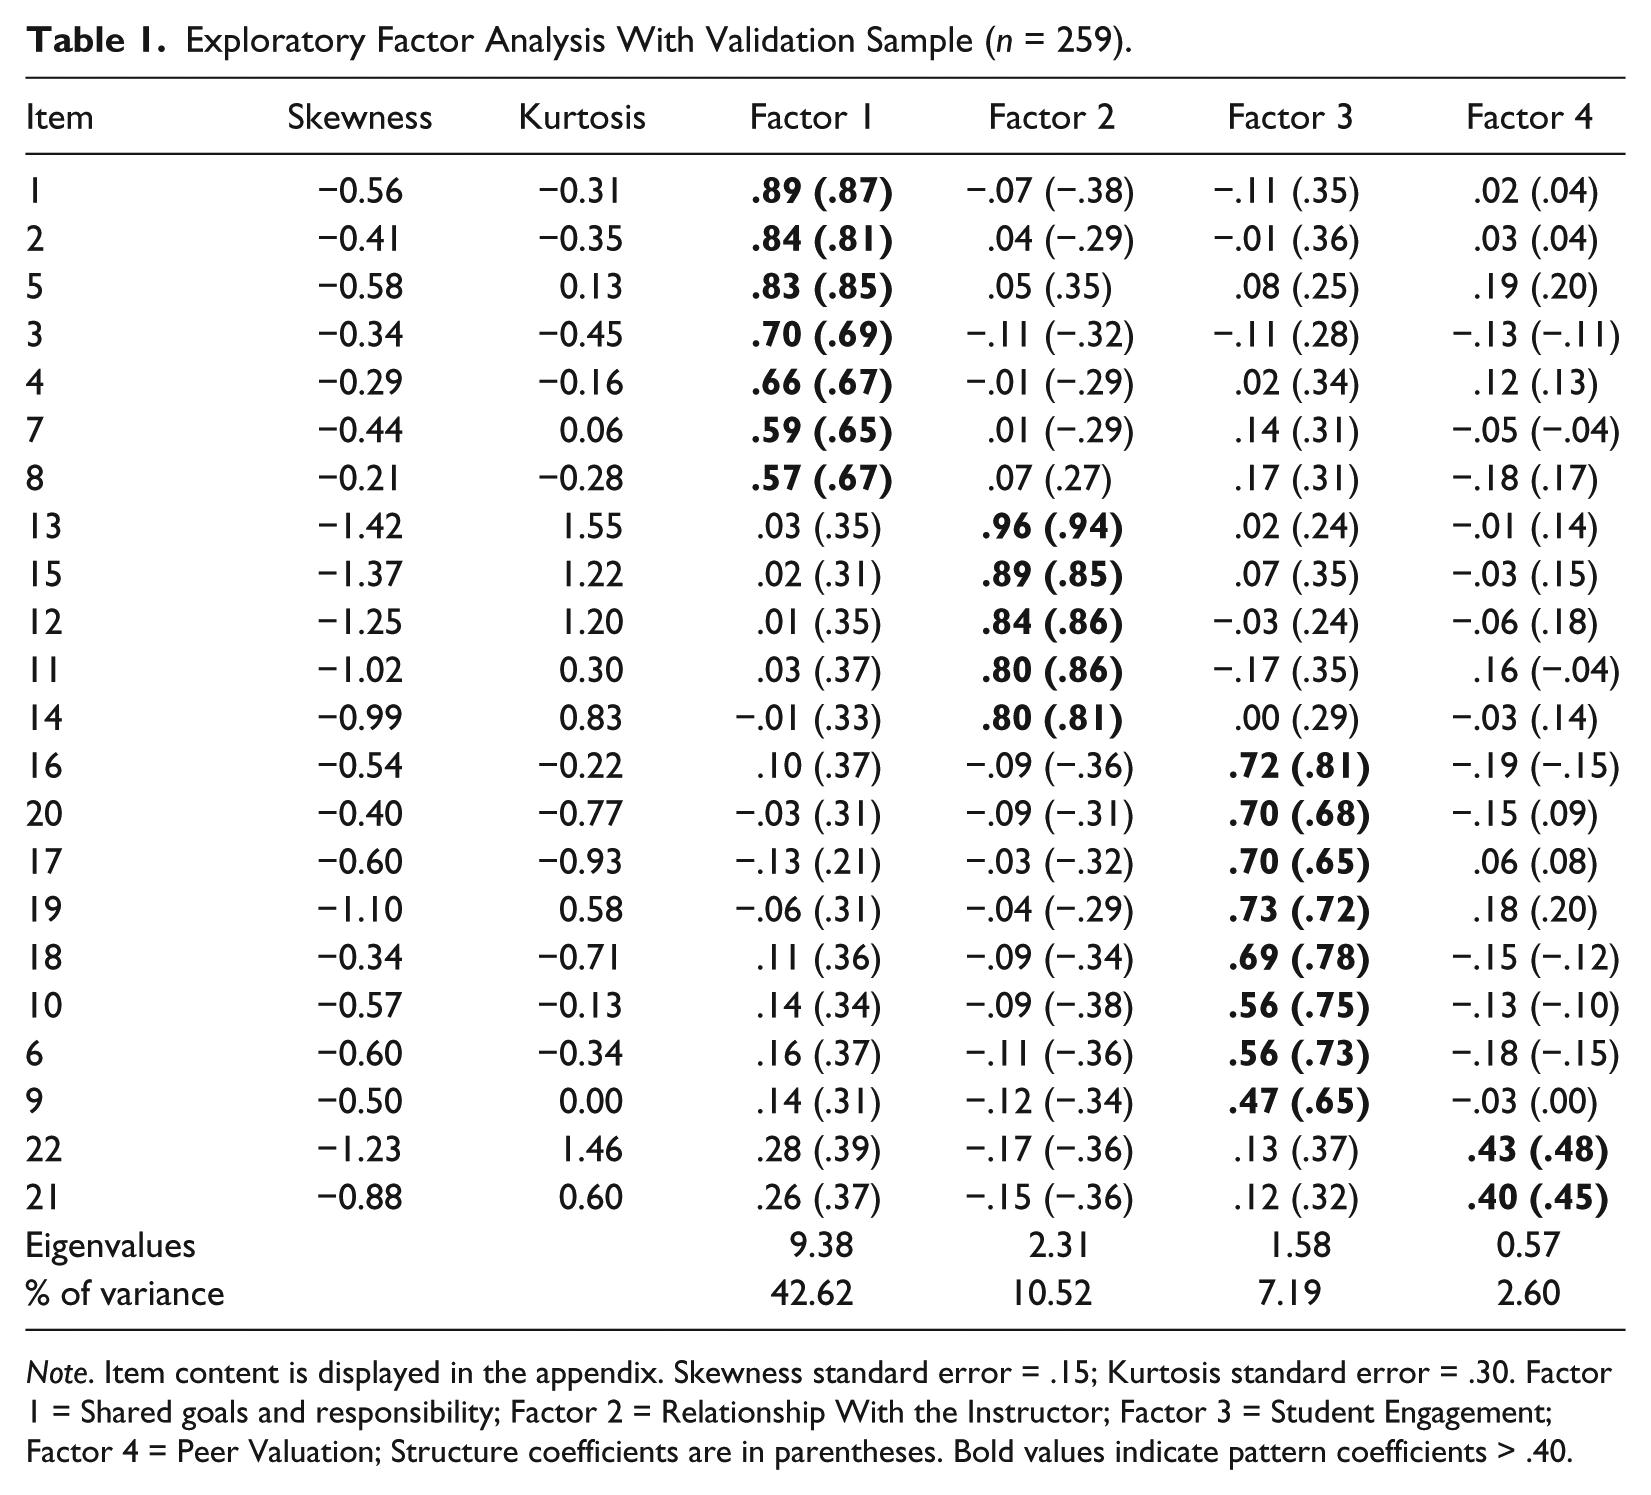
Note. Item content is displayed in the appendix. Skewness standard error = .15; Kurtosis standard error = .30. Factor 1 = Shared goals and responsibility; Factor 2 = Relationship With the Instructor; Factor 3 = Student Engagement; Factor 4 = Peer Valuation; Structure coefficients are in parentheses. Bold values indicate pattern coefficients > .40.
The shared goals and responsibility factor was moderately correlated with the relationship with the instructor factor (r = .40, p < .001) and student engagement factor (r = .53, p < .001), although the correlation with peer valuation factor was not significant (r = .06, p = .31). Relationship with the instructor factor is related to student engagement factor (r = .53, p > .05) and peer valuation factor (r = .18, p < .01). The relationship between student engagement factor and peer valuation factor was not significant (r = .01, p > .05). Cronbach’s alpha reliability coefficients of all factors were favorable: .91 for shared goals and responsibility, .92 for relationship with the instructor, .90 for student engagement, and .84 for peer valuation.
Initial Confirmatory Factor
The factor structure established in the validation sample was then tested via a CFA with the face-to-face replication sample (n = 316) and online samples separately (n = 244). Model fit across both the face-to-face sample,
For the face-to-face sample, internal consistency reliability estimates were generally high across each factor (i.e., α = .91 for share goals and responsibility, α = .91 for relationship with the instructor, α = .90 for student engagement, α = .84 for peer valuation). Similarly, internal consistency reliability estimates across each factor for the online sample were also favorable (i.e., α = .88 for share goals and responsibility, α = .91 for relationship with the instructor, α = .87 for student engagement, α = .83 for peer valuation).
Measurement Invariance Tests
The results of the measurement invariance tests are presented in Table 2. The configural model, wherein both groups were tested simultaneously on the CFA model discussed above, had acceptable model fit,
Measurement Invariance Tests for Classroom Sense of Community Scale Across Face-to-Face and Online Courses.
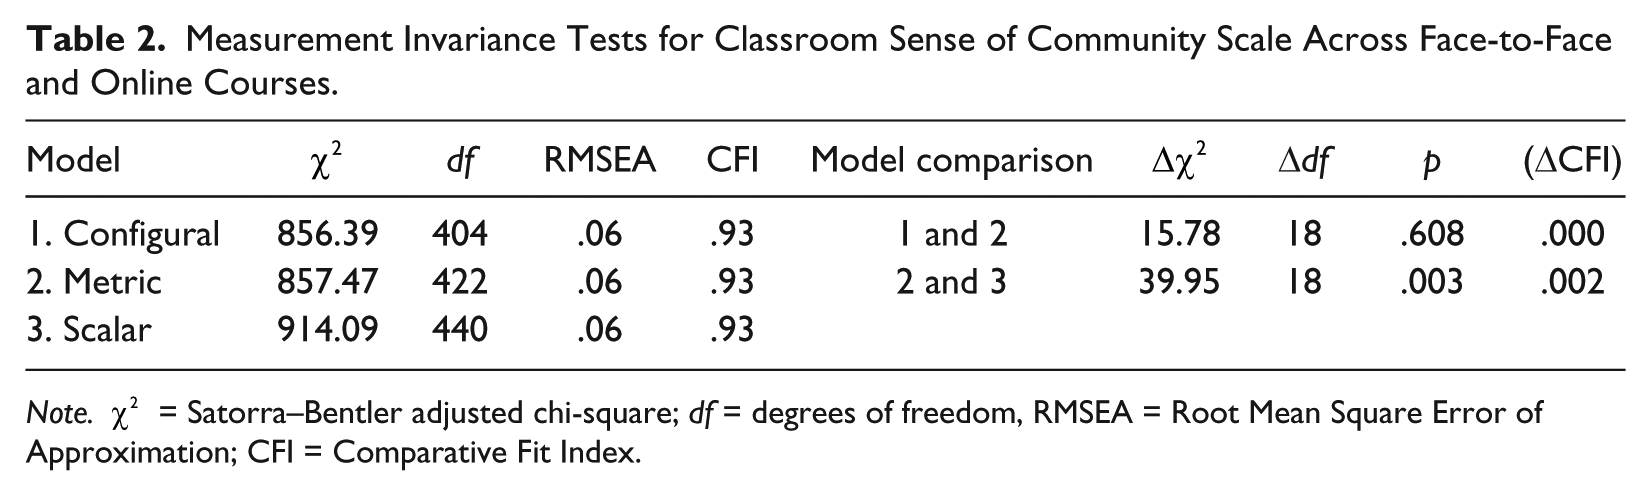
Note. χ2 = Satorra–Bentler adjusted chi-square; df = degrees of freedom, RMSEA = Root Mean Square Error of Approximation; CFI = Comparative Fit Index.
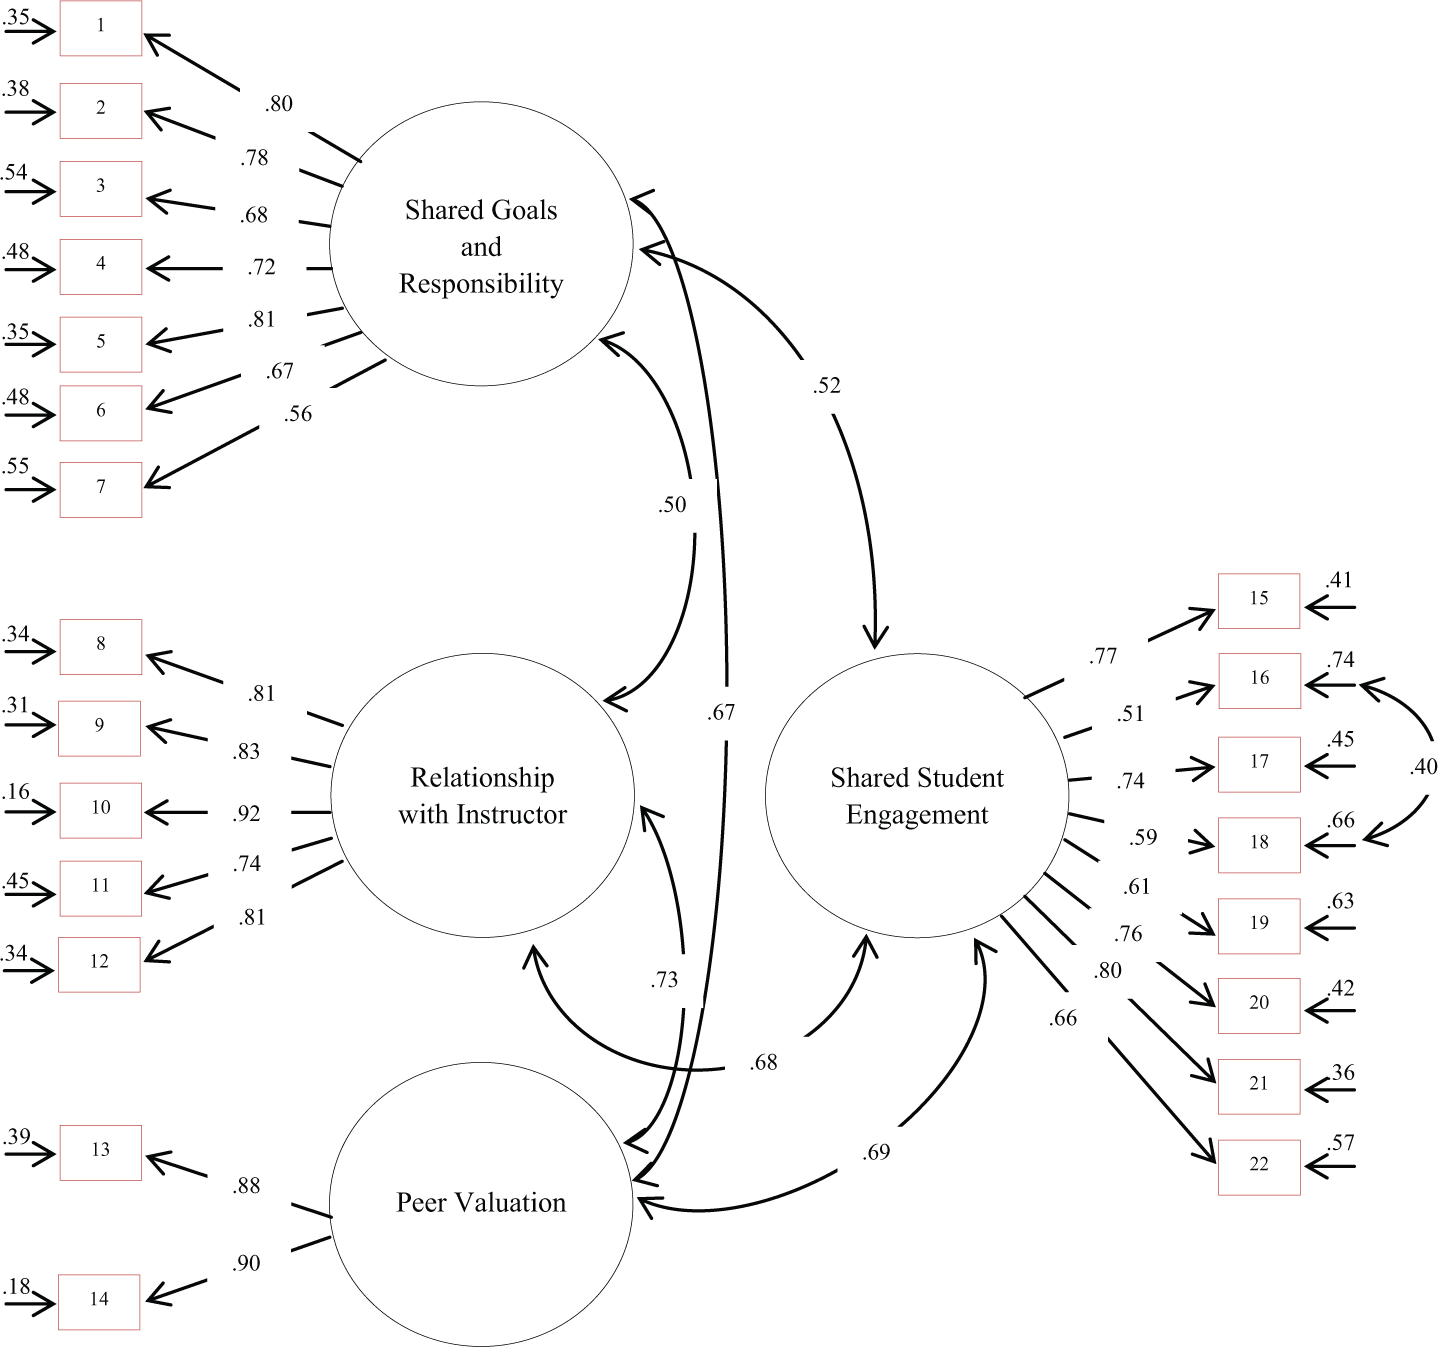
Final confirmatory factor analysis model.
After investigating metric invariance across face-to-face and online courses, we then examined latent mean differences among the face-to-face and online students. Due to model identification purposes, the latent factor means for the face-to-face group were freely estimated while constraining the latent factor means of the online group to zero (Byrne, 2010). Positive latent means for the face-to-face group would, therefore, indicate that these means were higher than the online group. The latent factor means indicated that the face-to-face students perceived higher levels of Shared Goals and Responsibility, Instructor Relationship, Student Engagement, and Peer Valuation than their online counterparts (see Table 3).
Face-to-Face Latent Mean Estimates for the Four Factors of Classroom Sense of Community Scale.
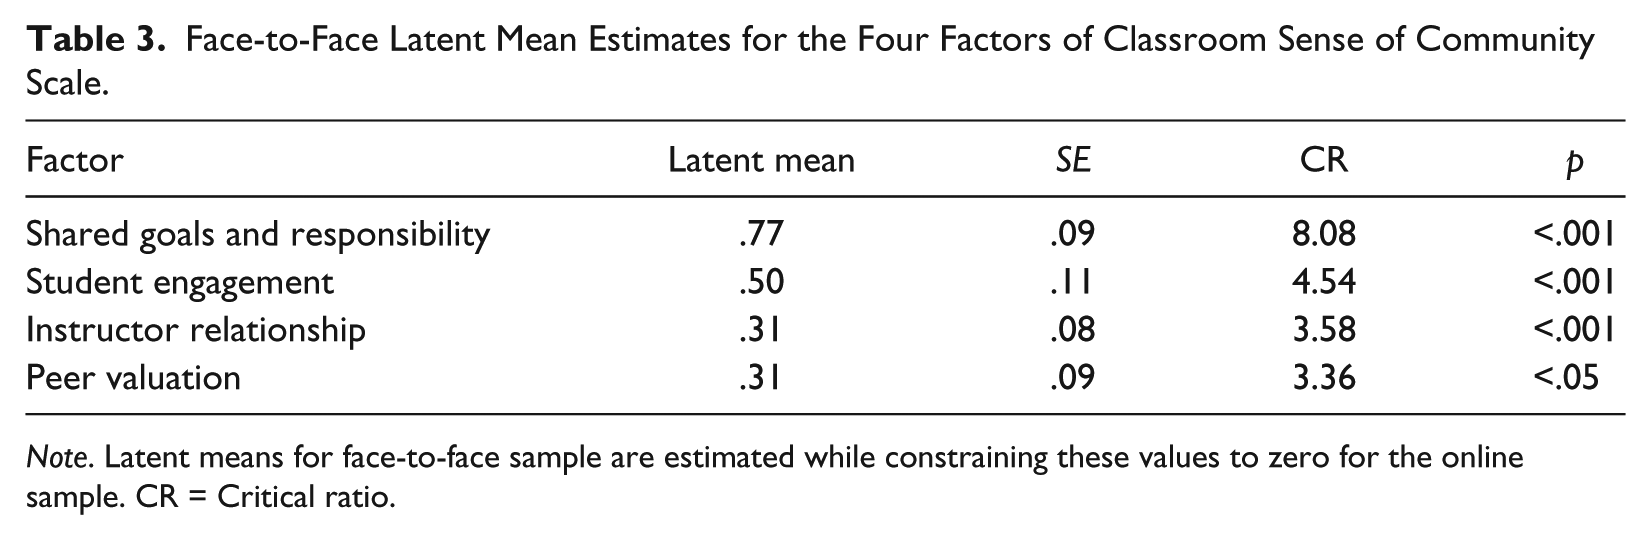
Note. Latent means for face-to-face sample are estimated while constraining these values to zero for the online sample. CR = Critical ratio.
Second-Order Factor Analysis
The first-order CFA indicates that substantial correlations exist between each factor (see Figure 1). Given the magnitude of these correlations, Gorsuch (1983) recommended examining a second-order factor structure (Gorsuch, 1983). We therefore conducted a second-order CFA wherein each of the four factors was hypothesized to load onto a single second-order SOC factor. This test was conducted when combining both the face-to-face and online groups. Overall model fit was reasonable,
Discussion
The current study aimed to construct an integrated measure of sense of community (SOC) by incorporating both context-specific and context-general characteristics of SOC. Although shared goals and responsibility were considered to be an essential element of SOC (Glynn, 1981), this context-general aspect of SOC has been excluded from the measures of SOC for the higher education classroom. Therefore, we attempted to capture the classroom dynamics of higher education (e.g., social relationships with an instructor and peers and student engagement with content), while incorporating the domain-general features of SOC (e.g., shared goals and responsibility).
The principal-axis factor analysis performed with a validation sample implied that a four-factor structure was optimal. This inference was generally supported by using CFA with a replication sample. The four factors included (a) Shared Goals and Responsibility, (b) Relationship with Instructor, (c) Student Engagement, and (d) Peer Valuation. The result provided empirical evidence that the dimension of “Shared Goals and Responsibility” is a meaningful addition to the assessment of SOC. Striving to accomplish common goals among class members by working together (i.e., shared goals and responsibilities) clearly adds substantive value to understanding the construct of classroom SOC.
Tests of measurement invariance indicated that the factor structure of the integrated measure of classroom SOC is equivalent across face-to-face and online courses, thus providing evidence that the integrated measure of SOC is appropriate to examine group differences across different course delivery methods. The invariant factor structure of this measure across face-to-face and online students enables researchers to conduct research on how best to understand courses to promote students’ classroom SOC.
The latent mean analysis indicated that students taking online courses tend to perceive a lower SOC across each measured dimension than students enrolled in traditional, face-to-face courses. This result might explain the consistent challenges of isolation, retention, and achievement that are observed in online education (Beard & Harper, 2002). Because student–instructor and peer-to-peer interactions are key components of classroom SOC, exploring the differences in social interactions across course delivery methods may be useful for improving the online experience. Lack of socialization opportunities, real-time communication, and direct interaction with the instructor has been reported as disadvantages to the online classroom (Beard & Harper, 2002) and may reduce students’ perceived SOC in the learning environment. However, the current results do not imply that the mean differences are an effect of online classrooms. Reported differences in latent means should be interpreted with caution because of the difficulty of separating the effect of online classrooms on SOC from other, potentially confounding variables such as course design (Twigg, 1996). Future research should aim at systematically manipulating course design and instructional methods in online classrooms to examine the effect on SOC.
Given that online courses and distance education programs are a rapidly growing alternative to traditional face-to-face educational courses (Barnard-Brak & Shiu, 2010), these findings raise important questions about potential intervention strategies that may be used to increase the perception of shared goals, the quality of instructor interaction, student engagement, and the valuation placed on student peers for online learning communities among undergraduate students. Increases in real-time communication and building group activities would encourage peer-to-peer interactions and possibly result in desirable student achievement gains (Beard & Harper, 2002). It is important to note some limitations within the current study. Although our integrated measure of SOC may be used in its current form, it is interesting to note that the error terms of two items within the Student Engagement factor were inter-correlated. The presence of correlated error terms between these two items indicates that reliable variance exists that is unaccounted for by the Student Engagement factor. A review of the content of these items reveals that both refer to student interest; consequently, there may be an unexamined, yet distinct, interest factor that may provide further insight into SOC. As the Peer Valuation factor is only defined by two items, future psychometric work should construct additional items to increase the reliability of this factor.
Footnotes
Appendix
Declaration of Conflicting Interests
The author(s) declared no potential conflicts of interest with respect to the research, authorship, and/or publication of this article.
Funding
The author(s) received no financial support for the research, authorship, and/or publication of this article.