
Abstract
The present study reports on a replication of the technical adequacy of the Student Subjective Wellbeing Questionnaire (SSWQ), which is a 16-item self-report instrument for assessing youth’s academic efficacy, educational purpose, joy of learning, and school connectedness, with a sample of adolescents in Grades 6 to 7 (N = 438). Findings confirmed the SSWQ’s latent factor structure as well as the reliability and distribution of its factors/scales. Results also indicated that SSWQ scores had concurrent associations with youths’ self-reported academic achievement, cumulative risks, and cumulative assets. Overall, this study provides a strong, positive replication of the technical adequacy of the SSWQ, suggesting that it is a psychometrically sound measure for school psychological research and, potentially, practice. Prior to recommending the SSWQ for practical purposes in schools, however, applied research is needed to investigate issues related to incremental validity and treatment utility.
Positive psychology can be understood as the scientific study of human wellbeing (Renshaw, Long, & Cook, 2014). Given that the goals of scientific psychology are to describe, predict, and influence human behavior, the science of wellbeing is necessarily devoted to the business of describing, predicting, and influencing all manner of healthy and successful human functioning (Sheldon & King, 2001). Positive psychology is thereby a broad field, entailing the empirical study of public behaviors (e.g., social interaction and physical performance) and private behaviors (e.g., cognitions and emotions) that operationalize wellbeing, as well as the environments or contexts that influence it (Gable & Haidt, 2005; Seligman & Csikszentmihalyi, 2000). Just like any other science, a science of human wellbeing involves “interacting in and with the world so as to learn how to be more effective in organizing it, speaking about it, measuring it, and changing it” (Hayes, Barnes-Holmes, & Wilson, 2012, p. 2). As positive psychology has made its way into the schools during the past decade, it has been preceded, accompanied, and followed by much scientific work aiming to define, measure, and intervene with the wellbeing of students and their caregivers (e.g., Furlong, Gilman, & Huebner, 2014). And a substantial thread within this field of inquiry has involved developing assessment instruments for measuring students’ perceptions of their wellbeing behaviors, or, in other words, their subjective wellbeing. If wellbeing is conceptualized as all manner of healthy and successful functioning, then subjective wellbeing is simply an individual’s self-perceptions of such functioning and, as such, can be assessed across various life domains, including engagement, meaning, relationships, and accomplishment (e.g., Renshaw & Bolognino, 2014; Renshaw, Long, & Cook, 2015).
Historically, measure development research targeting subjective wellbeing has proceeded by conceptualizing and testing single-construct scales that assess self-reported global thinking and feeling patterns that are deemed to be inherently desirable (e.g., reports of one’s perceptions of life satisfaction and frequencies of positive emotional experience; Diener, Oishi, & Lucas, 2009). However, as positive psychology has moved into the schools, a line of recent measurement work has focused on developing multidimensional and school-specific assessment instruments, which are likely to be useful for various purposes with multitiered systems of supports (MTSS; see Stoiber, 2014). For example, the Positive Experiences at School Scale (PEASS; Furlong, You, Renshaw, O’Malley, & Rebelez, 2013), which is a self-report instrument for assessing school-specific gratitude, zest, optimism, and persistence among elementary students, might be useful for evaluating the effectiveness of several social and emotional learning interventions that aim to promote these kinds of behaviors among youth in schools (e.g., Collaborative for Academic, Social, and Emotional Learning, 2013). Similarly, the Social and Emotional Health Survey (SEHS; Furlong, You, Renshaw, Smith, & O’Malley, 2014), which is a self-report instrument for assessing four classes of wellbeing behavior among adolescents—belief-in-self, belief-in-others, emotional competence, and engaged living—might be useful as a universal screener for complementing a problem-oriented screener when researchers or practitioners are working within a complete mental health service delivery model (e.g., Dowdy et al., 2015). Likewise, the Student Subjective Wellbeing Questionnaire (SSWQ; Renshaw et al., 2014), which measures secondary students’ perceptions of their academic efficacy (AE), educational purpose (EP), joy of learning (JL), and school connectedness (SC), might be used for functionally similar purposes within MTSS in schools.
Although the PEASS, SEHS, and SSWQ have all been evidenced to be multidimensional, and scores derived from these measures have been shown to be reliable and to have concurrent associations with scores from other measures of students’ subjective wellbeing (Furlong et al., 2013; Furlong, You, et al., 2014; Renshaw et al., 2014), there is currently a lack of replication studies confirming their technical adequacy with other samples. Indeed, to date, there appears to be only one published replication study confirming the technical adequacy of the SEHS (You et al., 2014), while there are no published studies replicating the technical adequacy of the PEASS and SSWQ. Given the author’s specific interest in adolescents’ subjective wellbeing, as well as the necessity of replication in enhancing the trustworthiness of empirical findings and the importance of technical adequacy in selecting measures for use in school psychological research and practice, the purpose of this study was to replicate the technical adequacy of the yet-to-be-replicated SSWQ using a new yet demographically similar sample of adolescents.
The SSWQ was developed to be a brief self-report instrument for assessing four key domains of students’ subjective wellbeing, which were derived from a comprehensive review and qualitative theme analysis of subjective wellbeing constructs that had been previously measured and reported on within the assessment literature: (a) school-specific relationships, (b) educational performance and learning behaviors, (c) affective experiences at or about school, and (d) holistic evaluations of and orientations toward one’s school experience (see Renshaw et al., 2014, for a description of this review process). Given the breadth of each of these wellbeing domains, and the intention of the SSWQ to function as a brief instrument for various school-based assessment purposes, including schoolwide screening, only one representative construct was selected from each domain (from the aforementioned literature review and qualitative theme analysis) to be developed as part of the SSWQ. This conceptual development process resulted in a hypothesized four-factor measurement model for the SSWQ, consisting of SC (representing the relationships domain), AE (representing the performance and learning behaviors domain), JL (representing the affective experience domain), and EP (representing the holistic evaluation and orientation domain). Taken together, these four constructs were considered to provide a balanced representation of youth’s self-perceptions of the many classes of private and public behavior that are relevant to their wellbeing in schools. Findings from the SSWQ’s initial development study provided initial construct validity evidence in favor of this four-factor measurement model (see the “Method” section, below, for more detail). Thus, the present study aimed to replicate these results by re-investigating the SSWQ’s (a) latent factor structure, (b) factor/scale characteristics, (c) multigroup measurement invariance, and (d) potential utility as a classification instrument.
Method
Participants
Participants were 438 adolescents (49.3% female) enrolled in Grades 6 to 7 (49.1% Grade 6) within a Title I, public middle school that was located in a midsized urban city in the southern region of the United States. The majority of participants identified as Black (63%), with the minority identifying as White (26%), Hispanic (5%), Asian or Pacific Islander (3%), and multiple ethnicities (3%). Approximately 76% of students were eligible for free- or reduced-priced lunch and about 9% qualified for special education services.
Measures
SSWQ
The SSWQ is 16-item measure of students’ school-specific subjective wellbeing, which is comprised of four subscales targeting AE (e.g., “I am a successful student”), EP (e.g., “I feel like the things I do at school are important”), JL (e.g., “I feel happy when I am working and learning at school”), and SC (e.g., “I can really be myself at this school”; Renshaw et al., 2014). All SSWQ items are positively phrased and are arranged along a 4-point frequency-based response scale (1 = almost never, 2 = rarely, 3 = sometimes, 4 = almost always). The initial development study of the SSWQ demonstrated that it is characterized by psychometrically sound higher-order factor structure, with four first-order factors functioning as indicators of an underlying second-order factor (i.e., student subjective wellbeing), that each of the factors/scales at both levels had at least adequate internal reliability (H/α ≥ .70), and that all scales were relatively normally distributed. The same study also showed that SSWQ’s measurement model lacked invariance across gender (despite adequate data–model fit), and that the continuous measurement model was strongly associated with self-reported indicators of school prosociality and academic perseverance (β > .80). Moreover, the original study showed that the SSWQ’s simulated classification utility (using SD-derived cut-offs from the measure’s composite score) indicated that students with higher levels of overall subjective wellbeing had better concurrent outcomes across a variety of self-reported risks (e.g., substance use and self-harm) and assets (e.g., social support reception and provision; Renshaw et al., 2014).
Youth’s Risks and Assets Survey (YRAS)
The YRAS is a 10-item survey for screening common risks and assets that are predictive of youths’ educational outcomes (Renshaw et al., 2014). Unlike the SSWQ, each item functions as a stand-alone indicator of a valued domain of youths’ behavior. The risks assessed by the YRAS include (a) aggression reception, (b) aggression perpetration, (c) substance use, (d) self-harm, and (e) languishing affect, while the assets include (f) social support reception, (g) social support provision, (h) physical exercise, (i) enjoyable activity engagement, and (j) thriving affect. All YRAS items are arranged along a 4-point response scale (1 = 0 time/days, 2 = 1 time/day, 3 = 2-4 times/days, 4 = 5 or more times/days) gauging the relative frequency of experiencing risks within the past month (e.g., “In the past month, how many times have you been bullied, picked on, or harassed by another student at school?”) or assets during the last week (e.g., “During the last week, how many days did someone at school do something nice for you or help you when you really needed it?”). Given that the YRAS’ items have been shown to be significantly non-normally distributed, risk factor items are re-coded to represent the presence of the behaviors of interest by transforming original responses into dichotomous variables representing either no endorsement (i.e., 0 times) or some endorsement (i.e., at least 1 time) within the past month, while asset items are re-coded into dichotomous variables representing either rare endorsement (i.e., 0 days or 1 day) or repeated endorsement (i.e., at least 2-4 days) within the last week. For the purposes of the present study, the re-coded items were summed to create composite scores representing youths’ cumulative risks and cumulative assets. In the present sample, students’ mean cumulative risks were relatively normally distributed (g1 = .46, g2 = −.49) and quite low (range = 0-5, M = 1.57, SD = 1.23, Q1 = 1, Q2 = 1, Q3 = 2), while their mean cumulative assets were relatively non-normally distributed (g1 = −1.83, g2 = 3.09) and rather high (range = 0-5, M = 4.24, SD = 1.17, Q1 = 4, Q2 = 5, Q3 = 5).
Self-Reported Academic Achievement (SRAA)
Students’ SRAA was assessed using a single item adapted from the California Healthy Kids Survey (WestEd, 2014): “During the past 12 months, how would you describe the grades you received in school?” This item was arranged along a 9-point grade-range response scale, with lower responses indicating higher academic achievement (1 = mostly As, 2 = mostly As and Bs, 3 = mostly Bs, 4 = mostly Bs and Cs, 5 = mostly Cs, 6 = mostly Cs and Ds, 7 = mostly Ds, 8 = mostly Ds and Fs, 9 = mostly Fs). Previous research using this item has conceptualized SRAA as a proxy for students’ grade point average (GPA), operationalizing a response of “1” as analogous to a 4.0 GPA, “2” as analogous to a 3.5 GPA, “3” as analogous to a 3.0 GPA, and so on (e.g., O’Malley, Voight, Renshaw, & Eklund, 2014). In the present sample, participants’ SRAA was relatively normally distributed (g1 = .35, g2 = −.66), with a mean of 3.70 (SD = 1.62, Q1 = 2, Q2 = 4, Q3 = 4.75), suggesting approximately a 2.5 GPA or “Bs and Cs” average. Previous research has shown that adolescents’ SRAA is strongly correlated with their school-reported achievement, and that self-reports are more likely to underestimate actual achievement than to overestimate it (Shaw & Mattern, 2009).
Survey Administration and Processing
The SSWQ, YRAS, and SRAA were combined into a single paper-and-pencil survey, which was administered by teachers in homeroom classes. All items on the survey were organized according to the original measures, in the order described above, as item stems and response options varied across scales. Prior to beginning the study, all measures, data collection procedures, and consent methods were approved by both the author’s Institutional Review Board and the school district’s Accountability and Assessment Department. Following survey administration and collection, the author screened the data for plausible response patterns and processed all useable surveys into a secure electronic database.
Data Analyses
Several phases of data analyses were conducted to replicate the technical adequacy of the SSWQ with the present sample. First, confirmatory factor analyses (CFA) were conducted to investigate the measure’s higher-order latent structure. To determine the goodness of data–model fit, a combination of absolute and incremental fit indices were used. Comparative fit index (CFI) values between .90 and .95 and root mean square error of approximation (RMSEA) values (with an accompanying 90% confidence interval) between .05 and .08 were considered to indicate adequate data–model fit, while CFI values > .95 and RMSEA values < .05 were considered indicative of good data–model fit (Kenny, 2014). Regarding factor loadings, λ ≥ .50 were taken to be strong loadings, as they accounted for ≥ 25% of the variance extracted from each item by the latent factor. And for latent construct reliability, H ≥ .70 were considered desirable, as they estimate a strong intra-factor correlation over repeated administrations (Mueller & Hancock, 2008).
In addition to the normal CFA, measurement invariance of the SSWQ was conducted using multiple CFA that tested for configural invariance (i.e., equality of the latent factor structure across groups), metric invariance (i.e., equality of the factor loadings across groups), and scalar invariance (i.e., equality of intercepts across groups) for both gender (male vs. female) and grade level (Grade 6 vs. Grade 7). To determine data–model fit at each level of invariance, the same fit indices (CFI and RMSEA) were evaluated using the same decision rules; however, to determine invariance across models, ΔCFI from model-to-model was used. Although Vandenberg and Lance (2002) recommended that ΔCFI ≤ .01 is indicative of invariance and researchers have used this critical value to evaluate the invariance of similar self-report instruments (e.g., You et al., 2014), results from Monte Carlo studies indicate that a much more conservative critical value of ΔCFI ≤ .002 is more effective for determining lack of invariance (Meade, Johnson, & Braddy, 2008). Therefore, to be deemed fully invariant across either or both demographic factors, data–model fit needed to be deemed adequate or good at the (a) configural, (b) first-order metric, (c) first-order metric and scalar, and (d) full metric and first-order scalar levels, and the ΔCFI from model-to-model needed to be ≤ .002. If measurement invariance was obtained, then latent means analyses were set to be conducted across all first-order and second-order factors, for both gender and grade demographics. Differences among latent factors were identified using both statistical significance (p < .05) and estimated standardized mean differences (ESMD), which can be interpreted as an effect size similar to Cohen’s d (i.e., ≤.19 = negligible, .20 ≤ .49 = small, .50 ≤.79 = medium, ≥.80 = large).
In addition, latent factor/observed scale characteristics were examined, using internal reliability, distribution, and other descriptive analyses and their accompanying (and common) decision rules (e.g., α ≥ .70 = adequate; g1 and g2 < |2| = relatively normal distribution). Next, the potential classification utility of the SSWQ, using SD-derived groups based on composite scores (z-score < −1 SD = below average, −1 SD < z-score < 0 SD = low average, 0 SD < composite z-score < 1 SD = high average, z-score > 1 SD = above average), was investigated with analyses of variance (ANOVA) and post hoc t-test comparisons that used the grouping variable as the fixed-factor and self-reported cumulative risks, cumulative assets, and SRAA as the criterion variables. All analyses were conducted using SPSS and AMOS version 21.
Response frequency analyses of the SSWQ items indicated missing data ranges of 0.2% to 1.6% for SSWQ items and 0.5% to 1.4% for YRAS items. In addition, 11.4% of the SRAA data were shown to be missing. Considering that the structure of the study did not involve opportunities for participant attrition, and that data processing and entry were systematically verified, all missing data were deemed to be the result of participants’ non-responses to survey items. Given the large sample size in the present study, the percentages of missing data were considered to be workable, as preliminary analyses indicated that all intended primary analyses should have adequate statistical power to detect effects (e.g., Schlomer, Bauman, & Card, 2010). The pattern of missing data were explored by computing a dummy variable that represented missingness (0 = missing value, 1 = present value) for each of the SSWQ, YRAS, and SRAA items, and then analyzing the patterns of correlations among all of these dummy variables. Findings from these analyses indicated a pattern of negligible effect sizes (r < |0.1|) among dummy variables, suggesting that missing data were most likely missing completely at random. Thus, to handle missing data, the listwise deletion method was used for all analyses conducted using SPSS, while the full informational maximum likelihood method was used for all analyses conducted with AMOS (e.g., Schlomer et al., 2010).
Results
Latent Factor Structure
Preliminary analyses indicated that all SSWQ items were significantly non-normally distributed (K2 range = 10.36-455.61, p < .03) and that, taken together, all items were characterized by significant multivariate non-normality (χ2 = 1,091.90, df = 32, p < .001). Yet skewness and kurtosis statistics for each item indicated only mild to moderate departures from normality (g1 and g2 < |1.5|), suggesting that items could be considered relatively normally distributed for factor-analytic purposes. Findings from the first CFA, which investigated a fully correlated first-order model of the four student subjective wellbeing factors (i.e., AE, EP, JL, and SC), indicated a good data–model fit (χ2 = 161.43, df = 98, p < .001, CFI = .972, RMSEA [90% CI] = .038 [.028, .049]). Thus, a second-order model was tested, positioning the first-order factors as indicators of one second-order factor (i.e., overall student subjective wellbeing), which also yielded a comparably good data–model fit (χ2 = 169.27, df = 100, p < .001, CFI = .969, RMSEA [90% CI] = .040 [.029, .050]). Given the conceptual framework and theory underlying the development of the SSWQ (Renshaw et al., 2014; see the Introduction), this higher-order model was selected as the preferred measurement model (see Figure 1), just as it was in the original development study.

Preferred measurement model for the SSWQ.
Measurement Invariance and Latent Means
Results from the multigroup invariance analyses indicated that adequate to good data–model fit was obtained at the (a) configural, (b) first-order metric, (c) first-order metric and scalar, and (d) full metric and first-order scalar levels, across both gender and grade demographics (see Table 1). Evaluation of the ΔCFI from model-to-model across gender indicated values close to or less than the critical value, and thus latent means analyses were subsequently conducted. However, evaluation of the ΔCFI from model-to-model across grade level indicated that the change in fit dropped by .01 when intercepts were constrained (see Table 1), suggesting differential item functioning across Grades 6 and 7. That said, considering that this ΔCFI was within the boundaries of the ≤.01 critical value for invariance recommended by Vandenberg and Lance (2002) and used by others for evaluating similar self-report instruments (e.g., You et al., 2014), latent means analyses were also subsequently conducted, with awareness that the findings should be considered more exploratory. Results from the latent means analyses across gender indicated that female students reported greater AE, characterized by a small effect size, than male students, but that there were no other notable differences across other first-order or second-order factors between genders (see Table 2). For grade level, findings from the latent means analyses indicated that seventh-graders reported significantly lower subjective wellbeing, characterized by negligible effect sizes, across the JL, EP, and overall Student Subjective Wellbeing factors, and that no other notable differences were observed for the other first-order factors.
Measurement Invariance of the SSWQ Across Gender and Grade Levels.

Note. All χ2 values were significant at the p < .001 level. RMSEA = root mean square error approximation; CFI = comparative fit index.
Latent Means Analyses of the SSWQ.
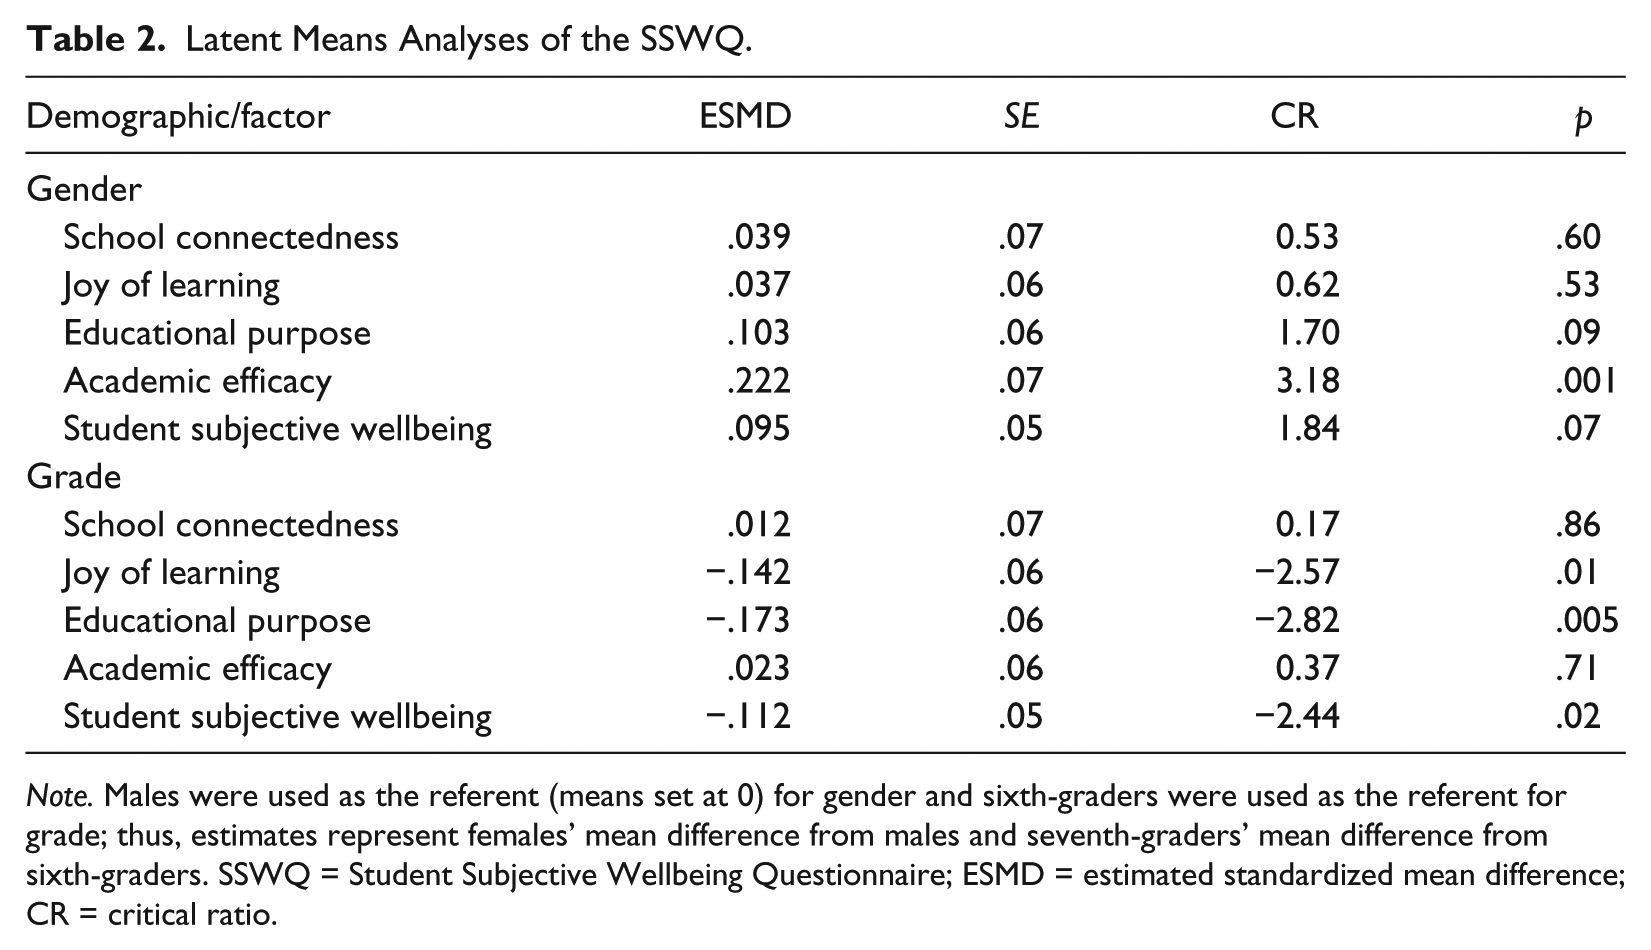
Note. Males were used as the referent (means set at 0) for gender and sixth-graders were used as the referent for grade; thus, estimates represent females’ mean difference from males and seventh-graders’ mean difference from sixth-graders. SSWQ = Student Subjective Wellbeing Questionnaire; ESMD = estimated standardized mean difference; CR = critical ratio.
Factor/Scale Characteristics
Additional CFA findings for the SSWQ indicated that all factors had substantive item loadings (λ > .50) and at least adequate construct reliability, with the AE and second-order Student Subjective Wellbeing factors both having strong reliability (see Figure 1). In addition, inter-factor correlations yielded moderate to large associations between the latent factors (ϕJL–AE = .57, ϕJL–EP = .79, ϕJL–SC = .48, ϕSC–AE = .35, ϕSC–EP = .49, ϕEP–AE = .57), whereas inter-item correlations for each of the factors also ranged from moderate to large (AE = .58-.63, EP = .35-.44, SC = .36-.45, JL = .38-.52). Characteristics of the observed scales (as opposed to the latent factors) were also analyzed to provide another layer of scale characteristics. Findings from these analyses indicated similar magnitudes of inter-item correlations (r range = .30-.60) and acceptable levels of internal reliability (α > .70). And although omnibus normality tests indicated significantly non-normal distribution for all SSWQ scales, evaluations of skewness and kurtosis statistics suggested that such departures from normality were mild-to-moderate and, therefore, that the measure could be considered relatively normally distributed (see Table 3).
Descriptive Statistics of the Student Subjective Wellbeing Questionnaire.

Note. Min, Max = minimum and maximum observed scale scores; IQR = inter-quartile range; g1 = skewness; g2 = kurtosis; K2 = omnibus normality; r = average inter-item correlation; SCS = School Connectedness Scale; JLS = Joy of Learning Scale; EPS = Educational Purpose Scale; AES = Academic Efficacy Scale; SSWCS = Student Subjective Wellbeing Composite Scale.
p < .05. **p < .01. ***p < .001.
Classification Utility
The potential classification utility of the SSWQ, consisting of four SD-derived groups (i.e., below average, low average, high average, above average) representing students’ overall subjective wellbeing level (SSWL), was investigated via three univariate analyses of variance using SSWL as the grouping variable and SRAA, cumulative risks, and cumulative risks, respectively, as the criterion variables. Findings from Levene’s Test of Homogeneity of Variance indicated significant F-values (p < .05) for academic achievement and cumulative risks, but not for cumulative assets, and so Welch’s adjusted F-values were used in the subsequent ANOVA for the two former criterion variables, but not for the latter. Overall, ANOVA findings indicated significant main effects for SSWL across academic achievement (Fadj. = 19.34, df = 3, 137.71, p < .001, η2 = .12), cumulative risks (Fadj. = 13.38, df = 3, 148.40, p < .001, η2 = .08), and cumulative assets (F = 15.92, df = 3, 372, p < .001, η2 = .11), indicating that SSWL was substantively related, via medium effect sizes, to valued student outcomes. Post hoc comparisons were therefore conducted, with results showing large effect sizes (Hedge’s g ≥ .80) between below average–above average and low average–above average SSWL groups across Academic Achievement, Cumulative Risks, and Cumulative Assets, with a variety of medium and small effects resulting across outcomes from the various other comparisons between SSWL groups (see Table 4).
Post Hoc Comparisons by Student Subjective Wellbeing Level.
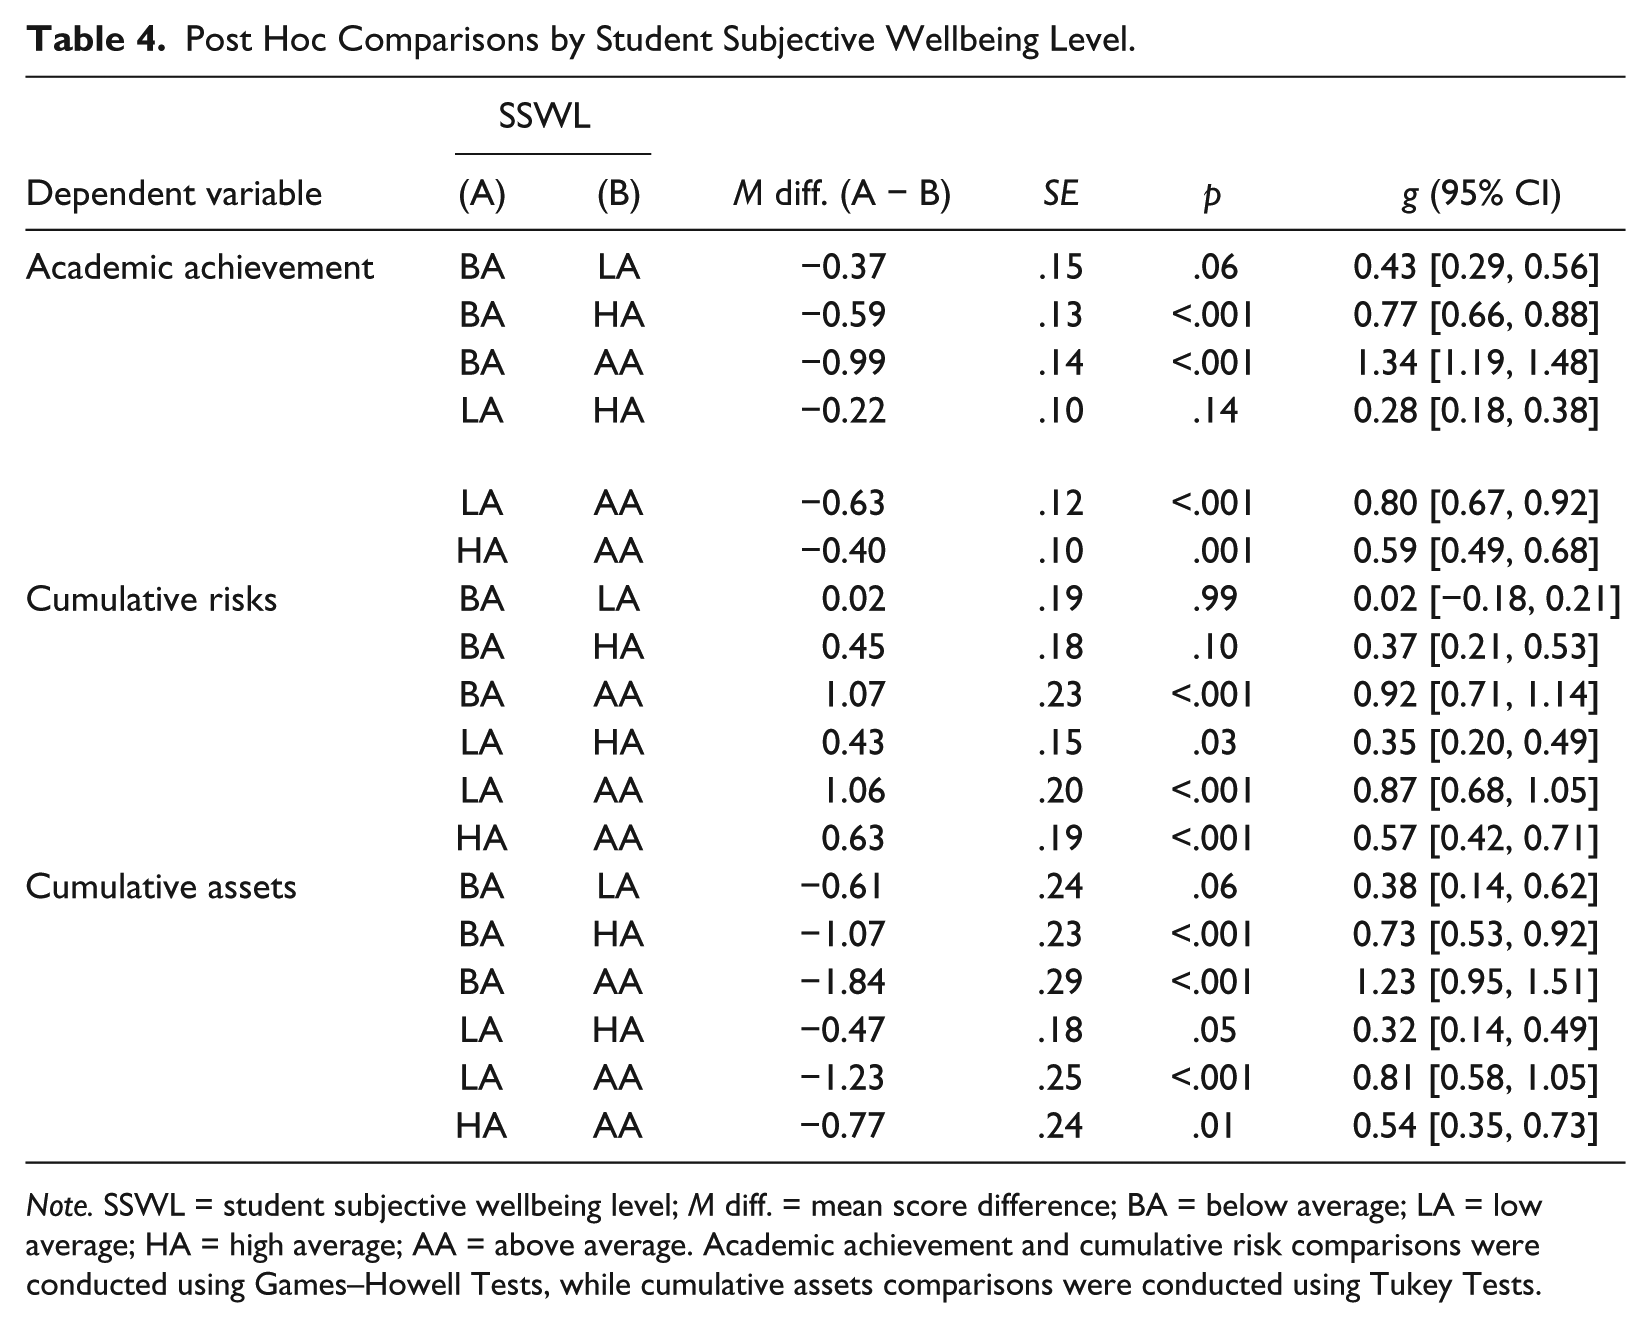
Note. SSWL = student subjective wellbeing level; M diff. = mean score difference; BA = below average; LA = low average; HA = high average; AA = above average. Academic achievement and cumulative risk comparisons were conducted using Games–Howell Tests, while cumulative assets comparisons were conducted using Tukey Tests.
Discussion
Considering the importance of replication in psychological science and given that, to date, only one study has been published reporting on the technical adequacy of the SSWQ (Renshaw et al., 2014), the purpose of the present study was to re-investigate the psychometric properties of this measure with a new sample of demographically similar middle school students. Similar to the original development study, findings from the present study strongly supported the hypothesized measurement model of the SSWQ, showing that the higher-order model, which was characterized by four first-order factors (i.e., AE, EP, JL, and SC) positioned as indicators of one second-order factor (i.e., overall student subjective wellbeing), had a good data–model fit, robust factor loadings, and adequate construct reliability (see Figure 1). Multigroup CFA across gender (male vs. female) yielded full measurement invariance (see Table 1), suggesting that the SSWQ’s latent structure is equitable for this demographic variable. However, findings further suggested that measurement invariance is questionable across grade level (see Table 1). Given that the original development study only investigated and demonstrated measurement invariance across gender (Renshaw et al., 2014), these results both replicate and extend the stability of SSWQ’s latent structure for adolescents, suggesting that although it appears stable across gender, more research is needed to investigate potential lack of invariance across grade level. Furthermore, results from the analyses of the observed subscales and composite scale indicated relatively normal distributions and at least adequate internal consistency (see Table 3). Taken together, then, these findings regarding the latent structure of the measure provide a positive, robust replication of the higher-order latent structure of the SSWQ, suggesting that the instrument is generally psychometrically sound for use as a basic and applied research tool. That said, it is noteworthy that, to date, the SSWQ’s latent structure is limited in generalizability to youth in middle school who are predominantly Black/African American and living in the Southern region of the United States, as both the present study and the original development study were conducted with students from highly similar demographic backgrounds. Thus, future research is warranted to replicate the latent structure of the SSWQ with more diverse samples of youth from different regions, in different grade levels (i.e., < Grades 6-8 <), and having different racial/ethnic backgrounds.
Findings from the present study also indicate that the SSWQ’s simulated classification utility yielded concurrent associations with academic achievement, cumulative risks, and cumulative assets indicators. In general, trends indicated that, compared with youth classified as having lower SSWL (i.e., “below average” or “low average”), those with higher SSWL (i.e., “high average” or “above average”) self-reported greater academic achievement, fewer cumulative risks, and more cumulative assets (see Table 4). Considering the findings regarding the significant relation of SSWL with various self-reported risks and assets (Renshaw et al., 2014), the current study provides a positive replication of these results as well as extends these findings—showing that SSWL is also substantively related to youths’ academic achievement. Despite the encouraging nature of these findings, it is noteworthy that associations of SSWQ scores with other socially important variables are, as of now, limited to other scores derived from self-report measures only, which suggests the possibility of common-method bias (i.e., when a substantial amount of variance is attributable to the measurement method rather than to the constructs represented by the measures; Podsakoff, MacKenzie, Lee, & Podsakoff, 2003). To remedy this potential bias, future research is warranted to investigate the relationships among SSWQ scores and findings from other kinds of assessment instruments and techniques, including informant-reported and performance-based measures as well as direct behavioral observations.
Furthermore, it is noteworthy that the findings from the latent means analyses for gender generally replicated those from the SSWQ’s original development study (Renshaw et al., 2014)—yielding negligible effect sizes across all first-order and second-order factors (see Table 2). However, although the majority of results from the latent means analyses across grade level also yielded negligible findings, females were shown to report substantively greater AE, characterized by a small effect size (ESMD = .22). So, although the various constructs used to operationalize student subjective wellbeing show little variation across demographics, future research is warranted to replicate these findings across grade level and to explore potential differences more thoroughly across other demographic factors, such as racial/ethnic identity, disability status, and school contexts (i.e., rural vs. suburban vs. urban settings), which have heretofore been unexplored and which will require much larger samples to adequately investigate measurement invariance. Finally, it is also noteworthy that many SSWQ items indicated significantly non-normal skewness and kurtosis values, and that multivariate non-normality was observed across all subscales (see Table 3). Thus, the use of a linear estimator in the present study should be considered a limitation, and future research would do well to explore the use of a non-linear estimator when investigating the SSWQ.
The upshot of the results from the present study is that the SSWQ appears to be technically adequate measure for assessing adolescent students’ subjective wellbeing. That said, prior to recommending the SSWQ for broad use in school psychological research, much more basic inquiry is warranted, as mentioned above. Furthermore, issues related to construct validity might be further investigated by exploring the association between SSWQ scores and scores derived from other multidimensional subjective wellbeing measures (e.g., the PEASS and SEHS) as well as other single-scale measures assessing similar constructs (i.e., SC, JL, AE, and EP) as well as by exploring its longitudinal stability and predictive utility with key academic indicators (e.g., school attendance, report card grades, standardized tests scores, and school dropout). Finally, prior to recommending the SSWQ for various purposes within MTSS in schools (as described in the “Introduction” section, above), applied research is needed to investigate issues related to feasibility, incremental validity, and especially treatment utility (see Hayes, Nelson, & Jarrett, 1987) within school psychological practice. Suffice it to say, then, that although the empirical status of the SSWQ is promising, the measure should still be considered under development, as much contextual work remains.
Footnotes
Declaration of Conflicting Interests
The author(s) declared no potential conflicts of interest with respect to the research, authorship, and/or publication of this article.
Funding
The author(s) received no financial support for the research, authorship, and/or publication of this article.