
Abstract
This study examined the relationship between the American College Testing (ACT) college mathematics readiness standard and college mathematics achievement using a sample of students who met or exceeded the minimum 3 years high school mathematics coursework recommended by ACT. According to ACT, a student who scores 22 or higher on the ACT mathematics test has a relatively high probability of earning a passing grade in his or her first college mathematics course. Data from 11,324 students who attended 1 of 27 four-year postsecondary institutions in the upper Midwest were used to study this relationship. Overall, there was evidence that meeting the mathematics readiness standard was related to college mathematics achievement for students who completed at least 3 years of high school mathematics. The results have important implications for school district staff advising college-intending students on mathematics course-taking, college admissions staff evaluating student readiness for college-level mathematics, and researchers studying college readiness.
Keywords
Readiness for college mathematics has drawn a great deal of attention from educators, policy makers, and researchers. College readiness in mathematics was defined by Conley (2008) as the probability a student will succeed in college-level mathematics courses, and by McCormick and Lucas (2011) as the accumulation of knowledge in mathematics that students are required to have to pass their courses in college. The most widely used indicator of college readiness in mathematics appears to be test scores from large-scale mathematics assessments (Conley, 2008; Roderick, Nagaoka, & Coca, 2009; Wiley, Wyatt, & Camara, 2010).
One of the better known efforts around college readiness is the standards developed by the American College Testing (ACT) program to predict a student’s readiness to succeed in college coursework. Specifically, the standards represent “ . . . detailed, research-based descriptions of the skills and knowledge associated with what students are likely to know and to be able to do based on their EXPLORE, PLAN, and/or ACT test scores” (ACT, 2011, p. 2). The EXPLORE and PLAN tests are ACT products used to assess the academic development of 8th/9th-grade and 10th-grade students. The ACT test serves as an admissions test for college-intending students and is typically taken at the end of a student’s junior year in high school or early in their senior year. According to ACT, students taking the mathematics portion of the test should ideally have completed at least 3 years (Carnegie units) of core high school mathematics courses consisting of Algebra I, Algebra II, and Geometry because this coursework represents the minimum knowledge and skills needed in this portion of the ACT test (ACT, 2006, 2011).
The ACT College Readiness Standard in Mathematics
Studies of the relationship between ACT scores and college performance began in 1997 and led to the mathematics standard in a 2005 benchmarking study (ACT, 2005) based on a sample of 85 2- and 4-year colleges obtained between 1995 and 2003. Multilevel (students nested within college) logistic regression models with the predictor ACT mathematics score were fitted to student grades for a College Algebra course at each college after grades were dichotomized as a “success” (students earned a grade of at least a B or at least a C) or a “failure” (grade earned was less than a B or a C). The rationale for treating a grade of B or higher as representing “success” in a college mathematics course in the ACT (2005) benchmarking study was largely based on grade inflation, with the authors of that study noting that “Today, it’s common for more than 50% of students in a course to earn grades of A or B” (p. 9).
The ACT (2005) benchmarking study used the mathematics score associated with a probability of success of .50 for the fitted model as an institution’s benchmark (i.e., a logistic probability curve was fitted to find the score at which 50% of students earned at least a B in their first college mathematics class), with the median of these scores of 22 emerging as the standard. Thus, on average, 50% of the students whose ACT mathematics score was ≥22 earned a B or higher in College Algebra, and on average, 75% of the students scoring ≥22 earned a grade of C or higher. The results from the 2005 study led ACT to characterize students with ACT mathematics scores ≥22 as having met the college readiness standard. In 2011, approximately 55% of the 1.5 million U.S. students who took the ACT failed to meet the standard in mathematics (ACT, 2011). The benchmarks were updated in 2013 (ACT, 2013b), with an ACT mathematics score of 22 again emerging as the mathematics standard.
Precisely how the ACT mathematics standard is used by colleges, high schools, and students and their families in educational planning and decision making has not been rigorously documented. Evidence of the role of test scores in college admission decisions (Clinedinst, Hurley, & Hawkins, 2011) suggests the readiness standards are important, although it is equally important to emphasize that ACT has consistently recommended these standards be combined with other information to support educational planning and decision making (ACT, 2005, 2011, 2013b). It is also likely that many students who meet or fail to meet the mathematics standard have different experiences in the mathematics course(s) they are advised to take their senior year in high school, whether they should take the ACT test a second time in the hope of raising their mathematics score to at least 22, the college mathematics course they should start with, or other forms of academic support that might be appropriate (ACT, 2013b). However the standard is used, its potential impact on the educational trajectory of college-intending students suggests that an extensive literature supporting its use be available.
Evidence for the ACT Mathematics Standard and College Mathematics Achievement
Recent studies (ACT, 2009, 2012b, 2012c, 2013a) reported that meeting the ACT mathematics standard was positively associated with several college outcomes including earning a grade of B (or C) or higher in mathematics courses taken in the first year of college, continuing to the second year of college at the same institution, achieving a cumulative college grade point average (GPA) of 2.00 or higher, and completing a college degree. An important feature of these studies is the variation in the mathematics preparation of the samples of high school students, which ranged from no high school mathematics through Calculus I (ACT, 2009, 2012c).
Although available evidence indicates that meeting the ACT mathematics standard is generally associated with higher college mathematics achievement, this literature has three important gaps. First, it is unclear how useful the ACT mathematics standard is for students who meet or exceed the minimum 3 years of high school mathematics coursework recommended by ACT (2006, 2011). The ACT mathematics readiness standard does not explicitly take high school mathematics course-taking into account and, as noted above, studies of the standard have sampled students with a wide range of mathematical preparation, rather than students whose mathematics preparation met or exceeded the ACT recommended minimum of 3 years of high school mathematics.
Second, there is a need for studies of the mathematics standard based on data not collected by ACT, which has a vested interest in the standard. Put simply, the potential impact of the ACT college mathematics readiness standard on college-intending students educational trajectory suggests there is a need to provide independent (i.e., non-ACT collected) evidence of the standard’s ability to predict students’ readiness for college mathematics.
Third, the impact of institutional and student characteristics on the relationship between the ACT mathematics standard and college mathematics performance for students who meet or exceed the high school mathematics coursework recommended by ACT is unclear. For example, institutional selectivity based on average Scholastic Assessment Test (SAT) scores of admitted students and whether a postsecondary institution is publicly or privately funded has produced differential predictive validity of the SAT and first-year college GPA (Kobrin & Patterson, 2011). Selectivity based on ACT scores has been shown to be associated with lower percentages of students completing remedial mathematics coursework (Bettinger & Long, 2009), higher graduation rates, greater graduate school access and success, and higher postgraduation earnings (Carnevale & Rose, 2004), and to predict first-year college GPA (Sawyer, 2013). Student characteristics such as gender and race have also been shown to be related to the likelihood a student will meet the ACT mathematics standard (ACT, 2013a). However, the impact of institutional and student characteristics on the relationship between the ACT mathematics standard and college mathematics performance for students who completed 3 or more years of high school mathematics as recommended by ACT is unclear.
Purpose of the Study and Research Questions
The purpose of the study was to examine the relationship between the mathematics standard and college mathematics achievement for students who met or exceeded the minimum high school mathematics coursework recommended by ACT using data not collected by ACT. Evidence that the standard is related to college mathematics performance supports “business as usual” for how the standard is used in conjunction with other information including high school course-taking and grades, and cognitive, non-cognitive, and socio-demographic factors (ACT, 2010; Allen, Robbins, & Sawyer, 2010). Evidence that the standard is not related to college mathematics achievement suggests the standard is less useful for students who have completed 3 or more years of high school mathematics.
Our main research questions were as follows:
Method
Subjects and Setting
The target population consisted of students in 4-year postsecondary institutions in the United States who completed at least 3 years of high school mathematics, whereas the sampled population consisted of students who completed at least 3 years of high school mathematics and graduated from a Minnesota high school. The sample of 11,324 students come from a curriculum study that used archival data sets provided by 27 postsecondary 4-year institutions located in one of five upper Midwest states. These students completed (a) 3, 4, or 5 years of high school mathematics and graduated from a Minnesota high school, (b) eight college semesters, and (c) at least one college mathematics course whose difficulty equaled or exceeded that of College Algebra. Because of missing data on different variables, some analyses were based on 11,311 students.
Variables
We define college mathematics as credit bearing courses whose difficulty equals or exceeds that of College Algebra. Hofacker (2006) noted that College Algebra is the most widely enrolled college mathematics course in the United States and is the course that a student who completed 3 years of high school mathematics would likely start with in his or her college mathematics course-taking.
Seventy-five percent of the institutions used a 12-point grading scale (A, A−, B+, . . . , F), 18.75% used a 7-point grading scale (A, AB, B, BC, C, D, F), and 6.25% used a 5-point grading scale (A, B, C, D, F). Throughout this process, we assumed that similar grades earned in similar courses at different institutions reflected similar proficiency. We converted each student’s grade in their first college mathematics course to a dichotomous achievement variable such that a student was assigned a 1 if this grade equaled or exceeded a B and 0 otherwise. The same strategy was followed to create a dichotomous achievement variable for earning at least a C in this course. The use of dichotomous grade variables (e.g., ≥B, <B) provided a simple proficient/not proficient categorization of student performance that is less likely to be sensitive to between-institution differences in instruction and grading practices than more refined grading scales (e.g., 12-point scale). Study variables are defined in Table 1.
Study Variables.
Note. Y = outcome variable, + = dummy-coded variable. ACT = American College Testing; SAT = Scholastic Assessment Test.
The difficulty of college mathematics courses was captured in a trichotomous variable following Teitlebaum (2003). Mathematics course descriptions at each institution were reviewed and rated independently by three mathematics educators. Initial levels of disagreement among raters never exceeded 1 point on the difficulty scale and were subsequently resolved by discussion among the raters until a consensus was achieved. A trichotomous institutional profile variable was also created in response to evidence that institutional characteristics affect student outcomes (ACT, 2012a; Berger & Milem, 1999; Sawyer, 2013). The institutional profile variable was treated as possessing a nominal scale of measurement, meaning that an institution with a coded value of 1, 2, or 3 was not treated as academically superior or weaker than an institution with a different value but as simply different.
Data Analyses
Two sets of analyses were performed. First, we performed descriptive analyses in which we computed the mean percentage of students who earned at least a B (or at least a C) in their first college mathematics course, and the mean model-predicted probability of earning at least a B (or at least a C) in this course. For the latter, we fitted a multilevel logistic model to data indicating whether a student earned at least a B (or at least a C) with a single predictor indicating whether a student met the ACT mathematics standard. The mean percentage of students in an institution who earned least a B (or at least a C) and the mean model-predicted probability of earning at least a B (or at least a C) in an institution were averaged taking differences in the number of students each institution contributed to the sample into account.
Next, we performed inferential analyses examining the relationship between meeting the mathematics standard and college mathematics achievement that fitted multilevel (students within institutions) logistic regression models with control variables to binary outcome data indicating whether a student earned at least a B or at least a C. The inclusion of the variables gender, difficulty of a student’s first college mathematics course, and race was intended to control for effects that might otherwise distort estimates of the relationship between meeting the standard and student mathematics achievement. The student model was
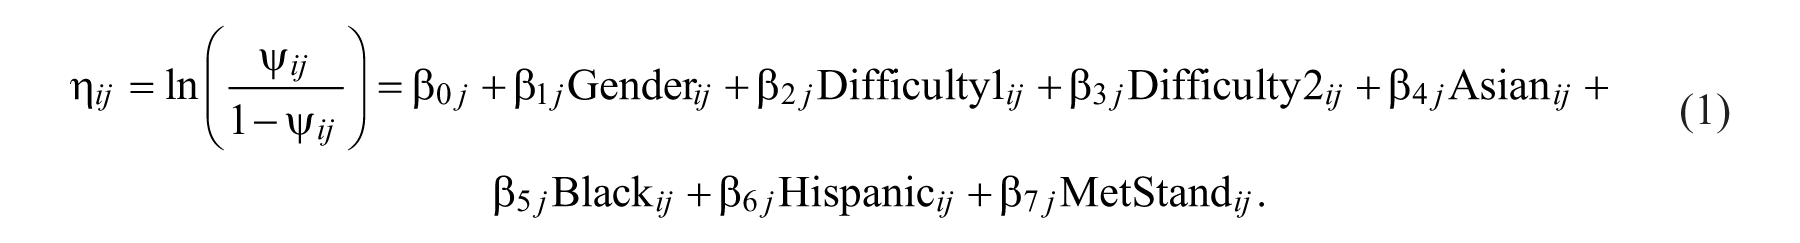
In Equation 1,
Preliminary analyses showed that slope variances for the


In Equation 2,
How, or whether, to center predictors remains a contentious topic in multilevel modeling (Longford, 1993; Paccagnella, 2006). The results for the fixed-effect slopes (e.g.,
Results
The median number of sampled students at an institution was 172, and the mean was 419.4 (SD = 720.1) with a range of 3, 393. The student sample was largely White (88.7%) followed by Asian (7.7%), Black (2.2%), and Hispanic (1.4%) with ACT mathematics means of 24.8 (4.29), 23.4 (4.80), 19.9 (4.53), and 22.8 (4.33), respectively. The overall average ACT mathematics score in our sample was 24.6 (4.4), and there were more females (54.4%) although males had a higher ACT mathematics mean (25.3, SD = 4.55) than female students (24, SD = 4.20). The SD of 4.4 indicates that average variability in ACT mathematics scores about the mean was smaller than the SD = 5.3 reported for all ACT mathematics test-takers in 2009 (U.S. Department of Education, 2010), which is likely attributable to the fact that students in our sample completed 3 or more years of high school mathematics.
Twenty percent of the sampled students completed the ACT recommended minimum mathematics coursework (Algebra I and II, Geometry), 50% completed 4 years (Algebra I and II, Geometry, Trigonometry, or Trigonometry replaced with another advanced mathematics course), and 30% completed 5 years that included Calculus I. In comparison, 14% of a national sample of college-intending students completed the ACT recommended minimum high school mathematics coursework of 3 years (Algebra I and II, Geometry; another 5% took 3 years of mathematics, but not all of these were ACT recommended courses), 24% took 4 years of coursework (Algebra I and II, Geometry, and Trigonometry or Trigonometry replaced with another advanced mathematics course; 35% took 4 years of coursework that did not include all of the ACT recommended courses), and 7% completed 5 years including Calculus I with another 9% completing 5 years but replacing Calculus I with other advanced coursework (ACT, 2012a). Thus, a substantial percentage of our student sample met or exceeded the minimum high school mathematics coursework recommended by ACT compared with a national sample of college-intending students.
Table 2 reports the average percentage of students at an institution who earned at least a B (62%) and at least a C (87%) in their first college mathematics course given that they met the ACT mathematics standard (i.e., all values in Table 2 are based on n = 8,460 students who met the standard). The mean percentage of students at an institution who earned at least a B for the Institutional Profile Categories 1 (≥80% of students enrolled full-time/more selective/low transfer-in rate) and 2 (full-time/selective/high transfer-in rate) were higher (65.1%, 69.3%) than those in Category 3 (mixture of full-time and part-time/selective/high transfer-in rate) institutions (56%). The average percentage of students who earned at least a C in their first college mathematics course for Categories 1 through 3 were 88.4, 89, and 85.3, respectively.
Mean Percentage of Students Who Earned at Least a B or at Least a C in Their First College Mathematics Course Among Those Who Met the ACT Mathematics Standard (i.e., Scored ≥22) by Institutional Profile Category and Difficulty Level.

Note. A total of n = 8,460 students met the ACT mathematics standard, and of these, n = 5,181 earned at least a B and n = 7,323 at least a C in their first college mathematics course. Percentages in the table are weighted by the number of students who met the standard for each school. Cat1 = institution in which ≥80% of students enrolled full-time/more selective/low transfer-in rate (n = 4,465, K = 14 institutions), Cat2 = ≥80% full-time/selective/high transfer-in rate (n = 947, K = 9), Cat3 = mixture of full-time and part-time/selective/high transfer-in rate (n = 3,048, K = 4). Diff1 = courses whose difficulty is consistent with College Algebra (n = 4, 044), Diff2 = courses whose difficulty is consistent with Calculus I (n = 3,246), Diff3 = courses whose difficulty is consistent with Calculus II or beyond (n = 1,170). ACT = American College Testing.
Among students who met the standard, the average percentage at an institution who earned at least a B was highest for courses of Difficulty Level 3 (Calculus II and beyond, 70.2%) and lower for less difficult courses (61%, 62.5%). The average percentage of students earning at least a C in their first college mathematics course followed a similar pattern. The pattern of results for earning at least a B and at least a C was similar for the analyses reported below, and only the former are reported.
We also examined patterns for the n = 2,864 (25.3% of the total sample of N = 11,324) students who did not meet the standard. Among these students, the average percentage at an institution who earned at least a B (not reported in Table 2) was 39.3 (n = 1,033). The average percentages of students who did not meet the standard but earned at least a B for Institutional Profile Categories 1 through 3 were 22.2, 49, and 30.3, respectively; for Difficulty Levels 1 and 2, the averages were 40.1 and 33.5 (there were too few students to compute an average for Difficulty Level 3).
Table 3 reports the average model-predicted probability a student will earn at least a B based on meeting or not meeting the ACT mathematics standard, and by institutional category and course difficulty. These results equal or are generally somewhat higher than the ACT standard of a probability of .50 for earning at least a B. The least selective institutions (Category 3) produced an average probability close to the ACT standard of .50 for earning at least a B (.52), and Difficulty Level 1 courses (e.g., College Algebra) produced an average probability equal to .50.
Mean Predicted Probability That Students Will Earn at Least a B or at Least a C in Their First College Mathematics Course Based on Meeting or not Meeting the ACT Mathematics Standard by Institutional Profile Category and Difficulty Level.
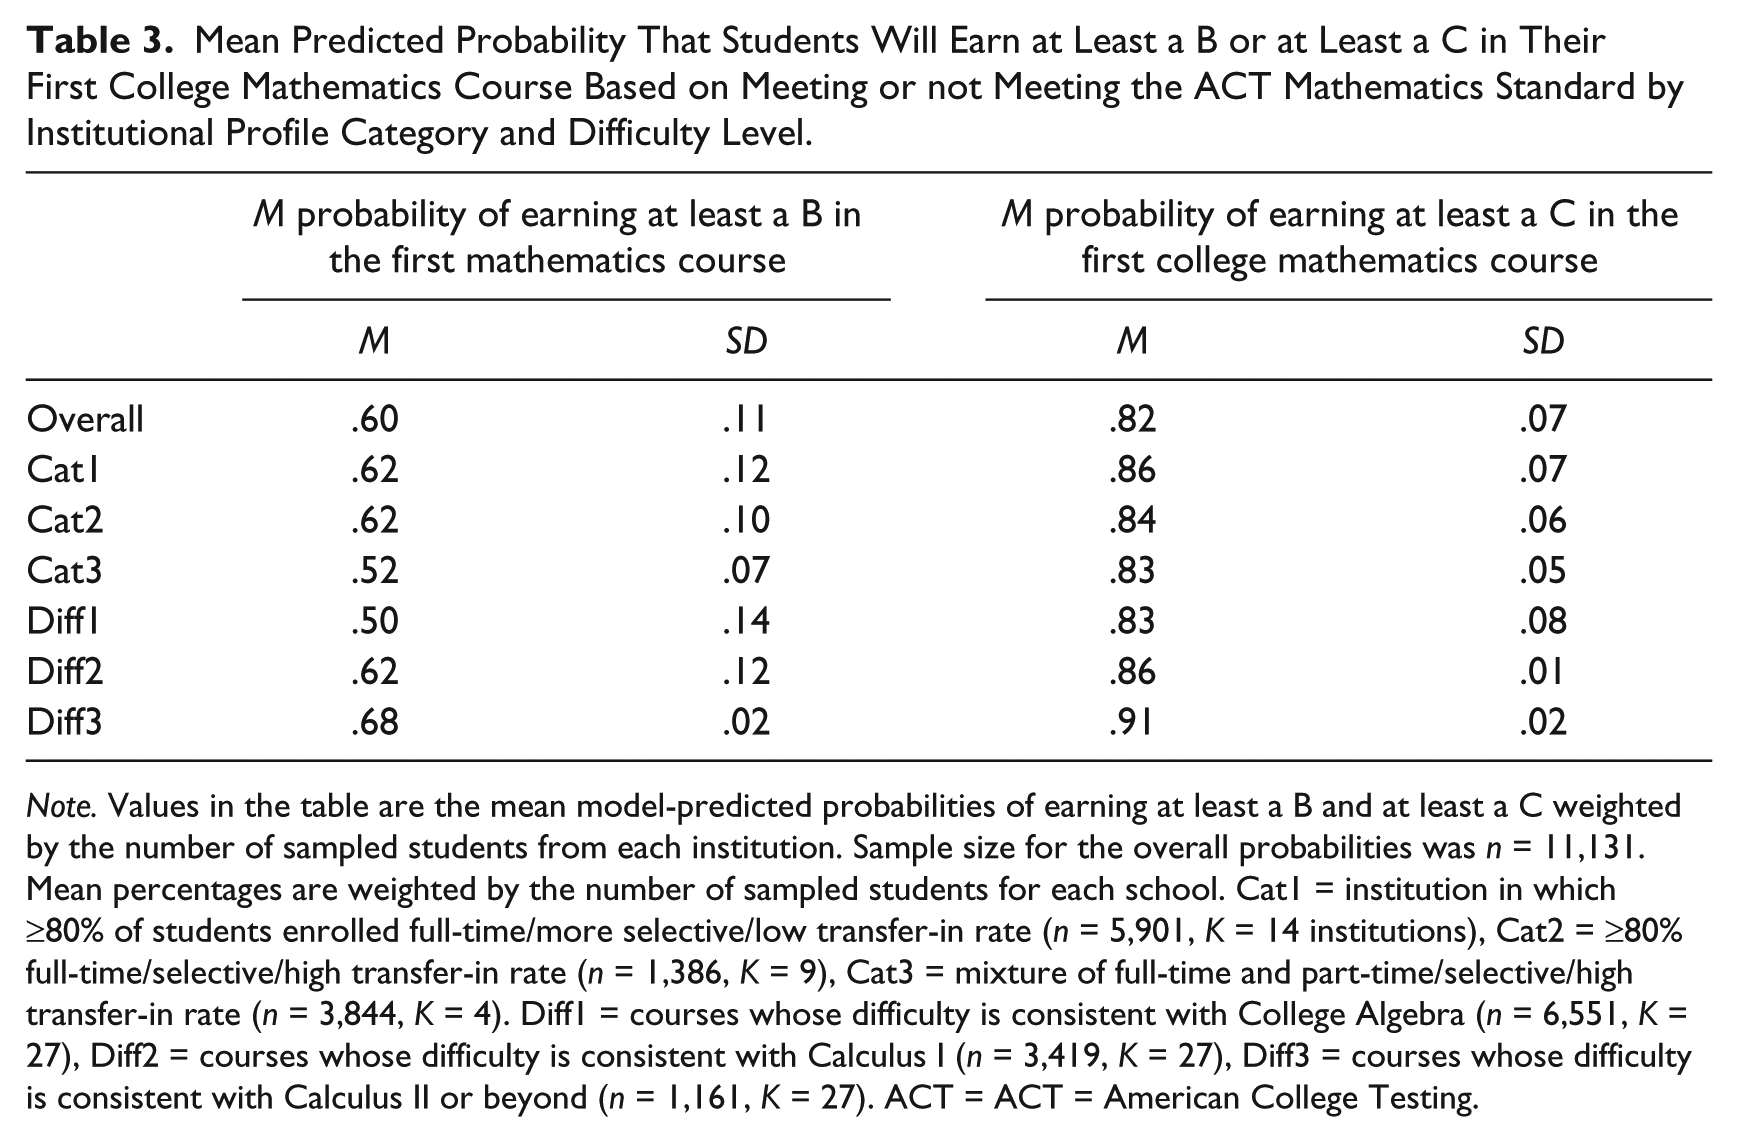
Note. Values in the table are the mean model-predicted probabilities of earning at least a B and at least a C weighted by the number of sampled students from each institution. Sample size for the overall probabilities was n = 11,131. Mean percentages are weighted by the number of sampled students for each school. Cat1 = institution in which ≥80% of students enrolled full-time/more selective/low transfer-in rate (n = 5,901, K = 14 institutions), Cat2 = ≥80% full-time/selective/high transfer-in rate (n = 1,386, K = 9), Cat3 = mixture of full-time and part-time/selective/high transfer-in rate (n = 3,844, K = 4). Diff1 = courses whose difficulty is consistent with College Algebra (n = 6,551, K = 27), Diff2 = courses whose difficulty is consistent with Calculus I (n = 3,419, K = 27), Diff3 = courses whose difficulty is consistent with Calculus II or beyond (n = 1,161, K = 27). ACT = ACT = American College Testing.
Multilevel Results for Earning at Least a B in the First College Mathematics Course
We initially fitted a fully unconditional (no predictors) model and found significant differences among institutions in the average log odds of a student earning at least a B relative to earning less than a B. Next, we fitted a student model with a single predictor indicating whether a student met the standard (institution model was unconditional). Students who met the standard were 2.83 times more likely to earn at least a B in their first college mathematics course compared with students who did not meet the standard.
We then fitted the models in Equations 1 and 2, and report the results in Table 4. The significant fixed effect for whether a student met the ACT mathematics standard
Multilevel Results for Students Earning at Least a B in Their First College Mathematics Course.
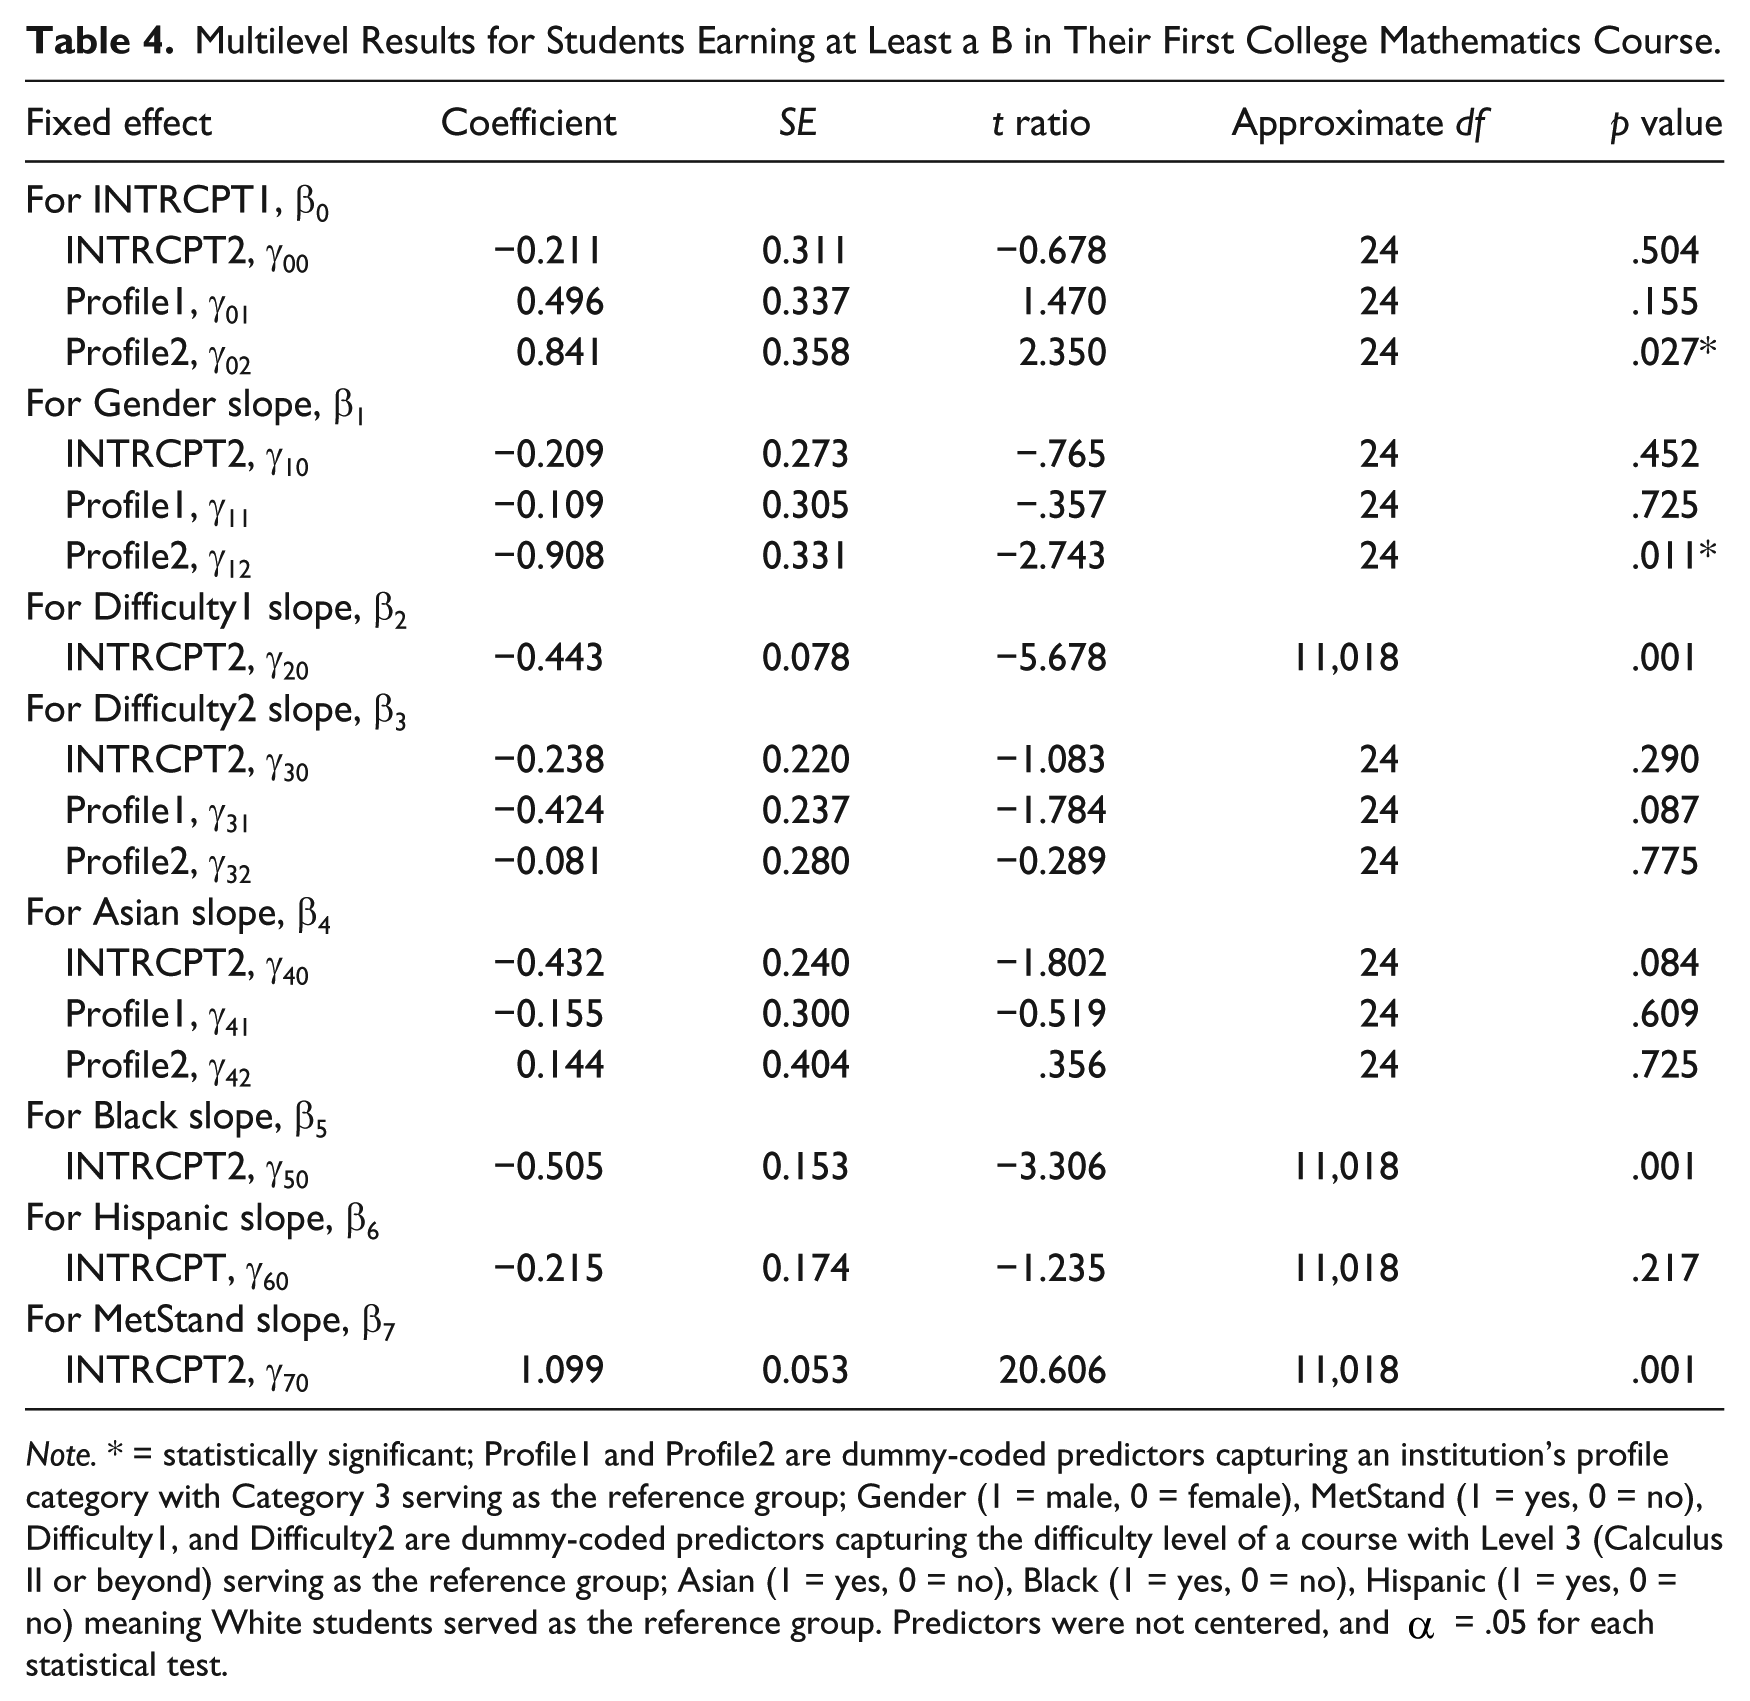
Note. * = statistically significant; Profile1 and Profile2 are dummy-coded predictors capturing an institution’s profile category with Category 3 serving as the reference group; Gender (1 = male, 0 = female), MetStand (1 = yes, 0 = no), Difficulty1, and Difficulty2 are dummy-coded predictors capturing the difficulty level of a course with Level 3 (Calculus II or beyond) serving as the reference group; Asian (1 = yes, 0 = no), Black (1 = yes, 0 = no), Hispanic (1 = yes, 0 = no) meaning White students served as the reference group. Predictors were not centered, and
The significant exponentiated effect for the predictor capturing whether a student was Black or White
Two statistically significant institutional effects appeared both linked to the Profile2 predictor. The significant
As an ancillary analysis, we formally examined whether the mathematics standard was more or less predictive of college mathematics achievement for students who completed 3, 4, or 5 years of high school mathematics by adding this variable as a student-level predictor for model in Equation 1. The multilevel results indicated that the findings reported in Table 4 did not change in any important way.
Discussion
This study examined the relationship between the ACT college readiness mathematics standard and college mathematics achievement using a large extant data set of students who completed 3, 4, or 5 years of high school mathematics and subsequently attended 1 of 27 four-year postsecondary institutions. Our findings help to fill an important gap in the college readiness literature by using data not collected by ACT to examine the relationship between the mathematics standard and college mathematics achievement for students who met or exceeded the minimum high school mathematics coursework recommended by ACT, and the impact of institutional and student characteristics on this relationship.
Our findings are generally consistent with previous work involving the mathematics standard in which the high school mathematics preparation of samples of students varied from no mathematics to 5 years of coursework (Calculus I; ACT, 2005, 2012b, 2012c, 2013b).
Students in our sample who met the standard were 3 times more likely to earn at least a B in their first college mathematics course compared with those not meeting the standard, and slightly more than 2½ times more likely to earn at least a C. The probability a student will earn at least a B or at least a C in his or her first college mathematics course was generally somewhat higher in our data than the ACT standards of .50 and .75, most likely because of our requirement that sampled students had completed at least 3 years of high school mathematics. In conjunction with previous studies of the relationship between the ACT mathematics standard and college mathematics performance, our results suggests that the standard is a useful predictor of success in the first college mathematic class for students with a range of high school mathematics preparation.
We also found a difference in the likelihood of earning at least a B (or at least a C) among Black and White students, which is consistent with evidence of an achievement gap in college mathematics achievement (ACT, 2013a; Mattern, Patterson, & Kobrin, 2012). These results reinforce the need for continued research to identify strategies to eliminate such differences. However, we found no evidence of overall gender differences, which have sometimes appeared for college mathematics achievement (ACT, 2013a).
Our finding of differences in the probability of earning at least a B (or at least a C) among institutions with different characteristics is consistent with literature showing the impact of these factors on student outcomes (e.g., Kobrin & Patterson, 2011; Sawyer, 2013). Given differences in institutional selectivity, it was not surprising to find that the average log odds of earning at least a B (or at least a C) in a student’s first college mathematics course was higher in more selective (Category 2) institutions compared with less selective (Category 3) institutions. The presence of a cross-level interaction in which the relationship between gender and the likelihood of earning at least a B (or at least a C) in a student’s first college mathematics course was moderated by institutional selectivity is also consistent with a modest literature in which these effects appear intermittently for several student outcomes (ACT, 2013a; Peters, 2013). However, the mechanism responsible for this pattern is unclear.
Implications
The consistency between our findings and those of previous studies of the impact of the ACT mathematics standard on student performance in their first college mathematics course has at least three important implications. First, the relative homogeneity of the mathematics preparation of our sample, as reflected in 80% of the students completing 4 or 5 years of high school mathematics coursework, suggests that the usefulness of the ACT mathematics standard as a predictor of a student’s performance in their first college mathematics class generalizes even when students have a narrow range of high school mathematics preparation.
Second, our results have implications for advising college-intending high school students and newly admitted college students. For example, our results, in conjunction with previous studies, suggest that students with a range of high school mathematics preparation who do not meet the ACT mathematics standard are less likely to earn at least a B in their first college mathematics course compared with meeting the standard. This can inform a decision to advise college-intending students of the importance of continuing to improve their mathematics skills and to take the ACT a second time to learn whether these skills have improved sufficiently to obtain a score of at least 22.
Finally, our results and those of previous studies can inform recommendations about the mathematics course newly admitted college student with a range of high school mathematics preparation should begin with: Meeting the mathematics standard suggests a student has a good chance of passing College Algebra. As emphasized by ACT, however, the use of the mathematics standard should be one of several sources of information related to educational planning and decision making.
Limitations
One limitation of our study is that all of the students completed high school in one U.S. state (Minnesota) in which the mathematical achievement of students is on average higher than students in most U.S. states. Minnesota is one of the five highest performing states in mathematics as reflected in the percentage of college-intending students meeting the ACT mathematics standard and average ACT mathematics score (ACT, 2014). Relatedly, all 27 postsecondary institutions were located in one region of the United States meaning that our findings do not necessarily generalize elsewhere.
Another limitation is the potential impact of variation in the quality of teaching within and between institutions and institutional assessment practices (Wayne & Youngs, 2003). Unfortunately, we had no data capturing these factors. Our use of difficulty levels to categorize college mathematics courses and dichotomizing college mathematics grades may help to reduce the impact of such differences, but this remains a limitation.
Footnotes
Declaration of Conflicting Interests
The author(s) declared no potential conflicts of interest with respect to the research, authorship, and/or publication of this article.
Funding
The author(s) received no financial support for the research, authorship, and/or publication of this article.